
Clavulanic Acid Improves Memory Dysfunction and Anxiety Behaviors through Upregulating Glutamatergic Transporters in the Nucleus Accumbens of Mice Repeatedly Exposed to Khat Extract

 , ,
, , 
 and
and 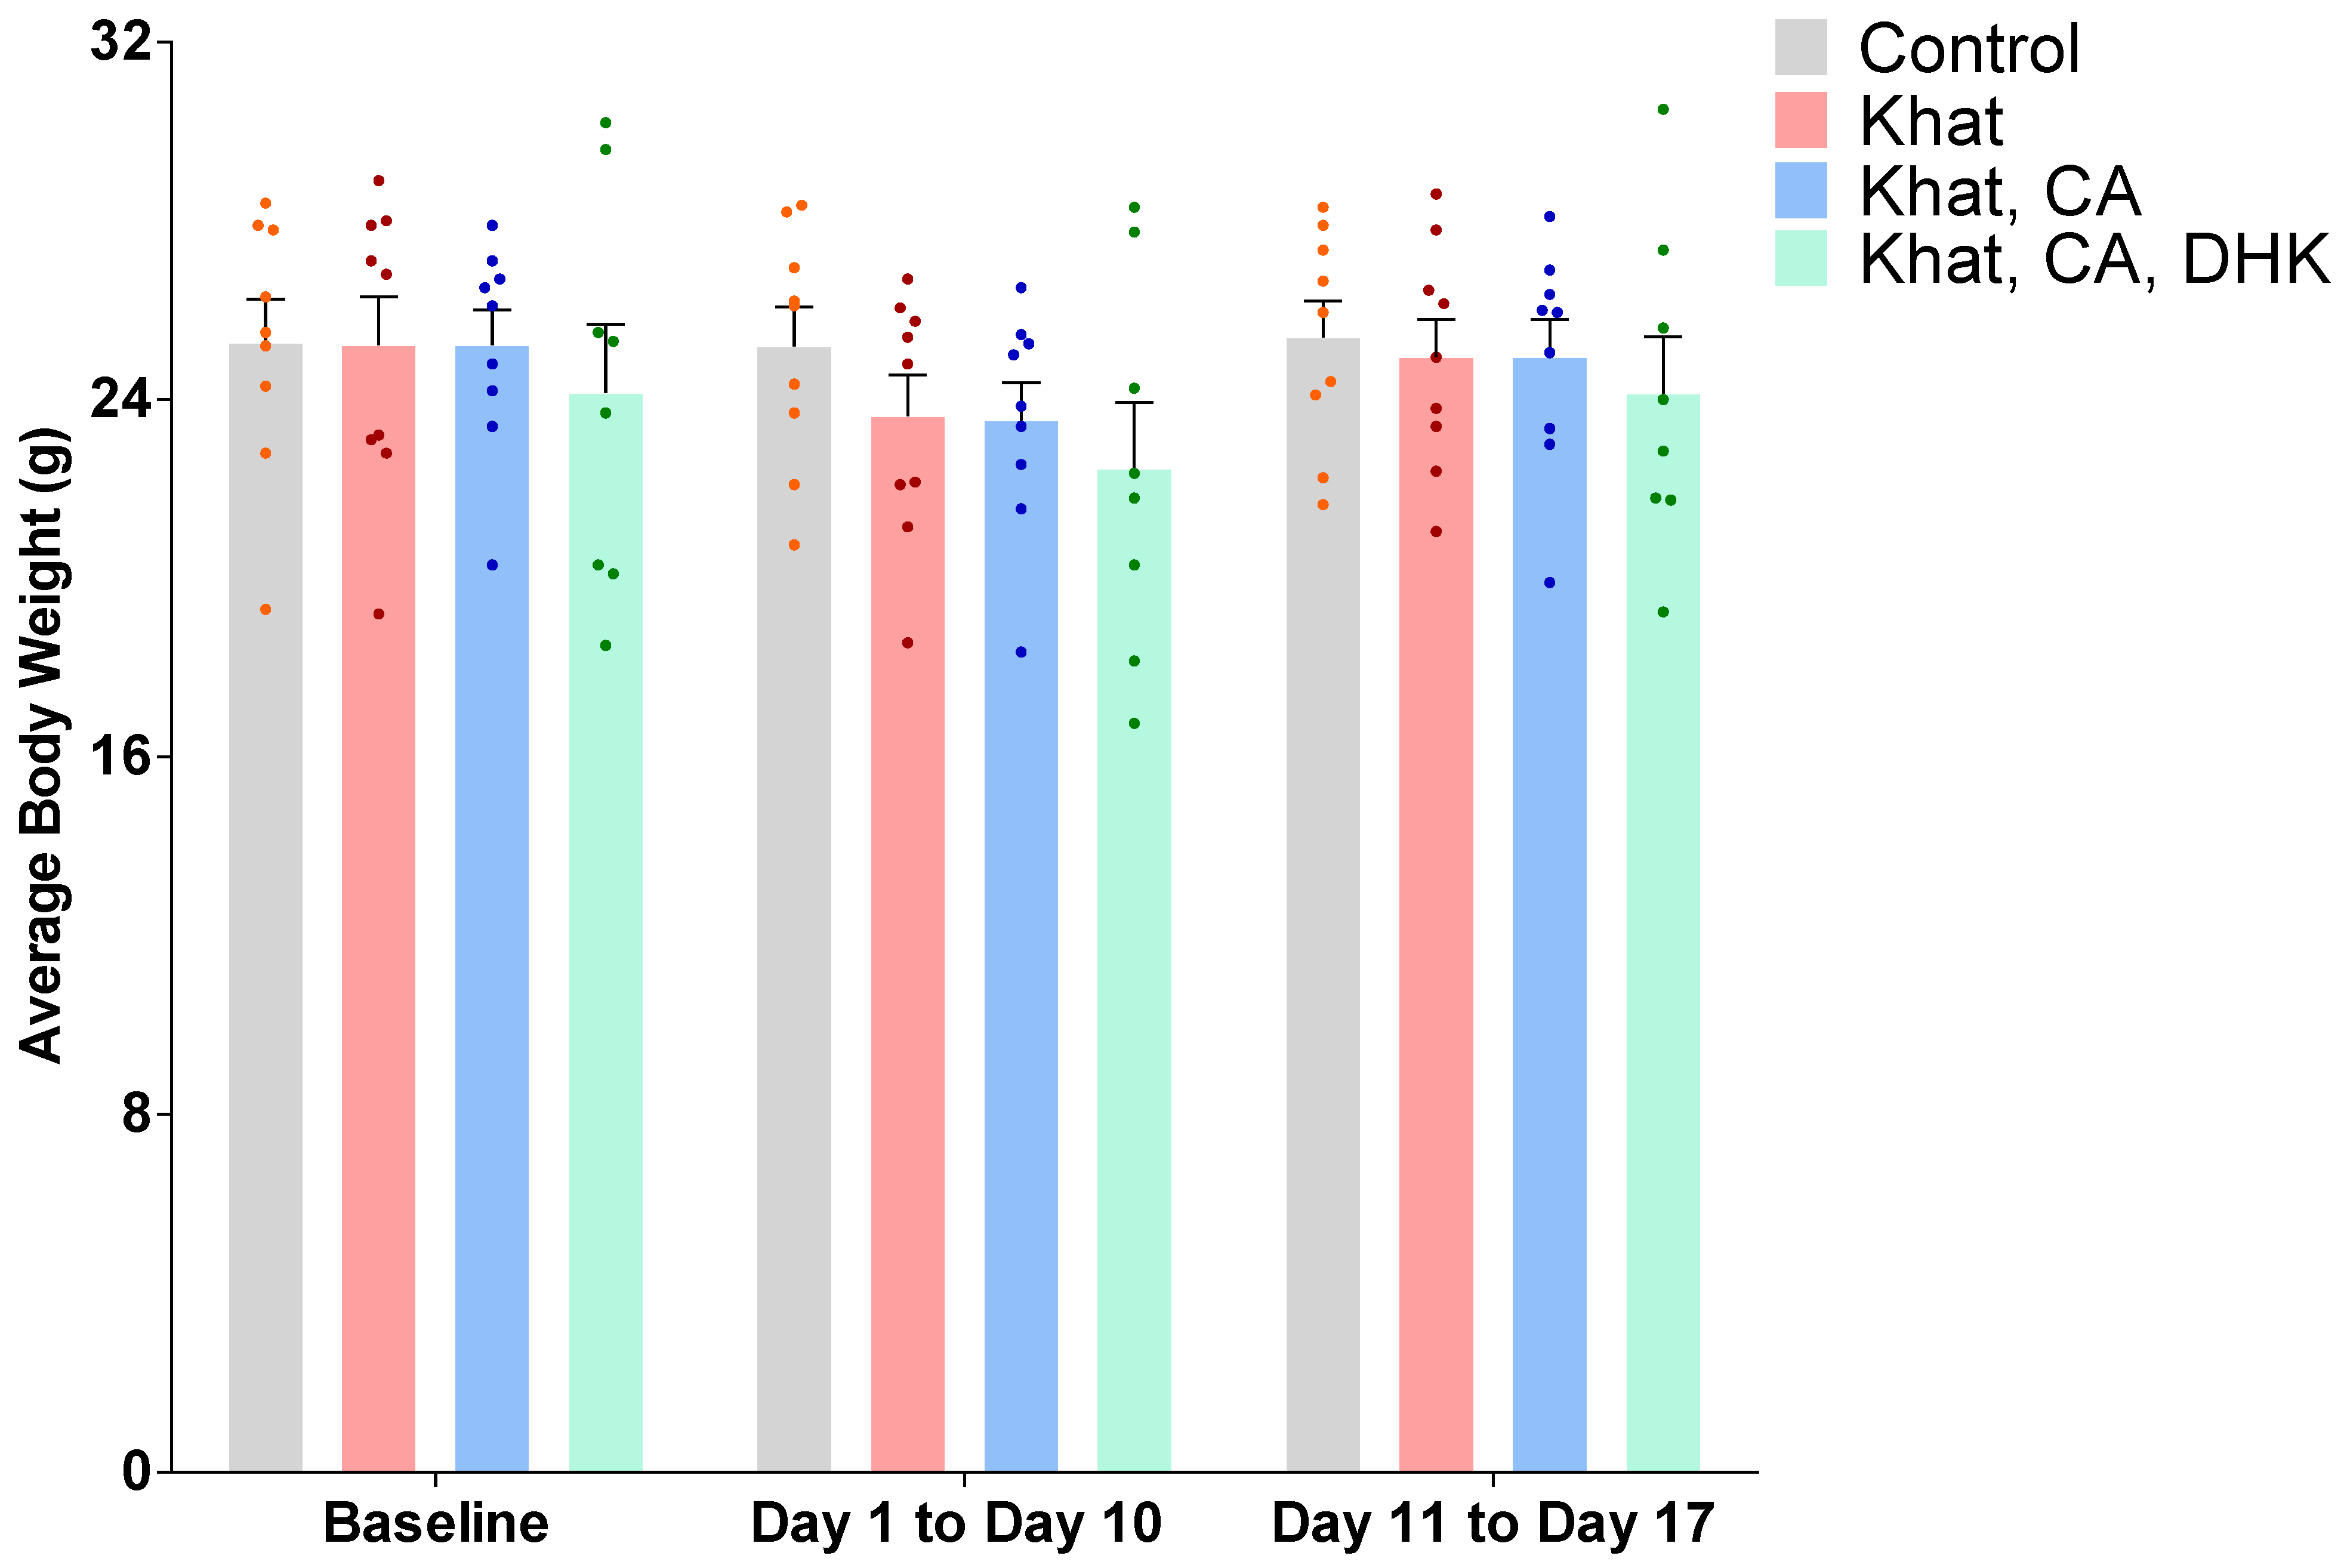
Abstract
1. Introduction
2. Results
2.1. Average Body Weight
2.2. Behavioral Studies
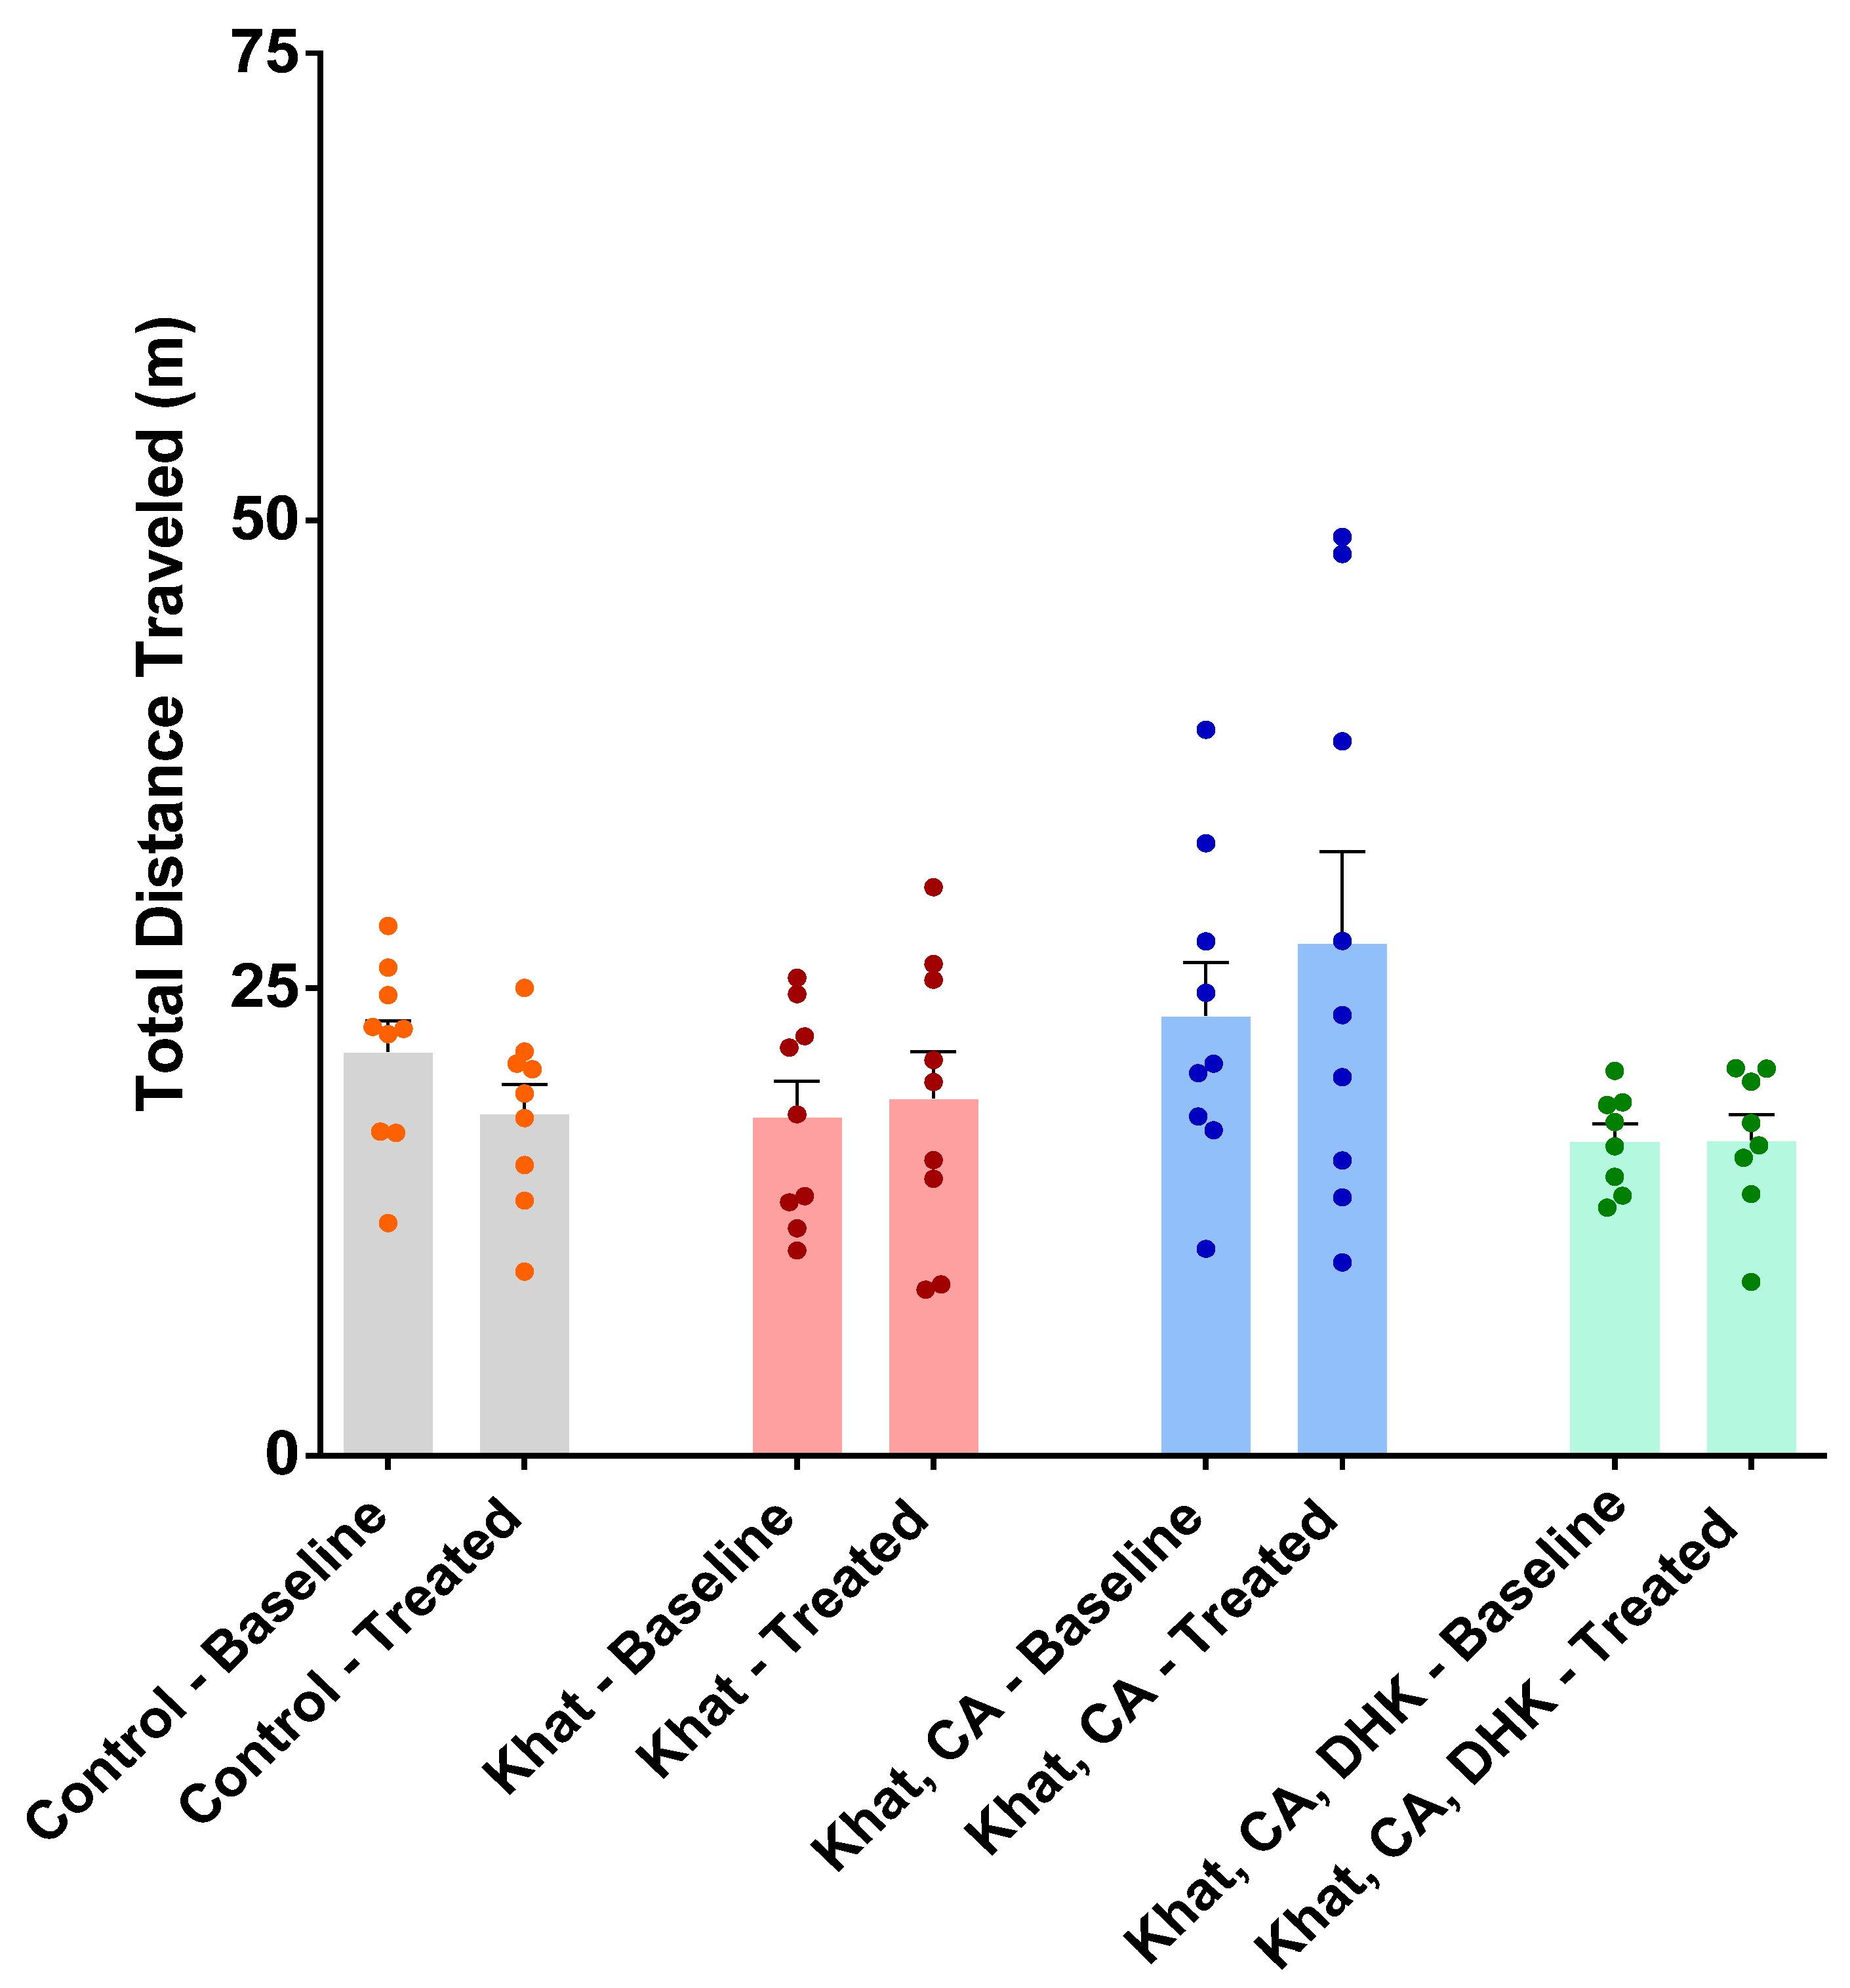
2.2.1. Locomotor Activity Test
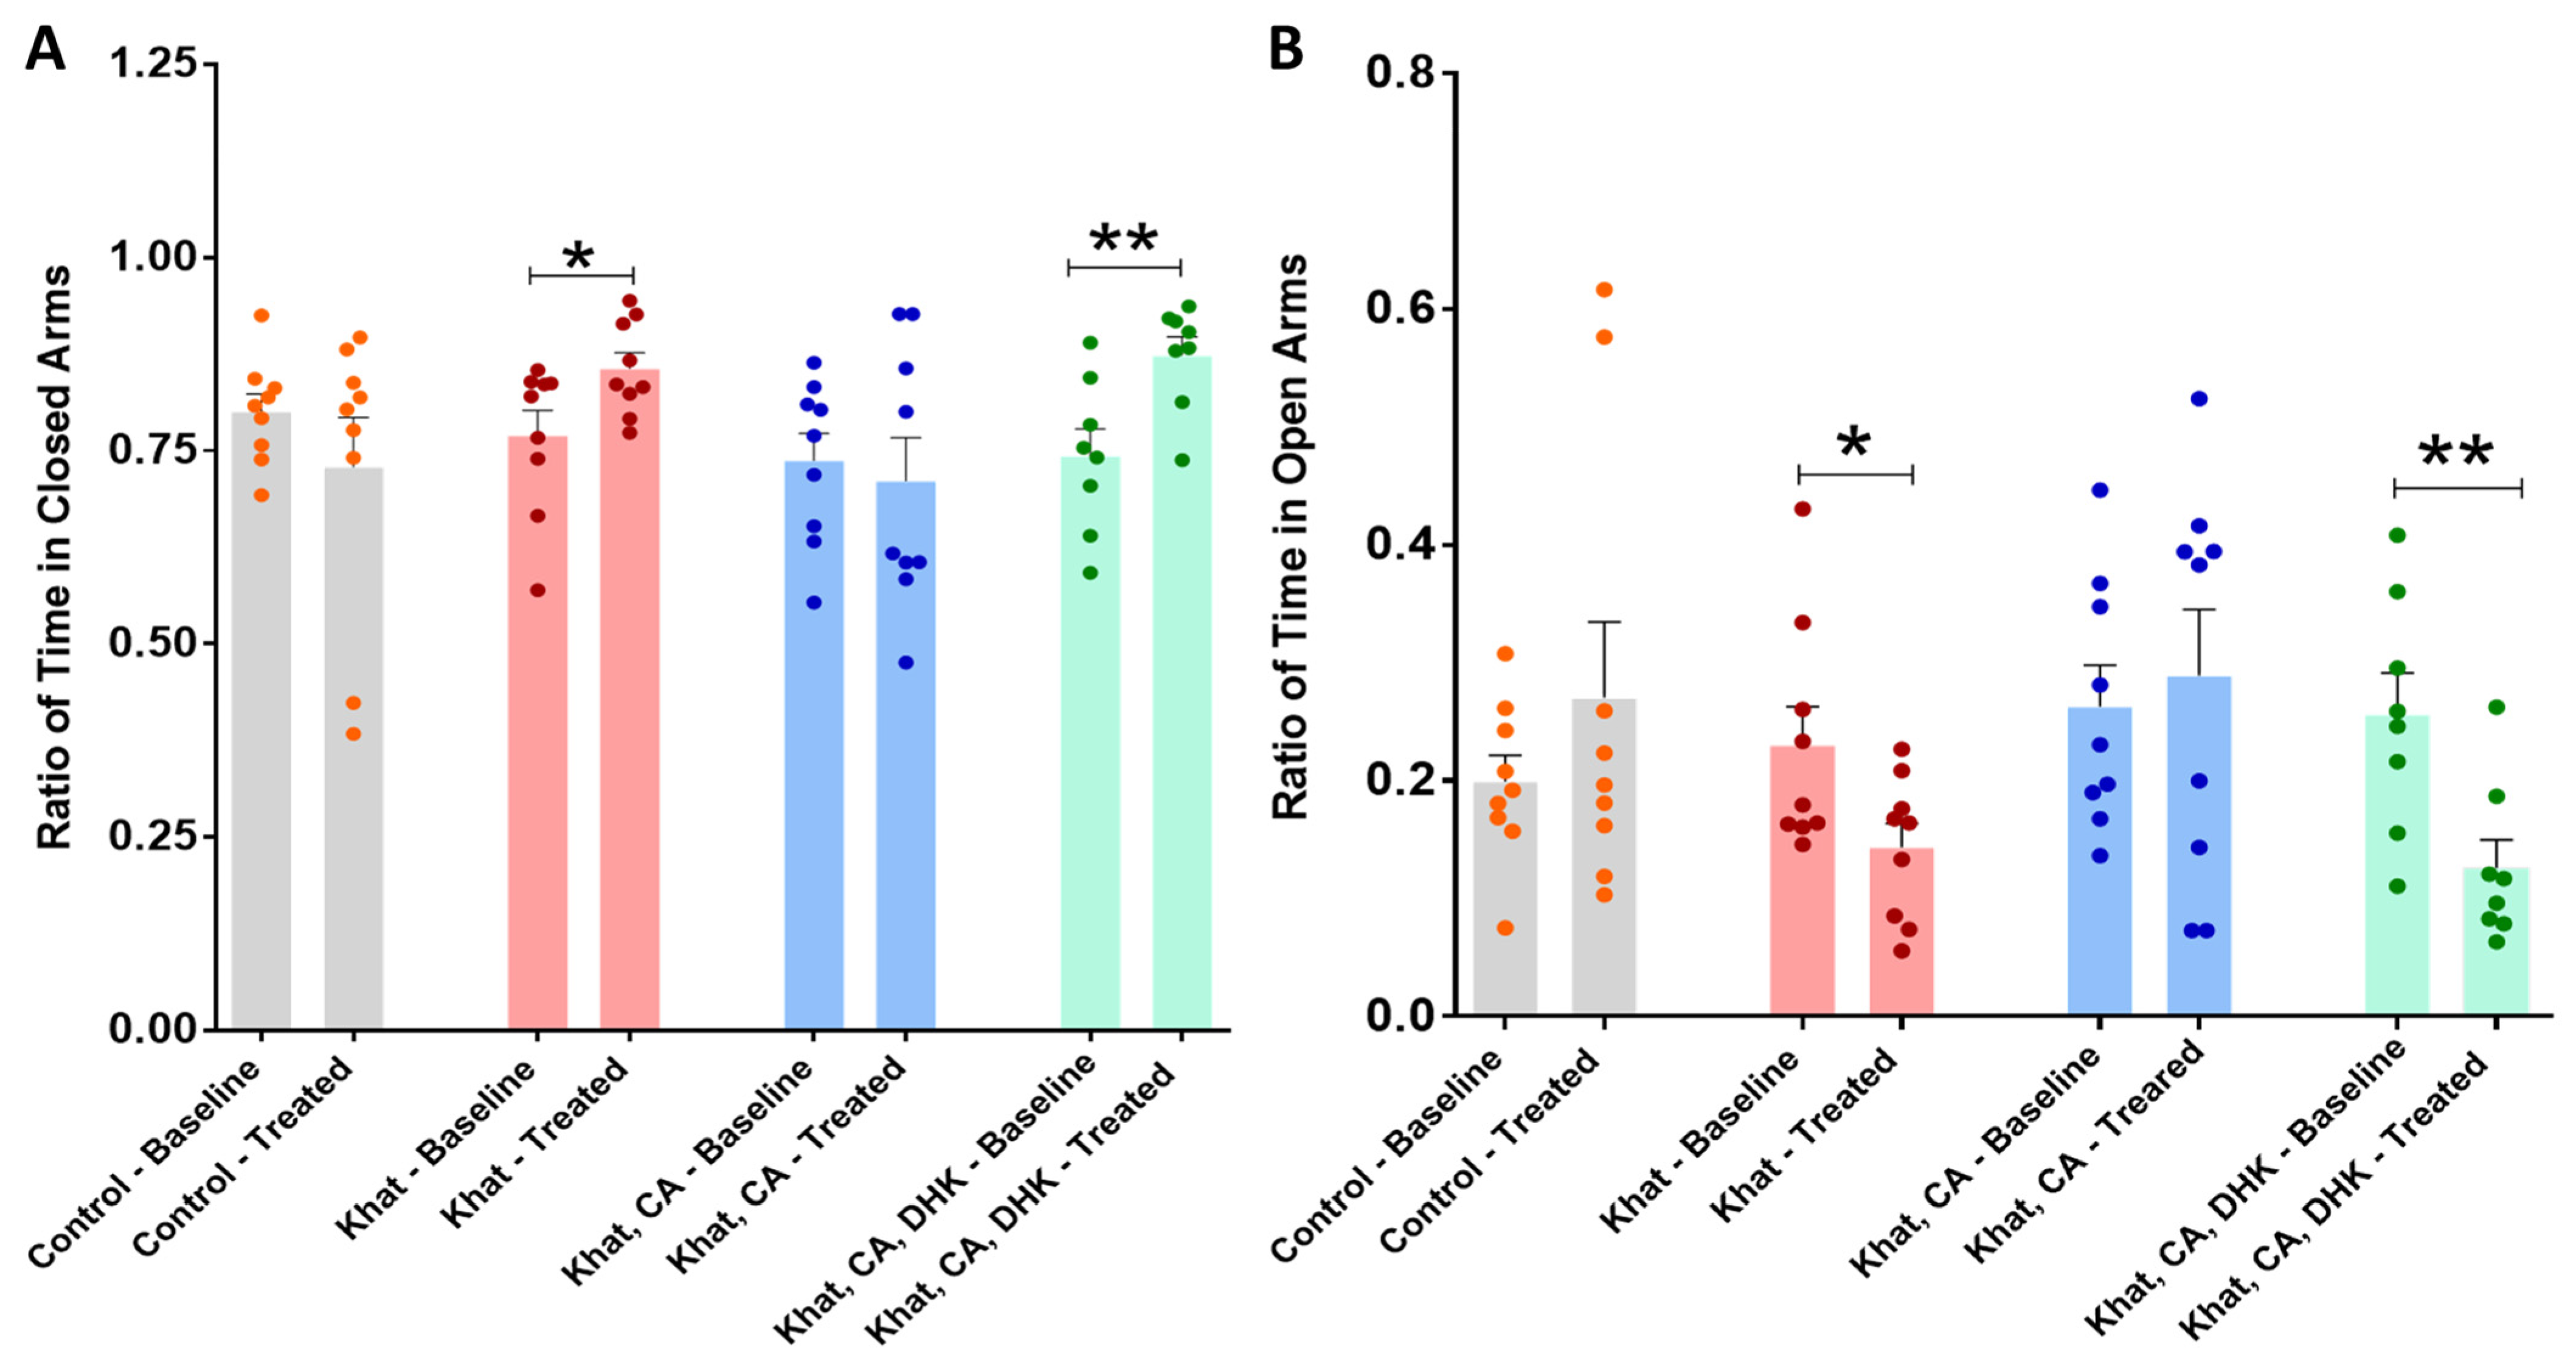
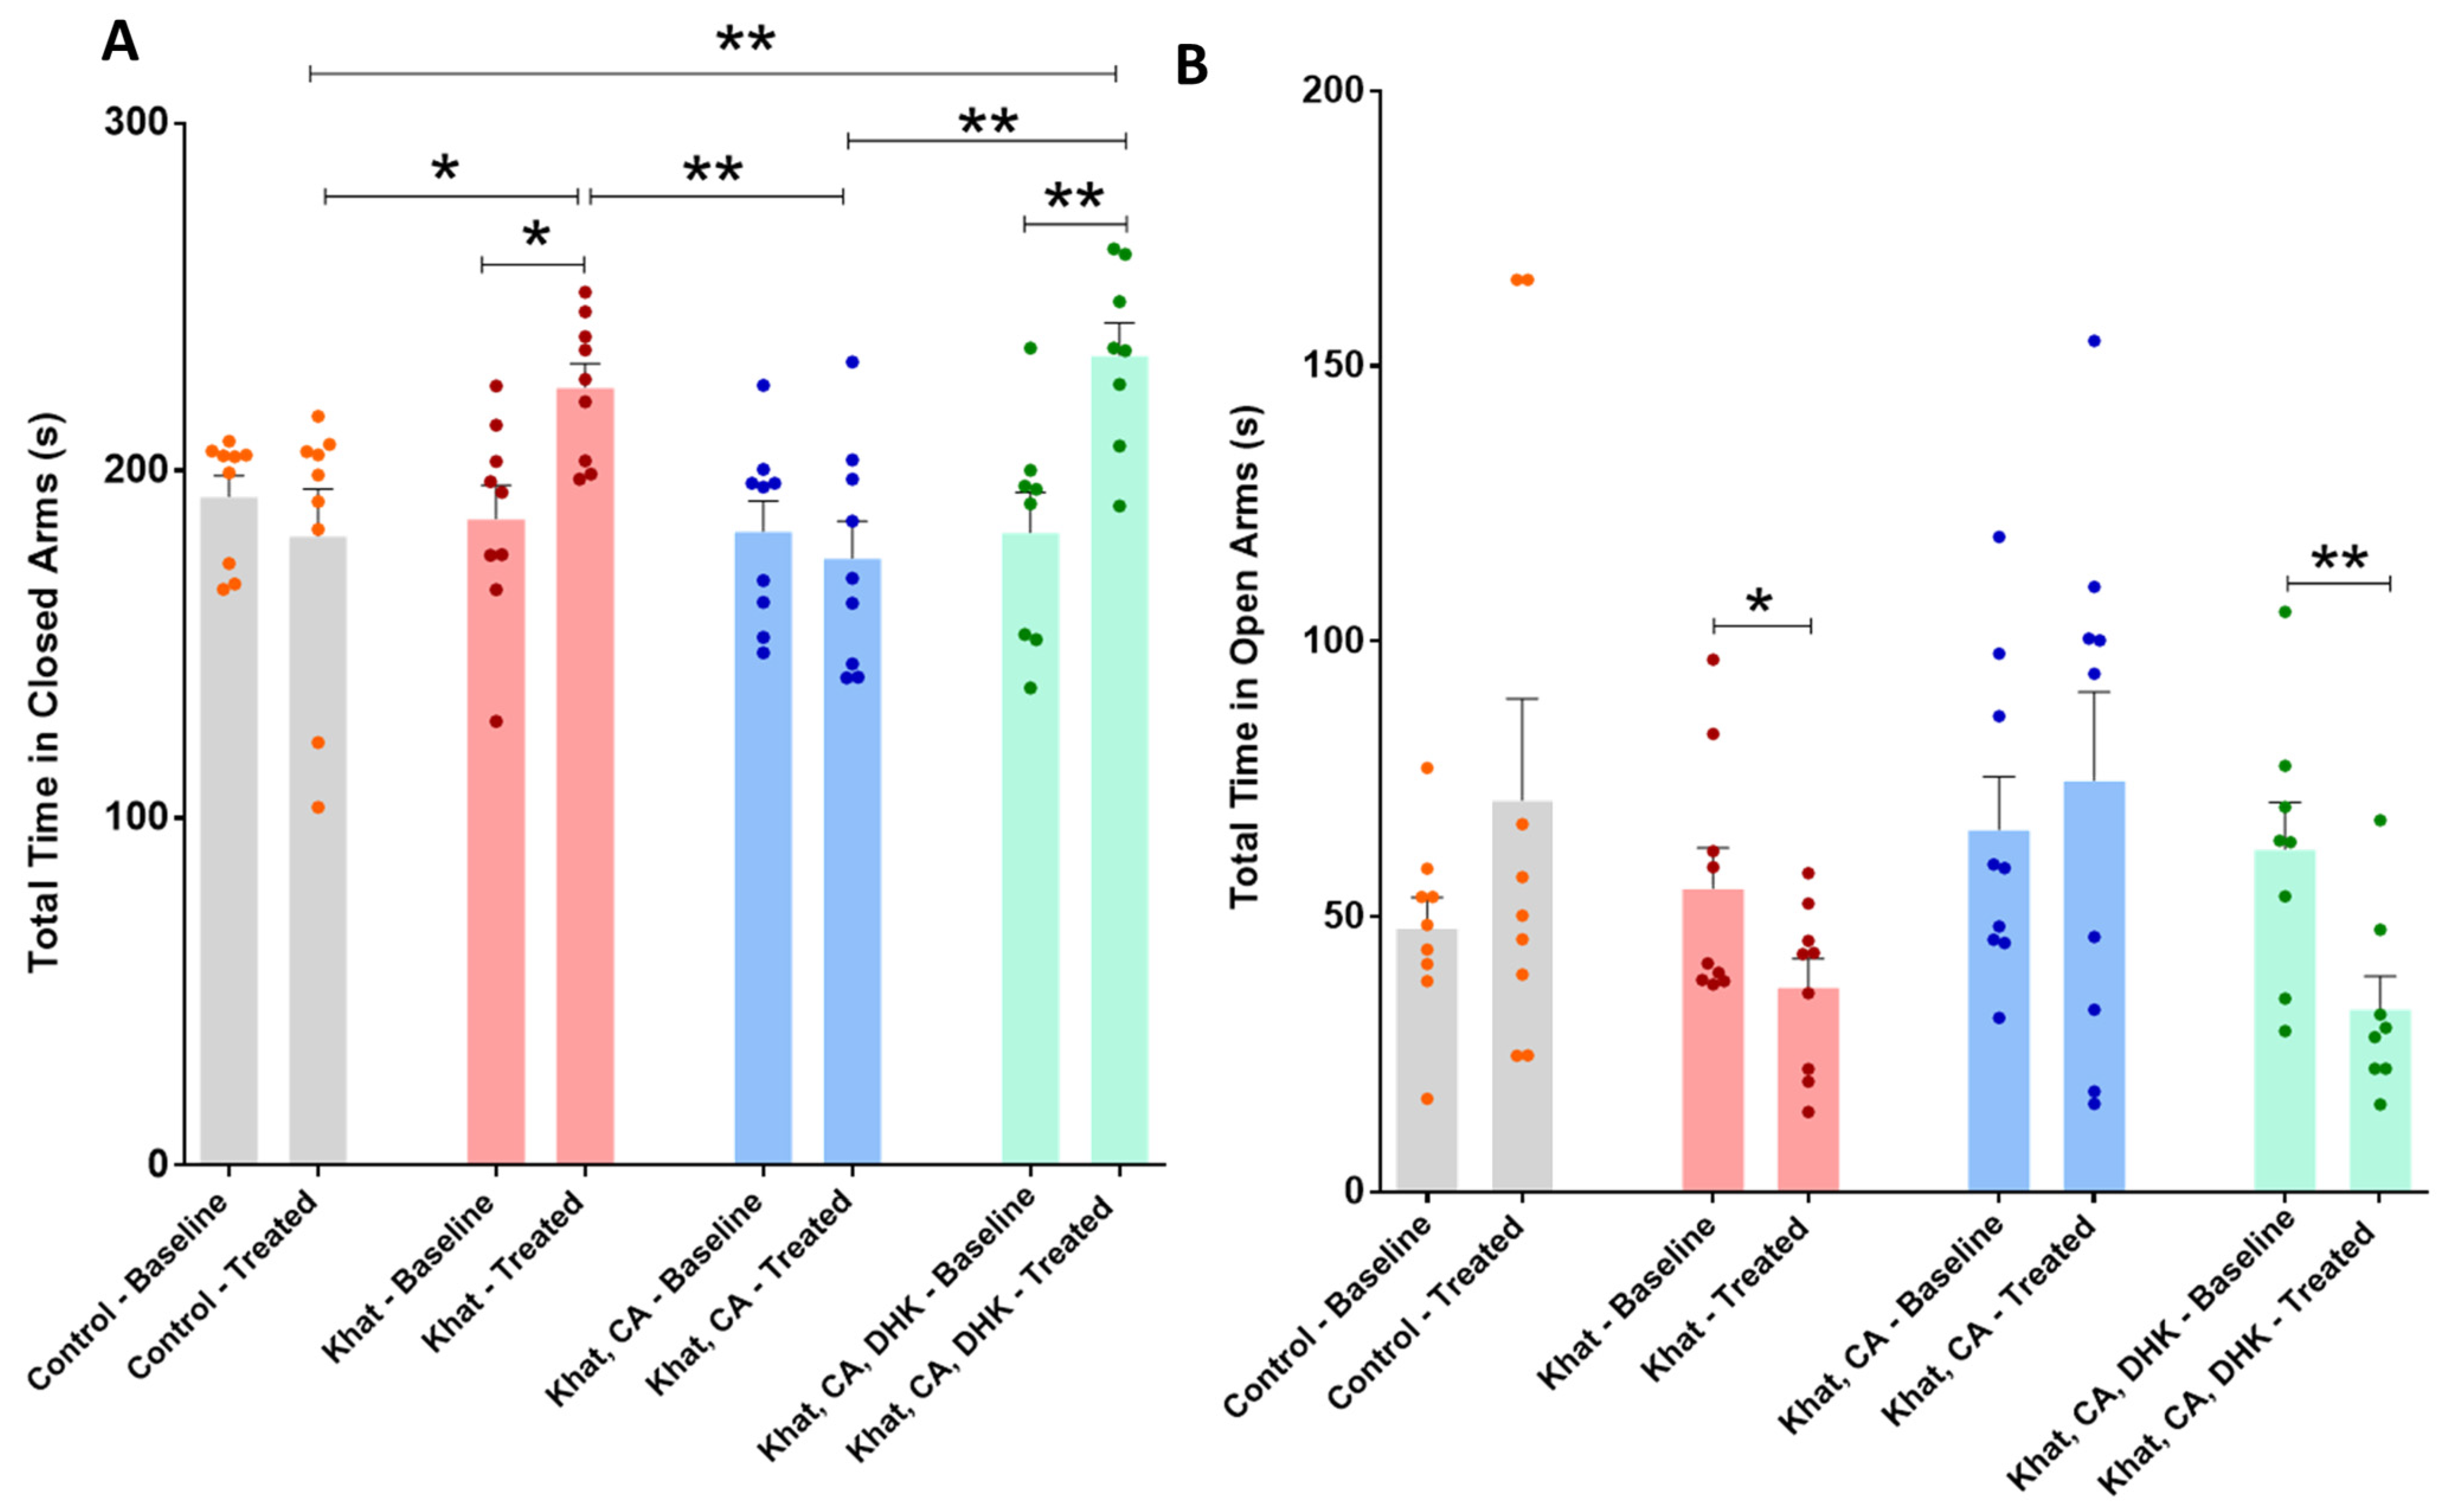
2.2.2. Elevated Plus Maze (EPM)
Ratio of Time in Closed Arms
Ratio of Time in Open Arms
Total Time in Closed Arms
Total Time in Open Arms
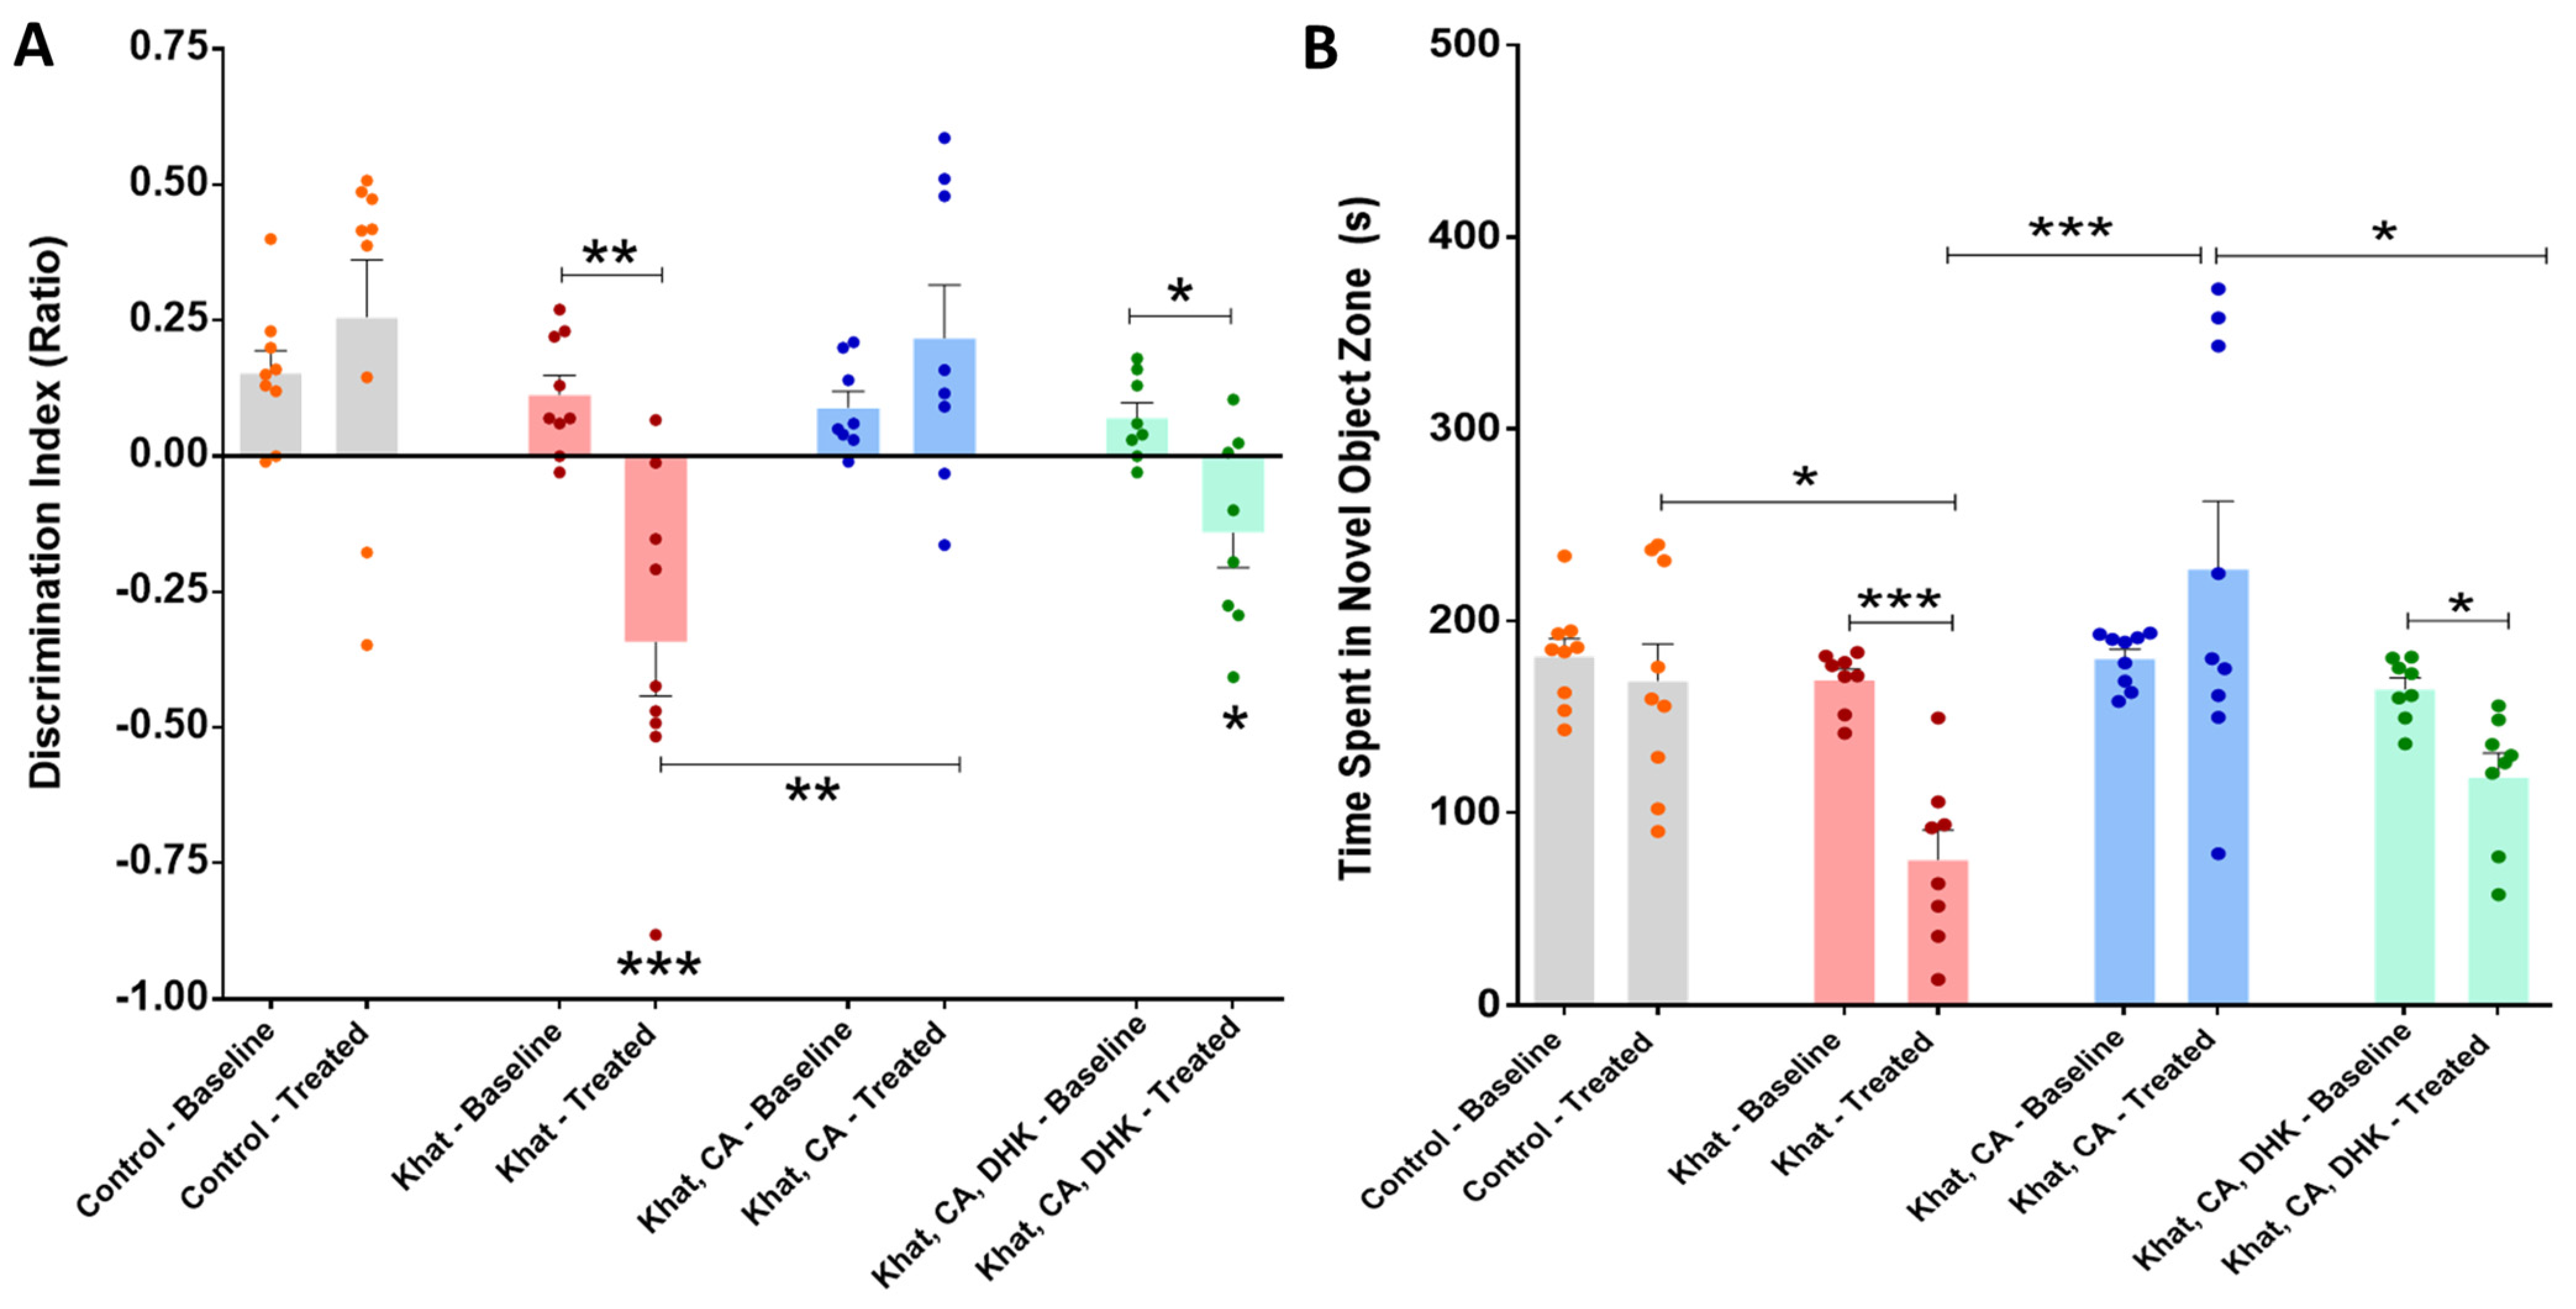
2.2.3. Novel Object Recognition Test (NORT)
Novel Object Recognition Test (Discrimination Index)
Time Spent in the Novel Object Zone
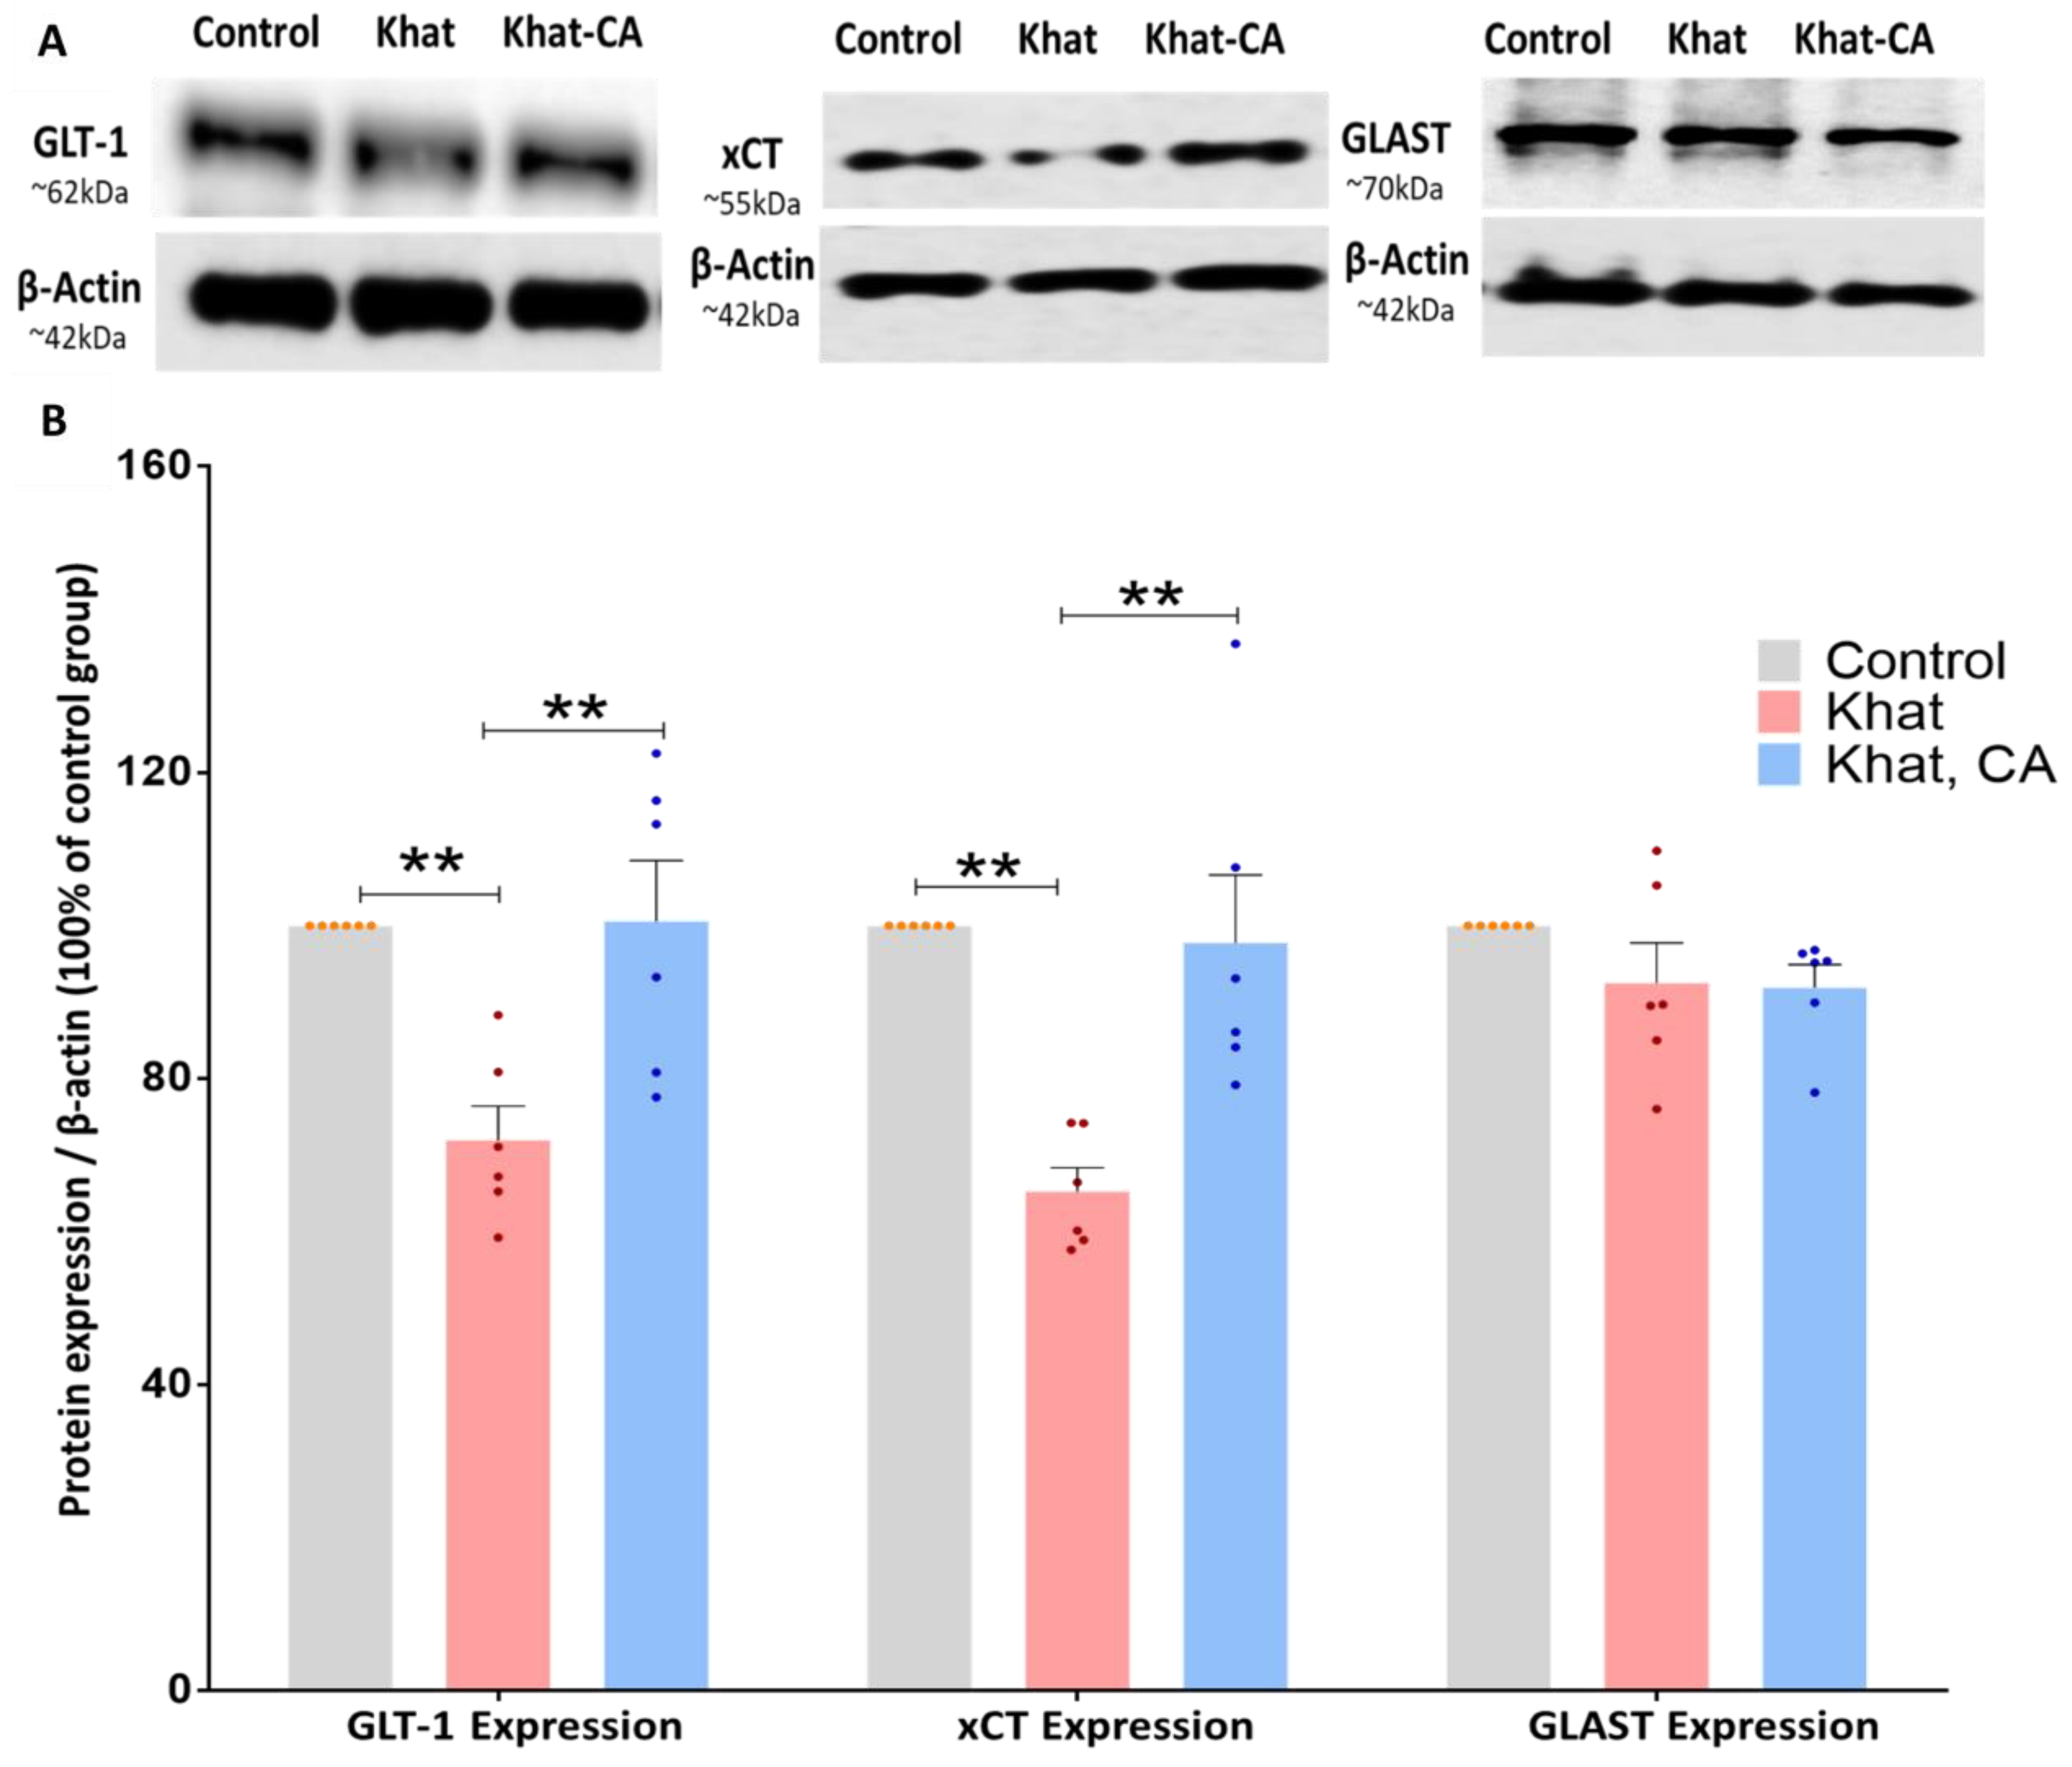
2.3. Western Blot Analysis
2.3.1. GLT-1 Expression
2.3.2. xCT Expression
2.3.3. GLAST Expression
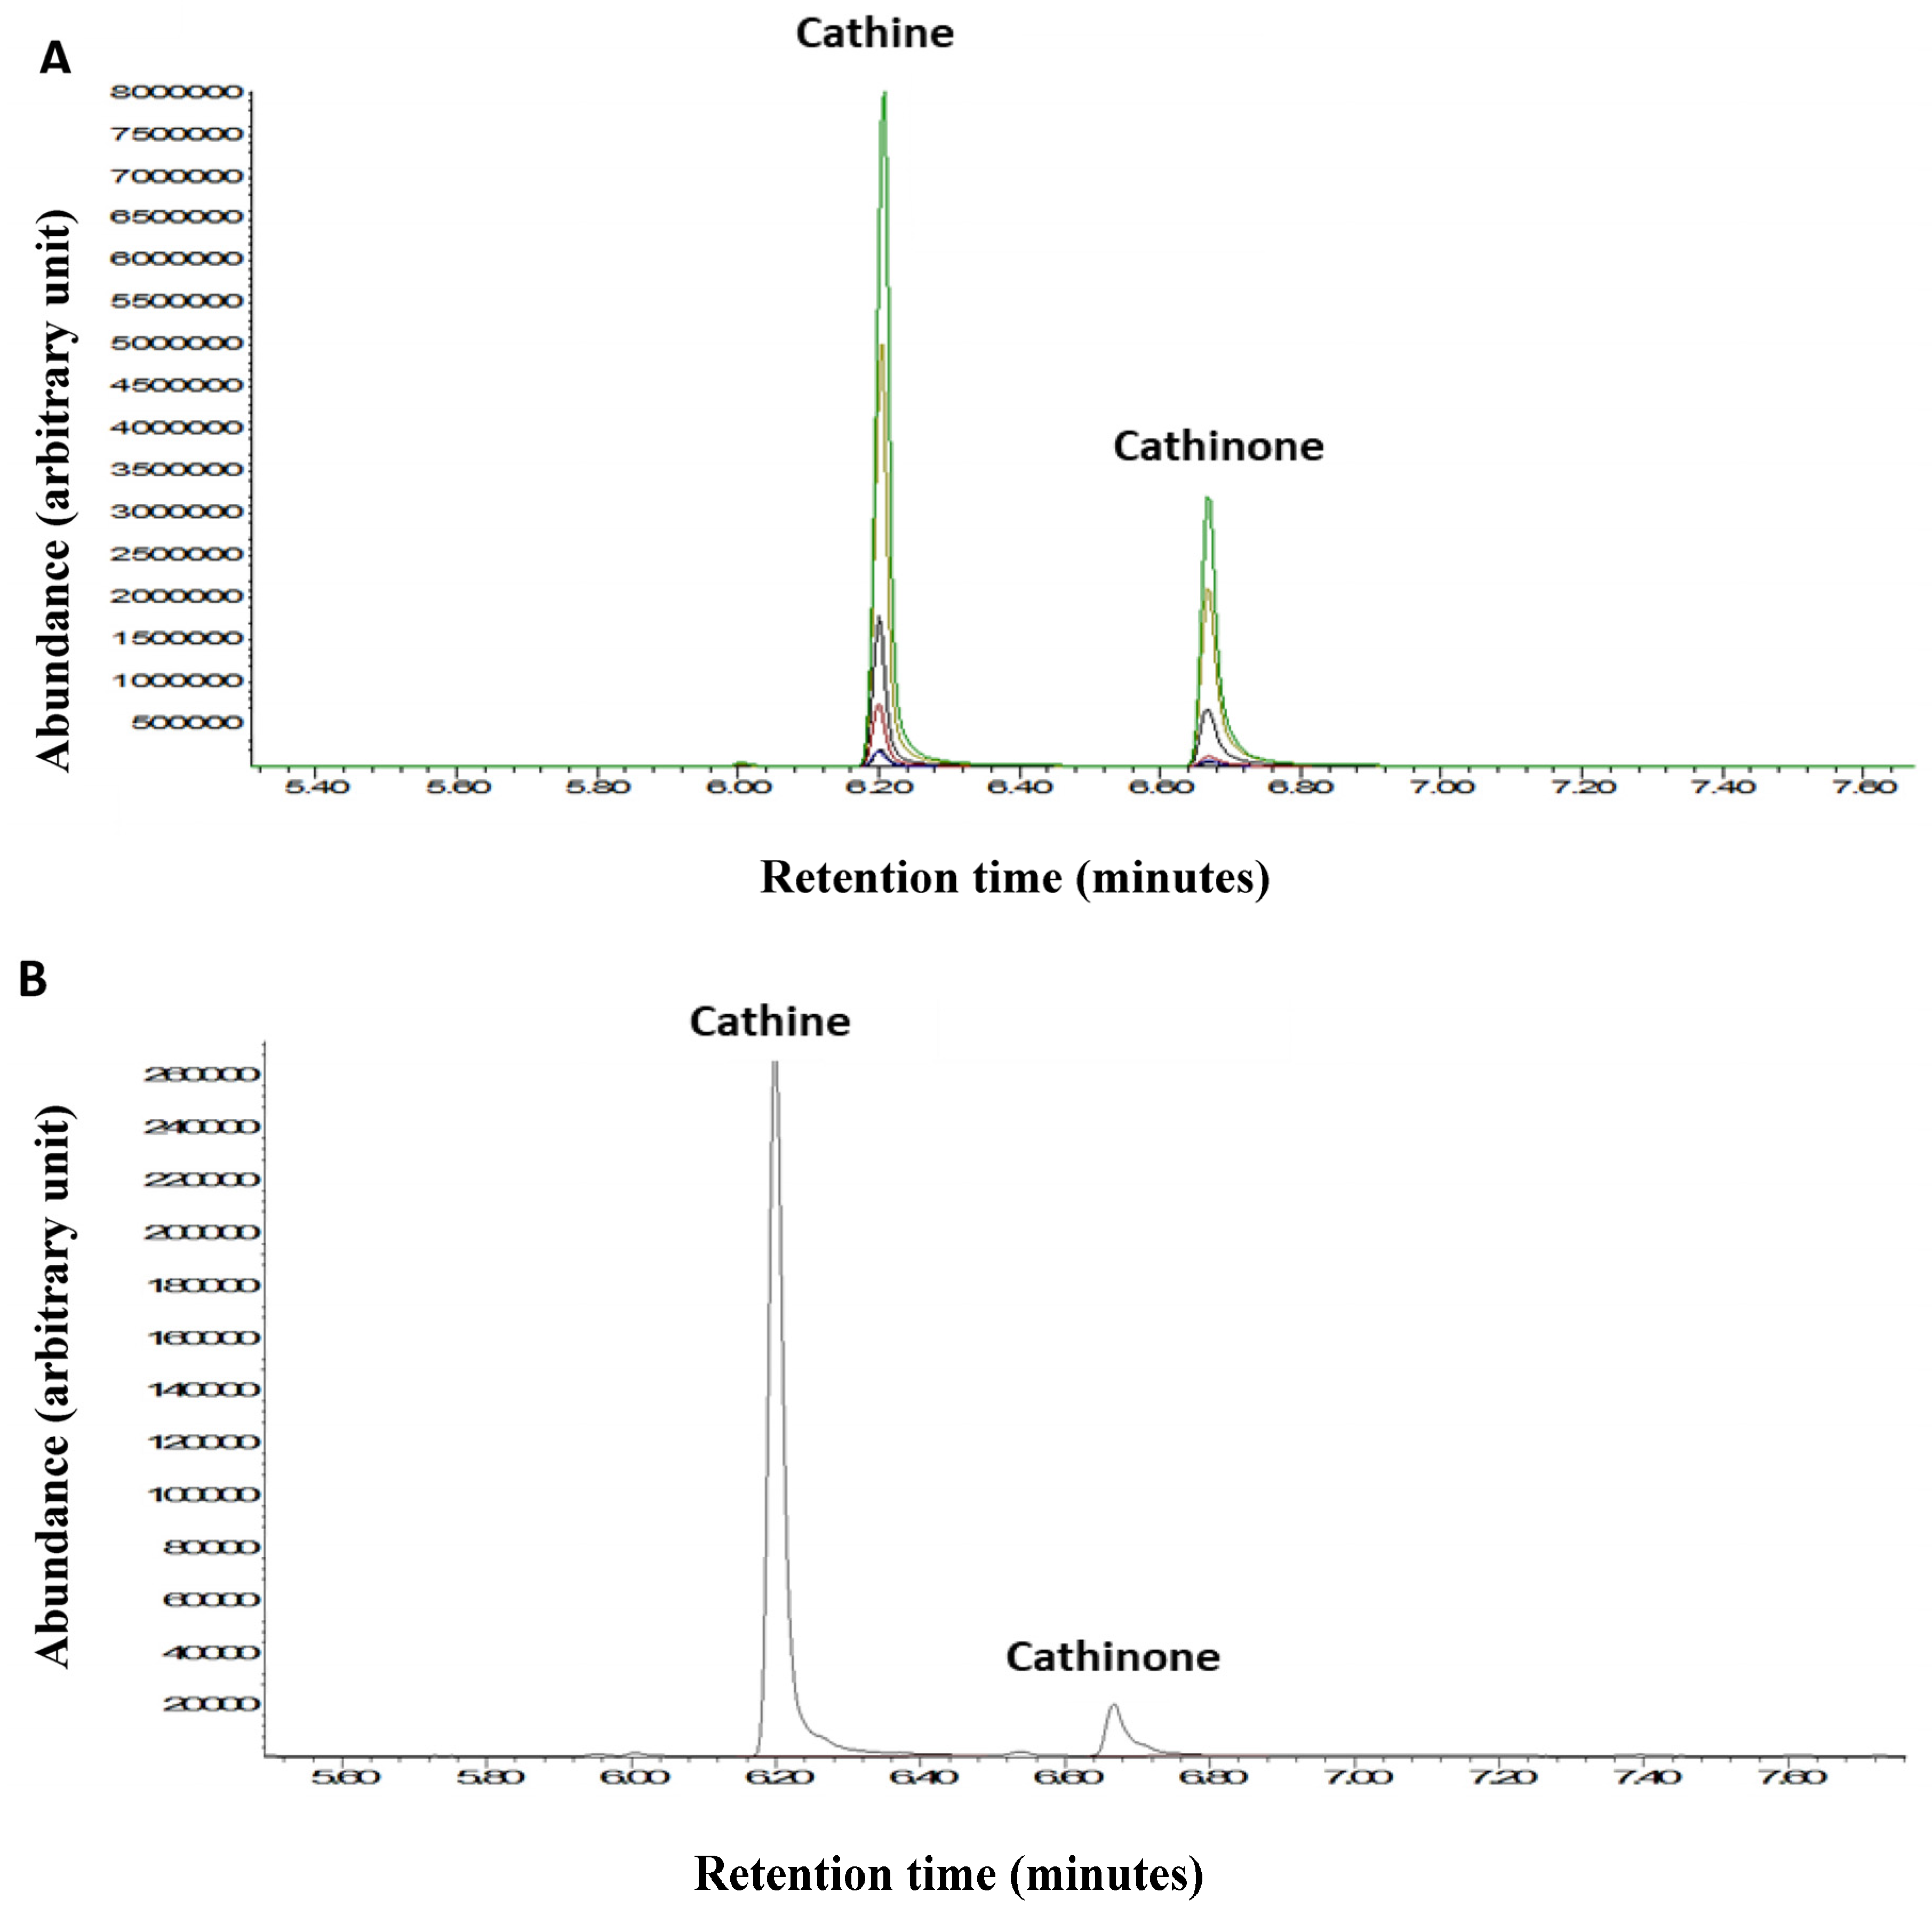
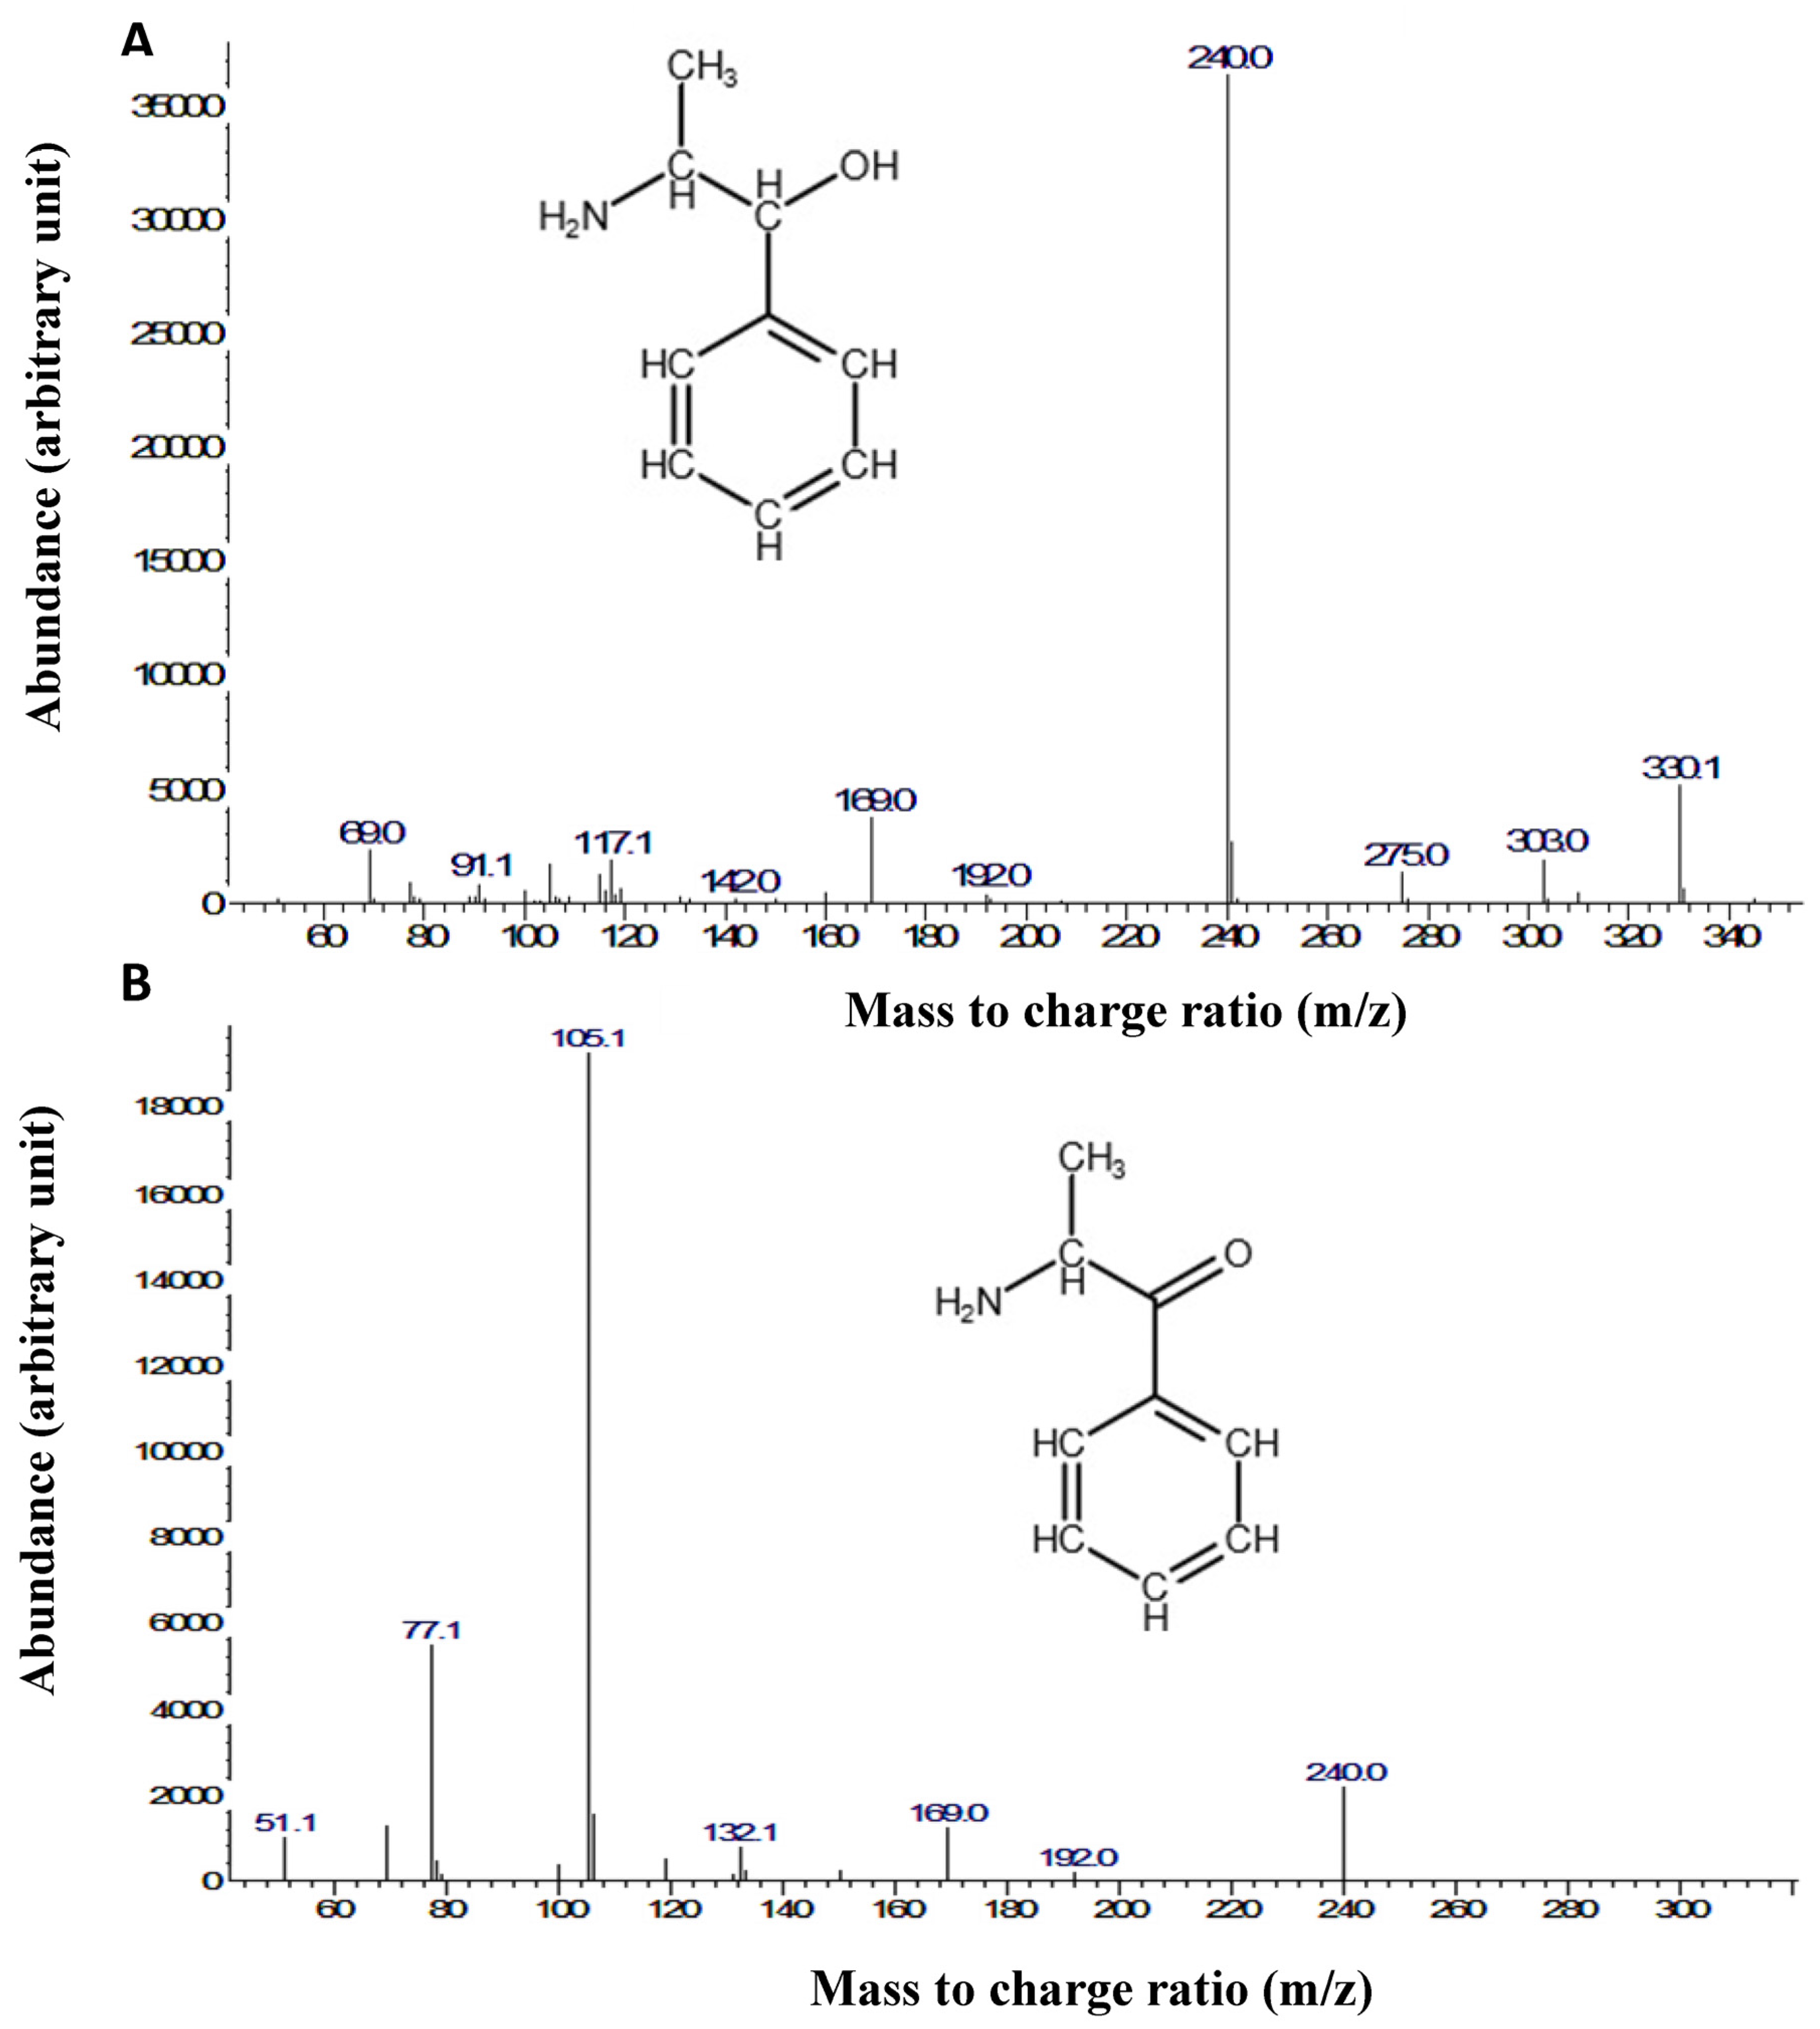
2.4. Gas Chromatography-Mass Spectrometry (GC-MS)
3. Discussion
4. Materials and Methods
4.1. Materials
4.2. Experimental Models
4.3. Instrumentation
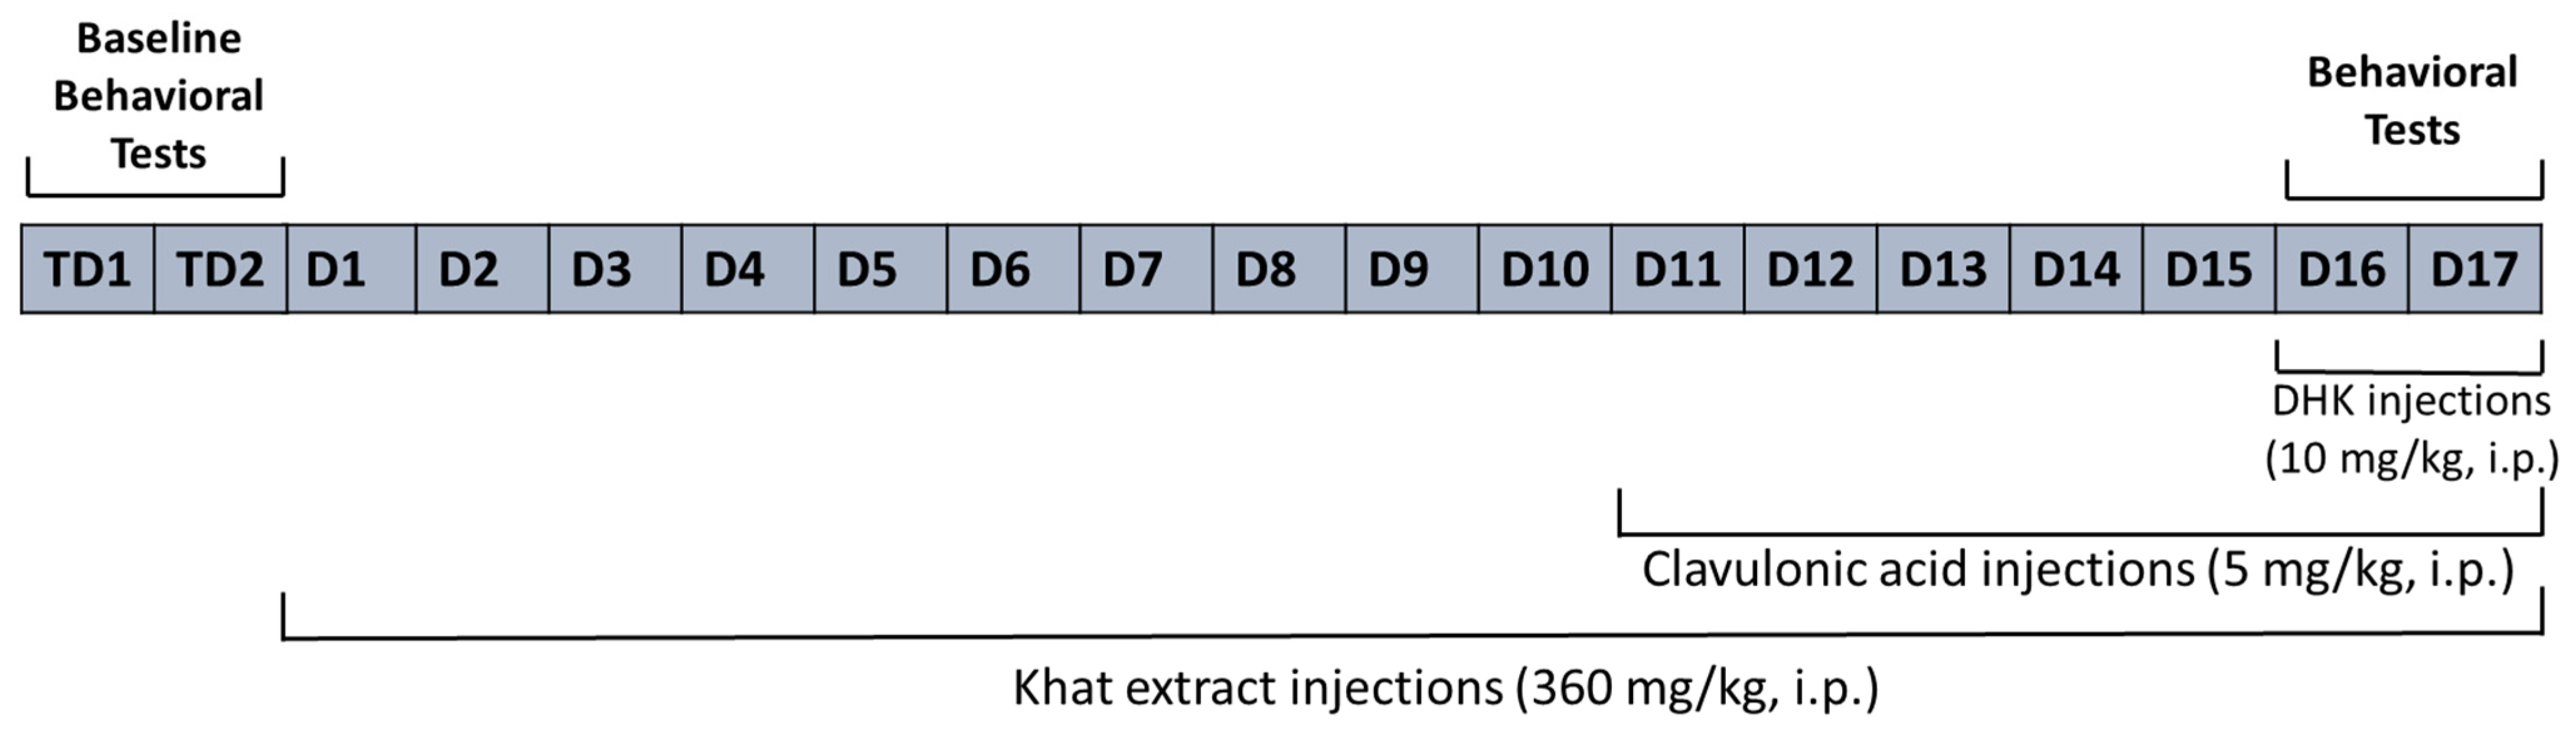
4.4. Study Design
- The Control group was treated with the vehicle solution (0.9% normal saline) for all 17 days.
- The Khat group was given khat extract (360 mg/kg, i.p.) for all 17 days [46].
4.5. Behavioral Experiments
4.5.1. Locomotion Test
4.5.2. Elevated Plus Maze (EPM)
4.5.3. Novel Object Recognition
4.6. Brain Harvesting
4.7. Western Blotting
4.8. Gas Chromatography-Mass Spectrometry
4.9. Statistical Analysis
5. Conclusions
Author Contributions
Funding
Institutional Review Board Statement
Informed Consent Statement
Data Availability Statement
Conflicts of Interest
References
- Abebe, W. Khat: A substance of growing abuse with adverse drug interaction risks. J. Natl. Med. Assoc. 2018, 110, 624–634. [Google Scholar] [CrossRef] [PubMed]
- Balint, E.E.; Falkay, G.; Balint, G.A. Khat–a controversial plant. Wien. Klin. Wochenschr. 2009, 121, 604–614. [Google Scholar] [CrossRef] [PubMed]
- Al-Motarreb, A.; Baker, K.; Broadley, K.J. Khat: Pharmacological and medical aspects and its social use in Yemen. Phytother. Res. Int. J. Devoted Pharmacol. Toxicol. Eval. Nat. Prod. Deriv. 2002, 16, 403–413. [Google Scholar] [CrossRef]
- Valente, M.J.; Guedes de Pinho, P.; de Lourdes Bastos, M.; Carvalho, F.; Carvalho, M. Khat and synthetic cathinones: A review. Arch. Toxicol. 2014, 88, 15–45. [Google Scholar] [CrossRef] [PubMed]
- Cox, G.; Rampes, H. Adverse effects of khat: A review. Adv. Psychiatr. Treat. 2003, 9, 456–463. [Google Scholar] [CrossRef]
- Kalix, P.; Khan, I. Khat: An amphetamine-like plant material. Bull. World Health Organ. 1984, 62, 681. [Google Scholar]
- Connor, J.; Makonnen, E.; Rostom, A. Comparison of analgesic effects of khat (Catha edulis Forsk) extract, D-amphetamine and ibuprofen in mice. J. Pharm. Pharmacol. 2000, 52, 107–110. [Google Scholar] [CrossRef] [PubMed]
- Widler, P.; Mathys, K.; Brenneisen, R.; Kalix, P.; Fisch, H.U. Pharmacodynamics and pharmacokinetics of khat: A controlled study. Clin. Pharmacol. Ther. 1994, 55, 556–562. [Google Scholar] [CrossRef]
- Gowing, L.R.; Ali, R.L.; Allsop, S.; Marsden, J.; Turf, E.E.; West, R.; Witton, J. Global statistics on addictive behaviours: 2014 Status report. Addiction 2015, 110, 904–919. [Google Scholar] [CrossRef]
- Kassim, S.; Dalsania, A.; Nordgren, J.; Klein, A.; Hulbert, J. Before the ban-an exploratory study of a local khat market in East London, UK. Harm Reduct. J. 2015, 12, 1–9. [Google Scholar] [CrossRef]
- Patel, N.B. “Natural amphetamine” khat: A cultural tradition or a drug of abuse? Int. Rev. Neurobiol. 2015, 120, 235–255. [Google Scholar] [PubMed]
- Patel, N.B. Khat (Catha edulis Forsk)–and now there are three. Brain Res. Bull. 2019, 145, 92–96. [Google Scholar] [CrossRef]
- Silva, B.; Soares, J.; Rocha-Pereira, C.; Mladěnka, P.; Remião, F.; Researchers, O. Khat, a cultural chewing drug: A toxicokinetic and toxicodynamic summary. Toxins 2022, 14, 71. [Google Scholar] [CrossRef]
- Curtis, D.; Phillis, J.; Watkins, J. Chemical excitation of spinal neurones. Nature 1959, 183, 611–612. [Google Scholar] [CrossRef] [PubMed]
- Curtis, D.R.; Phillis, J.W.; Watkins, J.C. Actions of amino-acids on the isolated hemisected spinal cord of the toad. Br. J. Pharmacol. Chemother. 1961, 16, 262–283. [Google Scholar] [CrossRef] [PubMed]
- Bräuner-Osborne, H.; Sløk, F.A.; Skjærbæk, N.; Ebert, B.; Sekiyama, N.; Nakanishi, S.; Krogsgaard-Larsen, P. A new highly selective metabotropic excitatory amino acid agonist: 2-amino-4-(3-hydroxy-5-methylisoxazol-4-yl) butyric acid. J. Med. Chem. 1996, 39, 3188–3194. [Google Scholar] [CrossRef] [PubMed]
- Krogsgaard-Larsen, P.; Ebert, B.; Lund, T.; Bräuner-Osborne, H.; Sløk, F.; Johansen, T.; Brehm, L.; Madsen, U. Design of excitatory amino acid receptor agonists, partial agonists and antagonists: Ibotenic acid as a key lead structure. Eur. J. Med. Chem. 1996, 31, 515–537. [Google Scholar] [CrossRef]
- Reiner, A.; Levitz, J. Glutamatergic signaling in the central nervous system: Ionotropic and metabotropic receptors in concert. Neuron 2018, 98, 1080–1098. [Google Scholar] [CrossRef]
- Magi, S.; Piccirillo, S.; Amoroso, S.; Lariccia, V. Excitatory amino acid transporters (EAATs): Glutamate transport and beyond. Int. J. Mol. Sci. 2019, 20, 5674. [Google Scholar] [CrossRef]
- Underhill, S.; Amara, S. TRANSPORTERS| Glutamate Transporters in Epilepsy. In Encyclopedia of Basic Epilepsy Research; Elsevier: Amsterdam, The Netherlands, 2009. [Google Scholar]
- Malik, A.R.; Willnow, T.E. Excitatory amino acid transporters in physiology and disorders of the central nervous system. Int. J. Mol. Sci. 2019, 20, 5671. [Google Scholar] [CrossRef]
- Moran, M.M.; McFarland, K.; Melendez, R.I.; Kalivas, P.W.; Seamans, J.K. Cystine/glutamate exchange regulates metabotropic glutamate receptor presynaptic inhibition of excitatory transmission and vulnerability to cocaine seeking. J. Neurosci. 2005, 25, 6389–6393. [Google Scholar] [CrossRef] [PubMed]
- Petr, G.T.; Sun, Y.; Frederick, N.M.; Zhou, Y.; Dhamne, S.C.; Hameed, M.Q.; Miranda, C.; Bedoya, E.A.; Fischer, K.D.; Armsen, W. Conditional deletion of the glutamate transporter GLT-1 reveals that astrocytic GLT-1 protects against fatal epilepsy while neuronal GLT-1 contributes significantly to glutamate uptake into synaptosomes. J. Neurosci. 2015, 35, 5187–5201. [Google Scholar] [CrossRef]
- Zhou, Y.; Danbolt, N.C. Glutamate as a neurotransmitter in the healthy brain. J. Neural Transm. 2014, 121, 799–817. [Google Scholar] [CrossRef] [PubMed]
- Tanaka, K.; Watase, K.; Manabe, T.; Yamada, K.; Watanabe, M.; Takahashi, K.; Iwama, H.; Nishikawa, T.; Ichihara, N.; Kikuchi, T. Epilepsy and exacerbation of brain injury in mice lacking the glutamate transporter GLT-1. Science 1997, 276, 1699–1702. [Google Scholar] [CrossRef] [PubMed]
- Hugon, J.; Vallat, J.; Dumas, M. Role of glutamate and excitotoxicity in neurologic diseases. Rev. Neurol. 1996, 152, 239–248. [Google Scholar] [PubMed]
- Aal-Aaboda, M.; Alhaddad, H.; Osowik, F.; Nauli, S.M.; Sari, Y. Effects of (R)-(−)-5-methyl-1-nicotinoyl-2-pyrazoline on glutamate transporter 1 and cysteine/glutamate exchanger as well as ethanol drinking behavior in male, alcohol-preferring rats. J. Neurosci. Res. 2015, 93, 930–937. [Google Scholar] [CrossRef]
- Goodwani, S.; Rao, P.; Bell, R.L.; Sari, Y. Amoxicillin and amoxicillin/clavulanate reduce ethanol intake and increase GLT-1 expression as well as AKT phosphorylation in mesocorticolimbic regions. Brain Res. 2015, 1622, 397–408. [Google Scholar] [CrossRef]
- Melendez, R.I.; Hicks, M.P.; Cagle, S.S.; Kalivas, P.W. Ethanol exposure decreases glutamate uptake in the nucleus accumbens. Alcohol. Clin. Exp. Res. 2005, 29, 326–333. [Google Scholar] [CrossRef]
- Alshehri, F.S.; Hakami, A.Y.; Althobaiti, Y.S.; Sari, Y. Effects of ceftriaxone on hydrocodone seeking behavior and glial glutamate transporters in P rats. Behav. Brain Res. 2018, 347, 368–376. [Google Scholar] [CrossRef]
- Knackstedt, L.A.; Melendez, R.I.; Kalivas, P.W. Ceftriaxone restores glutamate homeostasis and prevents relapse to cocaine seeking. Biol. Psychiatry 2010, 67, 81–84. [Google Scholar] [CrossRef]
- Alasmari, F.; Alexander, L.E.C.; Hammad, A.M.; Horton, A.; Alhaddad, H.; Schiefer, I.T.; Shin, J.; Moshensky, A.; Sari, Y. E-cigarette aerosols containing nicotine modulate nicotinic acetylcholine receptors and astroglial glutamate transporters in mesocorticolimbic brain regions of chronically exposed mice. Chem.-Biol. Interact. 2021, 333, 109308. [Google Scholar] [CrossRef]
- Althobaiti, Y.S.; Alshehri, F.S.; Hakami, A.Y.; Hammad, A.M.; Sari, Y. Effects of clavulanic acid treatment on reinstatement to methamphetamine, glial glutamate transporters, and mGluR 2/3 expression in P rats exposed to ethanol. J. Mol. Neurosci. 2019, 67, 1–15. [Google Scholar] [CrossRef]
- Das, S.C.; Yamamoto, B.K.; Hristov, A.M.; Sari, Y. Ceftriaxone attenuates ethanol drinking and restores extracellular glutamate concentration through normalization of GLT-1 in nucleus accumbens of male alcohol-preferring rats. Neuropharmacology 2015, 97, 67–74. [Google Scholar] [CrossRef]
- LaLumiere, R.T.; Kalivas, P.W. Glutamate release in the nucleus accumbens core is necessary for heroin seeking. J. Neurosci. 2008, 28, 3170–3177. [Google Scholar] [CrossRef] [PubMed]
- Shen, H.-w.; Scofield, M.D.; Boger, H.; Hensley, M.; Kalivas, P.W. Synaptic glutamate spillover due to impaired glutamate uptake mediates heroin relapse. J. Neurosci. 2014, 34, 5649–5657. [Google Scholar] [CrossRef] [PubMed]
- Britt, J.P.; Benaliouad, F.; McDevitt, R.A.; Stuber, G.D.; Wise, R.A.; Bonci, A. Synaptic and behavioral profile of multiple glutamatergic inputs to the nucleus accumbens. Neuron 2012, 76, 790–803. [Google Scholar] [CrossRef]
- Reissner, K.J.; Kalivas, P.W. Using glutamate homeostasis as a target for treating addictive disorders. Behav. Pharmacol. 2010, 21, 514. [Google Scholar] [CrossRef] [PubMed]
- Gregg, R.A.; Hicks, C.; Nayak, S.U.; Tallarida, C.S.; Nucero, P.; Smith, G.R.; Reitz, A.B.; Rawls, S.M. Synthetic cathinone MDPV downregulates glutamate transporter subtype I (GLT-1) and produces rewarding and locomotor-activating effects that are reduced by a GLT-1 activator. Neuropharmacology 2016, 108, 111–119. [Google Scholar] [CrossRef] [PubMed]
- Alajaji, M.; Bowers, M.; Knackstedt, L.; Damaj, M. Effects of the beta-lactam antibiotic ceftriaxone on nicotine withdrawal and nicotine-induced reinstatement of preference in mice. Psychopharmacology 2013, 228, 419–426. [Google Scholar] [CrossRef]
- Hakami, A.Y.; Sari, Y. β-Lactamase inhibitor, clavulanic acid, attenuates ethanol intake and increases glial glutamate transporters expression in alcohol preferring rats. Neurosci. Lett. 2017, 657, 140–145. [Google Scholar] [CrossRef]
- Girma, T.; Mossie, A.; Getu, Y. Association between body composition and khat chewing in Ethiopian adults. BMC Res. Notes 2015, 8, 680. [Google Scholar] [CrossRef]
- Al-Dubai, W.; Molham, A.-H.; Al-Geiry, A. Human khat (Catha edulis) chewers have elevated plasma leptin and nonesterified fatty acids. Nutr. Res. 2006, 26, 632–636. [Google Scholar] [CrossRef]
- Murray, C.D.; Le Roux, C.W.; Emmanuel, A.V.; Halket, J.M.; Przyborowska, A.M.; Kamm, M.A.; Murray-Lyon, I.M. The effect of khat (Catha edulis) as an appetite suppressant is independent of ghrelin and PYY secretion. Appetite 2008, 51, 747–750. [Google Scholar] [CrossRef] [PubMed]
- Alshagga, M.A.; Alshawsh, M.A.; Seyedan, A.; Alsalahi, A.; Pan, Y.; Mohankumar, S.K.; Alkebsi, A.; Kassim, S.; Mohamed, Z. Khat (Catha edulis) and obesity: A scoping review of animal and human studies. Ann. Nutr. Metab. 2017, 69, 200–211. [Google Scholar] [CrossRef]
- Kimani, S.T.; Patel, N.B.; Kioy, P.G. Effect of single and daily khat (Catha edulis) extract on locomotor behaviour in CBA mice. Behav. Brain Res. 2008, 195, 192–197. [Google Scholar] [CrossRef] [PubMed]
- Oyungu, E.; Kioy, P.; Patel, N. Effect of Catha edulis (khat) on behaviour and its potential to induce seizures in Sprague Dawley rats. East Afr. Med. J. 2007, 84, 219–225. [Google Scholar] [CrossRef] [PubMed][Green Version]
- Bedada, W.; Engidawork, E. The neuropsychopharmacological effects of Catha edulis in mice offspring born to mothers exposed during pregnancy and lactation. Phytother. Res. Int. J. Devoted Pharmacol. Toxicol. Eval. Nat. Prod. Deriv. 2010, 24, 268–276. [Google Scholar] [CrossRef]
- Safhi, M.M.; Alam, M.F.; Khuwaja, G.; Hussain, S.; Siddiqui, M.H.; Islam, F.; Khardali, I.; Al-Sanosi, R.M.; Al-Hazmi, H.; Khan, A. Catha edulis active principle, cathinone, suppresses motor coordination, accelerates the anxiety and alters the levels of dopamine and its metabolites in the limbic areas of male Swiss albino mice. Acta Pharm. 2018, 68, 485–495. [Google Scholar] [CrossRef]
- Mohebbi, E.; Molavi, M.; Mohammadzadeh, M.; Hosseinzadeh, H.; Amin, B. Clavulanic acid improves ethanol withdrawal symptoms in rats. Iran. J. Basic Med. Sci. 2020, 23, 730. [Google Scholar]
- Limenie, A.A.; Dugul, T.T.; Eshetu, E.M. Effects of Catha Edulis Forsk on spatial learning, memory and correlation with serum electrolytes in wild-type male white albino rats. PLoS ONE 2022, 17, e0257932. [Google Scholar] [CrossRef]
- Hoffman, R.; al’Absi, M. Working memory and speed of information processing in chronic khat users: Preliminary findings. Eur. Addict. Res. 2012, 19, 1–6. [Google Scholar] [CrossRef] [PubMed]
- Hammad, A.M.; Althobaiti, Y.S.; Das, S.C.; Sari, Y. Effects of repeated cocaine exposure and withdrawal on voluntary ethanol drinking, and the expression of glial glutamate transporters in mesocorticolimbic system of P rats. Mol. Cell. Neurosci. 2017, 82, 58–65. [Google Scholar] [CrossRef] [PubMed]
- Bridges, R.; Lutgen, V.; Lobner, D.; Baker, D.A. Thinking outside the cleft to understand synaptic activity: Contribution of the cystine-glutamate antiporter (system xc−) to normal and pathological glutamatergic signaling. Pharmacol. Rev. 2012, 64, 780–802. [Google Scholar] [CrossRef]
- De Bundel, D.; Schallier, A.; Loyens, E.; Fernando, R.; Miyashita, H.; Van Liefferinge, J.; Vermoesen, K.; Bannai, S.; Sato, H.; Michotte, Y. Loss of system xc− does not induce oxidative stress but decreases extracellular glutamate in hippocampus and influences spatial working memory and limbic seizure susceptibility. J. Neurosci. 2011, 31, 5792–5803. [Google Scholar] [CrossRef]
- Harborne, J. Methods of plant analysis. In Phytochemical Methods: A Guide to Modern Techniques of Plant Analysis; Springer: Berlin/Heidelberg, Germany, 1984; pp. 1–36. [Google Scholar]
- Alotaibi, G.; Rahman, S. Effects of glial glutamate transporter activator in formalin-induced pain behaviour in mice. Eur. J. Pain 2019, 23, 765–783. [Google Scholar] [CrossRef]
- Lee, K.-E.; Cho, K.-O.; Choi, Y.-S.; Kim, S.Y. The neuroprotective mechanism of ampicillin in a mouse model of transient forebrain ischemia. Korean J. Physiol. Pharmacol. Off. J. Korean Physiol. Soc. Korean Soc. Pharmacol. 2016, 20, 185. [Google Scholar] [CrossRef]
- Tatem, K.S.; Quinn, J.L.; Phadke, A.; Yu, Q.; Gordish-Dressman, H.; Nagaraju, K. Behavioral and locomotor measurements using an open field activity monitoring system for skeletal muscle diseases. JoVE (J. Vis. Exp.) 2014, 91, e51785. [Google Scholar]
- Walf, A.A.; Frye, C.A. The use of the elevated plus maze as an assay of anxiety-related behavior in rodents. Nat. Protoc. 2007, 2, 322–328. [Google Scholar] [CrossRef] [PubMed]
- Lueptow, L.M. Novel object recognition test for the investigation of learning and memory in mice. JoVE (J. Vis. Exp.) 2017, 126, e55718. [Google Scholar]
- Abd-Elrahman, K.S.; Hamilton, A.; Albaker, A.; Ferguson, S.S. mGluR5 contribution to neuropathology in Alzheimer mice is disease stage-dependent. ACS Pharmacol. Transl. Sci. 2020, 3, 334–344. [Google Scholar] [CrossRef]
- Paxinos, G.; Franklin, K.B. Paxinos and Franklin’s the Mouse Brain in Stereotaxic Coordinates; Academic Press: Cambridge, MA, USA, 2019. [Google Scholar]
- Alasmari, F.; Alotibi, F.M.; Alqahtani, F.; Alshammari, T.K.; Kadi, A.A.; Alghamdi, A.M.; Allahem, B.S.; Alasmari, A.F.; Alsharari, S.D.; Al-Rejaie, S.S. Effects of Chronic Inhalation of Electronic Cigarette Vapor Containing Nicotine on Neurobehaviors and Pre/Postsynaptic Neuron Markers. Toxics 2022, 10, 338. [Google Scholar] [CrossRef] [PubMed]
- Raval, A.P.; Dave, K.R.; Mochly-Rosen, D.; Sick, T.J.; Pérez-Pinzón, M.A. εPKC is required for the induction of tolerance by ischemic and NMDA-mediated preconditioning in the organotypic hippocampal slice. J. Neurosci. 2003, 23, 384–391. [Google Scholar] [CrossRef] [PubMed]
- Koehler, D.; Shah, Z.A.; Williams, F.E. The GSK3β inhibitor, TDZD-8, rescues cognition in a zebrafish model of okadaic acid-induced Alzheimer’s disease. Neurochem. Int. 2019, 122, 31–37. [Google Scholar] [CrossRef]
- Li, J.; Olinger, A.; Dassow, M.; Abel, M. Up-regulation of GABAB receptor mRNA and protein in the hippocampus of cocaine-and lidocaine-kindled rats. Neuroscience 2003, 118, 451–462. [Google Scholar] [CrossRef] [PubMed]
- Devoto, V.P.; Bogetti, M.E.; de Plazas, S.F. Developmental and hypoxia-induced cell death share common ultrastructural and biochemical apoptotic features in the central nervous system. Neuroscience 2013, 252, 190–200. [Google Scholar] [CrossRef] [PubMed]
- Mohamed, K.M.; Al-Hazmi, A.H.; Alasiri, A.M.; Ali, M.E.-S. A GC–MS method for detection and quantification of cathine, cathinone, methcathinone and ephedrine in oral fluid. J. Chromatogr. Sci. 2016, 54, 1271–1276. [Google Scholar] [CrossRef] [PubMed]


Disclaimer/Publisher’s Note: The statements, opinions and data contained in all publications are solely those of the individual author(s) and contributor(s) and not of MDPI and/or the editor(s). MDPI and/or the editor(s) disclaim responsibility for any injury to people or property resulting from any ideas, methods, instructions or products referred to in the content. |
© 2023 by the authors. Licensee MDPI, Basel, Switzerland. This article is an open access article distributed under the terms and conditions of the Creative Commons Attribution (CC BY) license (https://creativecommons.org/licenses/by/4.0/).
Share and Cite
Arab, A.O.; Alasmari, F.; Albaker, A.B.; Alhazmi, H.A.; Alameen, A.A.; Alagail, N.M.; Alwaeli, S.A.; Rizwan Ahamad, S.; AlAsmari, A.F.; AlSharari, S.D. Clavulanic Acid Improves Memory Dysfunction and Anxiety Behaviors through Upregulating Glutamatergic Transporters in the Nucleus Accumbens of Mice Repeatedly Exposed to Khat Extract. Int. J. Mol. Sci. 2023, 24, 15657. https://doi.org/10.3390/ijms242115657
Arab AO, Alasmari F, Albaker AB, Alhazmi HA, Alameen AA, Alagail NM, Alwaeli SA, Rizwan Ahamad S, AlAsmari AF, AlSharari SD. Clavulanic Acid Improves Memory Dysfunction and Anxiety Behaviors through Upregulating Glutamatergic Transporters in the Nucleus Accumbens of Mice Repeatedly Exposed to Khat Extract. International Journal of Molecular Sciences. 2023; 24(21):15657. https://doi.org/10.3390/ijms242115657
Chicago/Turabian StyleArab, Amal O., Fawaz Alasmari, Awatif B. Albaker, Hassan A. Alhazmi, Alaa Alnoor Alameen, Naser M. Alagail, Saleh A. Alwaeli, Syed Rizwan Ahamad, Abdullah F. AlAsmari, and Shakir D. AlSharari. 2023. "Clavulanic Acid Improves Memory Dysfunction and Anxiety Behaviors through Upregulating Glutamatergic Transporters in the Nucleus Accumbens of Mice Repeatedly Exposed to Khat Extract" International Journal of Molecular Sciences 24, no. 21: 15657. https://doi.org/10.3390/ijms242115657
APA StyleArab, A. O., Alasmari, F., Albaker, A. B., Alhazmi, H. A., Alameen, A. A., Alagail, N. M., Alwaeli, S. A., Rizwan Ahamad, S., AlAsmari, A. F., & AlSharari, S. D. (2023). Clavulanic Acid Improves Memory Dysfunction and Anxiety Behaviors through Upregulating Glutamatergic Transporters in the Nucleus Accumbens of Mice Repeatedly Exposed to Khat Extract. International Journal of Molecular Sciences, 24(21), 15657. https://doi.org/10.3390/ijms242115657