

Study of the Structural Chemistry of the Inclusion Complexation of 4-Phenylbutyrate and Related Compounds with Cyclodextrins in Solution: Differences in Inclusion Mode with Cavity Size Dependency

 , , and
Abstract
:1. Introduction
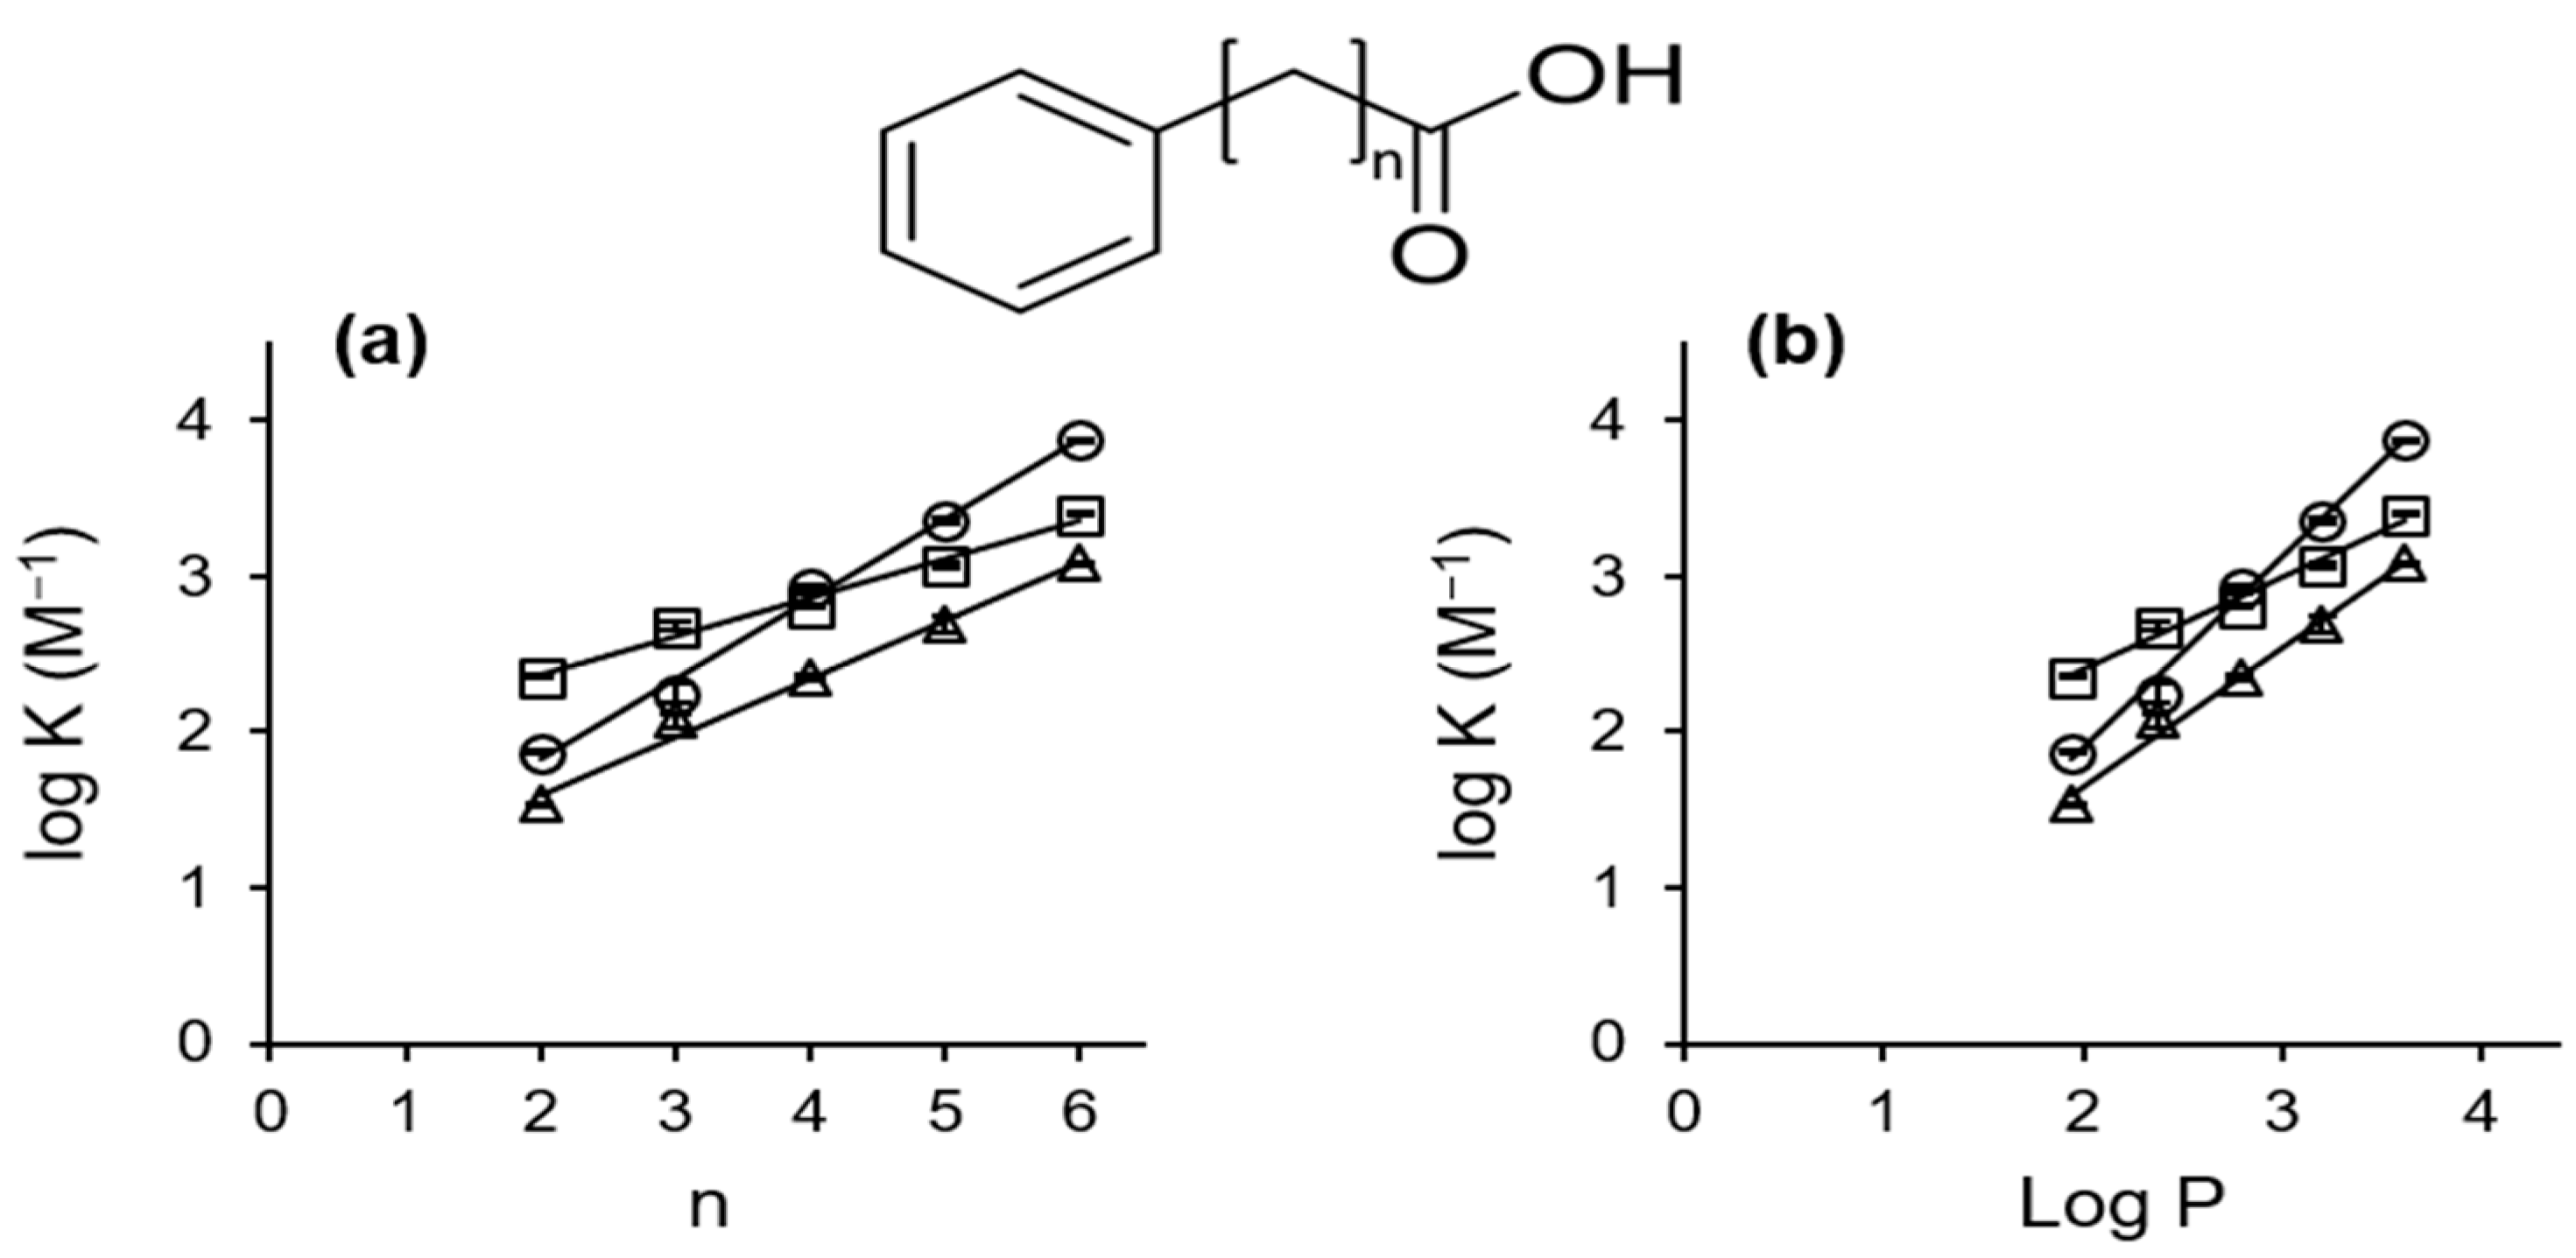
2. Results and Discussion
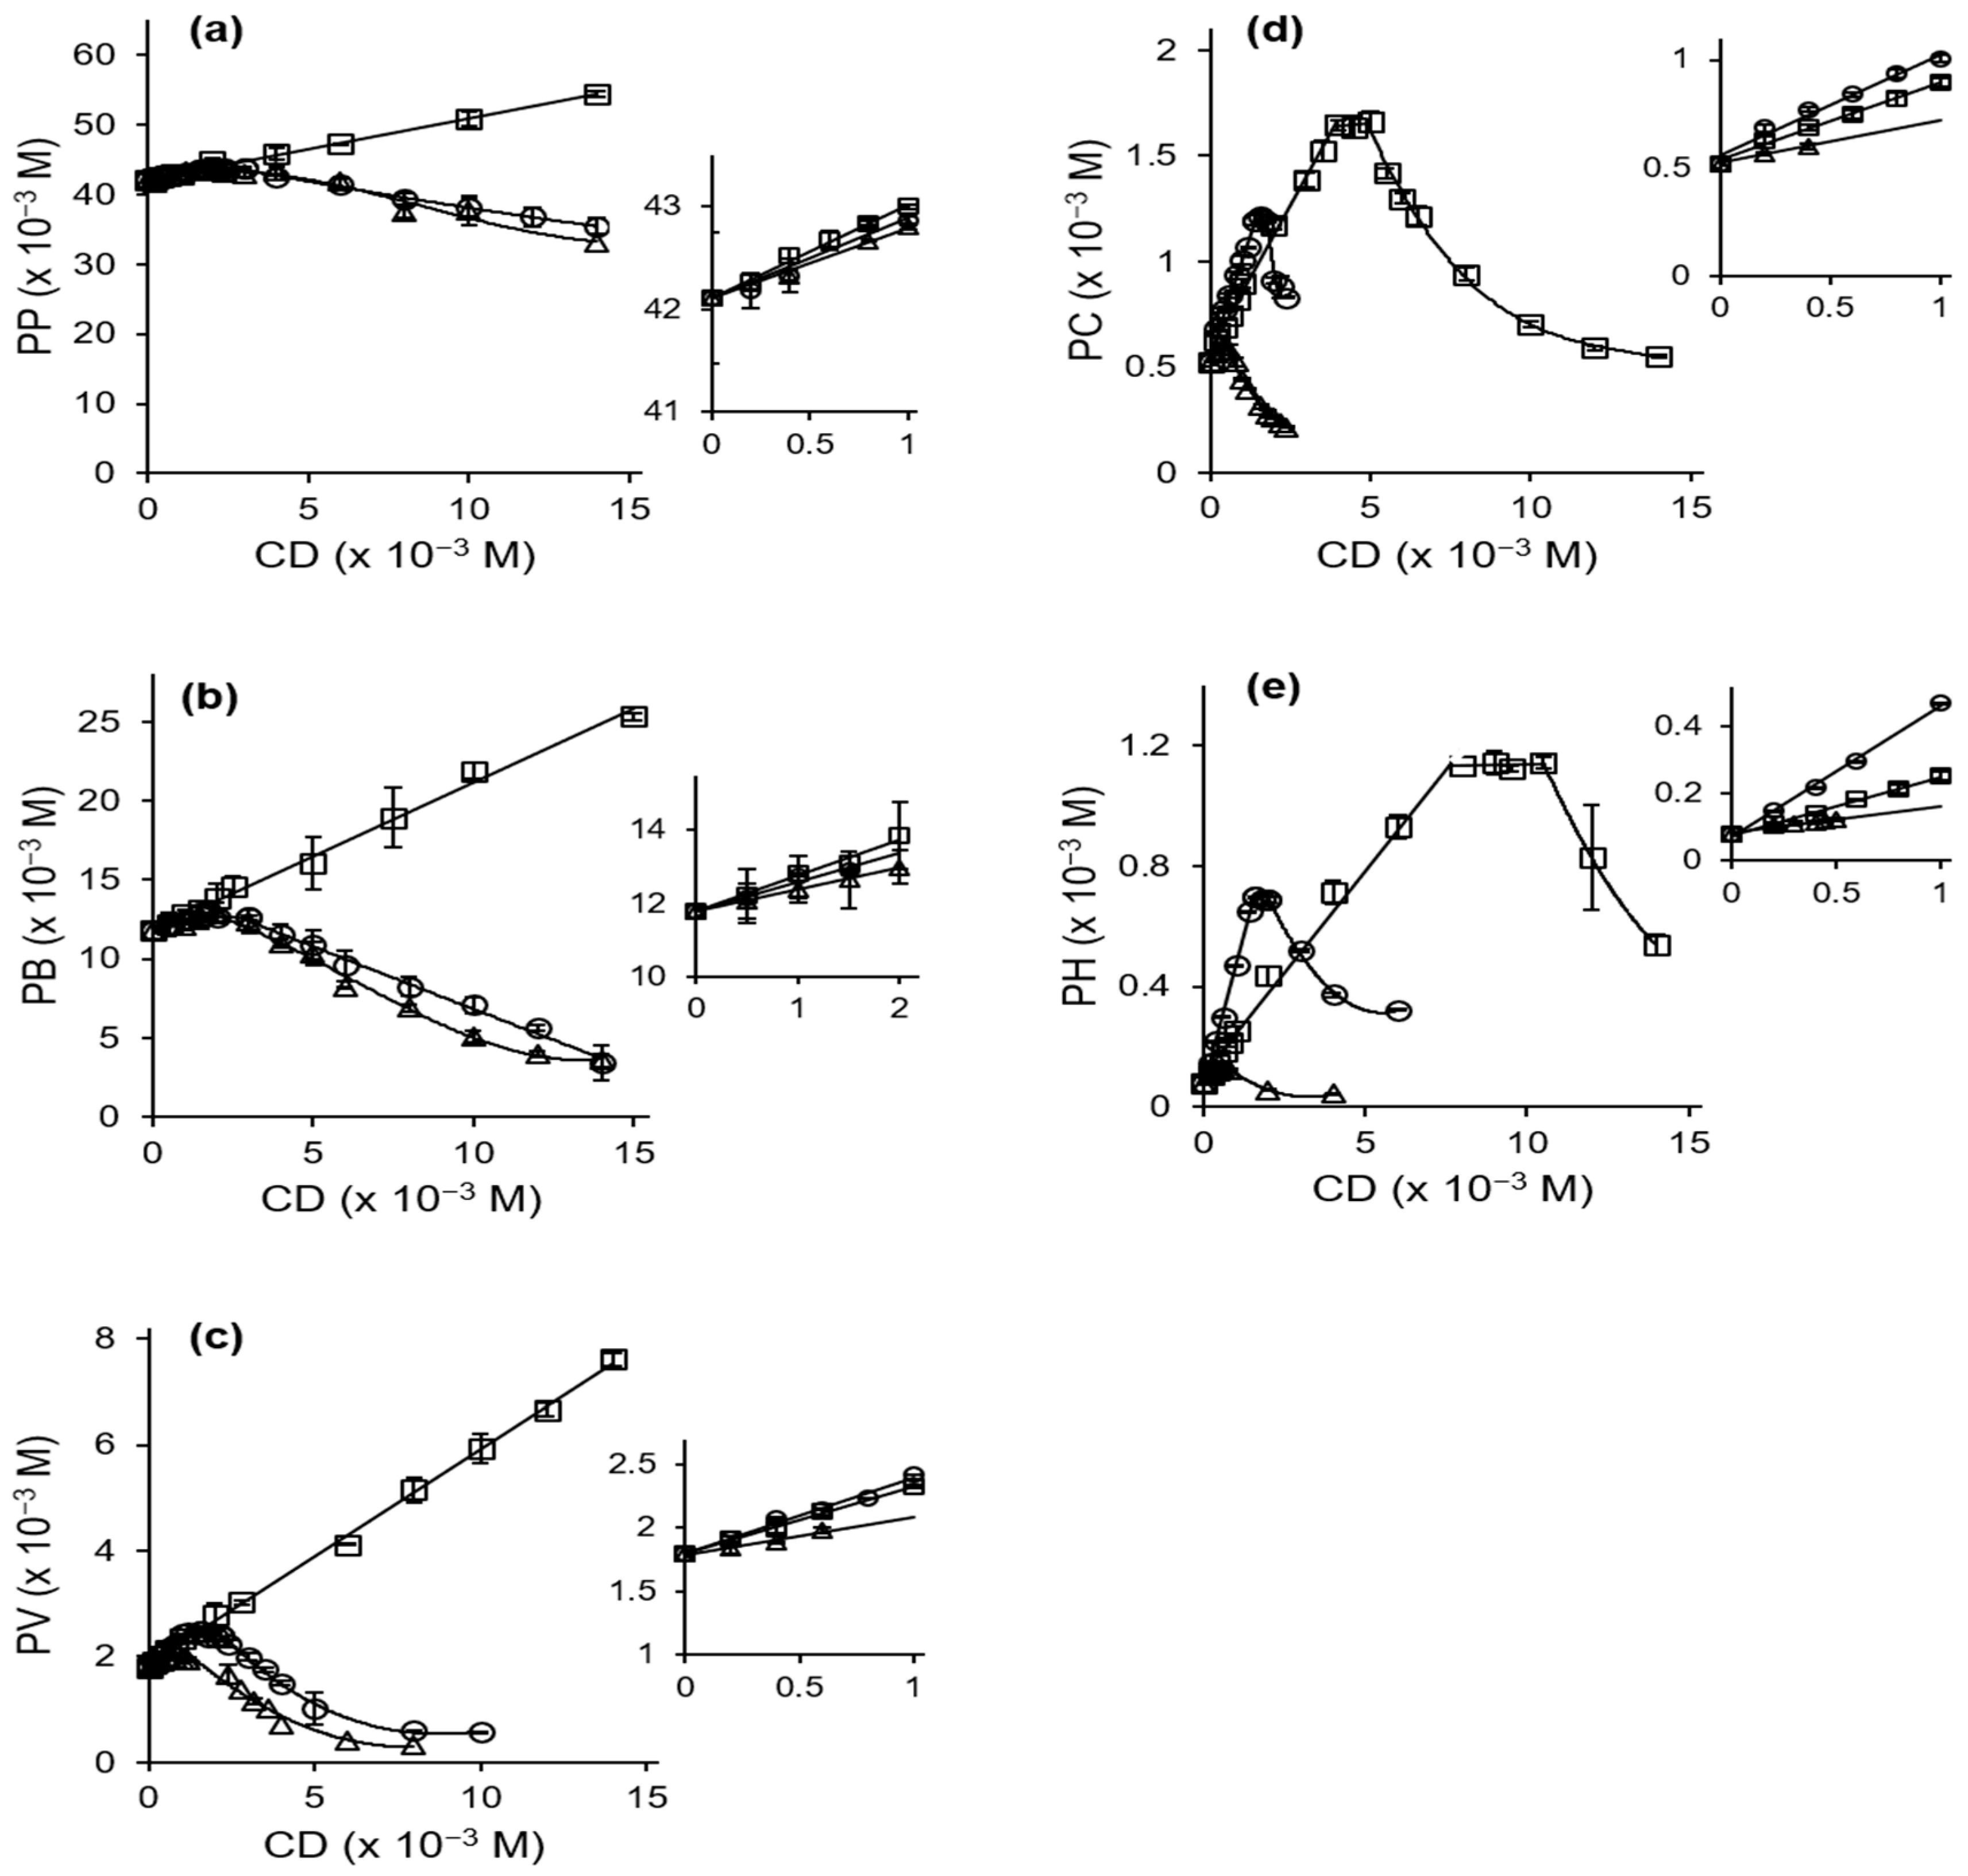
2.1. Phase Solubility Studies
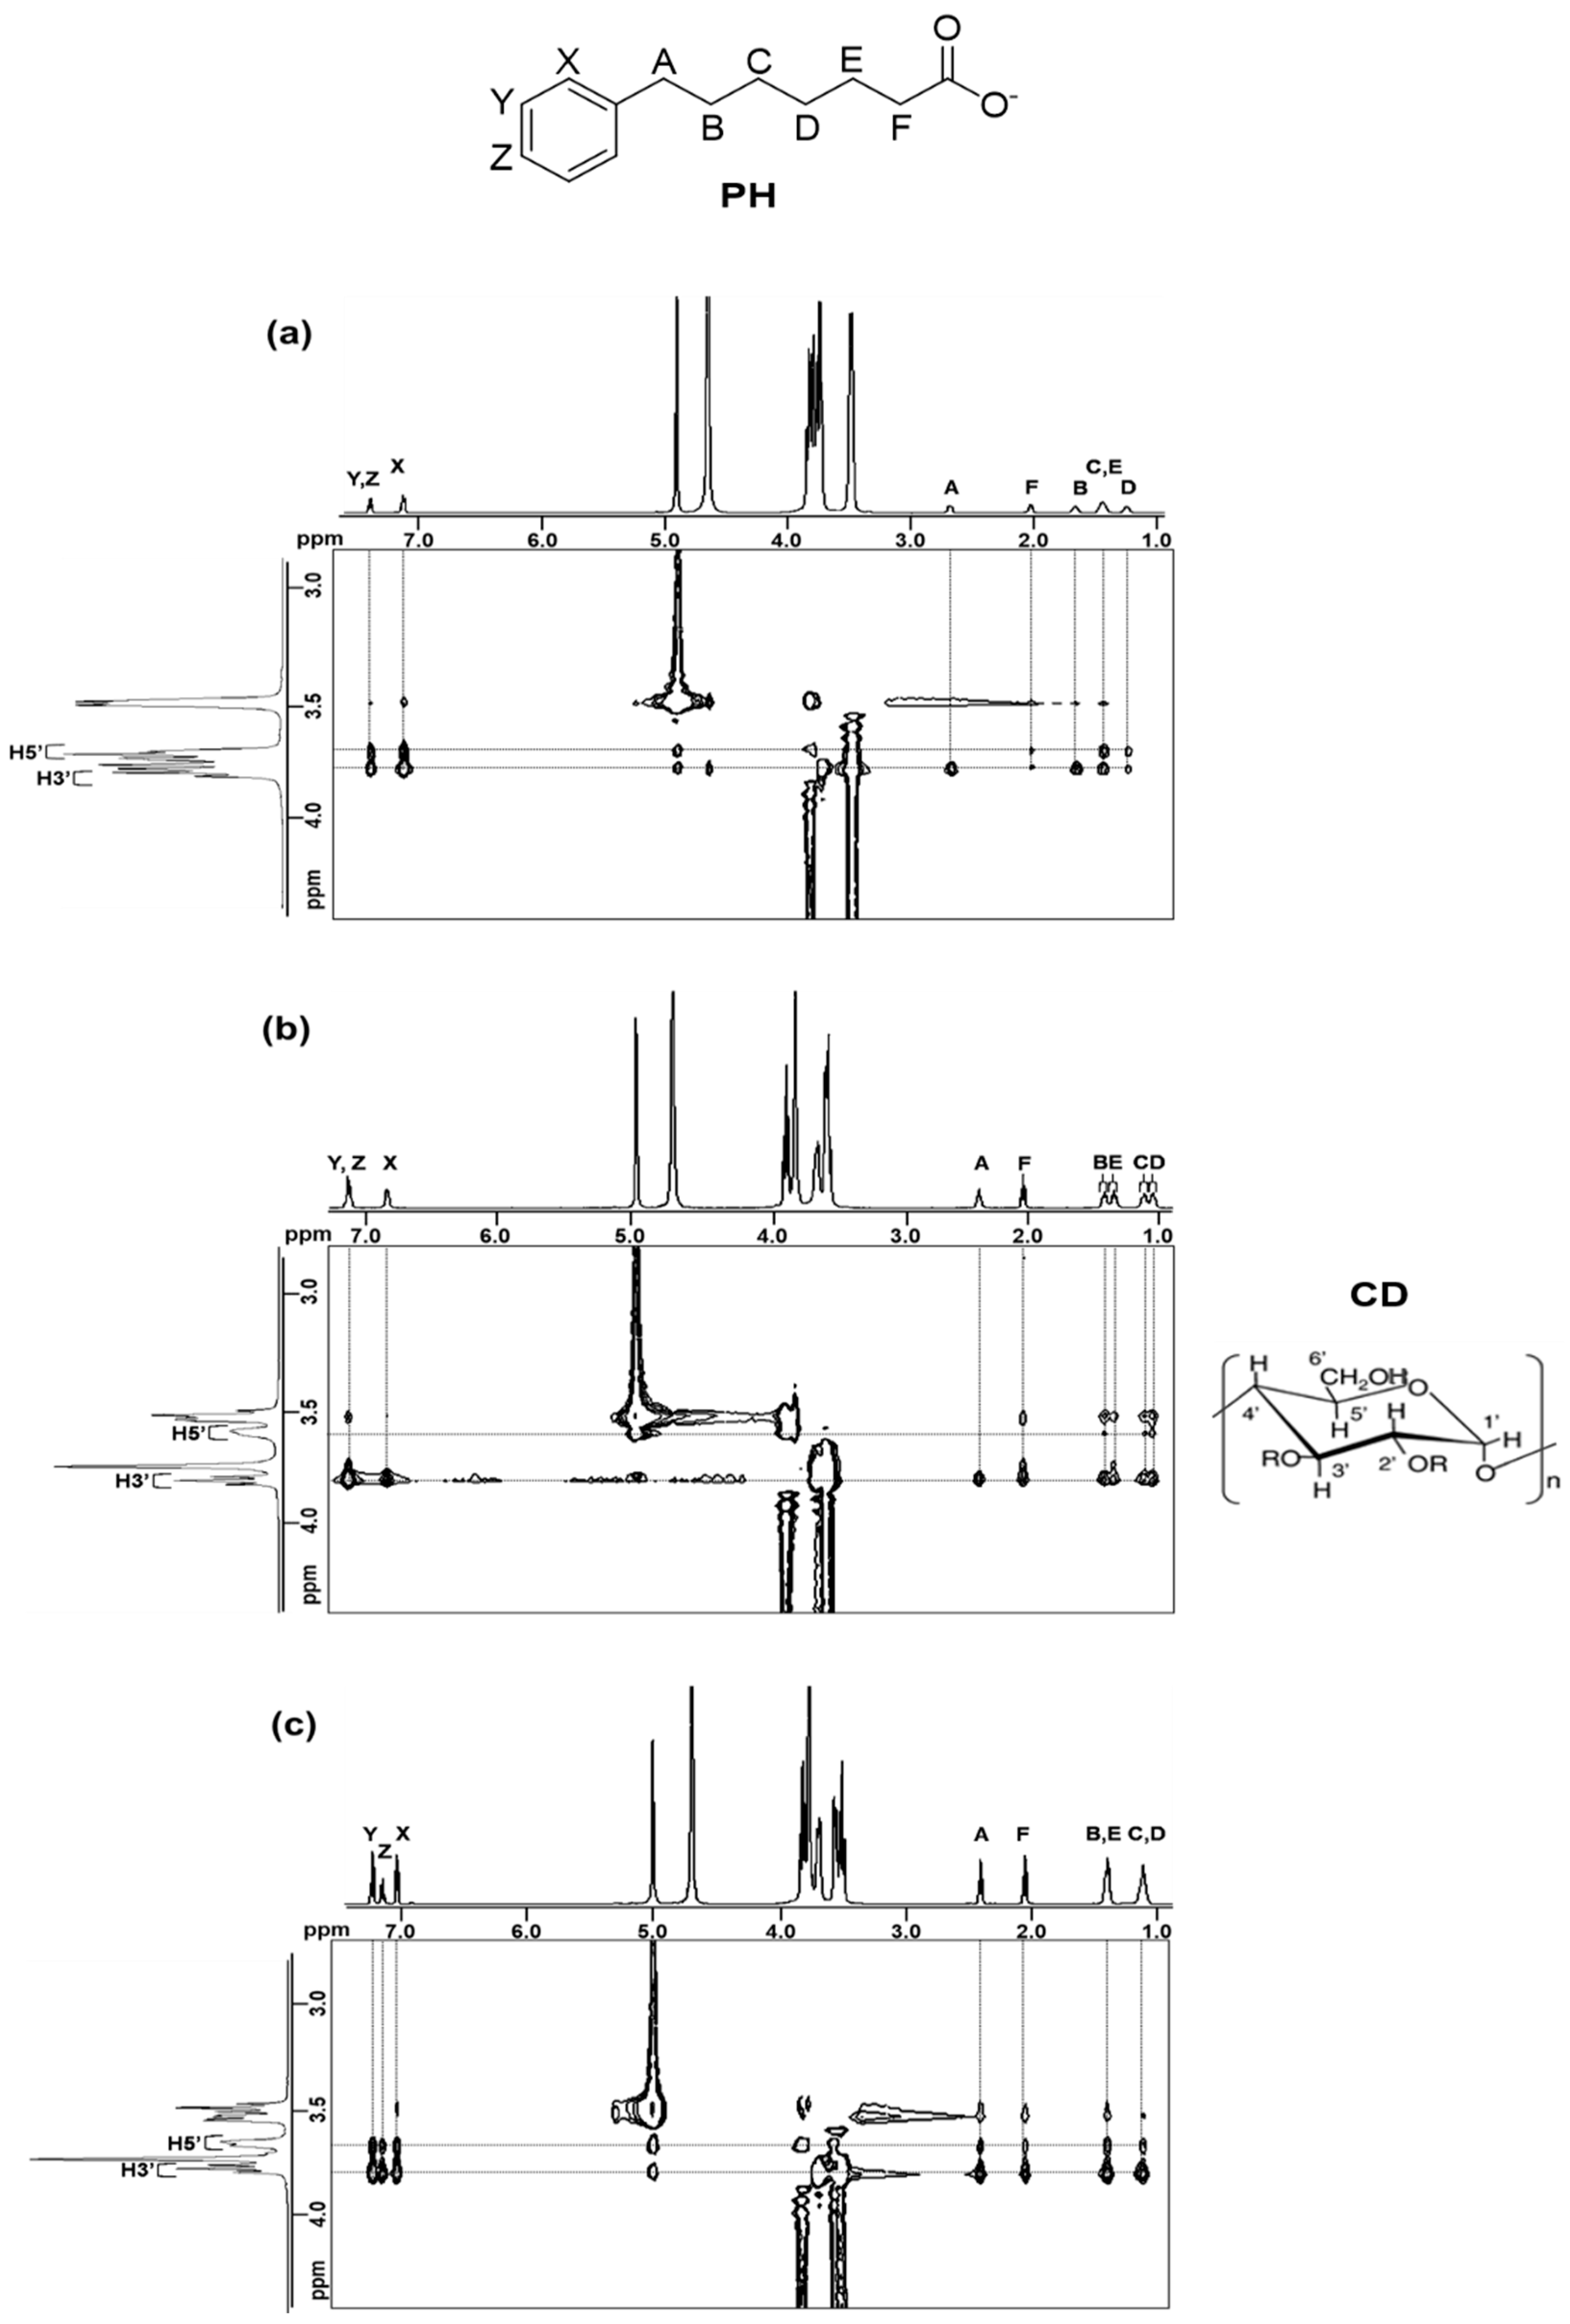
2.2. 1H NMR Spectroscopy
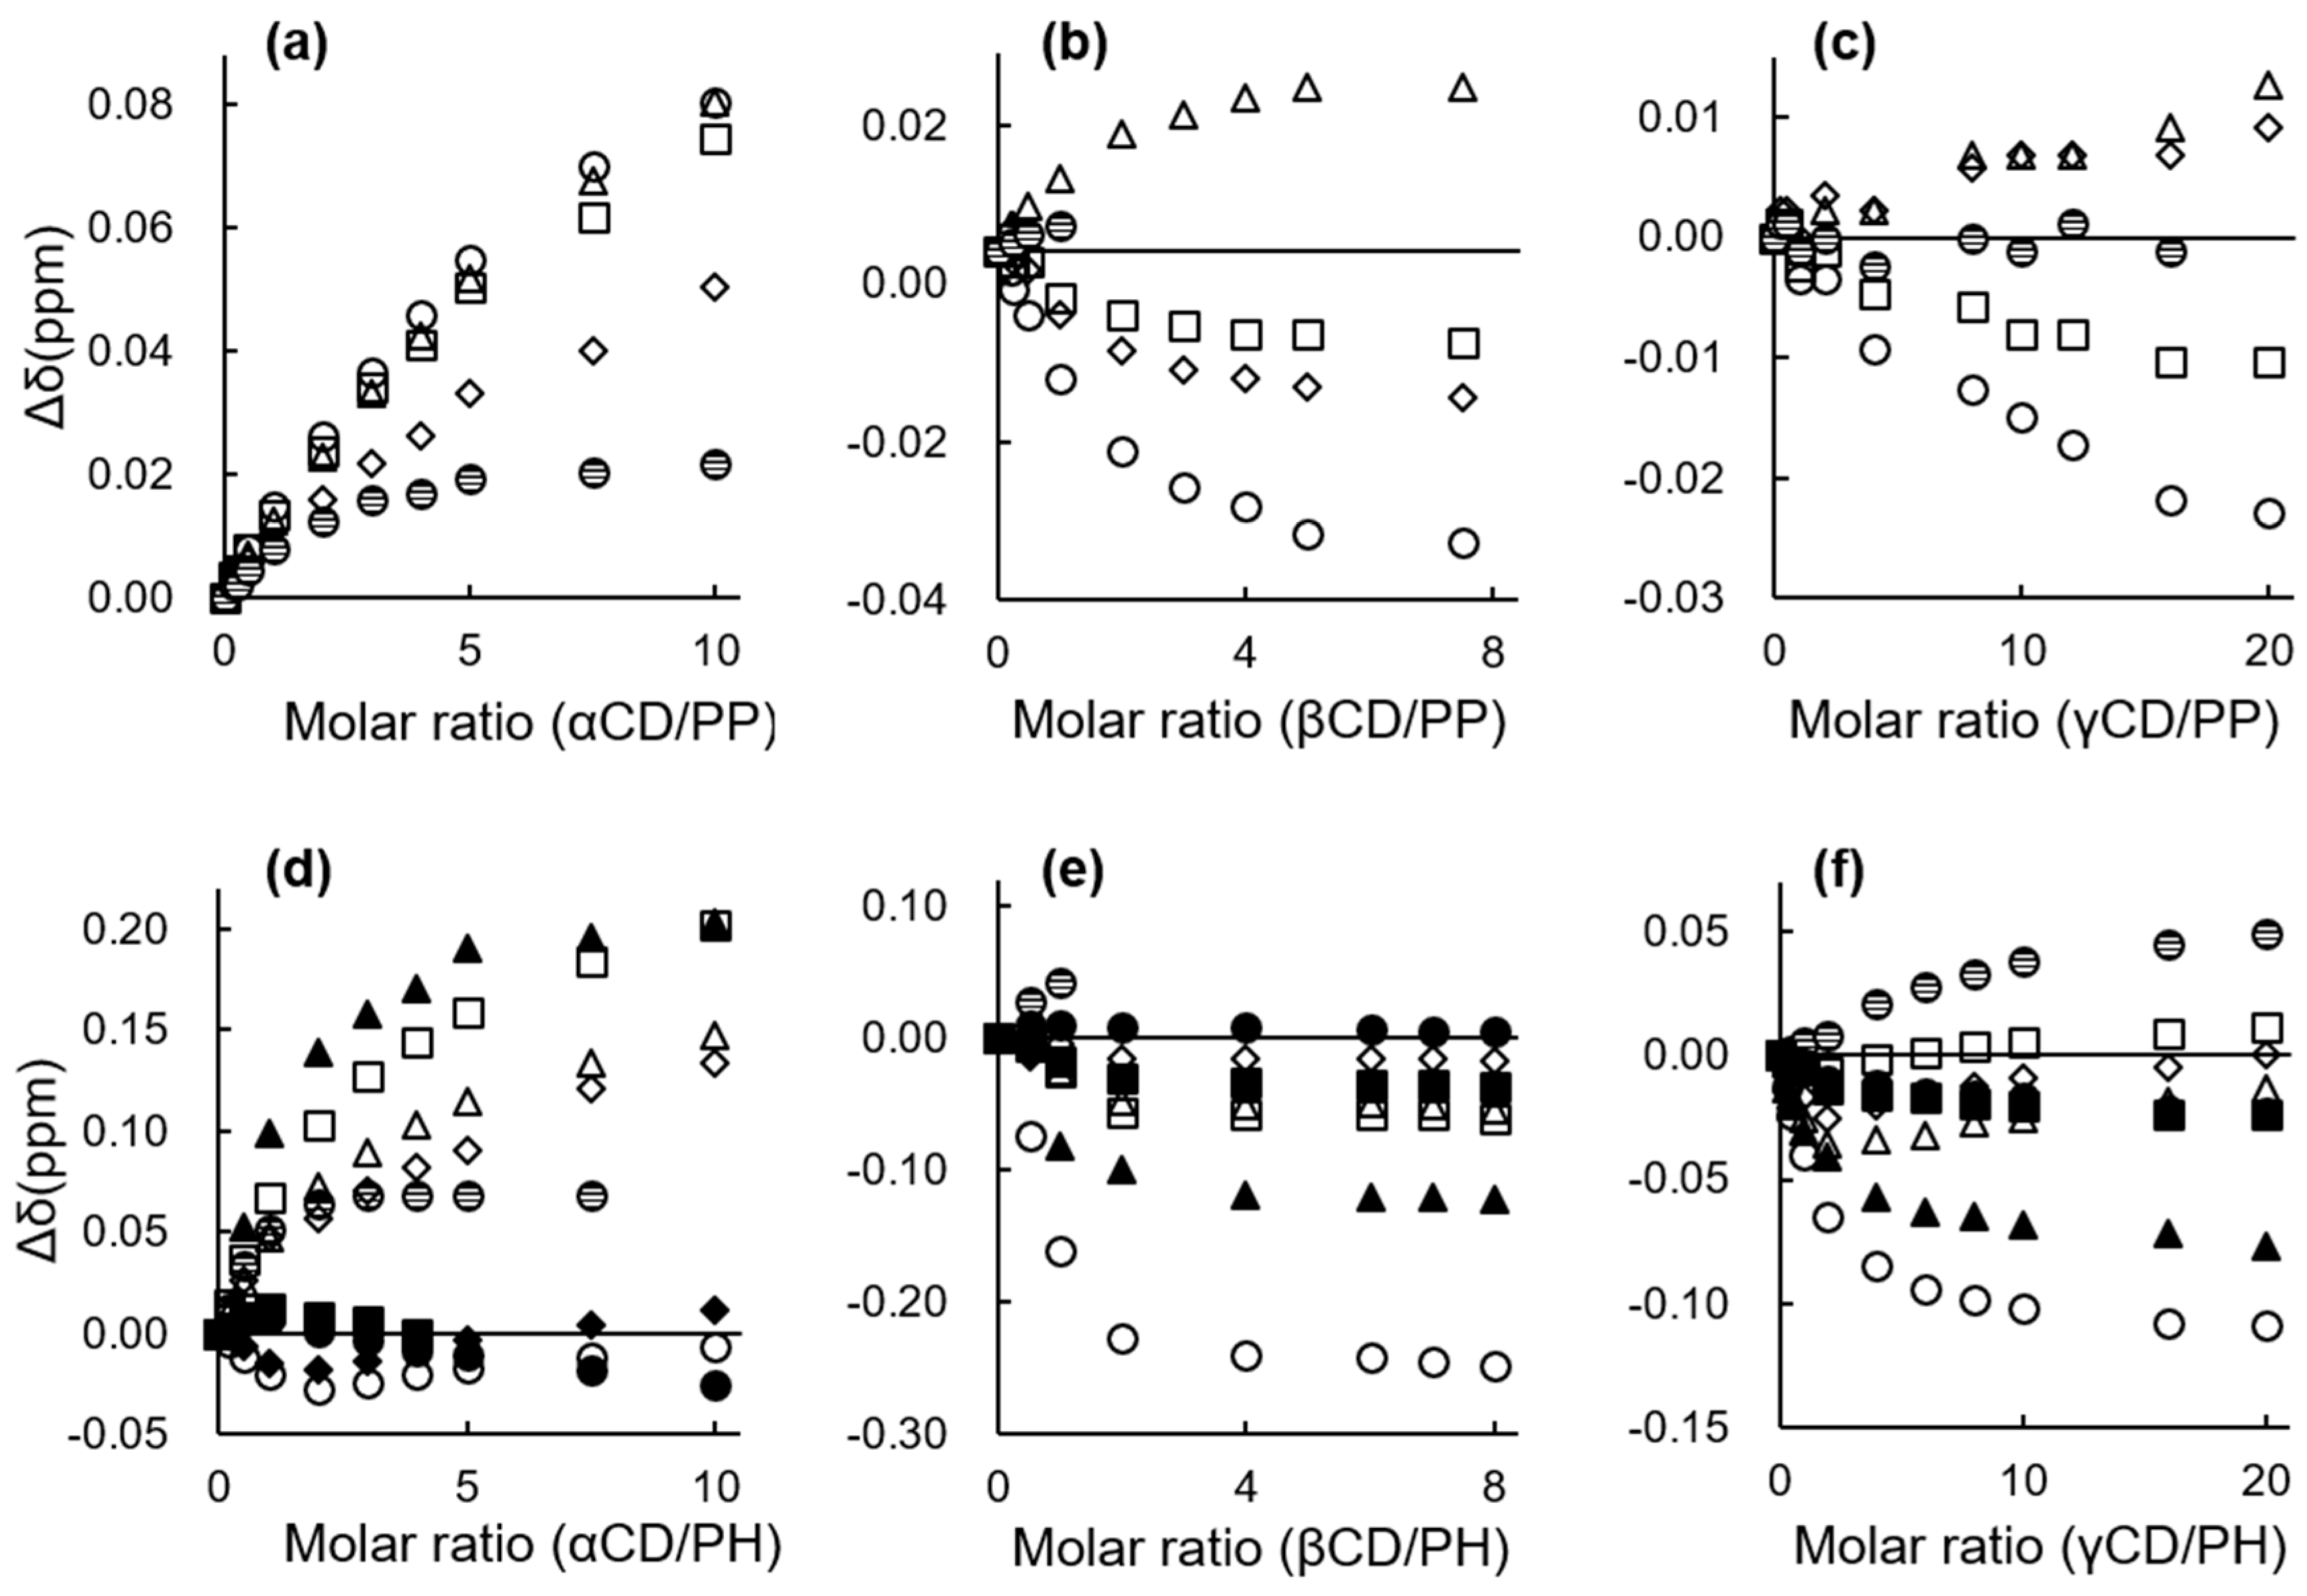
2.2.1. 1H NMR Chemical Shift Changes
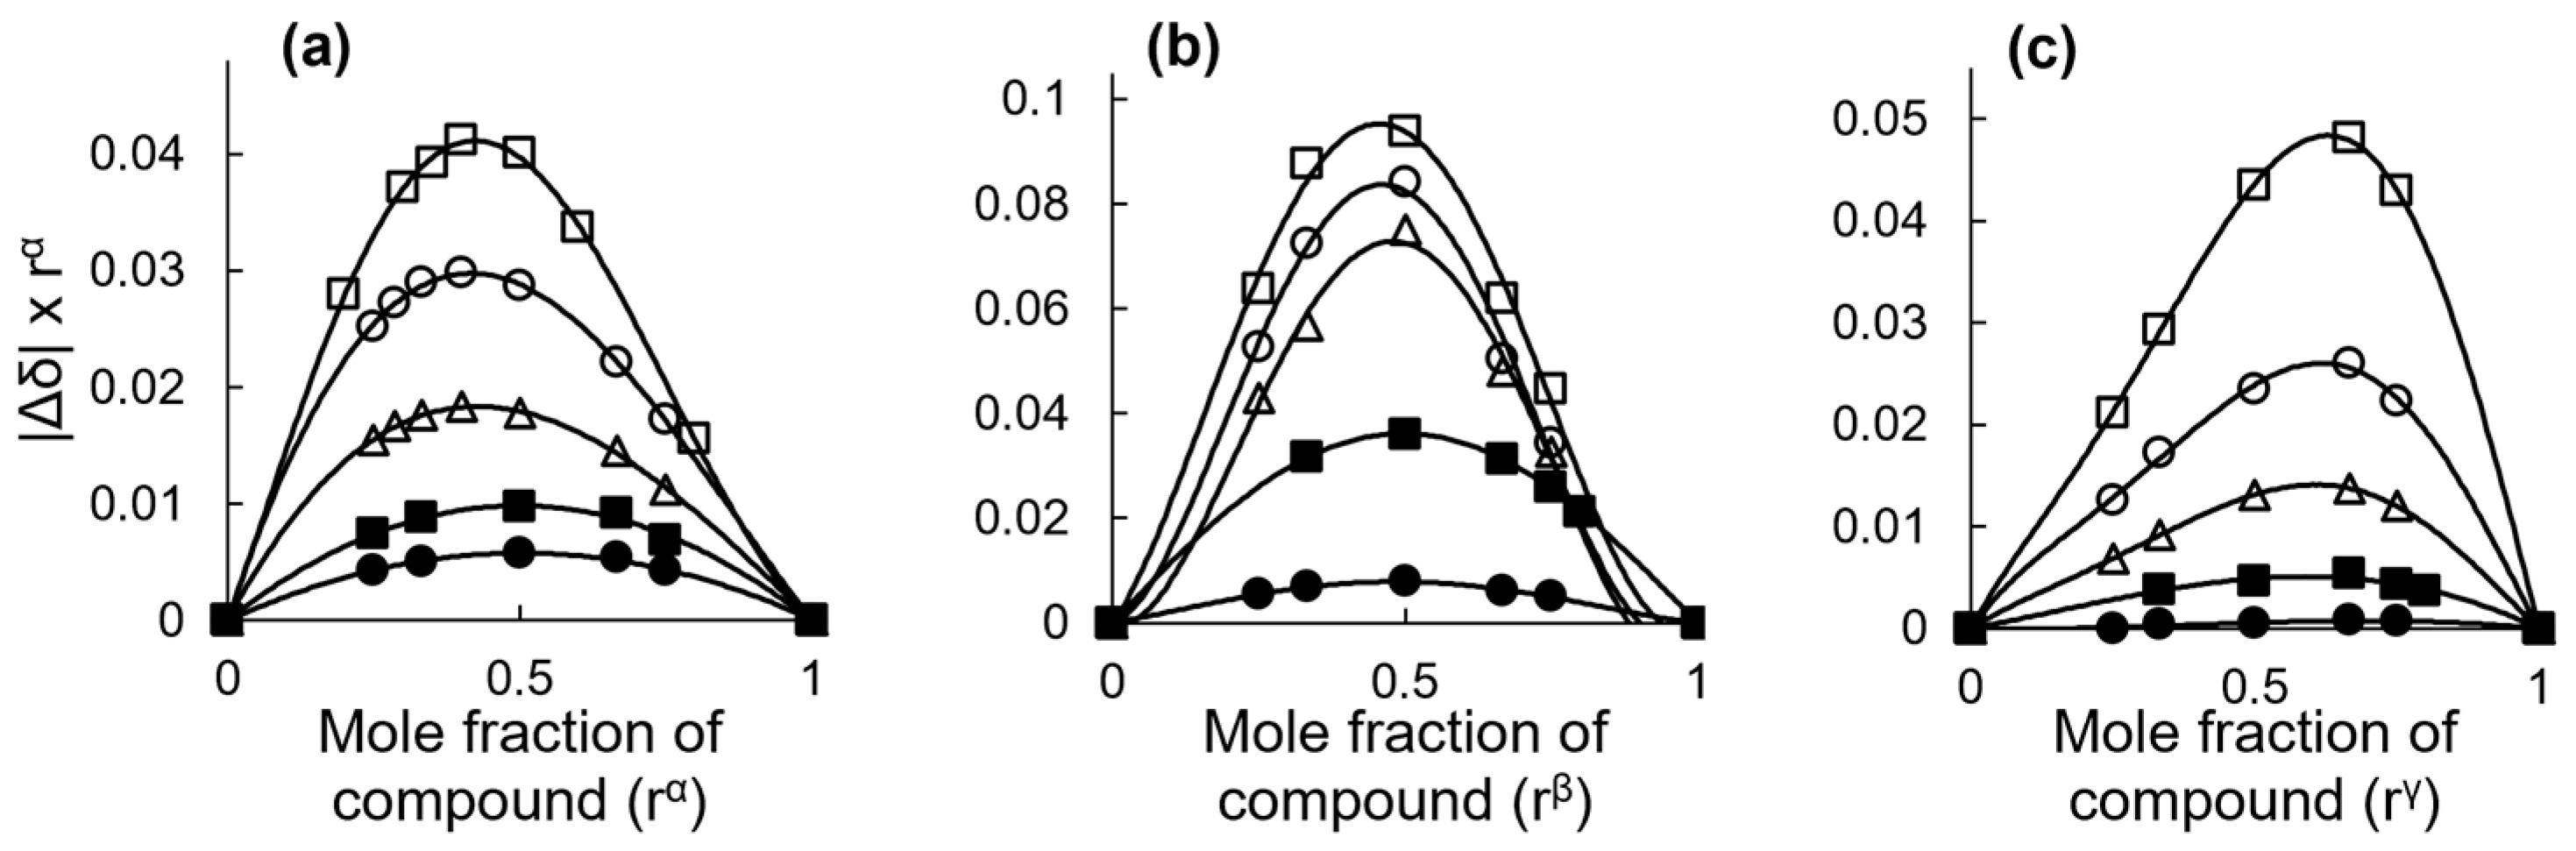
2.2.2. Stoichiometry and Inclusion Equilibrium
2.2.3. 2D ROESY Spectroscopy
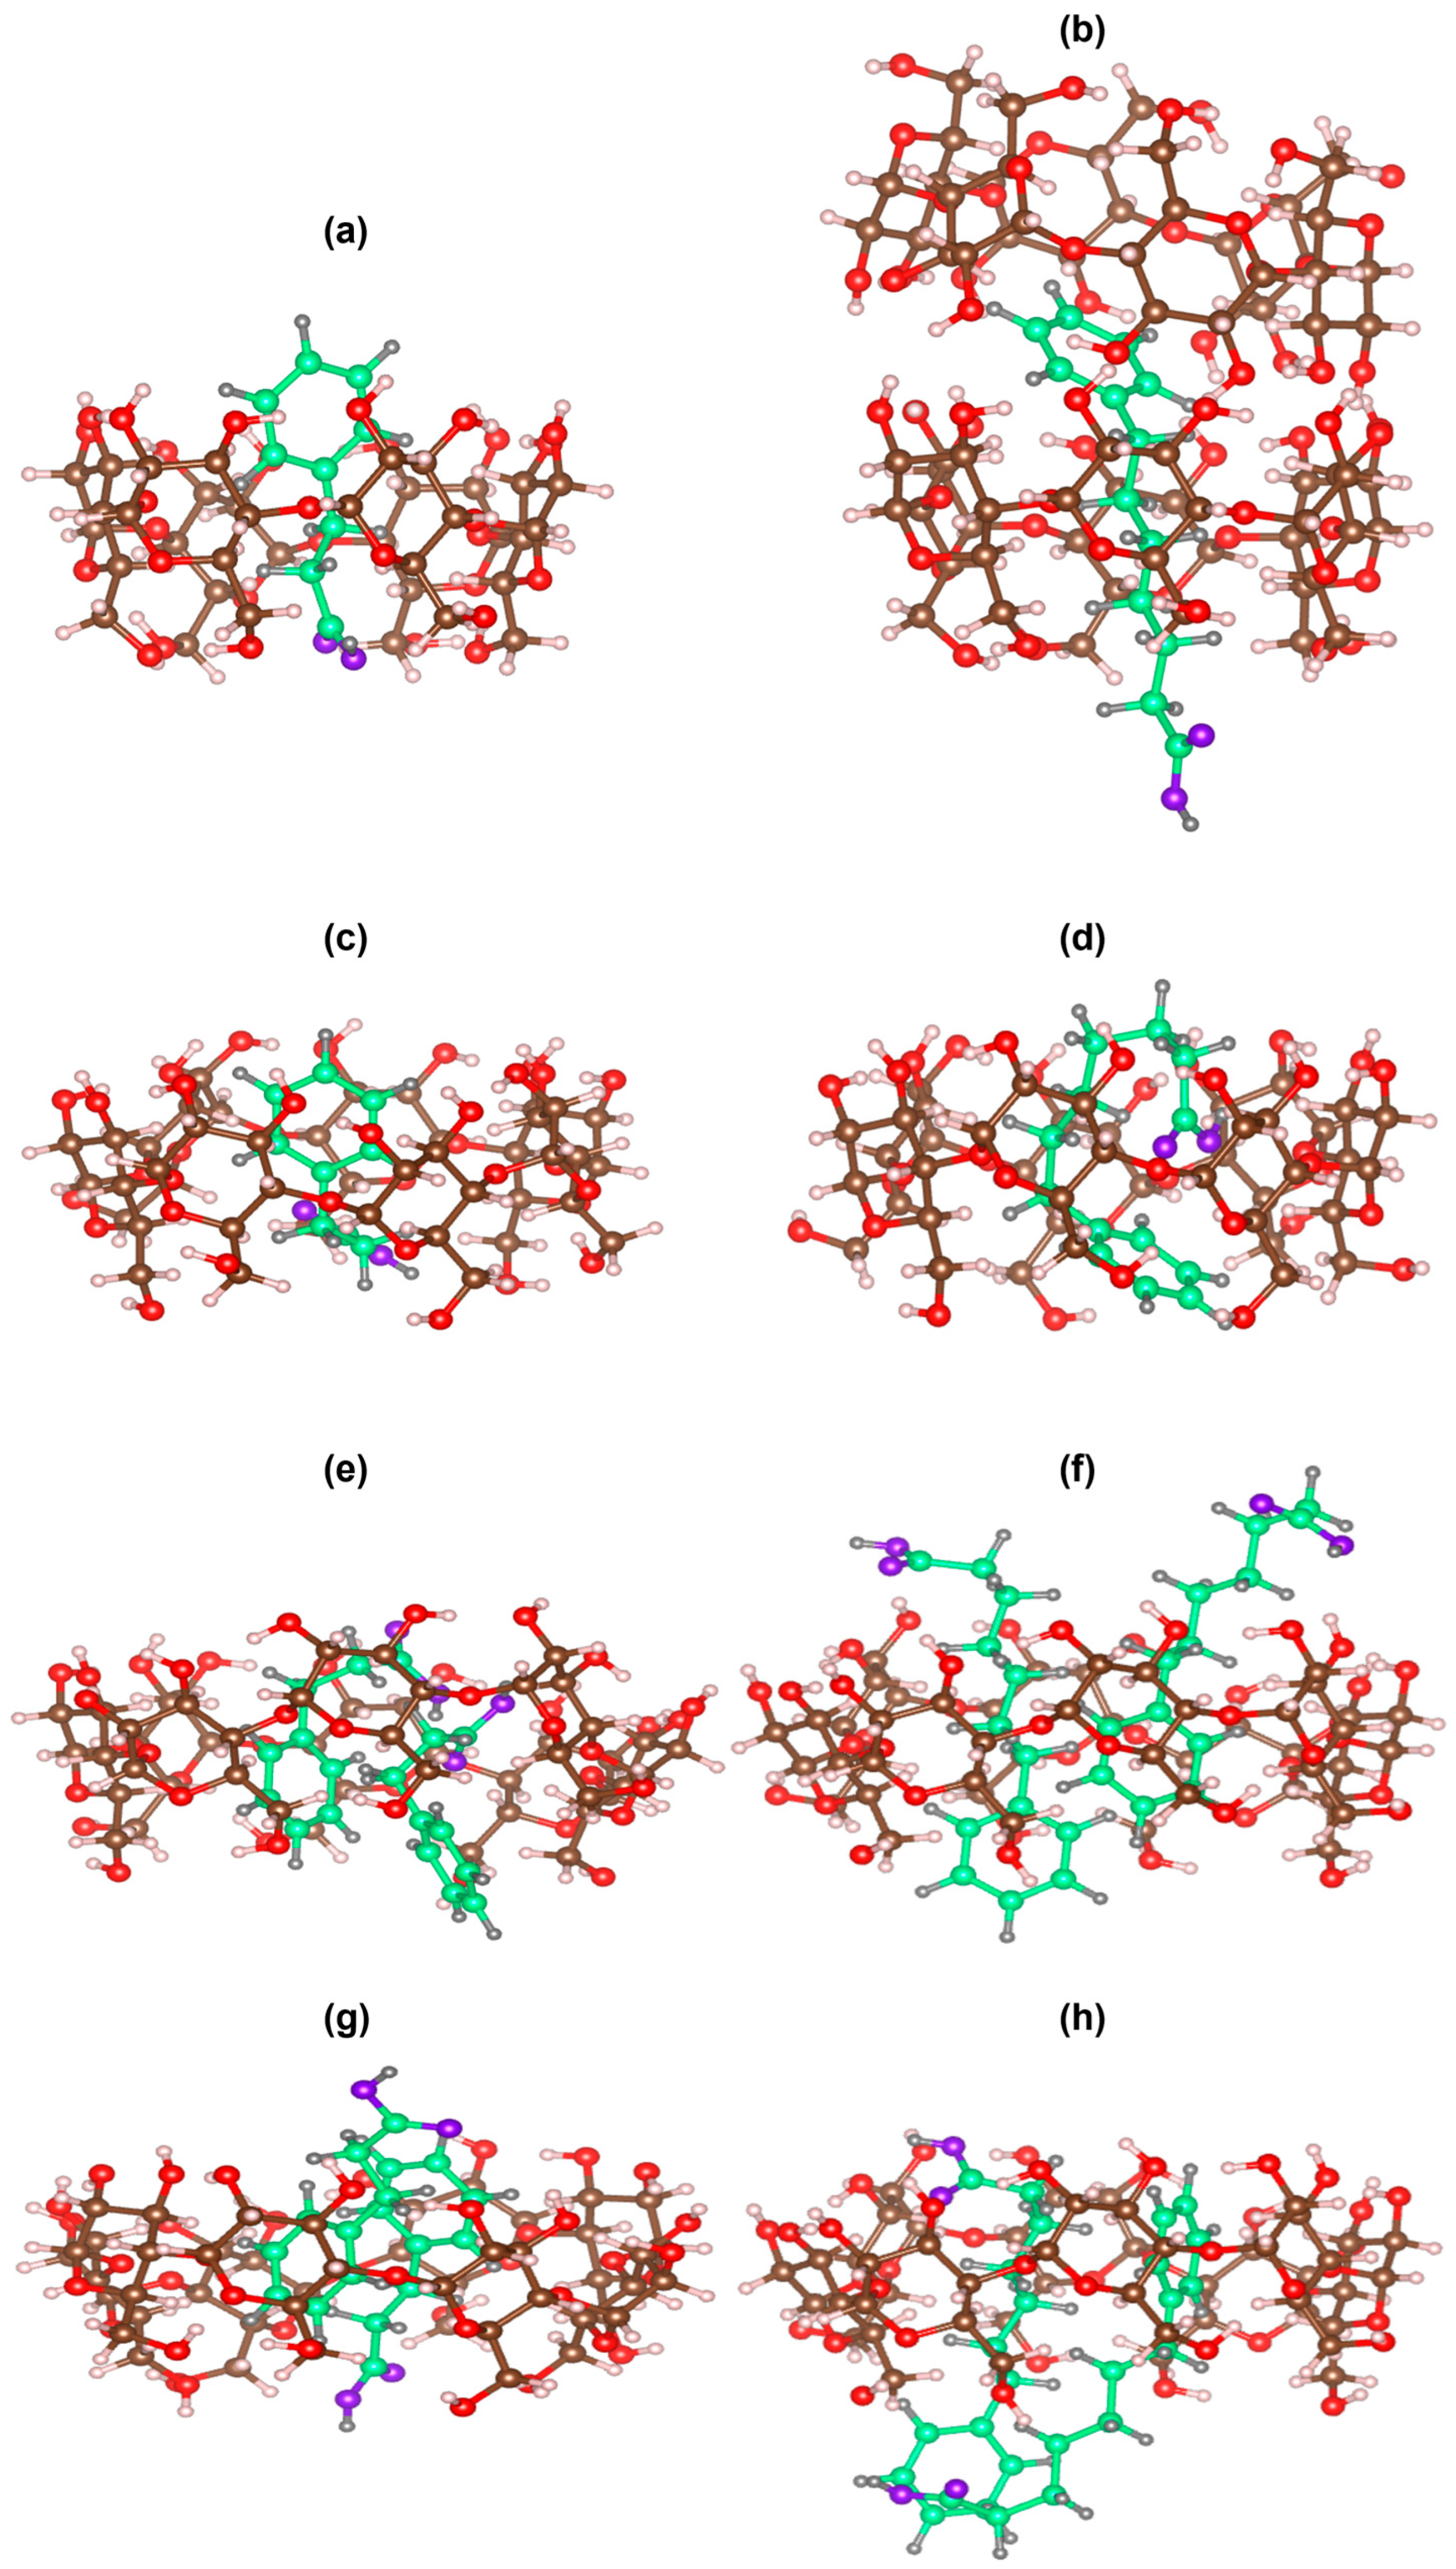
2.3. Molecular Modeling
3. Materials and Methods
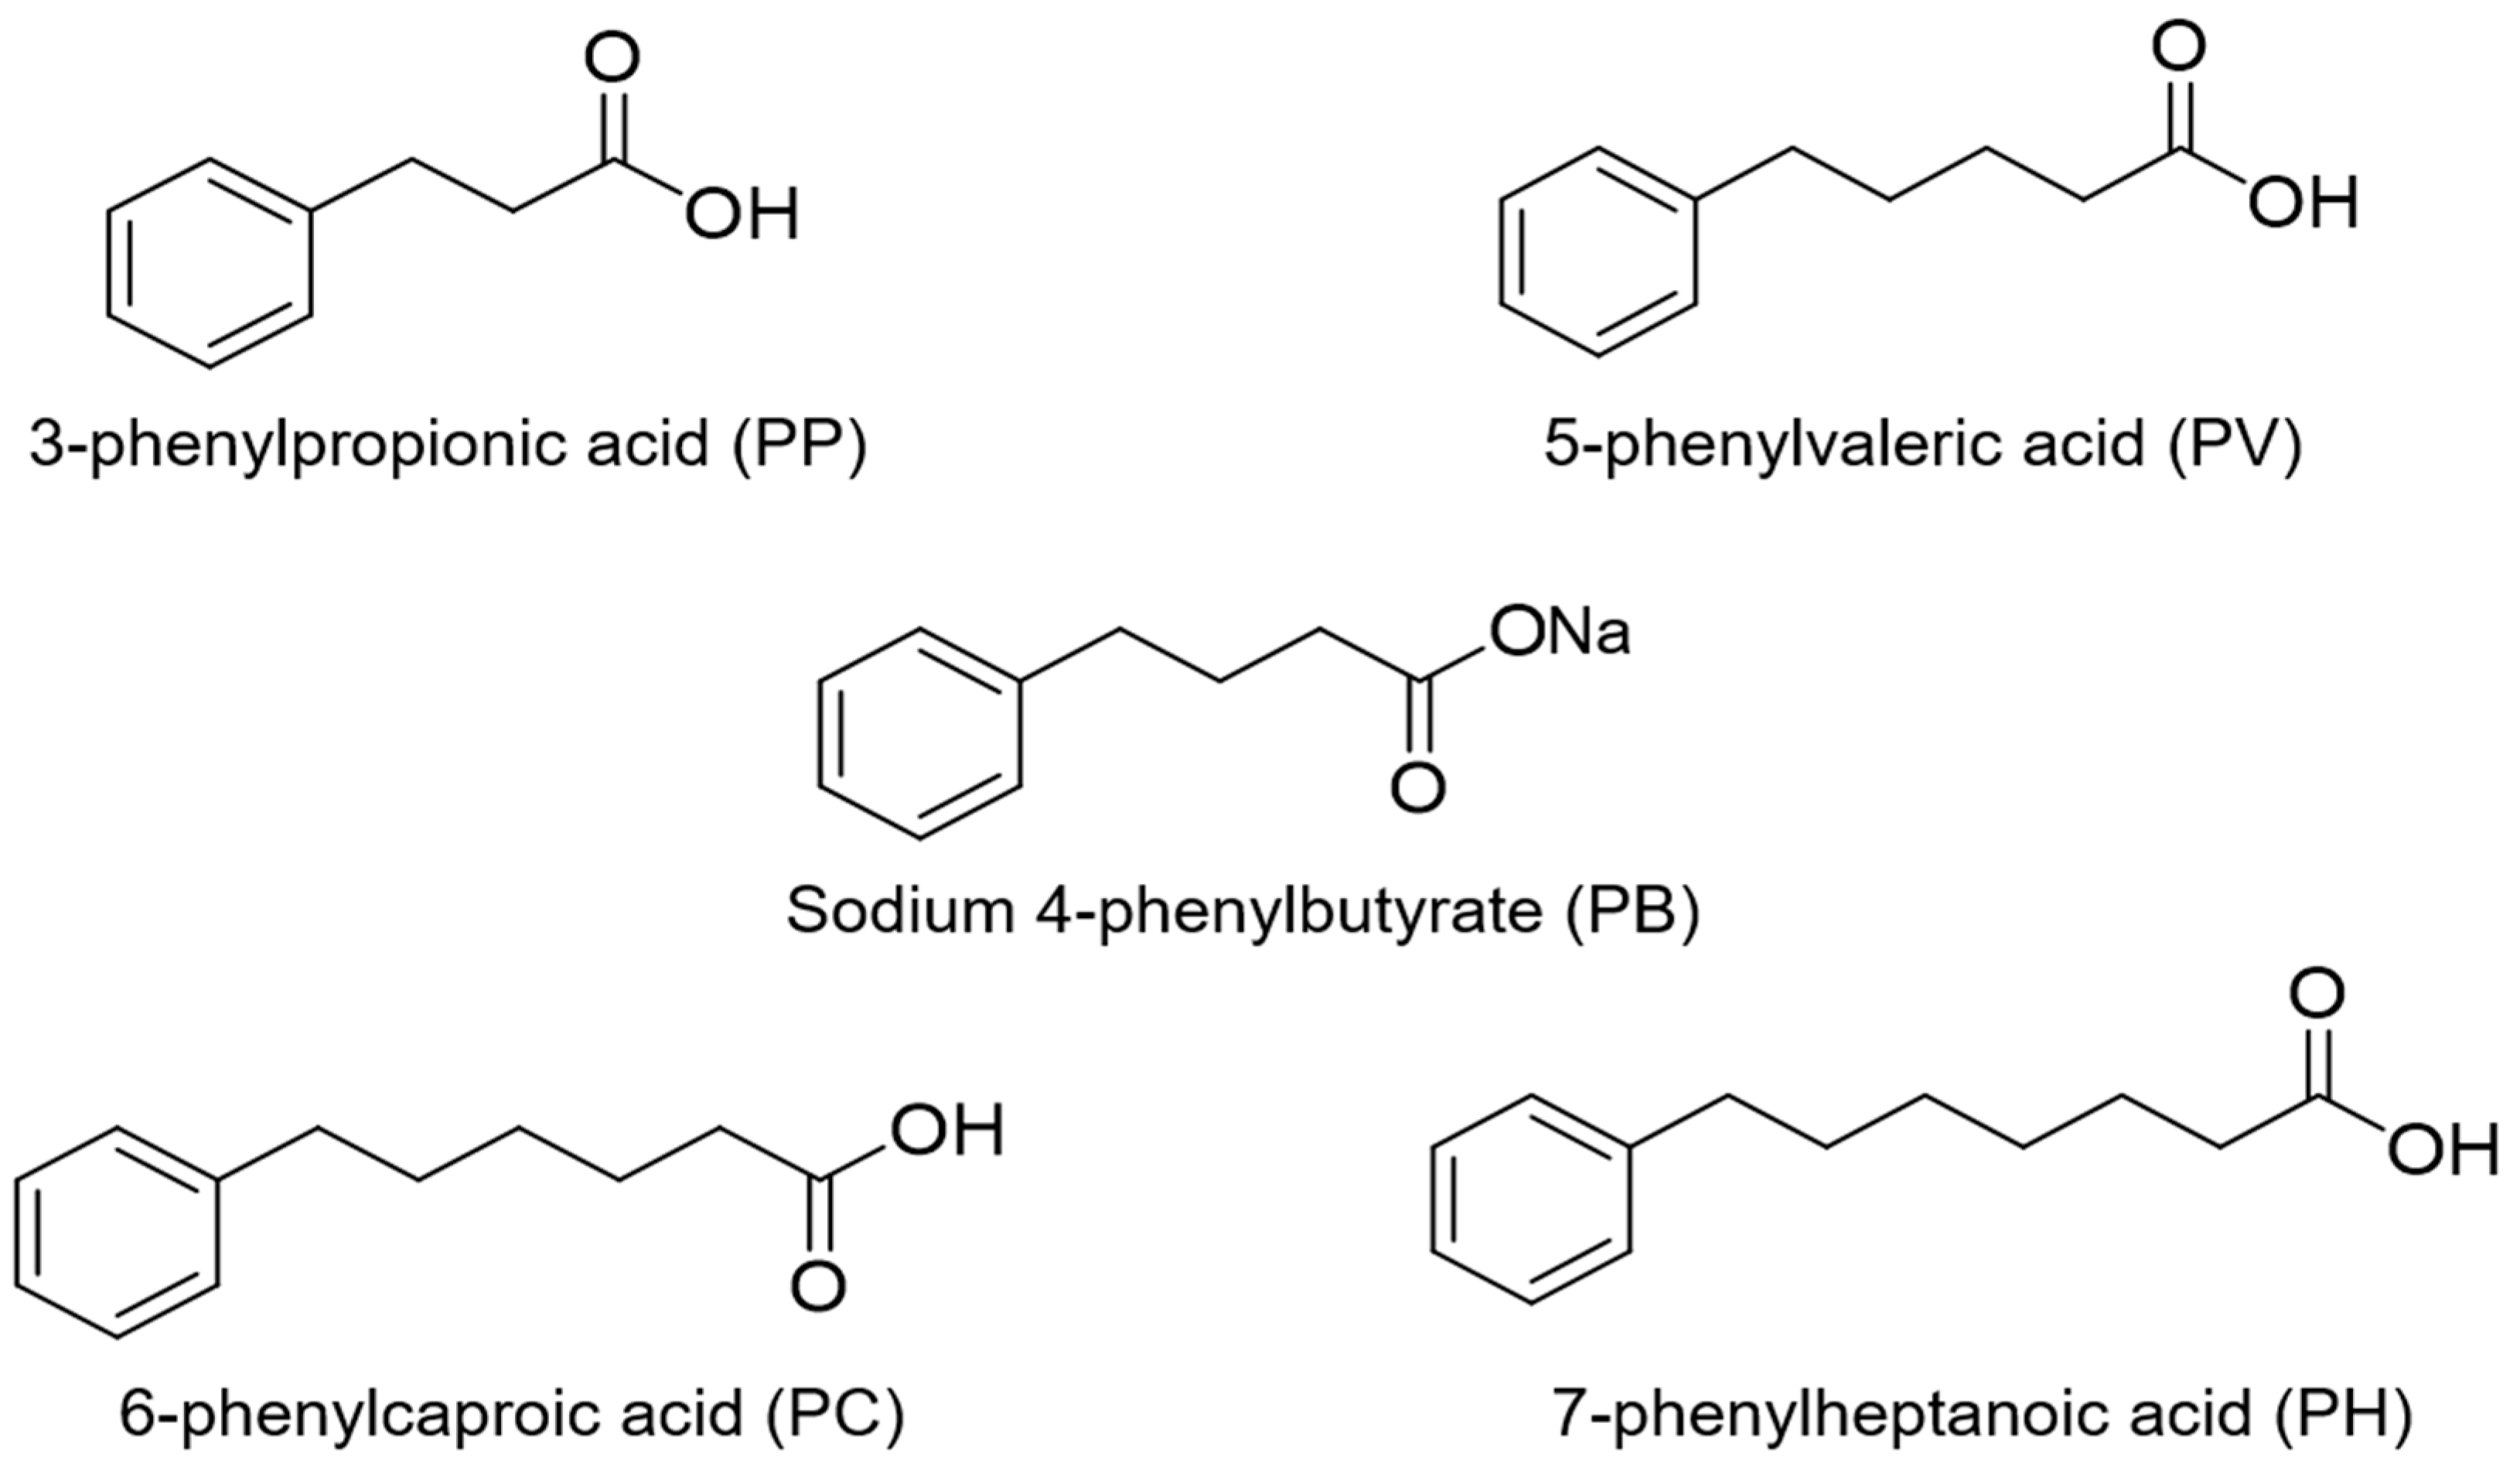
3.1. Materials
3.2. Methods
3.2.1. Phase Solubility Studies
HPLC Conditions
3.2.2. 1H NMR Spectroscopy
3.2.3. Molecular Modeling
4. Conclusions
Supplementary Materials
Author Contributions
Funding
Institutional Review Board Statement
Informed Consent Statement
Data Availability Statement
Acknowledgments
Conflicts of Interest
References
- Brusilow, S.W.; Horwich, A.L. Urea cycle enzymes. In The Metabolic and Molecular Bases of Inherited Disease; Driver, C.R., Beaded, A.L., Sly, W.S., Valle, D., Eds.; McGraw-Hill: New York, NY, USA, 2001; pp. 1909–1963. [Google Scholar]
- Brusilow, S.W.; Maestri, N.E. Urea cycle disorders: Diagnosis, pathophysiology, and therapy. Adv. Pediatr. 1996, 43, 127–170. [Google Scholar] [PubMed]
- Walker, V. Ammonia metabolism and hyperammonemic disorders. Adv. Clin. Chem. 2014, 67, 73–150. [Google Scholar] [CrossRef] [PubMed]
- Häberle, J.; Boddaert, N.; Burlina, A.; Chakrapani, A.; Dixon, M.; Huemer, M.; Karall, D.; Martinelli, D.; Crespo, P.S.; Santer, R.; et al. Suggested guidelines for the diagnosis and management of urea cycle disorders. Orphanet J. Rare Dis. 2012, 7, 32. [Google Scholar] [CrossRef] [PubMed]
- Dover, G.J.; Brusilow, S.; Charache, S. Induction of fetal hemoglobin production in subjects with sickle cell anemia by oral sodium phenylbutyrate. Blood 1994, 84, 339–343. [Google Scholar] [CrossRef] [PubMed]
- Basseri, S.; Lhotak, S.; Sharma, A.M.; Austin, R.C. The chemical chaperone 4-phenylbutyrate inhibits adipogenesis by modulating the unfolded protein response. J. Lipid Res. 2009, 50, 2486–2501. [Google Scholar] [CrossRef] [PubMed]
- Iannitti, T.; Palmieri, B. Clinical and experimental applications of sodium phenylbutyrate. Drugs R D 2011, 11, 227–249. [Google Scholar] [CrossRef] [PubMed]
- Hayashi, H.; Mizuno, T.; Horikawa, R.; Nagasaka, H.; Yabuki, T.; Takikawa, H.; Sugiyama, Y. 4-Phenylbutyrate modulates ubiquitination of hepatocanalicular MRP2 and reduces serum total bilirubin concentration. J. Hepatol. 2012, 56, 1136–1144. [Google Scholar] [CrossRef]
- Upagupta, C.; Carlisle, R.E.; Dickhout, J.G. Analysis of the potency of various low molecular weight chemical chaperones to prevent protein aggregation. Biochem. Biophys. Res. Commun. 2017, 486, 163–170. [Google Scholar] [CrossRef]
- Enokida, T.; Yamasaki, K.; Okamoto, Y.; Taguchi, K.; Ishiguro, T.; Maruyama, T.; Seo, H.; Otagiri, M. Tyrosine411 and arginine410 of human serum albumin play an important role in the binding of sodium 4-phenylbutyrate to site II. J. Pharm. Sci. 2016, 105, 1987–1994. [Google Scholar] [CrossRef]
- European Medicines Agency. Summary of Product Characteristics: Ammonaps. Available online: https://www.ema.europa.eu/en/documents/product-information/ammonaps-epar-product-information_en.pdf (accessed on 28 July 2022).
- Mennella, J.A.; Beauchamp, G.K. Optimizing oral medications for children. Clin. Ther. 2008, 30, 2120–2132. [Google Scholar] [CrossRef]
- Cramer, F. Einschlussverbindungen; Springer: Berlin/Heidelberg, Germany, 1954. [Google Scholar]
- Frank, S.G. Inclusion compounds. J. Pharm. Sci. 1975, 64, 1585–1604. [Google Scholar] [CrossRef] [PubMed]
- Szejtli, J. Cyclodextrins and Their Inclusion Complexes; Akademiai Kiado: Budapest, Hungary, 1982. [Google Scholar]
- Loftsson, T.; Brewster, M.E. Pharmaceutical applications of cyclodextrins: Basic science and product development. J. Pharm. Pharmacol. 2010, 62, 1607–1621. [Google Scholar] [CrossRef] [PubMed]
- Stella, V.J.; Rajewski, R.A. Cyclodextrins: Their Future in Drug Formulation and Delivery. Pharm. Res. 1997, 14, 556–567. [Google Scholar] [CrossRef] [PubMed]
- Loftsson, T.; Duchêne, D. Cyclodextrins and their pharmaceutical applications. Int. J. Pharm. 2007, 329, 1–11. [Google Scholar] [CrossRef] [PubMed]
- Commey, K.; Nakatake, A.; Enaka, A.; Nishi, K.; Tsukigawa, K.; Yamaguchi, K.; Ikeda, H.; Iohara, D.; Hirayama, F.; Otagiri, M.; et al. Study of the inclusion complexes formed between 4-phenylbutyrate and α-, β- and γ-cyclodextrin in solution and evaluation on their taste-masking properties. J. Pharm. Pharmacol. 2023, 75, 236–244. [Google Scholar] [CrossRef] [PubMed]
- Gadre, A.; Rüdiger, V.; Schneider, H.-J.; Connors, K.A. Binding of cyclodextrins to alicyclic and aromatic substrates: Complex formation of α-, β-, and γ-cyclodextrins with substituted cyclohexanecarboxylic acids and phenylalkanoic acids. J. Pharm. Sci. 1997, 86, 236–243. [Google Scholar] [CrossRef] [PubMed]
- Rekharsky, M.V.; Inoue, Y. Complexation Thermodynamics of Cyclodextrins. Chem. Rev. 1998, 98, 1875–1918. [Google Scholar] [CrossRef] [PubMed]
- Pauli, W.A.; Lach, J.L. Interaction of pharmaceuticals with schardinger dextrins V. Interaction with a series of phenyl-substituted carboxylic acids. J. Pharm. Sci. 1965, 54, 1745–1750. [Google Scholar] [CrossRef]
- Higuchi, T.; Connors, K.A. Phase solubility techniques. Adv. Anal. Chem. Instrum. 1965, 4, 117–118. [Google Scholar]
- Rekharsky, M.V.; Mayhew, M.P.; Goldberg, R.N.; Ross, P.D.; Yamashoji, Y.; Inoue, Y. Thermodynamic and Nuclear Magnetic Resonance Study of the Reactions of α- and β-Cyclodextrin with Acids, Aliphatic Amines, and Cyclic Alcohols. J. Phys. Chem. B 1997, 101, 87–100. [Google Scholar] [CrossRef]
- Uekama, K.; Hirayama, F.; Matsuo, N.; Koinuma, H. Structural elucidation of the inclusion complexes of tolbutamide with α- and β-cyclodextrins in aqueous solution. Chem. Lett. 1978, 7, 703–706. [Google Scholar] [CrossRef]
- Bender, M.L.; Komiyama, M. Cyclodextrin Chemistry; Springer: Berlin/Heidelberg, Germany, 1978. [Google Scholar]
- Ikeda, Y.; Hirayama, F.; Arima, H.; Uekama, K.; Yoshitake, Y.; Harano, K. NMR spectroscopic characterization of metoprolol/cyclodextrin complexes in aqueous solution: Cavity size dependency. J. Pharm. Sci. 2004, 93, 1659–1671. [Google Scholar] [CrossRef] [PubMed]
- Schneider, H.-J. Mechanisms of molecular recognition: Investigations of organic host-guest complexes. Angew. Chem. Int. Ed. 1991, 30, 1417–1436. [Google Scholar] [CrossRef]
- Utsuki, T.; Hirayama, F.; Uekama, K. Different photodimerization behavior of tranilast in α-, β- and γ-cyclodextrin complexes: Cavity-size and stoichiometry dependence. J. Chem. Soc. Perkin Trans. 2 1993, 1, 109–114. [Google Scholar] [CrossRef]
- Connors, K.A. Population characteristics of cyclodextrin complex stabilities in aqueous solution. J. Pharm. Sci. 1995, 84, 843–848. [Google Scholar] [CrossRef] [PubMed]
- Fernandes, C.M.; Carvalho, R.A.; da Costa, S.P.; Veiga, F.J. Multimodal molecular encapsulation of nicardipine hydrochloride by β-cyclodextrin, hydroxypropyl-β-cyclodextrin and triacetyl-β-cyclodextrin in solution. Structural studies by 1H NMR and ROESY experiments. Eur. J. Pharm. Sci. 2003, 18, 285–296. [Google Scholar] [CrossRef] [PubMed]
- Frisch, M.J.; Trucks, G.W.; Schlegel, H.B.; Scuseria, G.E.; Robb, M.A.; Cheeseman, J.R.; Scalmani, G.; Barone, V.; Petersson, G.A.; Nakatsuji, H.; et al. “Gaussian 16”; Revision A.03; Gaussian, Inc.: Wallingford, CT, USA, 2016. [Google Scholar]
- Mineva, T.; Russo, N.; Sicilia, E. Solvation effects on reaction profiles by the polarizable continuum model coupled with the Gaussian density functional method. J. Comp. Chem. 1998, 19, 290–299. [Google Scholar] [CrossRef]
- Schneider, H.-J.; Hacket, F.; Rüdiger, V.; Ikeda, H. NMR studies of cyclodextrins and cyclodextrin complexes. Chem. Rev. 1998, 98, 1755–1786. [Google Scholar] [CrossRef]
- Redenti, E.; Szente, L.; Szejtli, J. Cyclodextrin complexes of salts of acidic drugs. Thermodynamic properties, structural features, and pharmaceutical applications. J. Pharm. Sci. 2001, 90, 979–986. [Google Scholar] [CrossRef]
- Job, P. Formation and stability of inorganic complexes in solution. Ann. Chim. 1928, 9, 113–134. [Google Scholar]
- Al-Soufi, W.; Cabrer, P.R.; Jover, A.; Budal, R.M.; Tato, J.V. Determination of second-order association constants by global analysis of 1H and 13C NMR chemical shifts: Application to the complexation of sodium fusidate and potassium helvolate by β- and γ-cyclodextrin. Steroids 2003, 68, 43–53. [Google Scholar] [CrossRef]


| Compound | Guest/Host Ratio | ||
|---|---|---|---|
| αCD | βCD | γCD | |
| PP | ― a | 1.03 ± 0.08 | 1.97 ± 0.18 |
| PB | ― a | 1.02 ± 0.05 b | 2.14 ± 0.08 b |
| PV | ― a | 0.99 ± 0.05 | 2.21 ± 0.03 |
| PC | 0.55 ± 0.03 | 1.08 ± 0.01 | 2.30 ± 0.03 |
| PH | 0.44 ± 0.01 | 1.02 ± 0.01 | 2.20 ± 0.01 |
| Compound | K (M−1) | ||
|---|---|---|---|
| αCD | βCD | γCD | |
| PP | 226 ± 5 | 74 ± 3 | 34 ± 1 |
| PB | 481 ± 26 a | 178 ± 23 a | 119 ± 9 a |
| PV | 639 ± 20 | 838 ± 52 | 223 ± 7 |
| PC | 1185 ± 35 | 2283 ± 134 | 499 ± 59 |
| PH | 2500 ± 50 | 7458 ± 52 | 1213 ± 18 |
 Change in Chemical Shift, Δδ (with CD − without CD) (ppm) | ||||||||||
|---|---|---|---|---|---|---|---|---|---|---|
| CD | Compound | A | B | C | D | E | F | X | Y | Z |
| αCD | PP | 0.010 | 0.006 | 0.012 | 0.012 | 0.006 | ||||
| PB | 0.028 | 0.026 | 0.002 | 0.020 | 0.020 | ― a | ||||
| PV | 0.044 | 0.045 | ― a | −0.025 | 0.008 | 0.033 | 0.022 | |||
| PC | 0.050 | 0.046 | 0.066 | −0.013 | −0.006 | 0.000 | 0.046 | ― a | ||
| PH | 0.041 | 0.044 | 0.096 | −0.015 | 0.009 | 0.004 | −0.022 | 0.061 | 0.040 | |
| βCD | PP | 0.009 | −0.008 | −0.016 | −0.005 | 0.003 | ||||
| PB | 0.004 | −0.003 | −0.029 | −0.072 | −0.028 | ― a | ||||
| PV | −0.016 | 0.009 | −0.037 | −0.014 | −0.150 | −0.056 | 0.026 | |||
| PC | −0.032 | −0.007 | −0.061 | −0.019 | −0.015 | −0.168 | −0.050 | 0.020 | ||
| PH | −0.054 | −0.023 | −0.086 | −0.028 | −0.029 | −0.001 | −0.188 | −0.049 | 0.034 | |
| γCD | PP | 0.003 | 0.002 | −0.001 | 0.001 | 0.002 | ||||
| PB | −0.001 | 0.003 | −0.003 | −0.009 | −0.005 | −0.002 | ||||
| PV | −0.011 | −0.004 | −0.006 | 0.002 | −0.026 | −0.006 | 0.000 | |||
| PC | −0.031 | −0.018 | −0.023 | −0.005 | 0.000 | −0.047 | −0.008 | −0.001 | ||
| PH | −0.067 | −0.055 | −0.048 | −0.042 | −0.021 | −0.014 | −0.087 | −0.020 | −0.003 | |
 Change in Chemical Shift, Δδ (with Compound − without Compound) (ppm) | ||||||
|---|---|---|---|---|---|---|
| CD | Proton | PP | PB | PV | PC | PH |
| αCD | H1′ | −0.005 | −0.003 | −0.001 | 0.005 | 0.009 |
| H2′ | −0.006 | −0.005 | −0.007 | −0.011 | −0.007 | |
| H3′ | −0.016 | −0.025 | −0.032 | −0.053 | −0.060 | |
| H4′ | −0.004 | −0.006 | 0.003 | ― a | ― a | |
| H5′ | 0.001 | 0.008 | 0.003 | −0.014 | ― a | |
| H6′a | 0.005 | −0.004 | −0.005 | −0.007 | −0.008 | |
| βCD | H1′ | −0.009 | −0.015 | −0.017 | −0.016 | −0.014 |
| H2′ | 0.001 | −0.006 | −0.009 | −0.011 | −0.008 | |
| H3′ | −0.022 | −0.042 | −0.053 | −0.061 | −0.061 | |
| H4′ | 0.005 | 0.003 | 0.009 | 0.022 | 0.033 | |
| H5′ | −0.063 | −0.122 | −0.172 | −0.206 | −0.211 | |
| H6′a | 0.009 | −0.004 | −0.021 | −0.032 | −0.040 | |
| γCD | H1′ | −0.002 | −0.007 | −0.008 | −0.006 | −0.006 |
| H2′ | −0.002 | −0.003 | −0.005 | −0.003 | −0.006 | |
| H3′ | −0.004 | −0.006 | −0.008 | −0.016 | −0.028 | |
| H4′ | −0.002 | −0.002 | −0.002 | −0.001 | −0.001 | |
| H5′ | ― a | 0.000 | −0.009 | −0.032 | −0.055 | |
| H6′a | −0.003 | −0.007 | −0.014 | −0.015 | −0.022 | |
Disclaimer/Publisher’s Note: The statements, opinions and data contained in all publications are solely those of the individual author(s) and contributor(s) and not of MDPI and/or the editor(s). MDPI and/or the editor(s) disclaim responsibility for any injury to people or property resulting from any ideas, methods, instructions or products referred to in the content. |
© 2023 by the authors. Licensee MDPI, Basel, Switzerland. This article is an open access article distributed under the terms and conditions of the Creative Commons Attribution (CC BY) license (https://creativecommons.org/licenses/by/4.0/).
Share and Cite
Commey, K.L.; Nakatake, A.; Enaka, A.; Nakamura, R.; Nishi, K.; Tsukigawa, K.; Ikeda, H.; Yamaguchi, K.; Iohara, D.; Hirayama, F.; et al. Study of the Structural Chemistry of the Inclusion Complexation of 4-Phenylbutyrate and Related Compounds with Cyclodextrins in Solution: Differences in Inclusion Mode with Cavity Size Dependency. Int. J. Mol. Sci. 2023, 24, 15091. https://doi.org/10.3390/ijms242015091
Commey KL, Nakatake A, Enaka A, Nakamura R, Nishi K, Tsukigawa K, Ikeda H, Yamaguchi K, Iohara D, Hirayama F, et al. Study of the Structural Chemistry of the Inclusion Complexation of 4-Phenylbutyrate and Related Compounds with Cyclodextrins in Solution: Differences in Inclusion Mode with Cavity Size Dependency. International Journal of Molecular Sciences. 2023; 24(20):15091. https://doi.org/10.3390/ijms242015091
Chicago/Turabian StyleCommey, Kindness L., Akari Nakatake, Airi Enaka, Ryota Nakamura, Koji Nishi, Kenji Tsukigawa, Hirohito Ikeda, Koki Yamaguchi, Daisuke Iohara, Fumitoshi Hirayama, and et al. 2023. "Study of the Structural Chemistry of the Inclusion Complexation of 4-Phenylbutyrate and Related Compounds with Cyclodextrins in Solution: Differences in Inclusion Mode with Cavity Size Dependency" International Journal of Molecular Sciences 24, no. 20: 15091. https://doi.org/10.3390/ijms242015091
APA StyleCommey, K. L., Nakatake, A., Enaka, A., Nakamura, R., Nishi, K., Tsukigawa, K., Ikeda, H., Yamaguchi, K., Iohara, D., Hirayama, F., Yamasaki, K., & Otagiri, M. (2023). Study of the Structural Chemistry of the Inclusion Complexation of 4-Phenylbutyrate and Related Compounds with Cyclodextrins in Solution: Differences in Inclusion Mode with Cavity Size Dependency. International Journal of Molecular Sciences, 24(20), 15091. https://doi.org/10.3390/ijms242015091