
Transcriptome Profiling of Etridiazole-Exposed Zebrafish (Danio rerio) Embryos Reveals Pathways Associated with Cardiac and Ocular Toxicities

 ,
, 
Abstract
:1. Introduction
2. Results
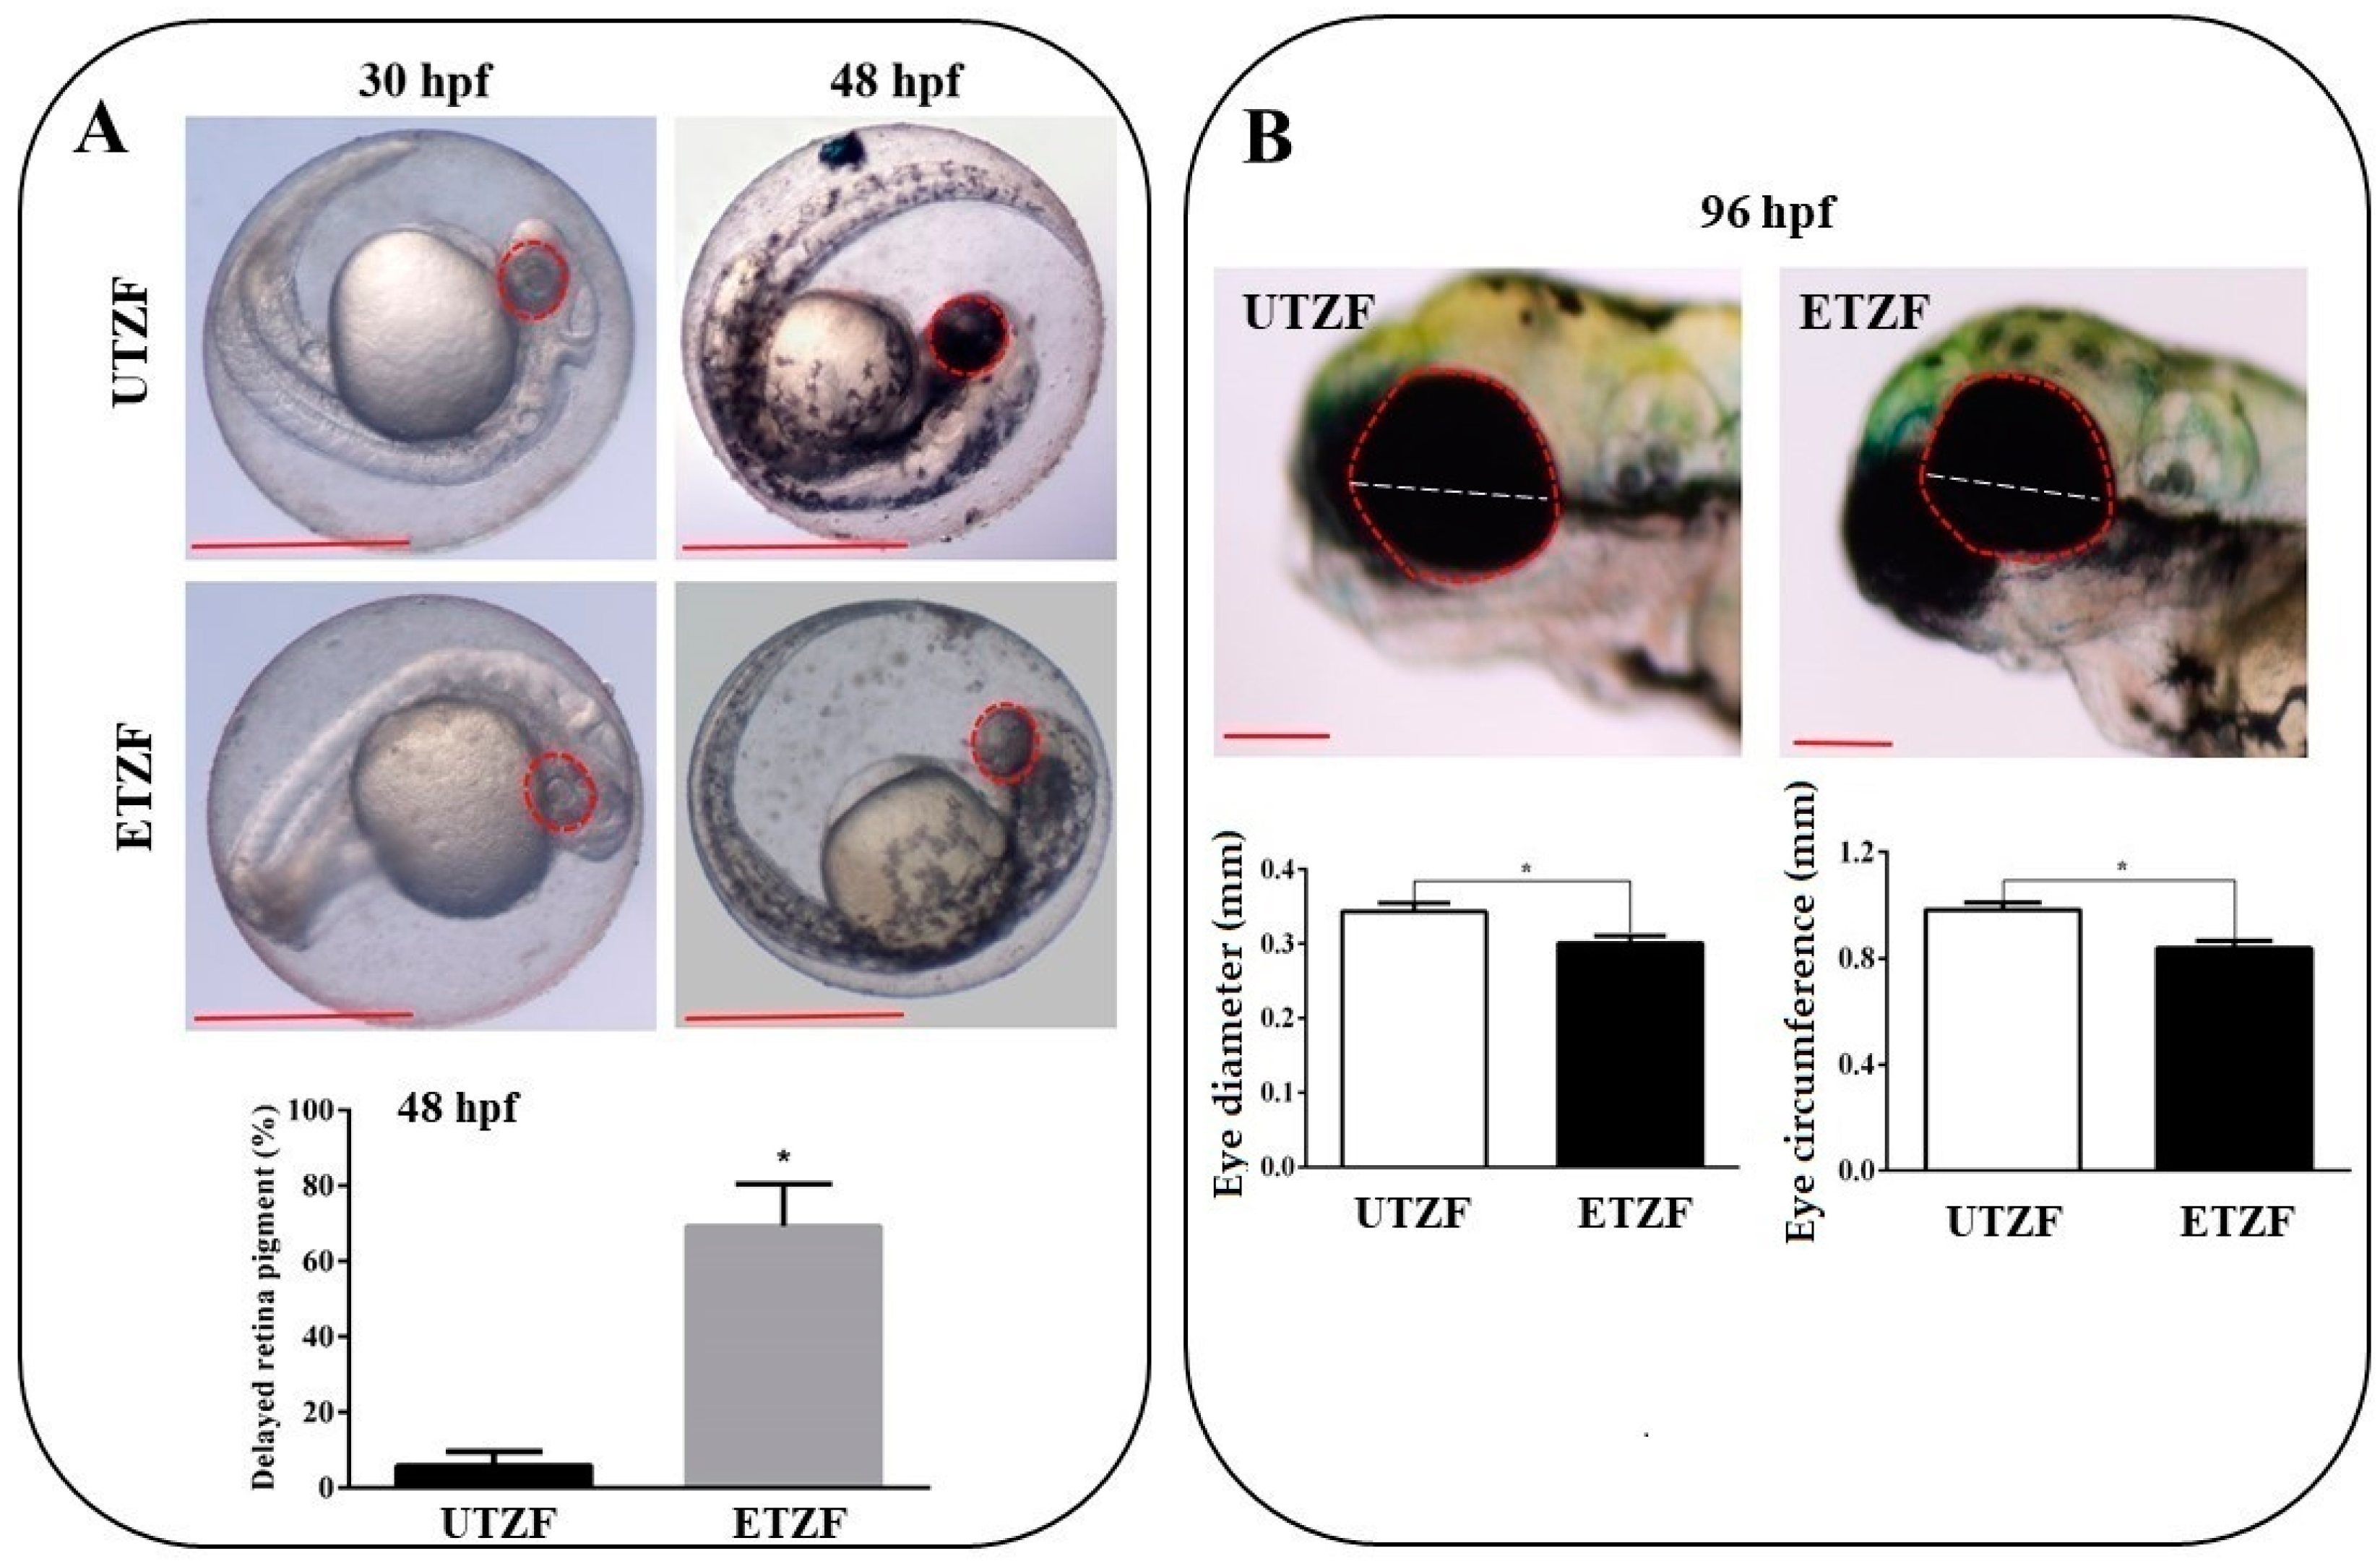
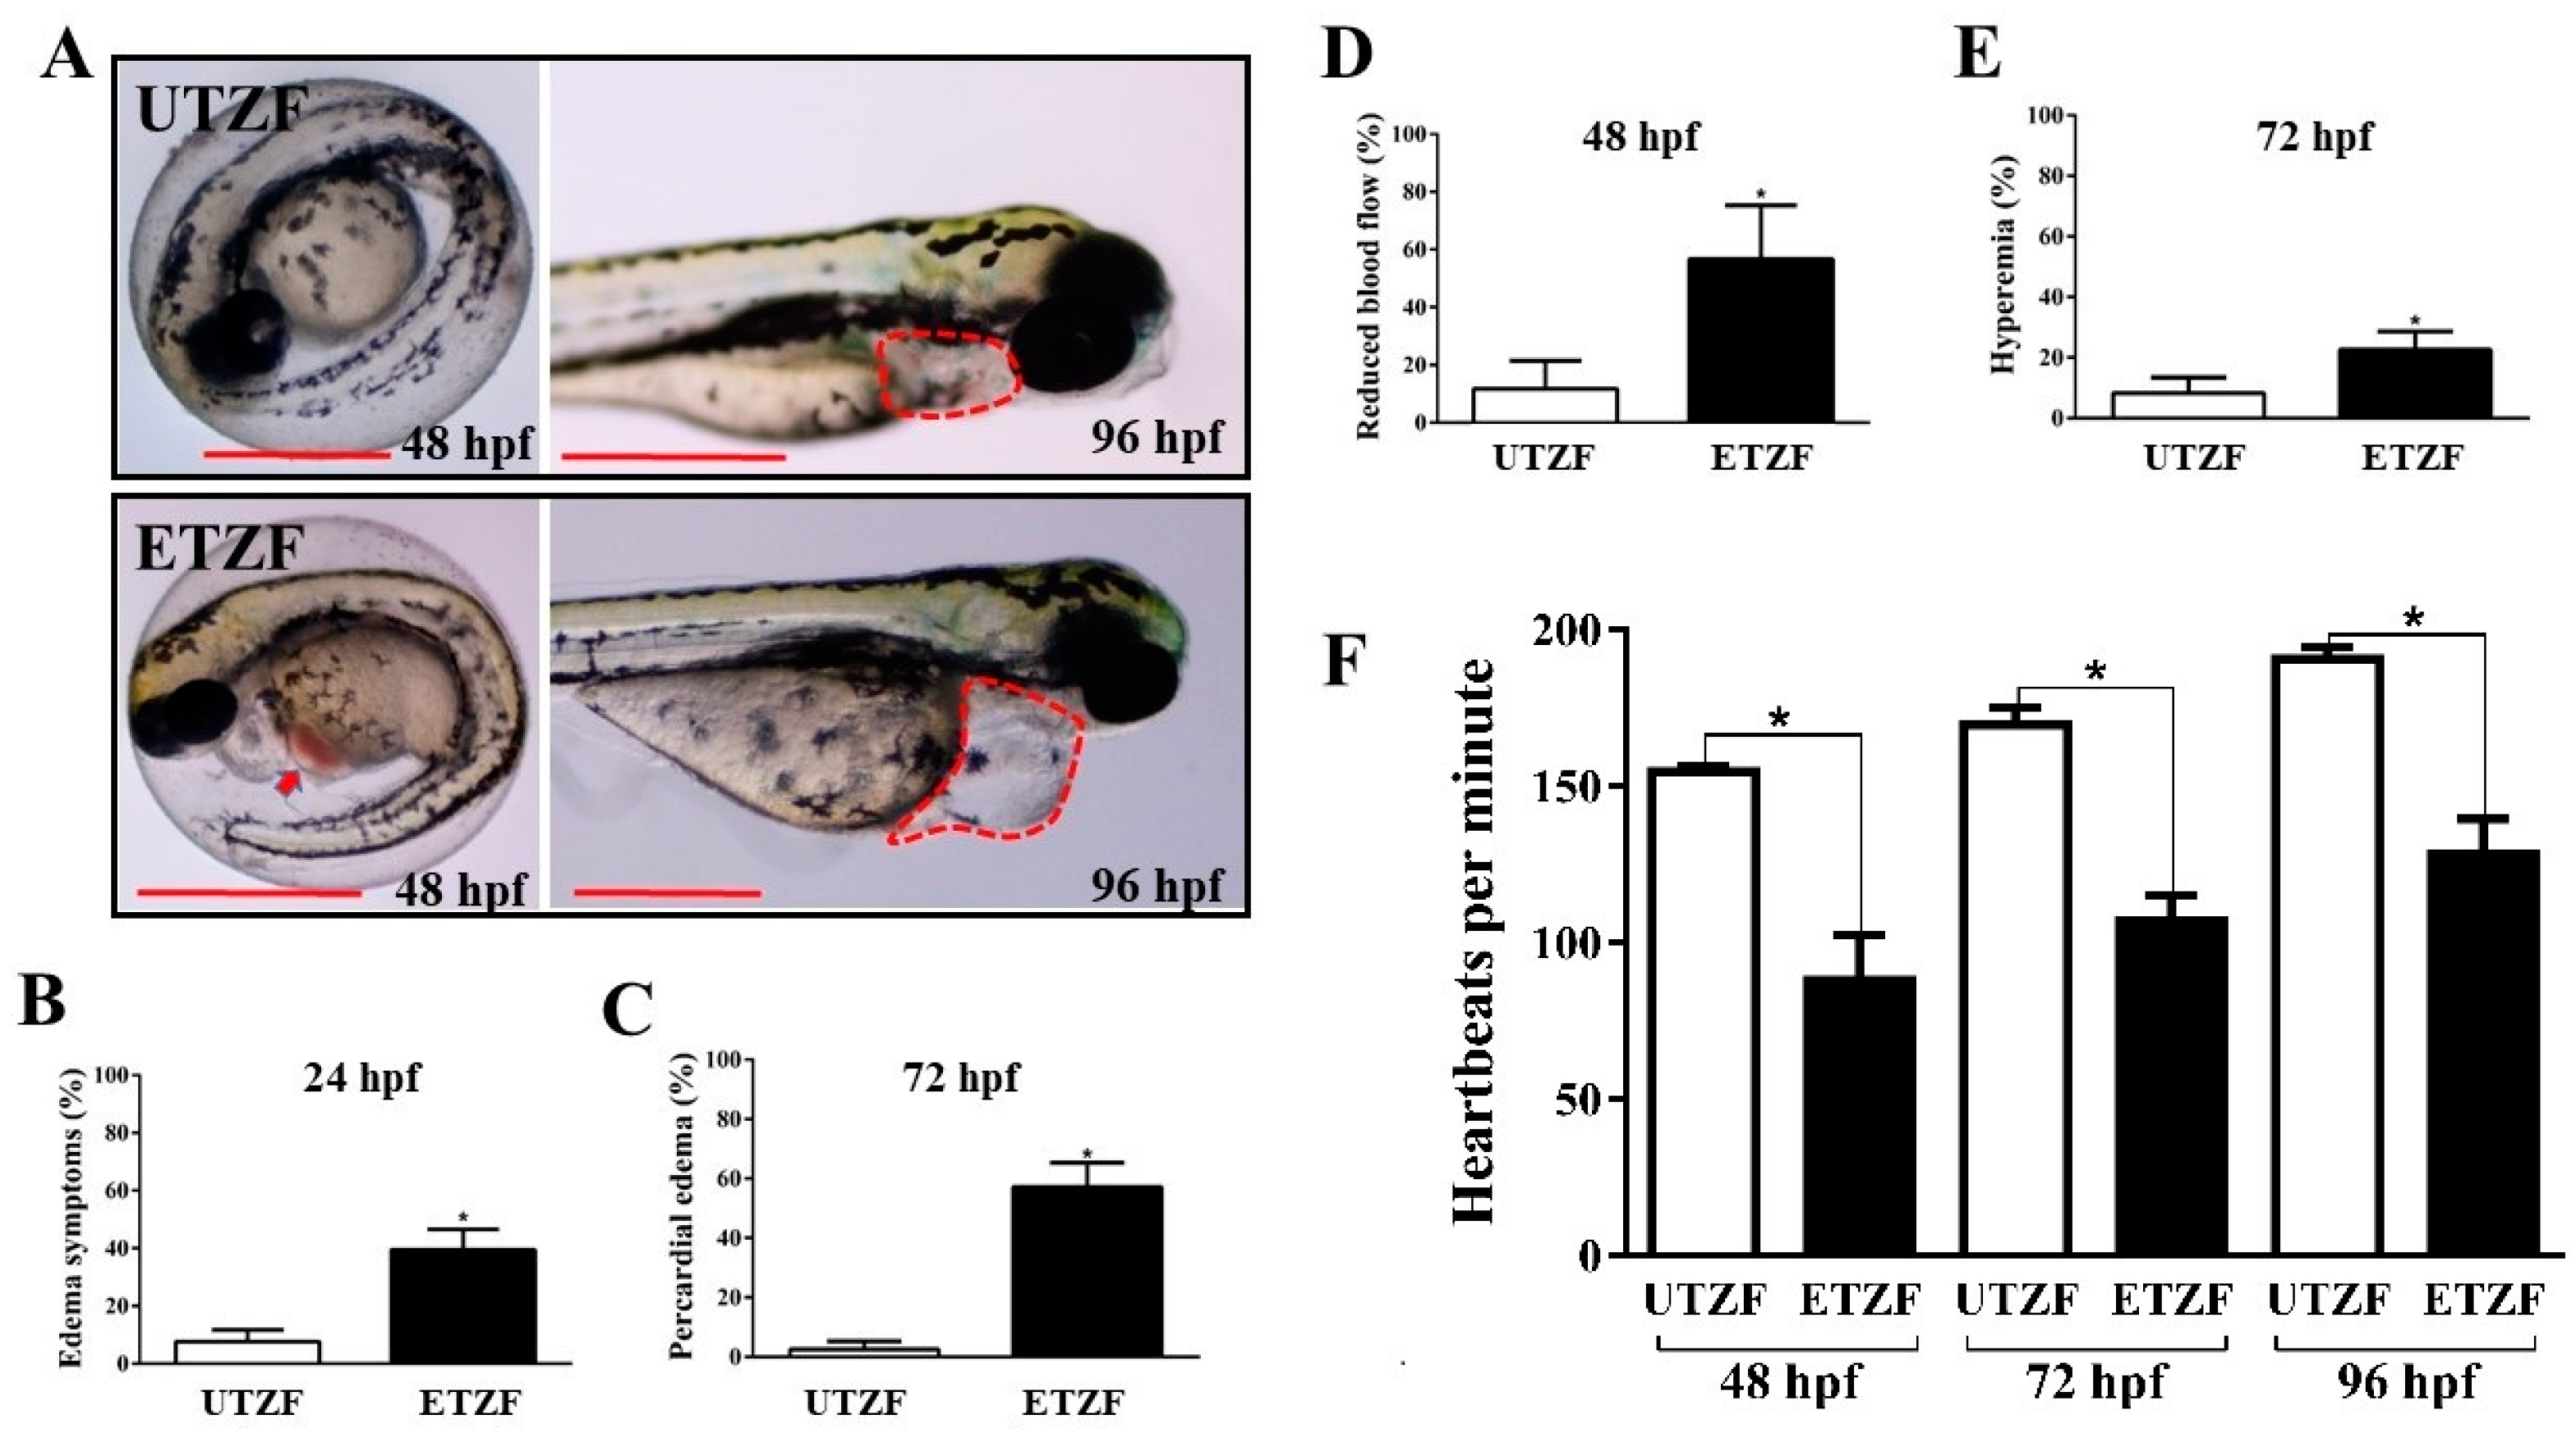
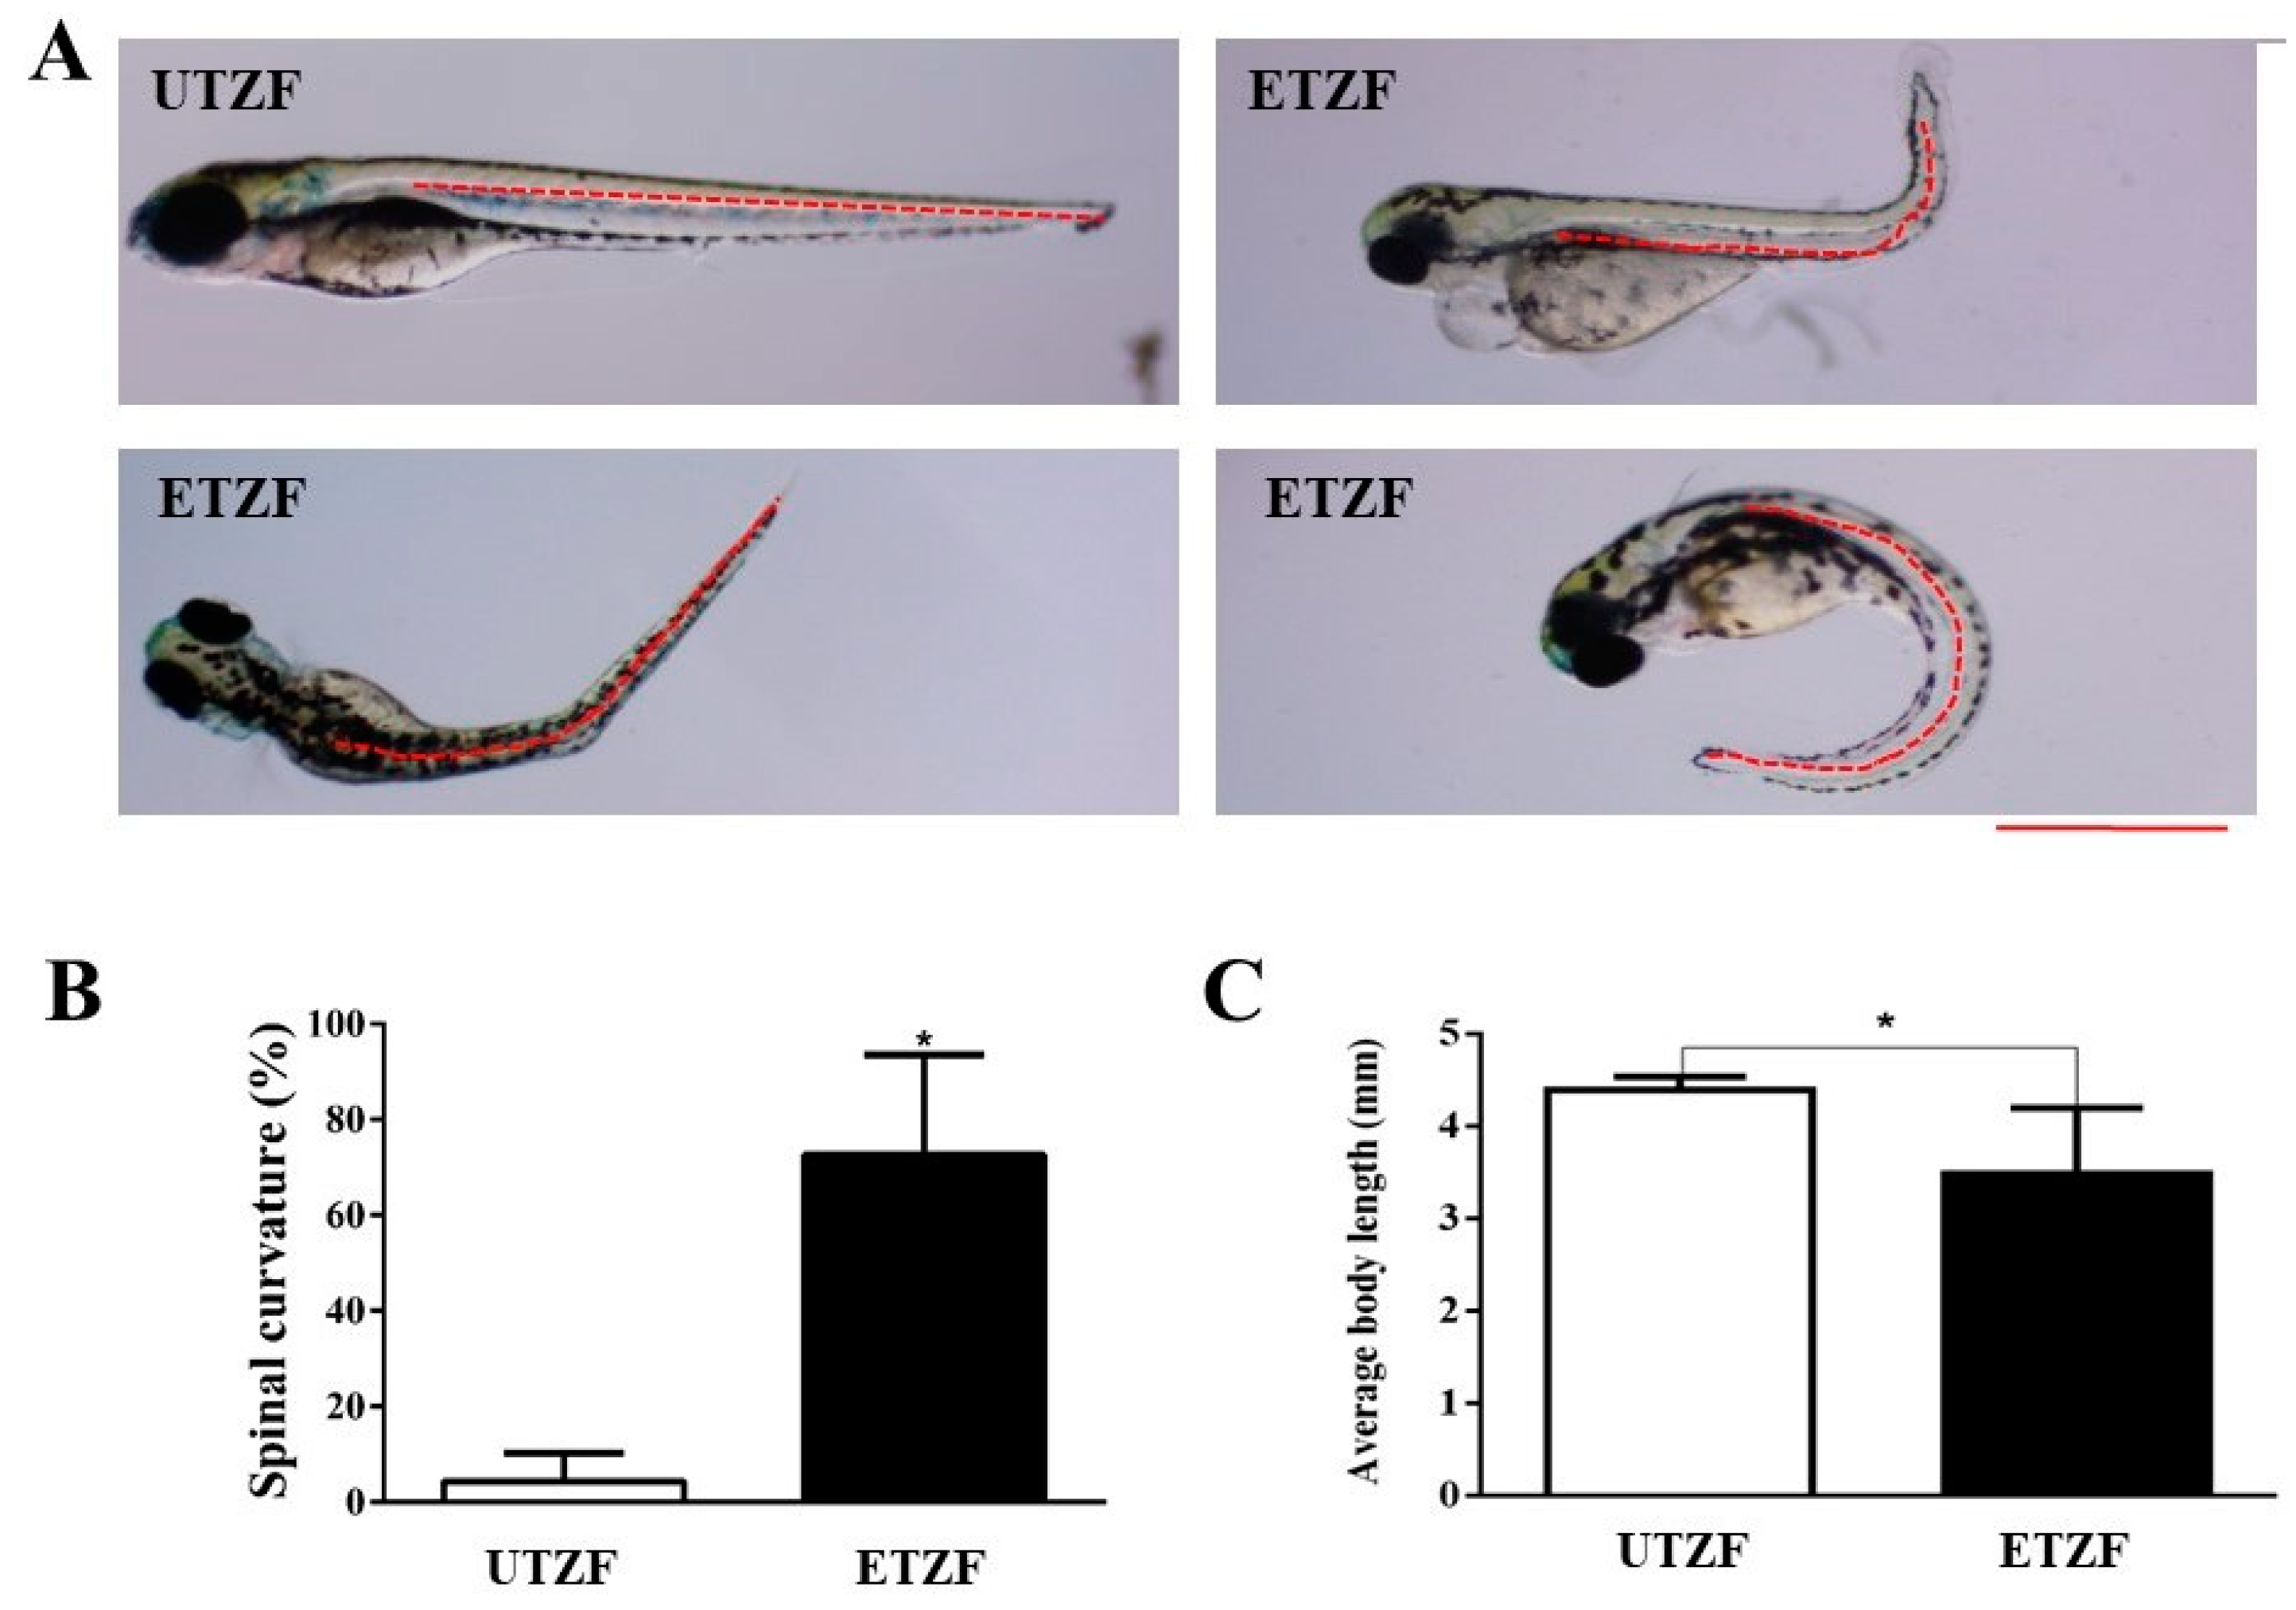
2.1. Developmental Deformity Assessment
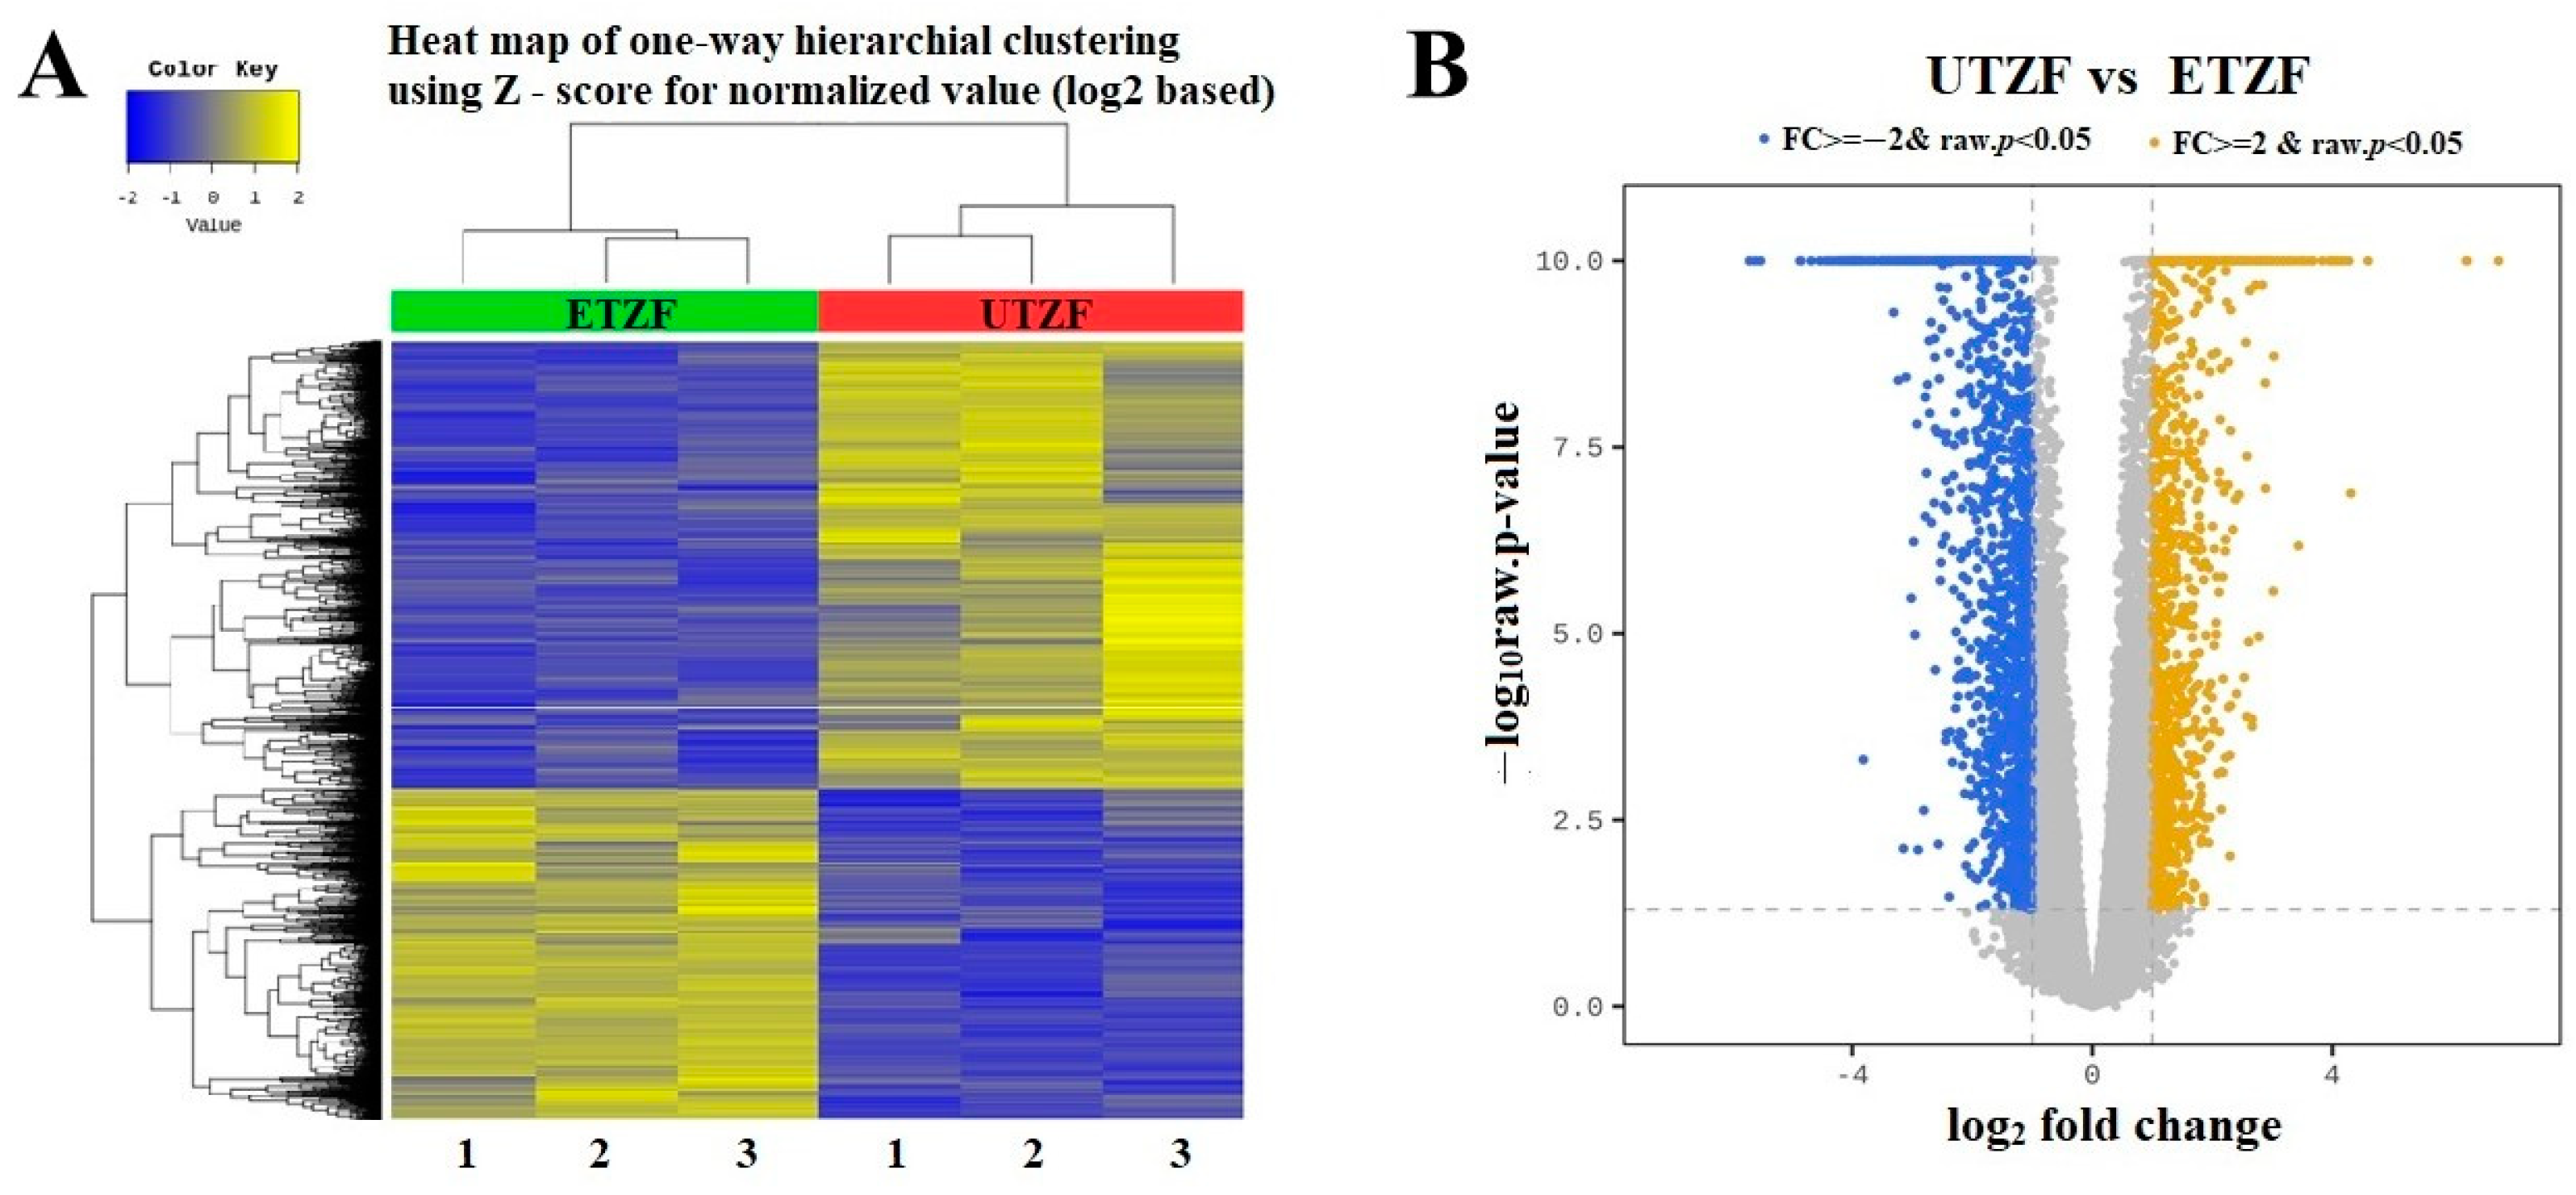
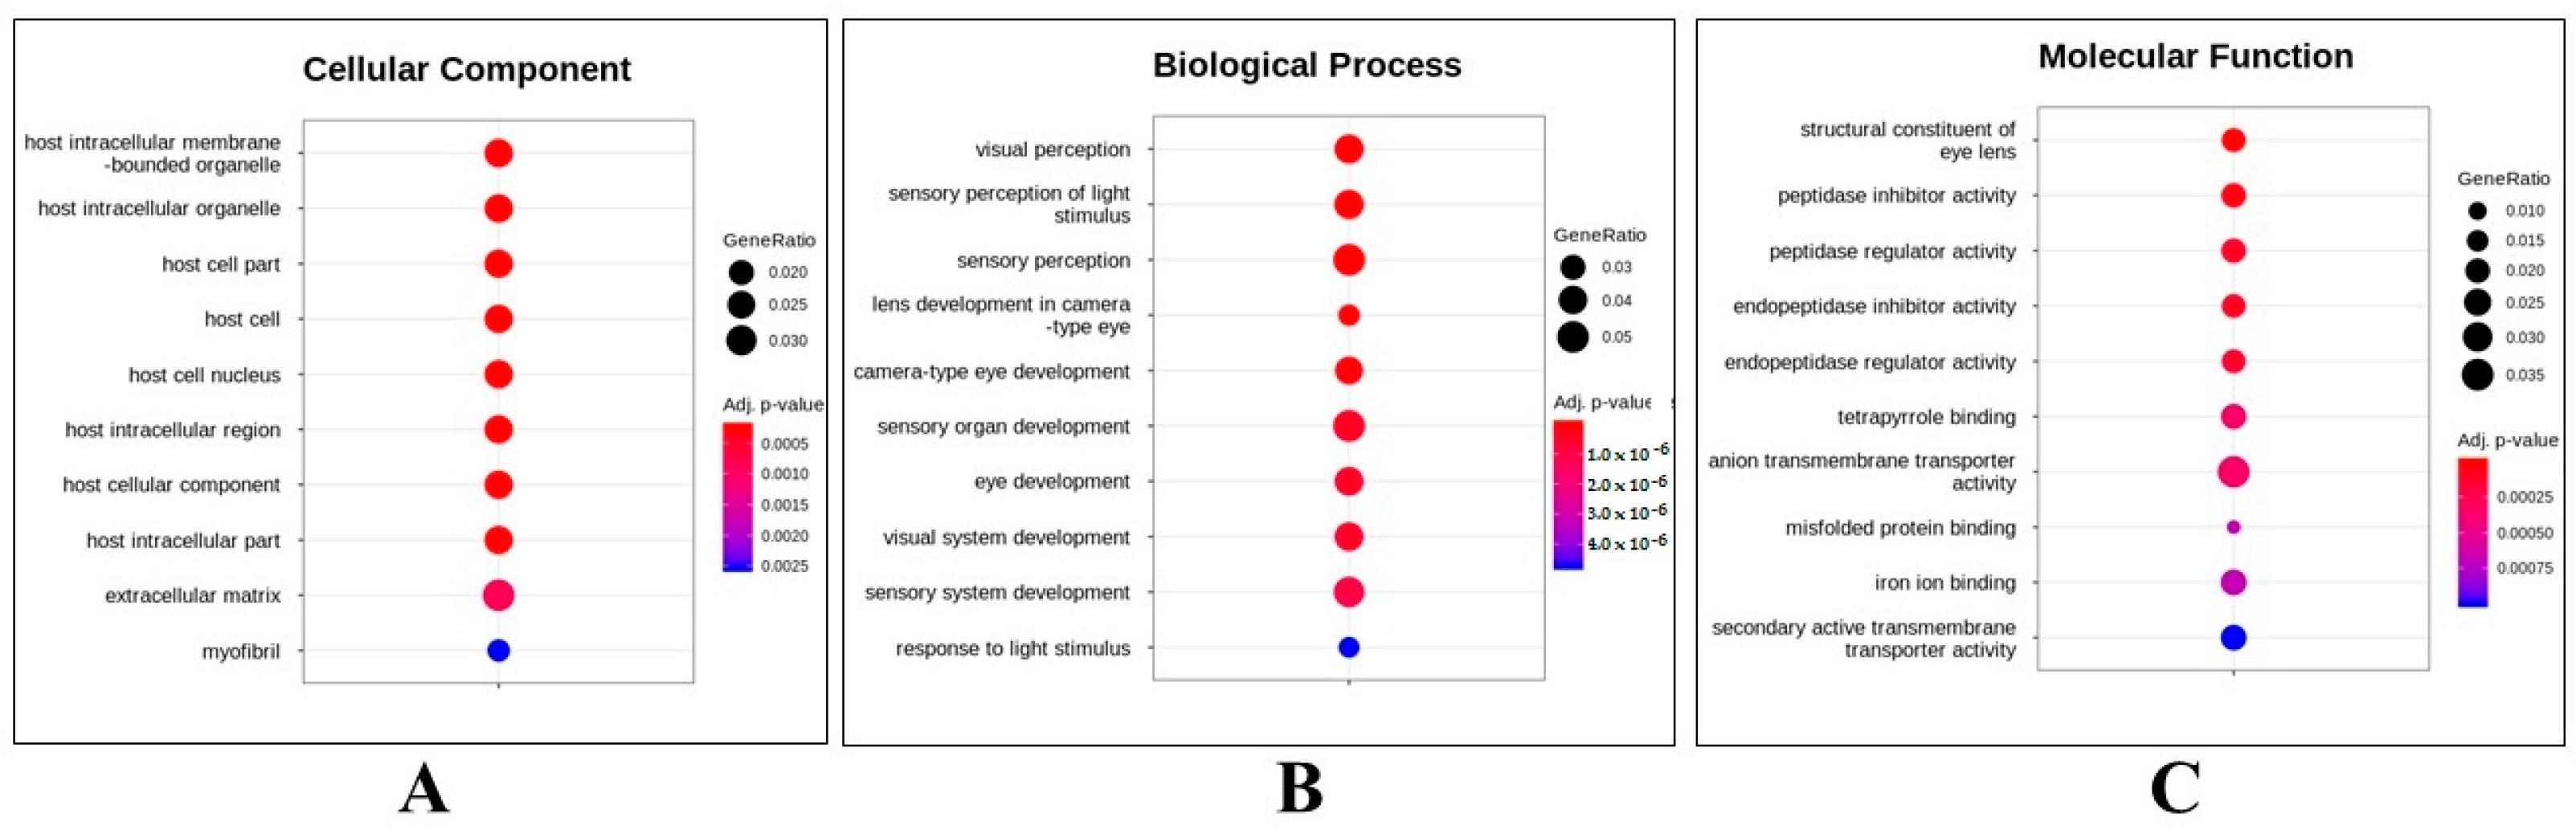
2.2. Whole Transcriptome Assessment
3. Discussion
4. Materials and Methods
4.1. Ethics Statement
4.2. Mating and Embryo Collection
4.3. Etridiazole Exposure and Assessment of Developmental Deformities
4.4. Cardiac Abnormality Analyses
4.5. Eye size Measurement
4.6. Body Length Survey
4.7. Statistical Analysis
4.8. Pair-end RNA-Sequencing and DEG Selection
4.9. DEG Analysis
4.10. qPCR
5. Conclusions
Supplementary Materials
Author Contributions
Funding
Institutional Review Board Statement
Informed Consent Statement
Data Availability Statement
Conflicts of Interest
References
- Zhan, W.; Zhou, R.; Mao, P.; Yuan, C.; Zhang, T.; Liu, Y.; Tian, J.; Wang, H.; Xue, W. Synthesis, antifungal activity and mechanism of action of novel chalcone derivatives containing 1,2,4-triazolo-[3,4-b]-1,3,4-thiadiazole. Mol. Divers. 2023, 1–14. [Google Scholar] [CrossRef]
- Kalinina, T.A.; Balandina, V.I.; Obydennov, K.L.; Slepukhin, P.A.; Fan, Z.; Bakulev, V.A.; Glukhareva, T.V. Synthesis, Fungicidal Activity and Plant Protective Properties of 1, 2, 3-Thiadiazole and Isothiazole-Based N-acyl-N-arylalaninates. Molecules 2023, 28, 419. [Google Scholar] [CrossRef]
- RED. Etridiazole (Terrazole ®). US EPA 738-R-00-019. 2000; pp. 1–124. Available online: https://www3.epa.gov/pesticides/chem_search/reg_actions/reregistration/red_PC-084701_1-Sep-00.pdf (accessed on 4 October 2023).
- Peck, A.M.; Hornbuckle, K.C. Gas-phase concentrations of current-use pesticides in Iowa. Environ. Sci. Technol. 2005, 39, 2952–2959. [Google Scholar] [CrossRef]
- National Center for Biotechnology Information. PubChem Compound Summary for CID 17432, Etridiazole. Available online: https://pubchem.ncbi.nlm.nih.gov/compound/Etridiazole (accessed on 15 August 2023).
- Pesticide Ecotoxicity Database (2017) United States Environmental Protection Agency. Available online: https://ecotox.ipmcenters.org/details.cfm?recordID=36559 (accessed on 13 March 2023).
- Dalvi, R.; Howell, C. Toxic effects of a fungicide, 5-ethoxy-3-(trichloromethyl)-1, 2, 4-thiadiazole (terrazole), on the hepatic drug metabolizing enzyme system in mice. Bull. Environ. Contam. Toxicol. 1977, 17, 225–232. [Google Scholar] [CrossRef]
- Smith, M.; Randall, J.; Tocco, D.; York, R.; Stober, J.; Read, E.J. Teratogenic effects of trichloroacetonitrile in the Long-Evans rat. Teratology 1988, 38, 113–120. [Google Scholar] [CrossRef] [PubMed]
- Nishimura, Y.; Inoue, A.; Sasagawa, S.; Koiwa, J.; Kawaguchi, K.; Kawase, R.; Maruyama, T.; Kim, S.; Tanaka, T. Using zebrafish in systems toxicology for developmental toxicity testing. Congenit. Anom. 2016, 56, 18–27. [Google Scholar] [CrossRef] [PubMed]
- Vasamsetti, B.M.K.; Kim, N.-S.; Chon, K.; Park, H.-H. Teratogenic and developmental toxic effects of etridiazole on zebrafish (Danio rerio) embryos. Appl. Biol. Chem. 2020, 63, 80. [Google Scholar] [CrossRef]
- Vasamsetti, B.M.K.; Chon, K.; Kim, J.; Oh, J.-A.; Yoon, C.-Y.; Park, H.-H. Developmental Toxic Effects of Thiram on Developing Zebrafish (Danio rerio) Embryos. Toxics 2022, 10, 369. [Google Scholar] [CrossRef]
- Vasamsetti, B.M.K.; Kim, N.S.; Chon, K.; Park, H.-H. Developmental toxic effects of phosmet on zebrafish (Danio rerio) embryos. Korean J. Pestic. Sci. 2020, 24, 343–351. [Google Scholar] [CrossRef]
- Park, M.Y.; Vasamsetti, B.M.K.; Kim, W.S.; Kang, H.J.; Kim, D.-Y.; Lim, B.; Cho, K.; Kim, J.S.; Chee, H.K.; Park, J.H. Comprehensive analysis of cardiac xeno-graft unveils rejection mechanisms. Int. J. Mol. Sci. 2021, 22, 751. [Google Scholar] [CrossRef]
- Vasamsetti, B.M.K.; Chon, K.; Choi, J.-Y.; Kim, J.; Yoon, C.-Y. Transcriptome Analysis of Thiram-Treated Zebrafish (Danio rerio) Embryos Reveals Disruption of Reproduction Signaling Pathways. Biology 2023, 12, 156. [Google Scholar] [CrossRef] [PubMed]
- Vasamsetti, B.M.K.; Chon, K.; Kim, J.; Oh, J.-A.; Yoon, C.-Y.; Park, H.-H. Transcriptome-based identification of genes responding to the organophosphate pesticide phosmet in Danio rerio. Genes 2021, 12, 1738. [Google Scholar] [CrossRef] [PubMed]
- Pathak, V.M.; Verma, V.K.; Rawat, B.S.; Kaur, B.; Babu, N.; Sharma, A.; Dewali, S.; Yadav, M.; Kumari, R.; Singh, S. Current status of pesticide effects on environment, human health and it’s eco-friendly management as bioremediation: A comprehensive review. Front. Microbiol. 2022, 13, 2833. [Google Scholar] [CrossRef] [PubMed]
- Chen, X.-F.; Lin, Z.-C.; Qi, Z.; Cai, Z.; Chen, Z.-F. Effects of pollutant toxicity on the eyes of aquatic life monitored by visual dysfunction in zebrafish: A review. Environ. Chem. Lett. 2023, 21, 1177–1201. [Google Scholar] [CrossRef]
- Schonthaler, H.B.; Lampert, J.M.; von Lintig, J.; Schwarz, H.; Geisler, R.; Neuhauss, S.C. A mutation in the silver gene leads to defects in melanosome biogenesis and alterations in the visual system in the zebrafish mutant fading vision. Dev. Biol. 2005, 284, 421–436. [Google Scholar] [CrossRef]
- Mannu, G.S. Retinal phototransduction. Neurosci. J. 2014, 19, 275–280. [Google Scholar]
- Leung, N.Y.; Montell, C. Unconventional roles of opsins. Annu. Rev. Cell Dev. Biol. 2017, 33, 241–264. [Google Scholar] [CrossRef]
- Qiu, L.; Wei, S.; Yang, Y.; Zhang, R.; Ru, S.; Zhang, X. Mechanism of bisphenol S exposure on color sensitivity of zebrafish larvae. Environ. Pollut. 2023, 316, 120670. [Google Scholar] [CrossRef]
- Zang, J.; Keim, J.; Kastenhuber, E.; Gesemann, M.; Neuhauss, S.C. Recoverin depletion accelerates cone photoresponse recovery. Open Biol. 2015, 5, 150086. [Google Scholar] [CrossRef]
- Yao, K.; Qiu, S.; Wang, Y.V.; Park, S.J.; Mohns, E.J.; Mehta, B.; Liu, X.; Chang, B.; Zenisek, D.; Crair, M.C. Restoration of vision after de novo genesis of rod photoreceptors in mammalian retinas. Nature 2018, 560, 484–488. [Google Scholar] [CrossRef]
- Palczewski, K.; Subbaraya, I.; Gorczyca, W.A.; Helekar, B.S.; Ruiz, C.C.; Ohguro, H.; Huang, J.; Zhao, X.; Crabb, J.W.; Johnson, R.S. Molecular cloning and characterization of retinal photoreceptor guanylyl cyclase-activating protein. Neuron 1994, 13, 395–404. [Google Scholar] [CrossRef] [PubMed]
- Stiebel-Kalish, H.; Reich, E.; Rainy, N.; Vatine, G.; Nisgav, Y.; Tovar, A.; Gothilf, Y.; Bach, M. Gucy2f zebrafish knockdown–a model for Gucy2d-related leber congenital amaurosis. Eur. J. Hum. Genet. 2012, 20, 884–889. [Google Scholar] [CrossRef] [PubMed]
- Crouzier, L.; Diez, C.; Richard, E.M.; Cubedo, N.; Barbereau, C.; Rossel, M.; Delaunay, T.; Maurice, T.; Delprat, B. Loss of Pde6a induces rod outer segment shrinkage and visual alterations in pde6aQ70X mutant zebrafish, a relevant model of retinal dystrophy. Front. Cell Dev. Biol. 2021, 9, 675517. [Google Scholar] [CrossRef] [PubMed]
- Brockerhoff, S.E.; Rieke, F.; Matthews, H.R.; Taylor, M.R.; Kennedy, B.; Ankoudinova, I.; Niemi, G.A.; Tucker, C.L.; Xiao, M.; Cilluffo, M.C. Light stimulates a transducin-independent increase of cytoplasmic Ca2+ and suppression of current in cones from the zebrafish mutant nof. J. Neurosci. 2003, 23, 470–480. [Google Scholar] [CrossRef]
- Chrispell, J.D.; Dong, E.; Osawa, S.; Liu, J.; Cameron, D.J.; Weiss, E.R. Grk1b and Grk7a both contribute to the recovery of the isolated cone photoresponse in larval zebrafish. Investig. Ophthalmol. Vis. Sci. 2018, 59, 5116–5124. [Google Scholar] [CrossRef]
- Chrispell, J.D.; Xiong, Y.; Weiss, E.R. Grk7 but not Grk1 undergoes cAMP-dependent phosphorylation in zebrafish cone photoreceptors and mediates cone photoresponse recovery to elevated cAMP. J. Biol. Chem. 2022, 298, 102636. [Google Scholar] [CrossRef]
- Blechinger, S.R.; Evans, T.G.; Tang, P.T.; Kuwada, J.Y.; Warren Jr, J.T.; Krone, P.H. The heat-inducible zebrafish hsp70 gene is expressed during normal lens development under non-stress conditions. Mech. Dev. 2002, 112, 213–215. [Google Scholar] [CrossRef]
- Lohse, M.J.; Engelhardt, S.; Eschenhagen, T. What is the role of β-adrenergic signaling in heart failure? Circ. Res. 2003, 93, 896–906. [Google Scholar] [CrossRef]
- Liu, Z.; Khalil, R.A. Evolving mechanisms of vascular smooth muscle contraction highlight key targets in vascular disease. Biochem. Pharmacol. 2018, 153, 91–122. [Google Scholar] [CrossRef]
- Chakraborti, S.; Das, S.; Kar, P.; Ghosh, B.; Samanta, K.; Kolley, S.; Ghosh, S.; Roy, S.; Chakraborti, T. Calcium signaling phenomena in heart diseases: A perspective. Mol. Cell. Biochem. 2007, 298, 1–40. [Google Scholar] [CrossRef]
- Liu, P.; Zhong, T.P. MAPK/ERK signalling is required for zebrafish cardiac regeneration. Biotechnol. Lett. 2017, 39, 1069–1077. [Google Scholar] [CrossRef] [PubMed]
- Webb, S.E.; Miller, A.L. Calcium signalling during zebrafish embryonic development. Bioessays 2000, 22, 113–123. [Google Scholar] [CrossRef]
- Webb, S.E.; Fluck, R.A.; Miller, A.L. Calcium signaling during the early development of medaka and zebrafish. Biochimie 2011, 93, 2112–2125. [Google Scholar] [CrossRef] [PubMed]
- Salgado-Almario, J.; Vicente, M.; Vincent, P.; Domingo, B.; Llopis, J. Mapping calcium dynamics in the heart of zebrafish embryos with ratiometric genetically encoded calcium indicators. Int. J. Mol. Sci. 2020, 21, 6610. [Google Scholar] [CrossRef] [PubMed]
- T Roe, A.; Frisk, M.; E Louch, W. Targeting cardiomyocyte Ca2 homeostasis in heart failure. Curr. Pharm. Des. 2015, 21, 431–448. [Google Scholar] [CrossRef]
- Créton, R.; Speksnijder, J.E.; Jaffe, L.F. Patterns of free calcium in zebrafish embryos. J. Cell Sci. 1998, 111, 1613–1622. [Google Scholar] [CrossRef]
- Xiong, Y.; Wang, C.; Shi, L.; Wang, L.; Zhou, Z.; Chen, D.; Wang, J.; Guo, H. Myosin light chain kinase: A potential target for treatment of inflammatory diseases. J. Cell Sci. 2017, 8, 292. [Google Scholar] [CrossRef]
- Hsu, L.S.; Tseng, C.Y. Zebrafish calcium/calmodulin-dependent protein kinase II (cam-kii) inhibitors: Expression patterns and their roles in zebrafish brain development. Dev. Dyn. 2010, 239, 3098–3105. [Google Scholar] [CrossRef]
- Beghi, S.; Furmanik, M.; Jaminon, A.; Veltrop, R.; Rapp, N.; Wichapong, K.; Bidar, E.; Buschini, A.; Schurgers, L.J. Calcium signalling in heart and vessels: Role of calmodulin and downstream calmodulin-dependent protein kinases. Int. J. Mol. Sci. 2022, 23, 16139. [Google Scholar] [CrossRef]
- Tanoue, A.; Koba, M.; Miyawaki, S.; Koshimizu, T.-a.; Hosoda, C.; Oshikawa, S.; Tsujimoto, G. Role of the α 1D-adrenegric receptor in the development of salt-induced hypertension. Hypertension 2002, 40, 101–106. [Google Scholar] [CrossRef]
- Steele, S.L.; Yang, X.; Debiais-Thibaud, M.; Schwerte, T.; Pelster, B.; Ekker, M.; Tiberi, M.; Perry, S.F. In vivo and in vitro assessment of cardiac β-adrenergic receptors in larval zebrafish (Danio rerio). J. Exp. Biol. 2011, 214, 1445–1457. [Google Scholar] [CrossRef] [PubMed]
- Bondurand, N.; Dufour, S.; Pingault, V. News from the endothelin-3/EDNRB signaling pathway: Role during enteric nervous system development and involvement in neural crest-associated disorders. Dev. Biol. 2018, 444, S156–S169. [Google Scholar] [CrossRef] [PubMed]
- Herring, B.P.; Dixon, S.; Gallagher, P.J. Smooth muscle myosin light chain kinase expression in cardiac and skeletal muscle. Am. J. Physiol. Cell Physiol. 2000, 279, C1656–C1664. [Google Scholar] [CrossRef]
- Meyer, E.E.; Clancy, C.E.; Lewis, T.J. Dynamics of adrenergic signaling in cardiac myocytes and implications for pharmacological treatment. J. Theor. Biol. 2021, 519, 110619. [Google Scholar] [CrossRef] [PubMed]
- Honkoop, H.; de Bakker, D.E.; Aharonov, A.; Kruse, F.; Shakked, A.; Nguyen, P.D.; de Heus, C.; Garric, L.; Muraro, M.J.; Shoffner, A. Single-cell analysis uncovers that metabolic reprogramming by ErbB2 signaling is essential for cardiomyocyte proliferation in the regenerating heart. eLife 2019, 8, e50163. [Google Scholar] [CrossRef]
- Avcilar-Kucukgoze, I.; Kashina, A. Hijacking tRNAs from translation: Regulatory functions of tRNAs in mammalian cell physiology. Front. Mol. Biosci. 2020, 7, 610617. [Google Scholar] [CrossRef]
- Waldron, A.; Wilcox, C.; Francklyn, C.; Ebert, A. Knock-down of histidyl-tRNA synthetase causes cell cycle arrest and apoptosis of neuronal progenitor cells in vivo. Front. Cell Dev. Biol. 2019, 7, 67. [Google Scholar] [CrossRef]
- Reverendo, M.; Soares, A.R.; Pereira, P.M.; Carreto, L.; Ferreira, V.; Gatti, E.; Pierre, P.; Moura, G.R.; Santos, M.A. TRNA mutations that affect decoding fidelity deregulate development and the proteostasis network in zebrafish. RNA Biol. 2014, 11, 1199–1213. [Google Scholar] [CrossRef]
- Cargnello, M.; Roux, P.P. Activation and function of the MAPKs and their substrates, the MAPK-activated protein kinases. Microbiol. Mol. Biol. Rev. 2011, 75, 50–83. [Google Scholar] [CrossRef]
- Park, Y.S.; Liu, Z.; Vasamsetti, B.M.K.; Cho, N.J. The ERK1/2 and mTORC1 Signaling Pathways Are Involved in the Muscarinic Acetylcholine Receptor-Mediated Proliferation of SNU-407 Colon Cancer Cells. J. Cell. Biochem. 2016, 117, 2854–2863. [Google Scholar] [CrossRef]
- Vasamsetti, B.M.K.; Liu, Z.; Park, Y.-S.; Cho, N.J. Muscarinic acetylcholine receptors regulate the dephosphorylation of eukaryotic translation elongation factor 2 in SNU-407 colon cancer cells. Biochem. Biophys. Res. Commun. 2019, 516, 424–429. [Google Scholar] [CrossRef] [PubMed]
- Krens, S.; Corredor-Adámez, M.; He, S.; Snaar-Jagalska, B.E.; Spaink, H.P. ERK1 and ERK2 MAPK are key regulators of distinct gene sets in zebrafish embryogenesis. BMC Genom. 2008, 9, 196. [Google Scholar] [CrossRef] [PubMed]
- Strähle, U.; Scholz, S.; Geisler, R.; Greiner, P.; Hollert, H.; Rastegar, S.; Schumacher, A.; Selderslaghs, I.; Weiss, C.; Witters, H. Zebrafish embryos as an alternative to animal experiments—A commentary on the definition of the onset of protected life stages in animal welfare regulations. Reprod. Toxicol. 2012, 33, 128–132. [Google Scholar] [CrossRef] [PubMed]


| Samples | Total Reads | Processed Reads | Q20 (%) | Q30 (%) | GC (%) | Mapped Reads | Unmapped Reads |
|---|---|---|---|---|---|---|---|
| UTZF-1 | 72,783,012 | 71,783,716 | 98.91 | 96.05 | 43.62 | 60,458,452 (84.22%) | 11,325,264 (15.78%) |
| UTZF-2 | 61,925,392 | 60,857,682 | 98.91 | 96.06 | 44.95 | 51,896,692 (85.28%) | 8,960,990 (14.72%) |
| UTZF-3 | 60,878,020 | 59,726,314 | 98.85 | 95.87 | 46.00 | 51,603,485 (86.40%) | 8,122,829 (13.60%) |
| ETZF-1 | 88,823,364 | 87,431,000 | 99.06 | 96.55 | 50.43 | 70,539,606 (80.68%) | 16,891,394 (19.32%) |
| ETZF-2 | 67,022,082 | 65,997,010 | 99.88 | 96.00 | 46.40 | 55,889,349 (84.68%) | 10,107,661 (15.32%) |
| ETZF-3 | 66,550,392 | 65,065,792 | 98.97 | 96.27 | 47.32 | 55,066,792 (84.10%) | 10,414,184 (15.90) |
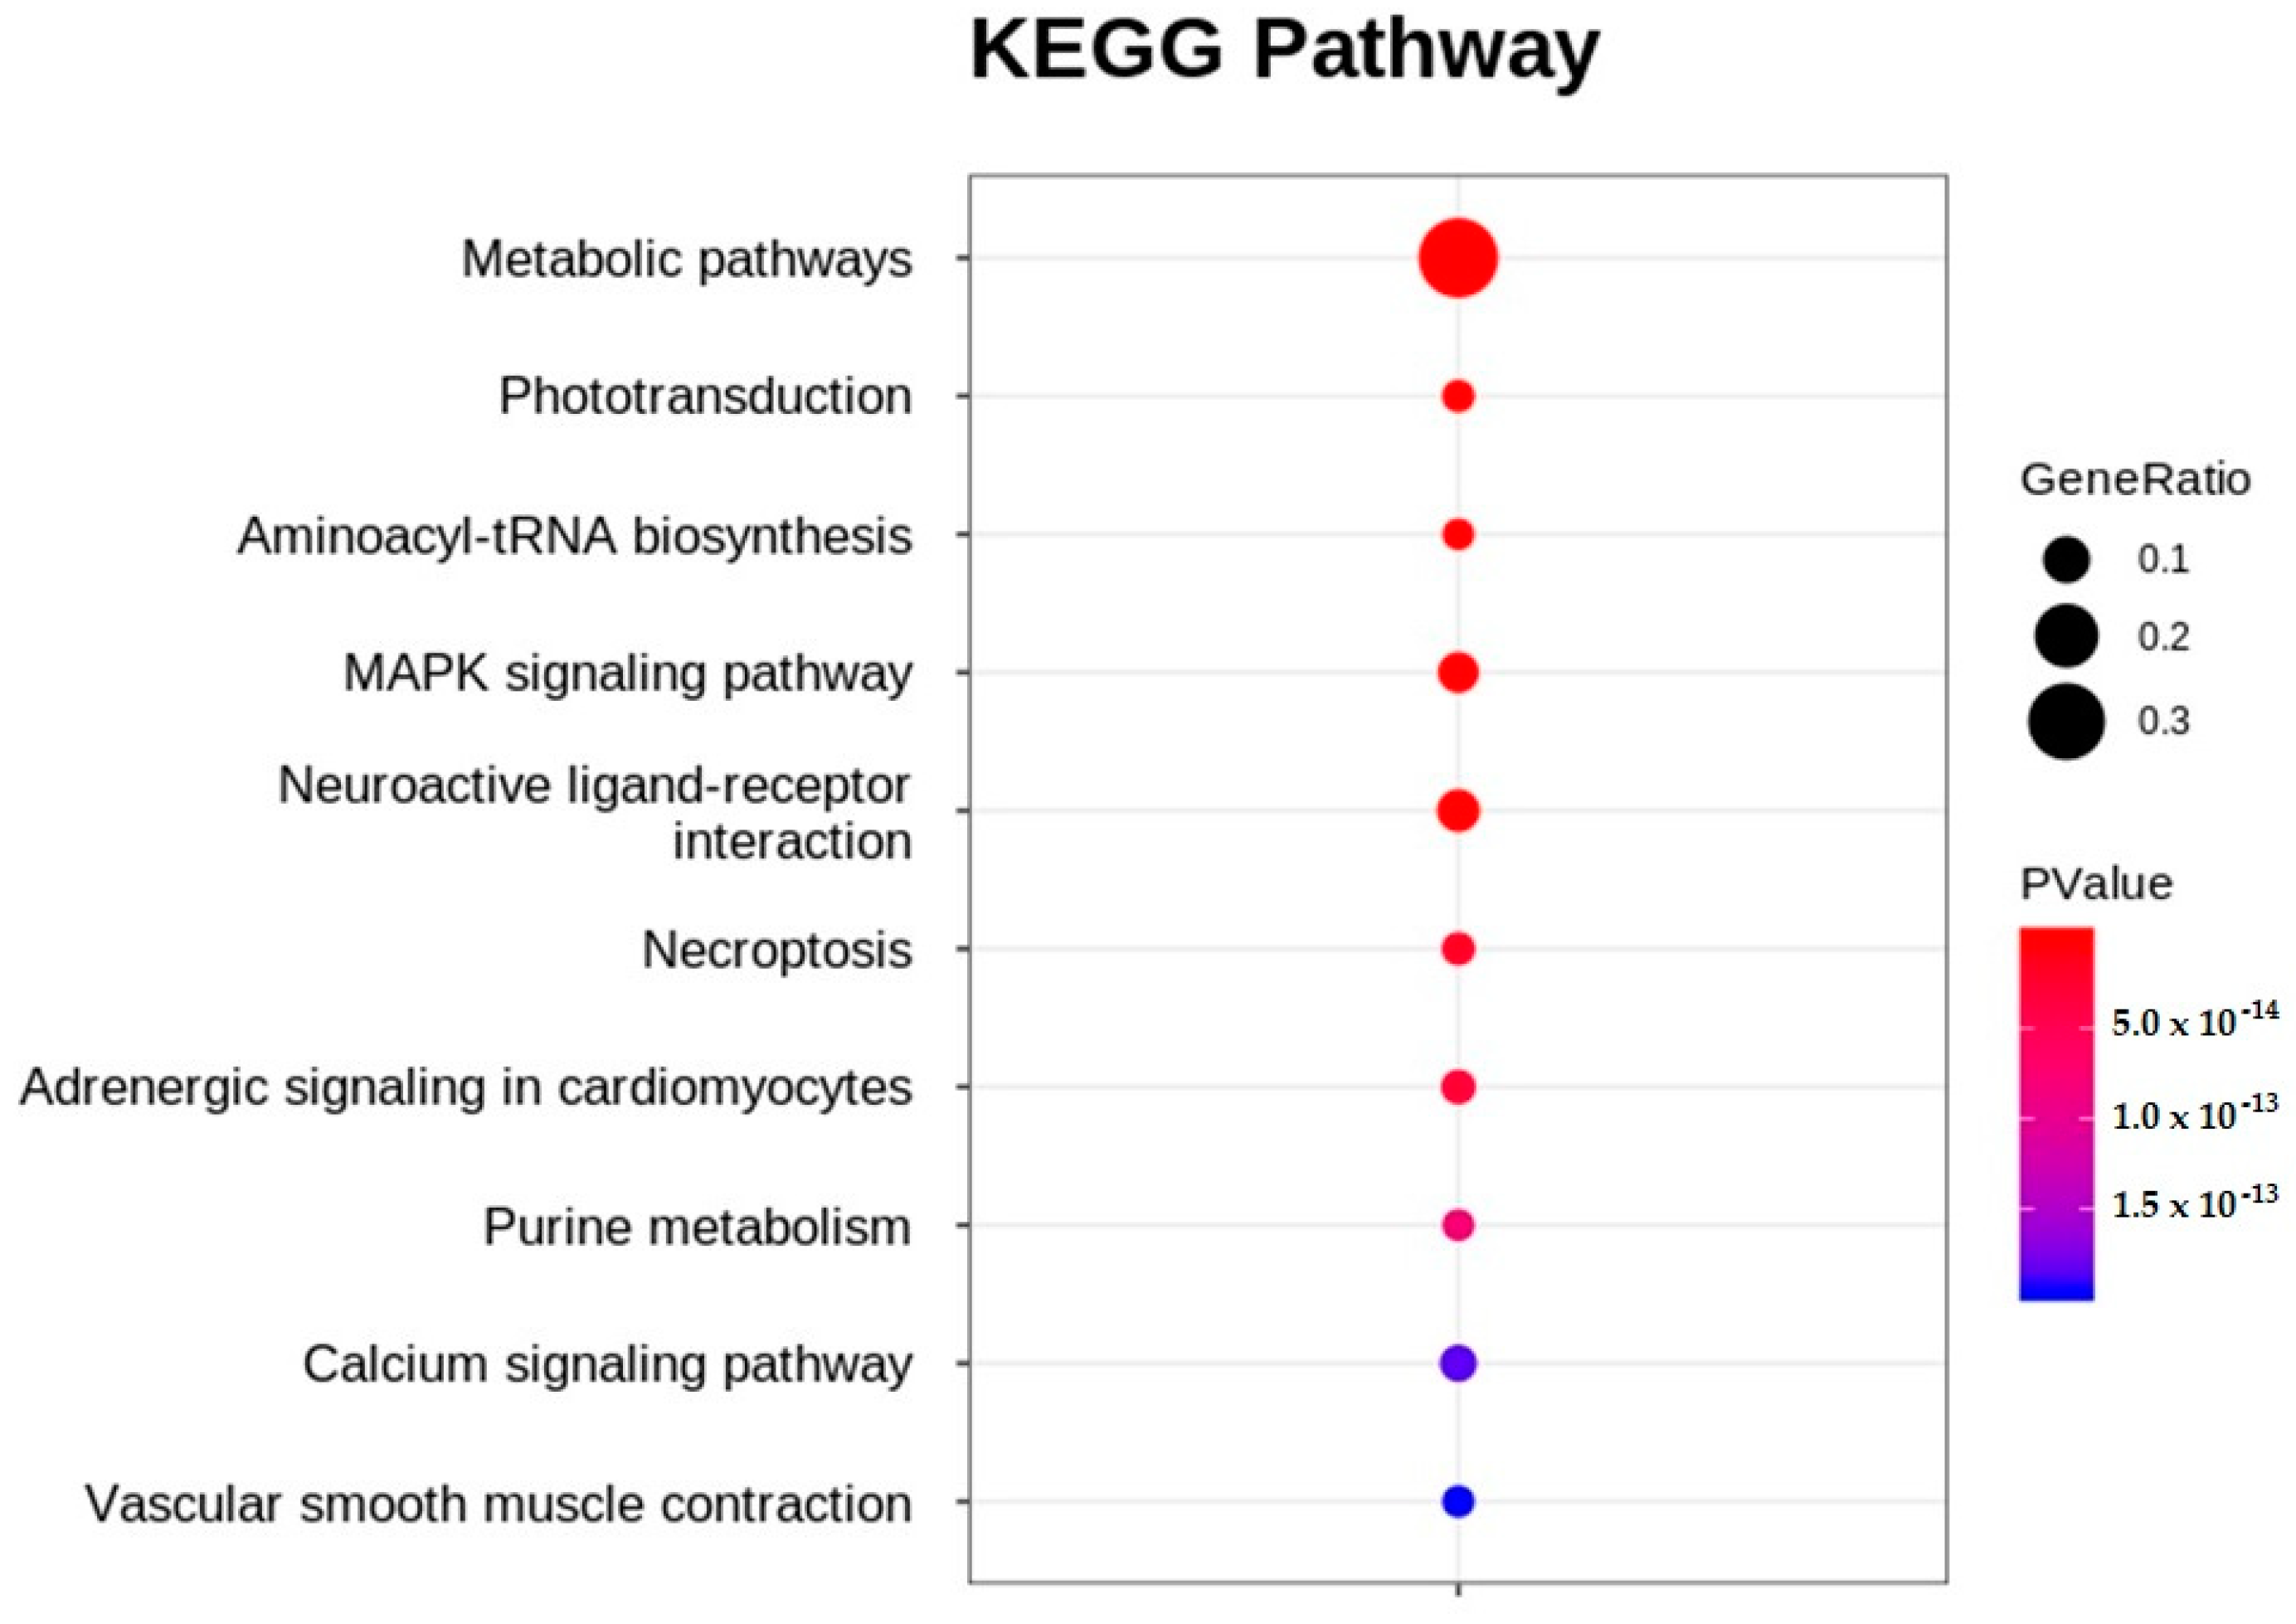
| KEGG Pathway | Differentially Expressed Genes | p-Value | False Discovery Rate | Bonferroni |
|---|---|---|---|---|
| Metabolic pathways | cyp7a1, si:ch73-111m19.2, LOC559107, tdo2a, gda, cyp2r1, gls2a, pde6c, bco1l, cyp27b1, elovl4b, cyp8b1, nme2a, agxta, chia.2, zgc:77938, pde6b, ATP8, gyg1b, si:ch211-135f11.4, arg1, gc3, cyp2p9, alas2, gucy2f, tecra, si:ch211-217a12.1, sdsl, zgc:103586, hsd20b2, pnp4b, hacd1, agxtb, pde6g, zgc:153896, rdh8b, ND3, si:ch211-264e16.1, cyp2p8, si:dkey-91i10.3, si:ch211-214p16.3, spam1, ND4L, tecrl2b, nt5e, si:ch211-132f19.7, cyp2p6, anpepb, dpm3, ugt5d1, ugt1b5, LOC100331665, zgc:92162, zgc:153704, si, gpx8, ATP6, nt5c1aa, pde6a, chs1, ND1, dgat2, cyp2p7, hyal6, si:ch211-127i16.2, ugt5b3, hao2, si:dkey-73n8.3, mdh1ab, aanat1, g6pca.2, acer1, cyp27a1.4, ND2, cel.2, pfkma, atpv0e2, entpd8, fam213b, cel.1, csgalnact1b, dgat1a, cahz, ugt1b2, agpat3, haao, lpin1, pcxb, gls2b, elovl8a, gpat3, hsd11b1la, sephs1, guk1b, pisd, ptgdsb.2, sgms2, etnppl, dhrs3a, ndufa4, si:dkey-78a14.4, acot12, upp1, tecrl2a, ND5, ahcyl1, LOC101886891, COX3, ugt5g1, ckmt2a, ND4, ND6, gbgt1l2, gstt2, ugt5b4, tdh2, ca2, adss, cyp27a1.2, suv39h1a, LOC100536156, si:ch73-55i23.1, si:ch211-197l9.4, si:ch73-71d17.1, dpys, ptges3a, got2a, zgc:153031, b3gnt5a, mocs1, ndufa11, pde5aa, entpd5a, elovl2, amd1, fech, atp5g3a, st3gal7, pnp6, th2, gstk1, entpd3, ugt1a4, gal3st1a, cds1, pdha1b, alg10, ndufab1b, mcee, hpda, nme6, gucy1a3, CYTB, si:ch211-256m1.8, ca12, alpl, si:dkey-103j14.5, gc2, pcyt1bb, pde6d, uqcr10, mars, atic, cbsb, LOC100333801, adprm, cbr1l, eno4, sat1a.2, nnt2, ak7b, ckmb, gnsb, pnp5b, LOC103911725, Glyctk, tcirg1b, shmt2, lss, galm, ugt2a6, paics, gnpda2, ptgis, renbp, si:ch211-276a23.5, got1l1, gsr, phgdh, ckma, gsto2, pla2g4aa, hk2, hyi, zgc:163121, ugt2a4, acsl4b, abat, hao1, taldo1, sqrdl, cyp51, galns, gfpt1, acsl2, odc1, amdhd2, adi1, scd, gpx1b, gpx3, psat1, eprs, si:dkey-175m17.6, ethe1, mthfr, pycr1b, p4ha2, pfkfb3, tph1b, adh8a, tdo2b, cmbl, bhmt, rdh12l, ptgs2b, mthfd1l, gstp1, si:ch211-199m3.4, dao.1, hmox1a, sqlea, ptgs2a, gldc, cox4i1l, p4ha1b, cyp24a1, gstp2 | 1.47446 × 10−90 | 2.24117 × 10−88 | 2.24117 × 10−88 |
| Phototransduction | opn1mw1, gngt1, rho, rhol, guca1c, guca1d, grk1b, gnat2, grk7a, guca1e, opn1mw2, guca1g, pde6b, gc3, guca1b, gucy2f, rcvrn3, cnga1, si:dkey-22i16.2, rgs9a, slc24a1, pde6g, pde6a, grk1a, calm3a, saga, calm1b, rcvrna, rcvrn2, gc2 | 4.87074 × 10⁻²⁷ | 7.40352 × 10⁻²⁵ | 3.70176 × 10⁻²⁵ |
| Aminoacyl-tRNA biosynthesis | trnH, trnD, trnS2, trnK, trnL2, trnE, trnN, trnY, trnG, trnI, trnQ, trnP, trnM, trnR, trnC, trnT, trnL1, trnF, farsa, mars, dars, gars, nars, vars, yars, aars, iars, eprs, tars | 7.95807 × 10⁻²² | 1.20963 × 10⁻¹⁹ | 4.03209 × 10⁻²⁰ |
| MAPK signaling | hsc70, ppm1na, fgf1a, tgfa, cacng6b, ppm1nb, fgf4, dusp10, nr4a1, dusp2, si:ch73-55i23.1, mapkapk2b, ppp3r1a, cacna1sb, egf, fgf1b, cacng8b, LOC795766, fgf20a, tgfbr1b, fosab, csf1ra, flna, insrb, met, taok3a, fgfr1b, gadd45bb, map3k14a, tnfrsf1a, irak4, kitlgb, pla2g4aa, tab1, gadd45aa, prkacba, nfkb1, angpt2a, mapk12b, gadd45ba, epha2a, rasgrp3, jun, ddit3, pgfa, gadd45ga, si:dkey-4p15.3, fas, mknk2b, hspb1, il1b, hsp70.3, hsp70.1, hsp70l | 3.48302 × 10⁻¹⁹ | 5.29419 × 10⁻¹⁷ | 1.32355 × 10⁻¹⁷ |
| Neuroactive ligand-receptor interaction | gabra6a, drd4b, sstr2b, si:dkey-1h24.2, gabrr1, LOC100007535, try, mc1r, lpar4, mtnr1ab, prlra, glrba, ednrba, si:dkey-202l22.3, adrb2b, chrna3, lpar6b, gabra6b, edn3b, prlhr2a, ptger1a, adra1bb, LOC100332187, gabrz, LOC556532, apln, p2ry1, chrna2b, htr1ab, adra1d, LOC100330650, Chrne, agtr2, vipr2, oxtrl, glra3, galn, ltb4r2a, npb, tbxa2r, p2ry6, LOC567978, Agt, htr1fb, lepa, c5, lepr, chrna5, c3a.3, chrng, sst1.2, f2r, pomca, ptger2b, f2rl1.2, ltb4r2b, rln1, c3a.6, c3a.1, adma | 9.66551 × 10⁻¹⁷ | 1.46916 × 10⁻¹⁴ | 2.93831 × 10⁻¹⁵ |
| Necroptosis | usp21, slc25a6, slc25a4, si:dkeyp-50d11.2, tlr4ba, camk2d1, si:ch73-55i23.1, h2afx, stat1a, tnfrsf1a, jak1, casp8, caspa, pla2g4aa, tnfaip3, irf9, LOC100006428, zgc:194125, zgc:92066, zgc:92480, si:ch211-202f3.3, hsp90aa1.1, zgc:198419, zgc:109934, stat3, zgc:173593, zgc:173594, fas, LOC558816, stat1b, sqstm1, il1b, hsp90aa1.2 | 1.80786 × 10⁻¹⁴ | 2.74794 × 10⁻¹² | 4.5799 × 10⁻¹³ |
| Adregenic signaling in cardiomycetes | atp1b2b, cacng6b, si:ch211-132f19.7, scn4bb, zgc:163073, atp1a3b, adrb2b, calm3a, pln, scn4ba, slc9a1, myl2b, si:ch211-225p5.8, atp1b2a, adra1bb, camk2d1, calm1b, adra1d, cacna1sb, cacng8b, agtr2, tnnt2d, creb5a, creb3l3a, cmlc1, cremb, creb3l3l, atp1a1a.2, agt, acta1a, prkacba, tpma, mapk12b, actc1b, tnnt2c, pik3r5, | 2.96038 × 10⁻¹⁴ | 4.49978 × 10⁻¹² | 6.42826 × 10⁻¹³ |
| Purine metabolism | Gda, pde6c, nme2a, pde6b, gc3, gucy2f, pnp4b, pde6g, nt5e, si:ch211-132f19.7, nt5c1aa, pde6a, entpd8, guk1b, adss, LOC100536156, pde5aa, entpd5a, pnp6, entpd3, nme6, gucy1a3, gc2, pde6d, atic, adprm, ak7b, pnp5b, paics, si:ch211-199m3.4 | 7.85124 × 10⁻¹⁴ | 1.19339 × 10⁻¹¹ | 1.49174 × 10⁻¹² |
| Calcium signaling pathway | camk1ga, si:rp71-17i16.4, phkg1a, mylk4b, stim2a, mylk4a, si:dkey-1h24.2, fgf1a, camk1gb, mylk2, si:ch211-132f19.7, slc25a6, fgf4, phkg1b, slc25a4, ednrba, adrb2b, calm3a, pln, ptger1a, adra1bb, LOC101886891, camk2d1, camk4, calm1b, ppp3r1a, adra1d, cacna1sb, egf, fgf1b, fgf20a, oxtrl, ltb4r2a, met, fgfr1b, mst1ra, mst1, tbxa2r, prkacba, mcoln3a, f2r, ltb4r2b, cxcr4a | 1.84649 × 10⁻¹³ | 2.80666 × 10⁻¹¹ | 2.98174 × 10⁻¹² |
| Vascular smooth muscle contraction | mylk4b, mylk4a, mylk2, si:ch211-132f19.7, zgc:92162, LOC101885790, calm3a, ppp1r14aa, edn3b, adra1bb, acta2, calm1b, si:ch73-55i23.1, prkg1b, adra1d, cald1b, cacna1sb, myh11a, gucy1a3, ramp2, nppa, prkg1a, LOC567978, agt, pla2g4aa, prkacba, myh9a, arhgef1b, si:ch73-265d7.2, adma | 1.96167 × 10⁻¹³ | 2.98174 ×0−11 | 2.98174 × 10⁻¹² |
| Gene Symbol | Fold Change (RNA-Seq) | Fold Change (qPCR) (Mean ± SD) |
|---|---|---|
| hsp70l | 109.43 | 189.03 ± 71.21 |
| fosl1a | 9.10 | 7.54 ± 3.04 |
| cbx7a | 9.10 | 11.82 ± 6.30 |
| atf3 | 7.84 | 8.99 ± 4.76 |
| mir181b-1 | −5.86 | −10.11 ± 4.98 |
| alas2 | −4.28 | −17.52 ± 18.21 |
| cyldb1 | −3.26 | −8.19 ± 2.58 |
| rhcga | −8.08 | −22.69 ± 8.91 |
Disclaimer/Publisher’s Note: The statements, opinions and data contained in all publications are solely those of the individual author(s) and contributor(s) and not of MDPI and/or the editor(s). MDPI and/or the editor(s) disclaim responsibility for any injury to people or property resulting from any ideas, methods, instructions or products referred to in the content. |
© 2023 by the authors. Licensee MDPI, Basel, Switzerland. This article is an open access article distributed under the terms and conditions of the Creative Commons Attribution (CC BY) license (https://creativecommons.org/licenses/by/4.0/).
Share and Cite
Vasamsetti, B.M.K.; Chon, K.; Yoon, C.-Y.; Kim, J.; Choi, J.-Y.; Hwang, S.; Park, K.-H. Transcriptome Profiling of Etridiazole-Exposed Zebrafish (Danio rerio) Embryos Reveals Pathways Associated with Cardiac and Ocular Toxicities. Int. J. Mol. Sci. 2023, 24, 15067. https://doi.org/10.3390/ijms242015067
Vasamsetti BMK, Chon K, Yoon C-Y, Kim J, Choi J-Y, Hwang S, Park K-H. Transcriptome Profiling of Etridiazole-Exposed Zebrafish (Danio rerio) Embryos Reveals Pathways Associated with Cardiac and Ocular Toxicities. International Journal of Molecular Sciences. 2023; 24(20):15067. https://doi.org/10.3390/ijms242015067
Chicago/Turabian StyleVasamsetti, Bala Murali Krishna, Kyongmi Chon, Chang-Young Yoon, Juyeong Kim, Ji-Yeong Choi, Sojeong Hwang, and Kyeong-Hun Park. 2023. "Transcriptome Profiling of Etridiazole-Exposed Zebrafish (Danio rerio) Embryos Reveals Pathways Associated with Cardiac and Ocular Toxicities" International Journal of Molecular Sciences 24, no. 20: 15067. https://doi.org/10.3390/ijms242015067
APA StyleVasamsetti, B. M. K., Chon, K., Yoon, C.-Y., Kim, J., Choi, J.-Y., Hwang, S., & Park, K.-H. (2023). Transcriptome Profiling of Etridiazole-Exposed Zebrafish (Danio rerio) Embryos Reveals Pathways Associated with Cardiac and Ocular Toxicities. International Journal of Molecular Sciences, 24(20), 15067. https://doi.org/10.3390/ijms242015067