Article

Evaluation of the Polygenic Risk Score for Alzheimer’s Disease in Russian Patients with Dementia Using a Low-Density Hydrogel Oligonucleotide Microarray

1
Center for Precision Genome Editing and Genetic Technologies for Biomedicine, Engelhardt Institute of Molecular Biology, Russian Academy of Sciences, 119991 Moscow, Russia
2
Mental-Health Clinic No. 1 Named after N.A. Alekseev, Zagorodnoe Highway 2, 115191 Moscow, Russia
3
Department of Basic and Applied Neurobiology, V. Serbsky Federal Medical Research Centre of Psychiatry and Narcology, Kropotkinsky per. 23, 119034 Moscow, Russia
4
International Centre for Education and Research in Neuropsychiatry (ICERN), Samara State Medical University, 443016 Samara, Russia
5
Economy Faculty, M.V. Lomonosov Moscow State University, 119991 Moscow, Russia
6
Department of Psychiatry, Federal State Budgetary Educational Institution of Higher Education “Moscow State University of Food Production”, Volokolamskoye Highway 11, 125080 Moscow, Russia
*
Author to whom correspondence should be addressed.
Int. J. Mol. Sci. 2023, 24(19), 14765; https://doi.org/10.3390/ijms241914765
Submission received: 4 September 2023 / Revised: 25 September 2023 / Accepted: 28 September 2023 / Published: 29 September 2023
(This article belongs to the Special Issue Molecular Advances in Alzheimer's Disease 2.0)

Abstract

:
The polygenic risk score (PRS), together with the ɛ4 allele of the APOE gene (APOE-ɛ4), has shown high potential for Alzheimer’s disease (AD) risk prediction. The aim of this study was to validate the model of polygenic risk in Russian patients with dementia. A microarray-based assay was developed to identify 21 markers of polygenic risk and ɛ alleles of the APOE gene. This case–control study included 348 dementia patients and 519 cognitively normal volunteers. Cerebrospinal fluid (CSF) amyloid-β (Aβ) and tau protein levels were assessed in 57 dementia patients. PRS and APOE-ɛ4 were significant genetic risk factors for dementia. Adjusted for APOE-ɛ4, individuals with PRS corresponding to the fourth quartile had an increased risk of dementia compared to the first quartile (OR 1.85; p-value 0.002). The area under the curve (AUC) was 0.559 for the PRS model only, and the inclusion of APOE-ɛ4 improved the AUC to 0.604. PRS was positively correlated with tTau and pTau181 and inversely correlated with Aβ42/Aβ40 ratio. Carriers of APOE-ɛ4 had higher levels of tTau and pTau181 and lower levels of Aβ42 and Aβ42/Aβ40. The developed assay can be part of a strategy for assessing individuals for AD risk, with the purpose of assisting primary preventive interventions.

1. Introduction

The existence of familial forms of Alzheimer’s disease (AD) suggests that genetic factors play a crucial role in the pathogenesis of this disease. The heritability is 58–79% for late-onset AD and more than 90% for early-onset AD [1].
The most studied but not exhaustive genetic risk factor for AD is the ɛ4 allele of the APOE gene (APOE-ɛ4), which encodes apolipoprotein E. This allele increases the risk of AD by 3-fold in heterozygous carriers and 15-fold in homozygous carriers [2]. People who have the APOE gene’s ɛ2 allele (APOE-ɛ2) have a lower risk of AD.
The search for reliable genetic risk factors beyond APOE has been ongoing for some time. Large international consortia such as the International Genomics of Alzheimer’s Project (IGAP) and the Alzheimer’s Disease Genetics Consortium (ADGC) have been established to examine the genetic basis of Alzheimer’s disease. Genome-wide association studies (GWASs) have accumulated vast amounts of data on AD genetics using samples from tens of thousands of AD patients and healthy donors [3,4]. These studies have identified over 40 loci associated with the disease [5]. This knowledge has significantly contributed to understanding the pathogenesis and polygenic nature of AD, forming a foundation for further research on the molecular processes of the disease’s progression and the development of new therapeutic strategies. However, single-nucleotide polymorphisms (SNPs) typically have a limited impact on disease risk and cannot be utilized as independent prognostic markers. This problem is common among multifactorial diseases. To gauge the impact of genetic factors on disease development, a polygenic risk score (PRS) approach was developed. PRS models estimate the total (multiplicative) impact of several SNPs, which are typically selected based on GWAS using specialized algorithms [6]. Each SNP is assigned a coefficient (often a weighted odds ratio or hazard ratio), and the PRS is computed as the total number of risk alleles multiplied by their corresponding coefficients.
The first PRS model for assessing the risk of developing AD was released in 2005, preceding the large-scale GWAS. This model consisted of nine SNPs, incorporating APOE-ɛ4 [7]. GWAS data have since given rise to PRS models comprising nineteen to hundreds of thousands of SNPs [8,9,10,11,12,13]. Additional factors such as APOE gene alleles, gender, age, and other social and physiological characteristics can also be incorporated.
Studies on PRS models have indicated their correlation with the age and risk of AD and dementia [8,9,10,11,14] as well as their impact on the rate of progression of mild cognitive impairment (MCI) and the risk of its conversion to AD [15,16,17]. Additionally, the relationship between PRS and cognitive function in healthy individuals of various ages has been established [18,19]. Moreover, PRS has been associated with structural and functional brain changes as well as some biochemical indicators related to signs of neurodegeneration [9,20], such as amyloid-β (Aβ) and tau protein deposition [10,21,22,23,24]. Aβ40, Aβ42, phosphorylated tau 181 (pTau181), and total tau (tTau) serve as additional diagnostic markers for AD [25]. Therefore, exploring their correlation with PRS presents an interesting avenue for investigation.
Thus, polygenic models offer a promising approach to identifying individuals at high risk for developing AD. These tests may have practical applications in selecting personalized preventive measures and developing screening strategies. In addition, PRS models could be utilized in the design of clinical trials for AD therapy aimed at preventing disease progression. It is suggested that supplementing study cohorts with individuals who have a high PRS and thus an elevated risk for developing AD may enhance the probability of identifying effective treatment regimens [6,16,26].
It should be noted that most of the research on AD development with PRS has been performed on the European population. Therefore, further studies are required to extend the findings to other populations. In certain instances, polygenic risk models for AD have been investigated in Hispanics, Latin Americans, Asians, and other ancestry groups [9,27,28,29], and promising results have been obtained. In this work, we applied the 21-SNPs PRS model [9] for the first time in patients with dementia and cognitively normal (CN) volunteers from the European part of Russia. Such research is necessary to verify the validity of the model in the population in which it is intended to be used and to specify the risks to individuals as a function of PRS values for further use in clinical practice. The study was carried out using a specially developed DNA microarray-based assay. Furthermore, we explored the correlation of PRS with Aβ and tau proteins in cerebrospinal fluid (CSF).

2. Results

2.1. Genotyping of Patients with Dementia and CN Volunteers, Association of PRS with Dementia

The study included 348 patients with dementia and 519 cognitively normal volunteers. In total, 867 DNA samples were genotyped for 23 SNPs, including 21 polygenic risk markers according to the model of Tosto et al. [9], as well as rs429358 and rs7412 that define the ɛ alleles of the APOE gene. A multiplex assay utilizing hybridization on low-density hydrogel microarrays was the primary method for SNP genotyping. The genotype and allele frequency data based on the results of SNP identification are presented in Table S1. The distribution of genotypes for all studied markers conformed to the Hardy–Weinberg equilibrium. Genotyping results for 21 PRS markers from 100 DNA samples (50 from dementia patients and 50 from CN volunteers) were validated using high-resolution melting analysis and selectively confirmed via Sanger sequencing. Additionally, APOE alleles were identified via real-time PCR using hydrolysis probes for all samples. The genotyping results obtained by various methods were consistent for 100% of the samples.
For each sample, the PRS was calculated. The PRS values ranged from −1.148 to 1.096. A PRS less than −0.268 corresponded to the first quartile, while a PRS greater than or equal to 0.1725 corresponded to the fourth quartile. The thresholds for the first and top deciles were −0.4598 and 0.3924, respectively.
The distribution of PRS in both patients with dementia and CN volunteers is displayed in Figure 1. A significant difference was observed in the mean PRS between patients with dementia and CN volunteers (t-test, p-value = 0.001). The logistic regression analysis indicated an association between dementia and both PRS and APOE-ɛ4 for both homozygotes and heterozygotes, as shown in Table 1. Since the ɛ2-allele carriage was not a significant factor in this study, it was not included in the further analysis of how genetic factors impact the risk of dementia.
Adjusted for APOE-ɛ4, individuals with a PRS falling within the fourth quartile or tenth decile had a higher risk of dementia compared to those in the first quartile/decile: OR = 1.85 (95% CI = 1.25–2.74; p-value = 0.002) and OR = 2.27 (95% CI = 1.22–4.28; p-value = 0.01), respectively.
Next, we examined the extent of the impact of APOE-ɛ4 as a risk factor in individuals with varying PRS values. Compared with non-carriers, carriers of APOE-ɛ4 with the fourth quartile of PRS had a greater risk of dementia, while the presence of the APOE-ɛ4 in individuals with the first quartile was not a significant risk factor in our cohort (Table 2).

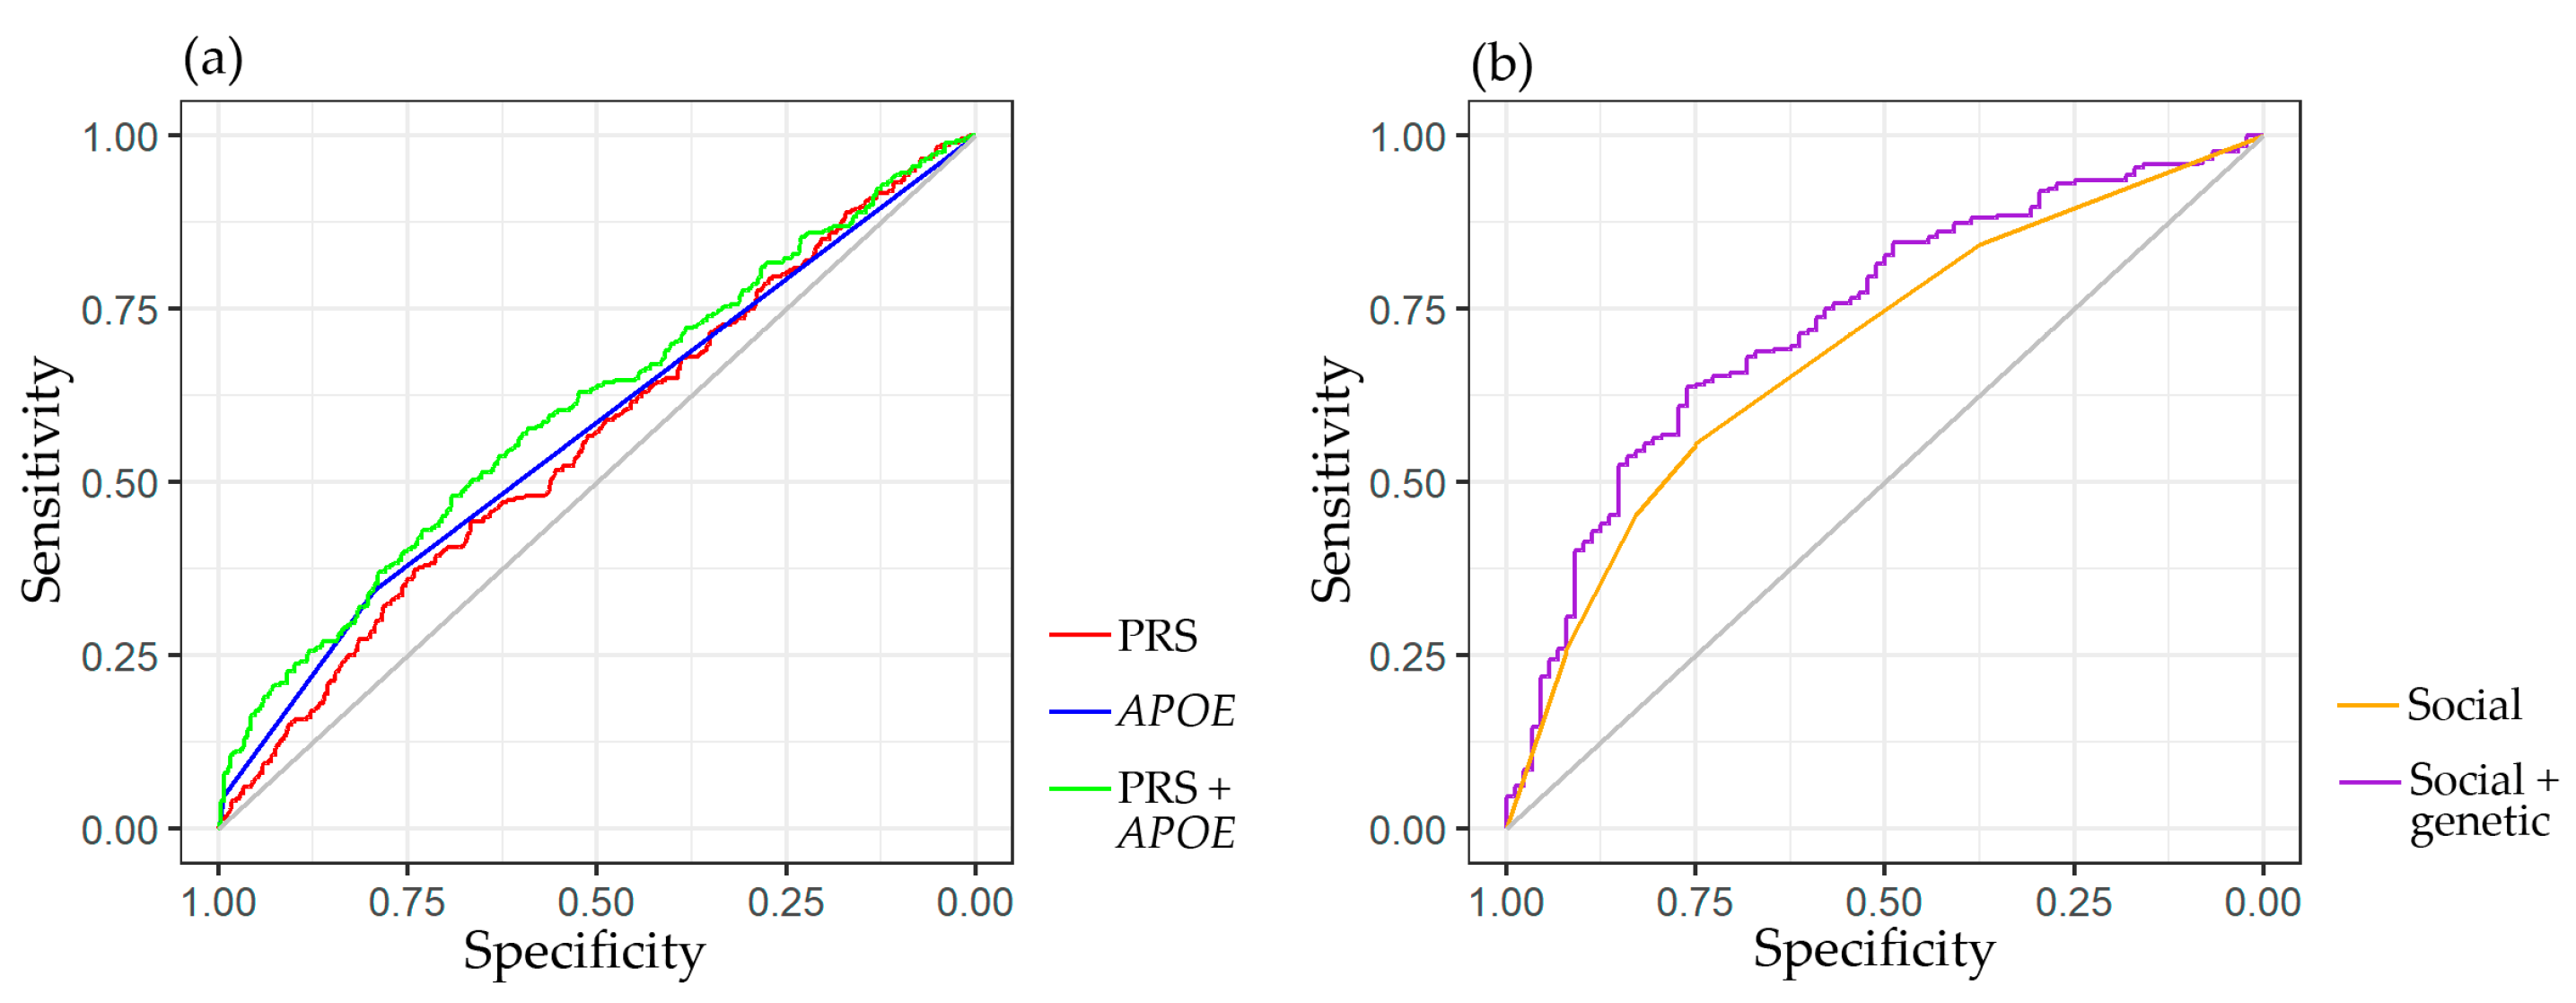
2.2. Predictive Significance of Genetic and Social Factors on the Risk of Dementia

Receiver operating characteristic (ROC) analysis was conducted on logistic regression models utilizing various predictors. The impact of genetic factors was evaluated across the entire cohort (n = 867), and the ROC curves are displayed in Figure 2a. The area under the curve (AUC) for the PRS model alone was 0.559, while the inclusion of APOE-ɛ4 improved the AUC to 0.604. The AUC for APOE-ɛ4 alone was 0.573.
Since detailed questioning of all patients did not occur, a separate analysis was conducted in a group of 347 individuals (88 CN volunteers and 259 patients with dementia) who had available data regarding the presence of a family, higher education, and intellectual work. This analysis considered the impact of social factors in addition to the PRS and APOE-ɛ4. When these variables were included, the AUC increased from 0.69 to 0.7343 (Figure 2b). The genetic factors demonstrated a statistically significant improvement in the model (Table S2).

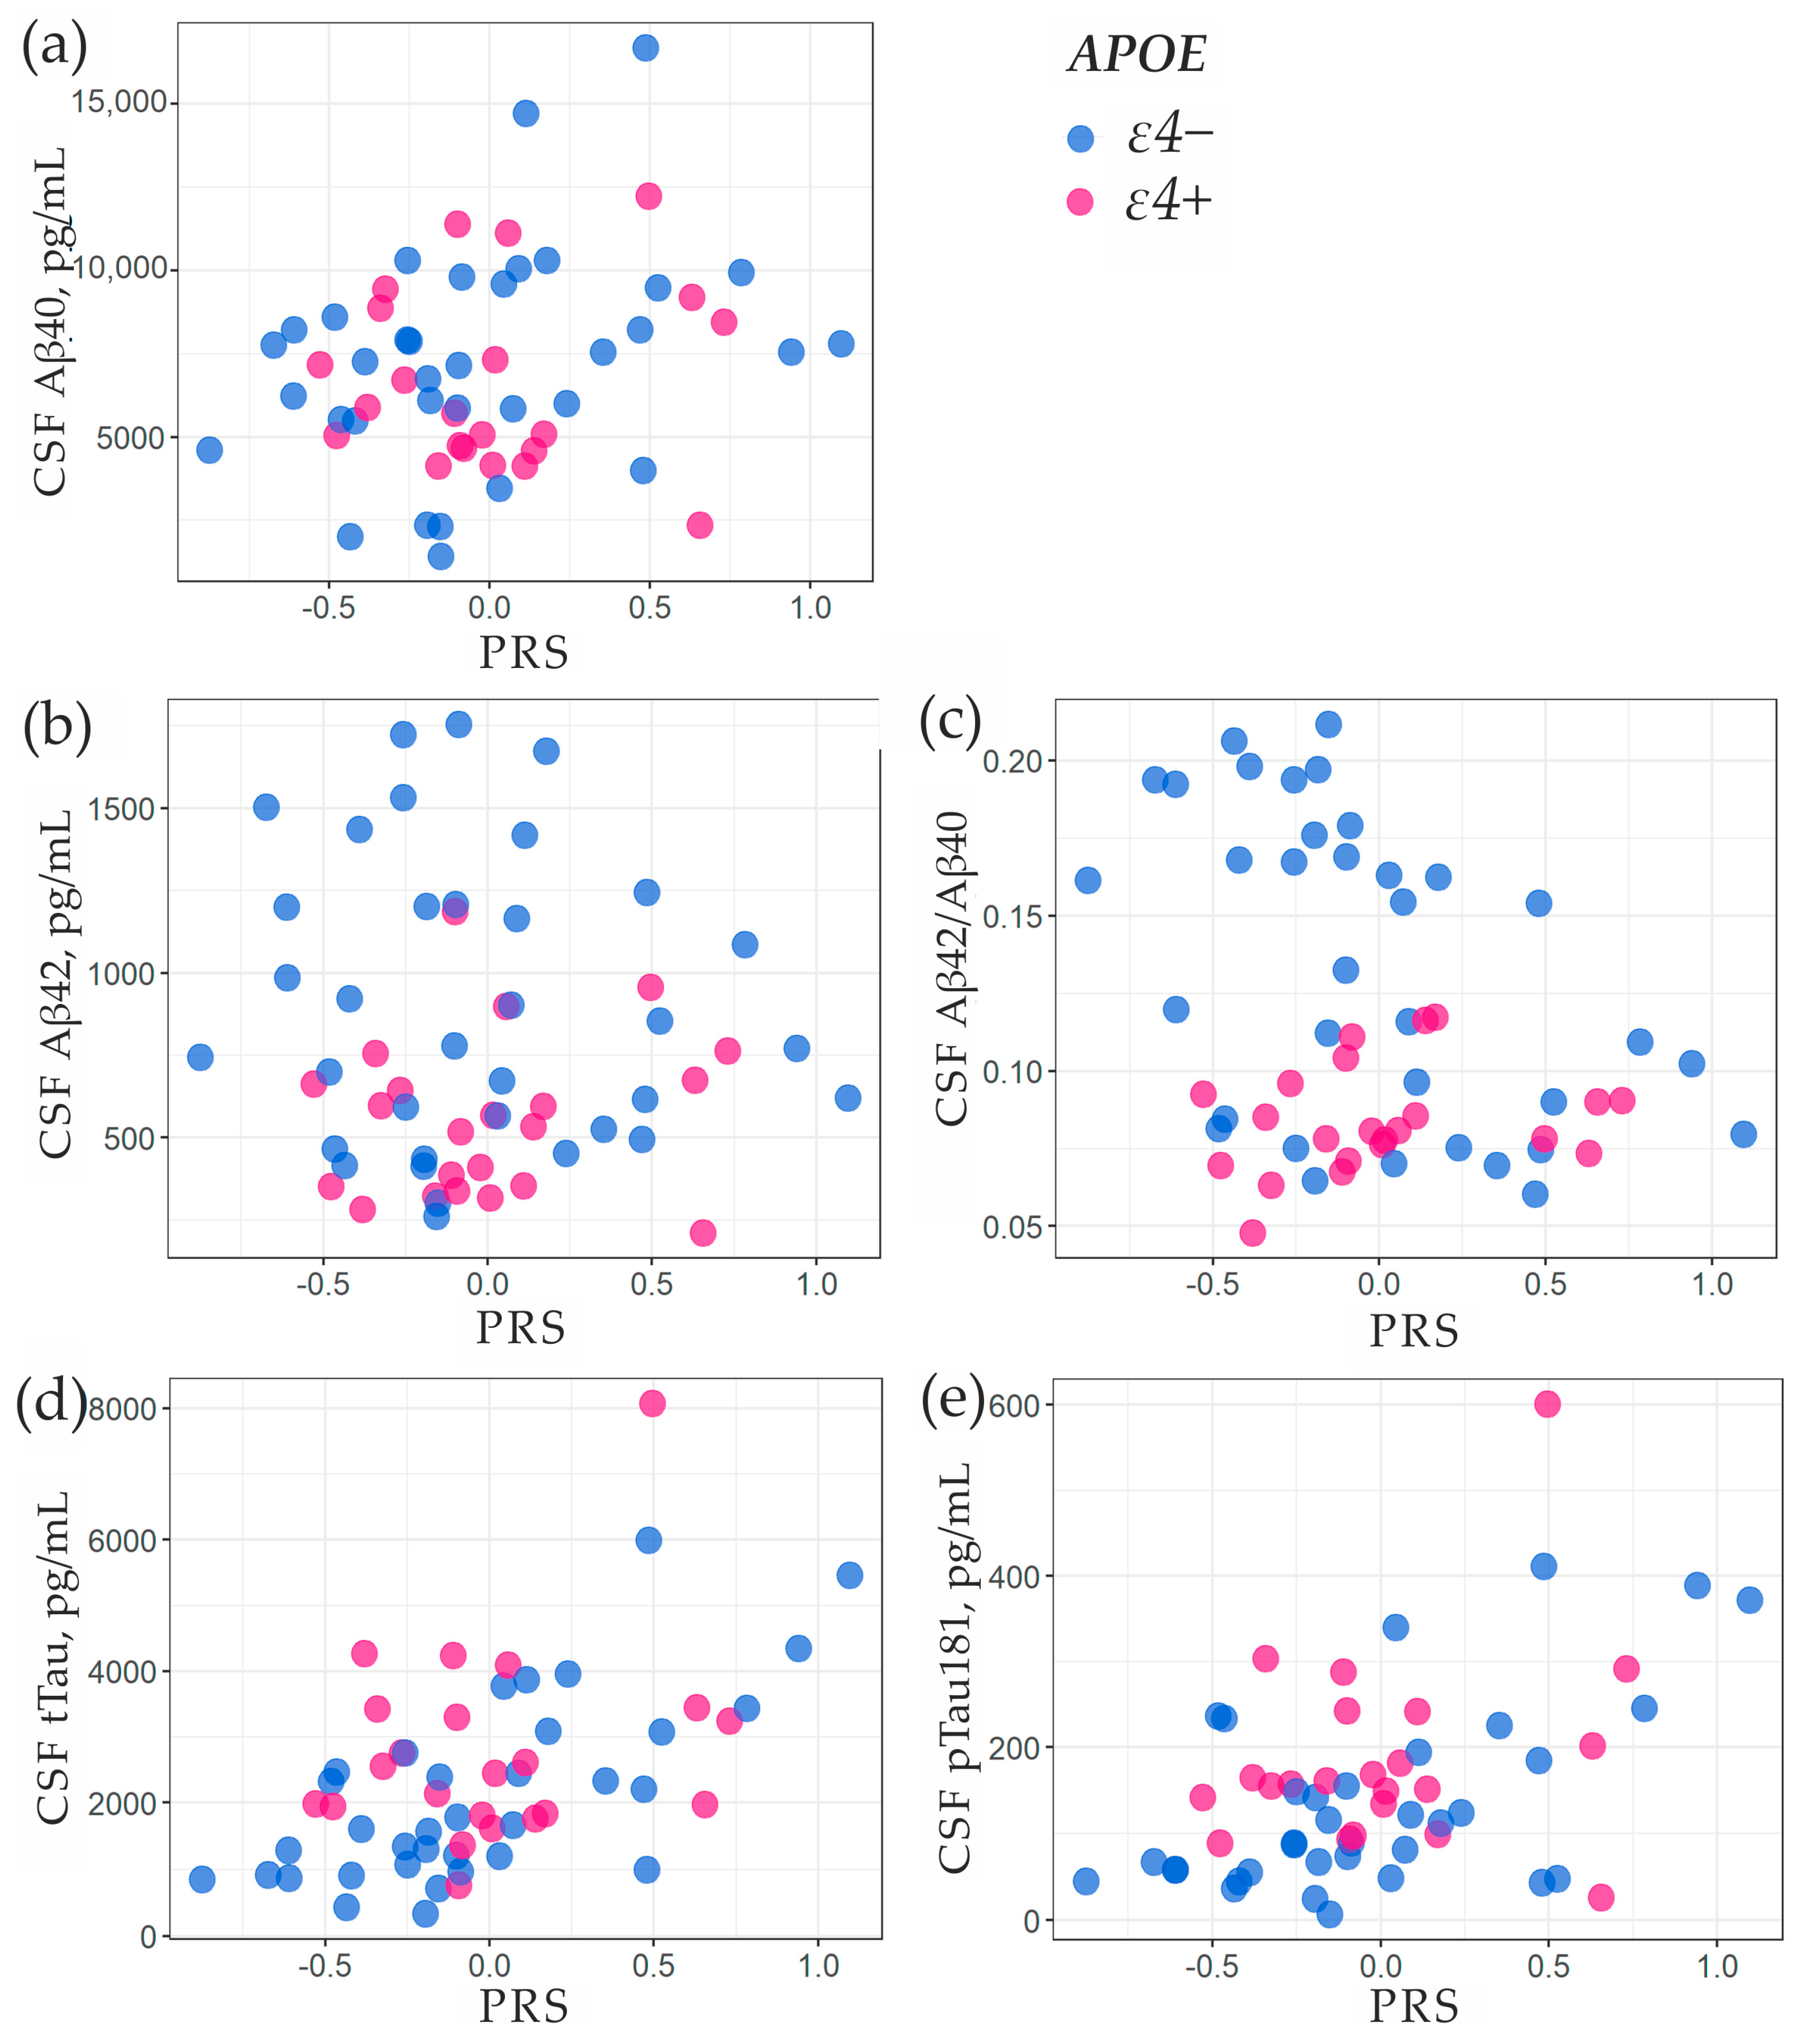
2.3. Association of PRS with Amyloid-β and Tau Proteins in Cerebrospinal Fluid

We examined the impact of genetic factors on the levels of Aβ40, Aβ42, Aβ42/Aβ40, tTau, and pTau181 in CSF obtained from 57 dementia patients. Linear regression was used to determine the association, where PRS and the presence of APOE-ɛ4 were considered as predictors (Table 3). Dependent variables were logarithmically transformed (ln) for this analysis, allowing the coefficients to represent the percentage change in the concentration of the studied CSF markers (when multiplied by 100). The level of Aβ40 was not affected by the studied genetic factors, while the concentration of Aβ42 was lower in the carriers of APOE-ɛ4. The carriers of APOE-ɛ4 and those with higher PRS had a lower Aβ42/Aβ40 ratio. The levels of both tTau and pTau181 exhibited a positive correlation with the presence of APOE-ɛ4 and PRS. Figure 3 depicts the relationship between CSF biomarkers and the presence of APOE-ɛ4 and PRS.
It should be noted that individuals carrying the ɛ2 allele exhibited a 35.3% higher Aβ42/Aβ40 ratio compared to those without the allele (p = 0.006). The presence of this allele did not result in statistically significant differences in other CSF markers.

3. Discussion

The polygenic risk scoring approach has become truly innovative in the study of the genetics of multifactorial diseases. Compared to individual SNPs, PRS models often yield highly reproducible results, which holds promise as a prognostic factor. It is advisable to investigate the information content of the developed models in the intended population before implementation. In this study, we employed the PRS model introduced by Tosto et al. [9], which was initially intended for familial late-onset Alzheimer’s disease but subsequently found to share a common architecture with early-onset and sporadic forms [30].
To identify the SNPs included in the utilized PRS model and the ɛ alleles of the APOE gene, we developed a molecular approach using the established hydrogel microarray technology. The microarray analysis can be completed in less than 12 h. The software that executes the SNP identification algorithm, PRS calculation, and APOE allele determination automatically analyzes the microarray hybridization pattern. Compared to next-generation sequencing (NGS) assays, the cost of microarray analysis is significantly lower and comparable to PCR (less than USD 10 per sample). However, microarray-based assays are limited by the incomplete automation of all procedural steps and a lack of standardization that is critical for routine genetic testing in clinical laboratory settings. Nevertheless, several hydrogel microarray-based assays have been approved for in vitro clinical diagnostics by the Russian regulatory agency [31]. In this study, the microarray results were validated via Sanger sequencing and real-time PCR, with SNP identification showing 100% concordance.
The developed assay was applied to investigate the impact of PRS and the ɛ alleles of the APOE on dementia risk among the residents of the Moscow region in the Russian population, utilizing a sample of 348 individuals diagnosed with dementia and 519 cognitively normal participants. For the first time, the AD polygenic risk model was tested on the European part of the Russian population, revealing its capacity to accurately assess the risk of dementia. The OR of 1.26 (per standard deviation) obtained in this study is equivalent to Tosto et al.’s OR of 1.29 for the European population. Additionally, we achieved similar AUC values (0.559 compared to 0.57) [9].
Of the studied genetic factors, as expected, homozygotes for APOE-ɛ4 had the highest risk of dementia (OR = 7.98). The risk for individuals in the fourth quartile of PRS (OR = 1.85) was approximately equal to the risk for the heterozygous carriers of APOE-ɛ4 (OR = 1.81). Our data regarding the impact of PRS on disease development risk in APOE-ɛ4 carriers (Table 2) support previous findings indicating that individuals carrying ɛ4 with high PRS values exhibit a higher risk [8,32].
Thus, there is compelling evidence that genetic factors, including PRS and APOE-ɛ4, influence the risk of developing dementia. However, considering the small AUC values achieved solely using genetic factors, it is improbable that they can be utilized as an independent predictor. In certain studies [8,12], clinical and social factors such as age, gender, APOE-ɛ4, and education were more crucial for risk assessment than PRS. We showed that AUC values greater than 0.7 were achieved by including social factors in the analysis, such as the presence of higher education, family, and intellectual work. Nevertheless, the statistical significance of PRS as a risk factor for dementia implies that it can enhance the stratification of individuals into risk groups when incorporated into multivariate scales. Such scales should consider biochemical biomarkers that reflect the preclinical stages of the disease [33]. Additionally, it may be valuable to test polygenic risk models that include hundreds of thousands of SNPs (including alleles of the APOE gene) and demonstrated an AUC of 0.72–0.84 in the original studies [12,13]. However, these data require further validation in independent cohorts.
According to numerous data, the concentrations of amyloid and tau proteins in the CSF signify neurodegenerative changes linked to AD, and these parameters form the foundation of the ATN classification system (amyloid, tau, and neurodegeneration) for identifying dementia types [34]. Studies have demonstrated decreased levels of Aβ42 and elevated amounts of tau protein in the CSF for patients with AD [29,35]. For amyloid, the Aβ42/Aβ40 ratio is a more informative measure of amyloid plaque burden in the brain than the absolute value of Aβ42 in the CSF [36,37]. We analyzed Aβ40, Aβ42, Aβ42/Aβ40, tTau, and pTau181 for 57 dementia patients. The PRS showed a positive correlation with tTau and pTau181 and an inverse correlation with Aβ42/Aβ40 (Table 3). Therefore, a higher PRS was associated with CSF biomarker levels that are more indicative of AD. Similar associations between polygenic risk and CSF biomarkers have been demonstrated in other studies [22,29,30], although this was not always the case for all biomarkers. In our study, carriers of APOE-ɛ4 had higher levels of tTau and pTau181 and lower levels of Aβ42 and Aβ42/Aβ40 ratio in the CSF (Table 3), which also reflects an AD-linked pattern. Conversely, the APOE-ɛ2 allele exhibited an association with elevated levels of the Aβ42/Aβ40 ratio.
This study has some limitations. Firstly, the group of studied patients with dementia did not only include patients with AD. Since polygenic risks and APOE alleles significantly correlate with AD biomarkers, it can be assumed that the predictive value of genetic factors for AD may be higher. Secondly, this was a case–control study and not a cohort study. Therefore, some social characteristics could depend on the composition of groups of patients and healthy volunteers. Thus, we did not include sex and the presence of children as predictors in the models since they were not representative of the group of CN volunteers. Also, the age of onset of the disease was unknown for most patients; only the age of inclusion was noted.
Future directions lie in prospective cohort studies, which include patients with MCI. The influence of genetic factors needs to be evaluated while considering clinical, social, and biochemical data. These data will help us assess the impact of PRS on MCI patients, with the hydrogel microarray-based technique acting as an auxiliary tool for identifying high-risk individuals.

4. Materials and Methods

4.1. Study Population

The study was conducted in adherence to the guidelines of the Declaration of Helsinki. The procedures related to human subject experiments were carried out in accordance with the ethical standards outlined in Protocol No. 1, dated 25 January 2022 and established by the Local Ethics Committee of Mental-health Clinic No. 1 named after N. Alekseev of the Moscow Healthcare Department A. Data from the participants were collected between January 2022 and March 2023.
Patients with dementia (N = 348) were recruited from the gerontological department of Mental-health Clinic No. 1, named after N. Alekseev of the Moscow Healthcare Department A. The inclusion criteria were as follows: patients aged 65 or older, diagnosed with one of the types of dementia (F00, Alzheimer’s disease; F01, vascular dementia; F03, unspecified dementia) according to the International Classification of Diseases (ICD-10). The study included patients with multiple impairments of cortical functions in at least two areas: memory and one of the cognitive functions. These included thinking (planning, programming, abstracting, and establishing cause-and-effect relationships), speaking, practicing, and gnosis. Cognitive impairment causes difficulties in social and work adaptation and in performing everyday tasks. Symptoms manifested against the backdrop of clear consciousness. The duration of the disease was at least 6 months.
The exclusion criteria included substance abuse and dependence as well as heavy comorbid severe somatic or neurological disorders such as cancer, cirrhosis, chronic lung failure or absence of a lung, tuberculosis, and viral hepatitis. Among the psychoneurological diseases, the exclusion criteria were also as follows: psychogenic pseudodementia, mental retardation, organic brain diseases, dementia due to schizophrenia, brain injury, epilepsy, tumor, HIV and syphilis, and normotensive hydrocephalus. Additionally, renal or liver failure was not permitted.
CN volunteers (N = 519) were recruited from patients who received periodic medical check-ups in outpatient clinic No. 121 (Moscow), and they were matched by age. Participants were excluded if they had psychiatric disorders, a positive family history of psychiatric illness, substance abuse, or severe somatic diseases. All subjects signed a voluntary informed consent form to participate in the experiment.
Some participants (88 CN volunteers and 259 patients with dementia) were evaluated using a structured clinical interview, including MMSE, CDT, and MoCA scales; they answered a detailed questionnaire and participated in neurological examination and neuropsychological testing. Other participants (431 CN volunteers and 89 patients with dementia) did not provide fully detailed descriptive characteristics.
Table 4 displays the characteristics of the study groups.

4.2. DNA Extraction

Genomic DNA was extracted from peripheral blood collected in EDTA-containing tubes using the QIAcube automated DNA extraction system (QIAGEN, Hilden, Germany) or the LumiPure genomic DNA Blood and Buccal Kit (Lumiprobe RUS Ltd., Moscow, Russia) following the manufacturer’s protocols.

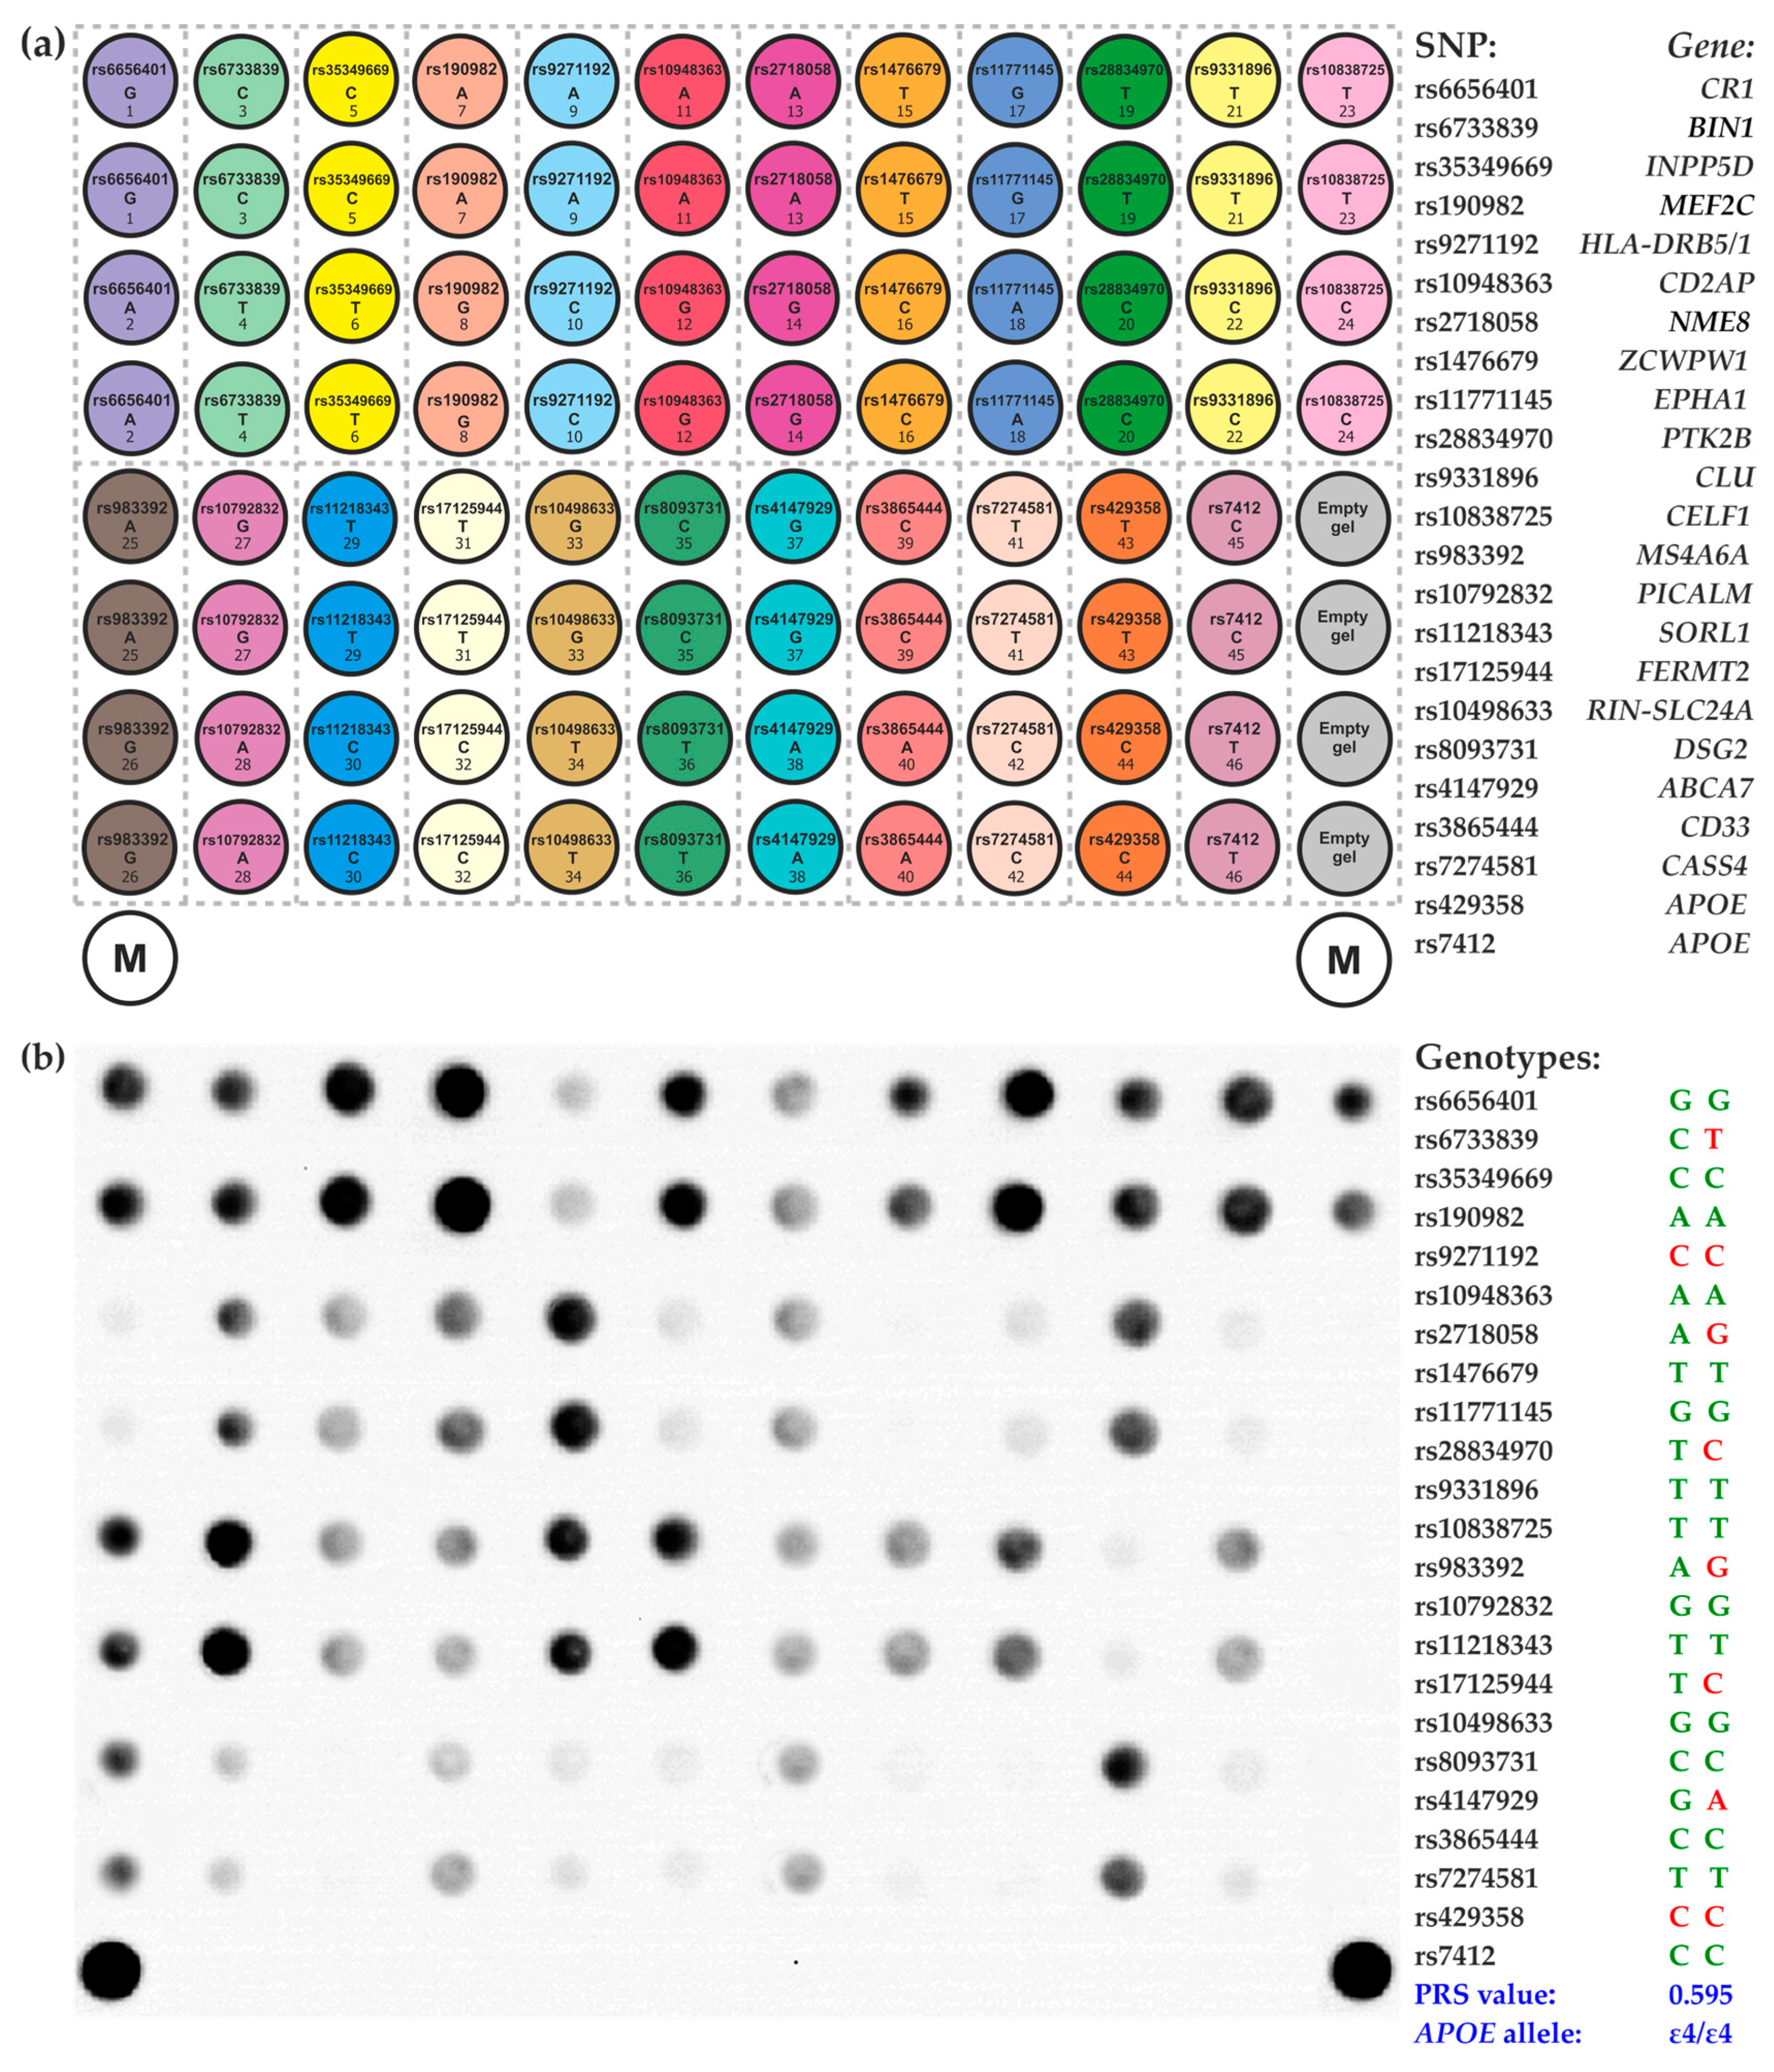
4.3. Microarray-Based Assay for SNP Genotyping and Calculation of the PRS

In this study, we examined a panel of SNPs that were included in the PRS model proposed by Tosto et al. for AD [9]. The panel included the following SNPs: rs6656401 in the CR1 gene; rs6733839 in the BIN1 gene; rs35349669 in the INPP5D gene; rs190982 in the MEF2C gene; rs9271192 in the HLA-DRB5/1 gene; rs10948363 in the CD2AP gene; rs271 8058 in the NME8 gene; rs1476679 in the ZCWPW1 gene; rs11771145 in the EPHA1 gene; rs28834970 in the PTK2B gene; rs9331896 in the CLU gene; rs10838725 in the CELF1 gene; rs7274581 in the CASS4 gene; rs983392 in the MS4A6A gene; rs10792832 in the PICALM gene; rs112 18,343 in the SORL1 gene; rs17125944 in the FERMT2 gene; rs10498633 in the RIN-SLC24A gene; rs8093731 in the DSG2 gene; rs4147929 in the ABCA7 gene; and rs3865444 in the CD33 gene (if the SNP is located in the intergenic region, the closest gene is indicated). Simultaneously, we analyzed rs429358 and rs7412, which determine the ɛ alleles of the APOE gene.
The identification of 23 SNPs was carried out using a molecular technique that utilizes hydrogel-based oligonucleotide microarray technology developed at the Engelhardt Institute of Molecular Biology, Russian Academy of Sciences [31]. The microarray consisted of a plastic substrate with hydrogel elements (droplets) that were deposited and contained immobilized oligonucleotides. The process of designing and synthesizing oligonucleotides for immobilization, along with the manufacture of microarrays using a copolymerization immobilization method, follows the previously described protocol [38]. Supplementary File S1 provides the sequences of the immobilized probes. Figure 4a displays the layout of the microarray that holds oligonucleotides for identifying 23 SNPs.
The assay protocol involved multiplex PCR to generate mostly single-stranded, fluorescence-labeled DNA fragments, followed by the hybridization of the DNA fragments on a microarray and the acquisition and analysis of fluorescence images. The primer sequences employed for the multiplex PCR and the procedures for carrying out the PCR and microarray hybridization are outlined in Supplementary File S1. The proprietary microarray scanner equipped with original software (Biochip-IMB, Ltd., Moscow, Russia) was used to acquire the fluorescence images and measure signal intensities. The signals of the “wild-type” elements were compared to those of the “minor allele” elements for each group of microarray elements (Figure 4a) to determine their ratio. The genotype was then determined by comparing this ratio to predetermined thresholds, as described before [39]. The APOE gene’s ɛ2/ɛ3/ɛ4 alleles were determined based on whether it had homozygous or heterozygous variants of rs429358 and rs7412.
To calculate the PRS, the model proposed by Tosto et al. [9] was used. The coefficients for the model were obtained from the Polygenic Score (PGS) Catalog (https://www.pgscatalog.org/score/PGS000054/, accessed on 16 August 2023). PRS values were calculated by summing the coefficients multiplied by the number of corresponding effect alleles as follows:
PRS = 0.166 * Nrs6656401_A + 0.199 * Nrs6733839_T + 0.077 * Nrs35349669_T − 0.073 * Nrs190982_G
+ 0.104 * Nrs9271192_C + 0.095 * Nrs10948363_G − 0.073 * Nrs2718058_G – 0.094 * Nrs1476679_C
0.105 * Nrs11771145_A + 0.095 * Nrs28834970_C − 0.151 * Nrs9331896_C + 0.077 * Nrs10838725_C
0.105 * Nrs983392_G − 0.139 * Nrs10792832_A − 0.261 * Nrs11218343_C + 0.131 * Nrs17125944_C
0.094 * Nrs10498633_T − 0.315 * Nrs8093731_T + 0.14 * Nrs4147929_A – 0.062 * Nrs3865444_A
0.128 * Nrs7274581_C;
where N represents the number of corresponding effect alleles (from 0 to 2).
The fluorescence image examples of the microarray after analyzing DNA samples from AD patients and determining the genotype at each SNP with APOE alleles and PRS are shown in Figure 4b.

4.4. Verification of the Microarray-Based Genotyping Results

To confirm genotyping results, Sanger sequencing and real-time PCR techniques, including PCR with hydrolysis probes and high-resolution melting analysis, were used. Sanger sequencing was performed using a 3730xl Genetic Analyzer from Applied Biosystems, Foster City, CA, USA. To determine the ɛ alleles of the APOE gene, we utilized real-time PCR with hydrolysis probes, where probes and primers from Yi et al. were used [40]. High-resolution melting analysis and real-time PCR with hydrolysis probes were carried out using a LightCycler® 96 (Roche, Basel, Switzerland).

4.5. Determination of Aβ and Tau Proteins in Cerebrospinal Fluid

CSF was collected from 57 patients via lumbar puncture between 9:00 a.m. and 2:00 p.m. and transferred to sterile polypropylene tubes. The samples were centrifuged at 1500 rpm for 15 min, and the resulting supernatant was divided into 0.5 mL aliquots and stored at −80 °C. The commercially available MILLIPLEX immunoassay (Millipore, Catalog Number HCYTOMAG-60K, Billerica, MA, USA) was utilized according to the manufacturer’s instructions to measure Aβ40, Aβ42, tTau, and pTau181 in the CSF samples. The corresponding commercial kits describe the ranges of detection for the inflammatory parameters, and the analysis was conducted in duplicate. The protein concentration was quantitated in pg/mL.

4.6. Statistical Analysis

PRS was analyzed as a quantitative or nominal variable, dividing it into quartiles (1st/2nd–3rd/4th) or deciles (1st/2nd–9th/10th). Logistic regression was utilized to analyze the role of genetic factors in the risk of dementia. ROC analysis was performed to assess the discriminative ability for genetic and social factors. Linear regression was applied to investigate the associations of PRS and APOE alleles with CSF biomarkers and MMSE scores. Statistical analysis and visualization were conducted using R version 4.3.1 (R Foundation for Statistical Computing, Vienna, Austria), with the “pROC”, “psych”, and “ggplot2” packages. We checked for correspondence to the Hardy–Weinberg equilibrium using the online service SNPStats (https://www.snpstats.net/, accessed on 21 April 2023) [41] and calculated the adjusted p-values using the Benjamini and Hochberg (BH) method. A comparison of logistic regression models, incorporating social and genetic factors, was conducted using JASP software (Version 0.16.3). Statistical significance was determined when the p-value was less than 0.05.
Statistical power was assessed using MedCalc® Statistical Software version 22.013 (MedCalc Software Ltd., Ostend, Belgium). We hypothesized that the ROC curve for the studied PRS model will be different from the referenced 0.5, and the expected AUC will be 0.57, according to Tosto et al. [9]. Based on this, as well as on an alpha of 0.05 and a power of 0.8, the sample size was estimated to be at least 249 individuals in each group.

5. Conclusions

The selected polygenic risk model for Alzheimer’s disease confirmed its ability to accurately assess the risk of dementia in patients from the European part of the Russian population. Individuals carrying APOE-ɛ4 with high PRS values exhibit a higher risk of AD development. Associations of the APOE-ɛ4 and a higher PRS with CSF biomarker levels reflect neurodegenerative changes that are linked to Alzheimer’s disease.
Overall, this study demonstrates the potential of the microarray-based assay for Alzheimer’s disease risk assessment, which may in the future allow for the screening of individuals and the referral of carriers of risk-associated traits to specialized prevention programs.

Supplementary Materials

The following supporting information can be downloaded at: https://www.mdpi.com/article/10.3390/ijms241914765/s1.

Author Contributions

Conceptualization, D.G. and G.K.; methodology, O.A. (Olga Abramova), A.I., A.M., Y.Z. and M.E.; validation, O.A. (Olga Antonova), E.F. and M.F.; formal analysis, M.E.; writing—original draft preparation, A.I.; writing—review and editing, D.G. and Y.Z.; visualization, A.I., E.F. and D.G.; subjects sample collection, D.A., A.O. and I.M.; clinical data collection, A.O. and I.M.; clinical data administration, A.A., A.M. and T.S.; project administration, D.G., A.M. and G.K. All authors have read and agreed to the published version of the manuscript.

Funding

This research was funded by the Moscow Centre for Innovative Technologies in Healthcare. Grant No. 0803-4/23 (Agreement No. 0803-4/23-1NIR).

Institutional Review Board Statement

The study was conducted in accordance with the Declaration of Helsinki and approved by the Local Ethics Committee of Mental-health Clinic No. 1, named after N.A. Alekseev of Moscow Healthcare Department (protocol No. 1, date of approval 25 January 2022).

Informed Consent Statement

Informed consent was obtained from all subjects involved in the study.

Data Availability Statement

The data presented in this study are available on request from the corresponding author.

Conflicts of Interest

The authors declare no conflict of interest.

References

  1. Sims, R.; Hill, M.; Williams, J. The multiplex model of the genetics of Alzheimer’s disease. Nat. Neurosci. 2020, 23, 311–322. [Google Scholar] [CrossRef] [PubMed]
  2. Raulin, A.C.; Doss, S.V.; Trottier, Z.A.; Ikezu, T.C.; Bu, G.; Liu, C.C. ApoE in Alzheimer’s disease: Pathophysiology and therapeutic strategies. Mol. Neurodegener. 2022, 17, 72. [Google Scholar] [CrossRef] [PubMed]
  3. Ridge, P.G.; Hoyt, K.B.; Boehme, K.; Mukherjee, S.; Crane, P.K.; Haines, J.L.; Mayeux, R.; Farrer, L.A.; Pericak-Vance, M.A.; Schellenberg, G.D.; et al. Assessment of the genetic variance of late-onset Alzheimer’s disease. Neurobiol. Aging 2016, 41, 200.e13–200.e20. [Google Scholar] [CrossRef] [PubMed]
  4. Kunkle, B.W.; Grenier-Boley, B.; Sims, R.; Bis, J.C.; Damotte, V.; Naj, A.C.; Boland, A.; Vronskaya, M.; van der Lee, S.J.; Amlie-Wolf, A. Genetic meta-analysis of diagnosed Alzheimer’s disease identifies new risk loci and implicates Aβ, tau, immunity and lipid processing. Nat. Genet. 2019, 51, 414–430. [Google Scholar] [CrossRef]
  5. Andrews, S.J.; Fulton-Howard, B.; Goate, A. Interpretation of risk loci from genome-wide association studies of Alzheimer’s disease. Lancet Neurol. 2020, 19, 326–335. [Google Scholar] [CrossRef]
  6. Clark, K.; Leung, Y.Y.; Lee, W.P.; Voight, B.; Wang, L.S. Polygenic Risk Scores in Alzheimer’s Disease Genetics: Methodology, Applications, Inclusion, and Diversity. J. Alzheimers Dis. 2022, 89, 1–12. [Google Scholar] [CrossRef]
  7. Papassotiropoulos, A.; Wollmer, M.A.; Tsolaki, M.; Brunner, F.; Molyva, D.; Lütjohann, D.; Nitsch, R.M.; Hock, C. A cluster of cholesterol-related genes confers susceptibility for Alzheimer’s disease. J. Clin. Psychiatry 2005, 66, 940–947. [Google Scholar] [CrossRef]
  8. Chouraki, V.; Reitz, C.; Maury, F.; Bis, J.C.; Bellenguez, C.; Yu, L.; Jakobsdottir, J.; Mukherjee, S.; Adams, H.H.; Choi, S.H.; et al. Evaluation of a Genetic Risk Score to Improve Risk Prediction for Alzheimer’s Disease. J. Alzheimers Dis. 2016, 53, 921–932. [Google Scholar] [CrossRef]
  9. Tosto, G.; Bird, T.D.; Tsuang, D.; Bennett, D.A.; Boeve, B.F.; Cruchaga, C.; Faber, K.; Foroud, T.M.; Farlow, M.; Goate, A.M.; et al. Polygenic risk scores in familial Alzheimer disease. Neurology 2017, 88, 1180–1186. [Google Scholar] [CrossRef]
  10. Desikan, R.S.; Fan, C.C.; Wang, Y.; Schork, A.J.; Cabral, H.J.; Cupples, L.A.; Thompson, W.K.; Besser, L.; Kukull, W.A.; Holland, D.; et al. Genetic assessment of age-associated Alzheimer disease risk: Development and validation of a polygenic hazard score. PLoS Med. 2017, 14, e1002258. [Google Scholar] [CrossRef]
  11. Zhang, Q.; Sidorenko, J.; Couvy-Duchesne, B.; Marioni, R.E.; Wright, M.J.; Goate, A.M.; Marcora, E.; Huang, K.L.; Porter, T.; Laws, S.M.; et al. Risk prediction of late-onset Alzheimer’s disease implies an oligogenic architecture. Nat. Commun. 2020, 11, 4799. [Google Scholar] [CrossRef]
  12. Escott-Price, V.; Sims, R.; Bannister, C.; Harold, D.; Vronskaya, M.; Majounie, E.; Badarinarayan, N.; GERAD/PERADES; IGAP Consortia; Morgan, K.; et al. Common polygenic variation enhances risk prediction for Alzheimer’s disease. Brain 2015, 138, 3673–3684. [Google Scholar] [CrossRef]
  13. Escott-Price, V.; Myers, A.J.; Huentelman, M.; Hardy, J. Polygenic risk score analysis of pathologically confirmed Alzheimer disease. Ann. Neurol. 2017, 82, 311–314. [Google Scholar] [CrossRef] [PubMed]
  14. Leonenko, G.; Sims, R.; Shoai, M.; Frizzati, A.; Bossù, P.; Spalletta, G.; Fox, N.C.; Williams, J.; GERAD Consortium; Hardy, J.; et al. Polygenic risk and hazard scores for Alzheimer’s disease prediction. Ann. Clin. Transl. Neurol. 2019, 6, 456–465. [Google Scholar] [CrossRef] [PubMed]
  15. Andrews, S.J.; McFall, G.P.; Booth, A.; Dixon, R.A.; Anstey, K.J. Association of Alzheimer’s Disease Genetic Risk Loci with Cognitive Performance and Decline: A Systematic Review. J. Alzheimers Dis. 2019, 69, 1109–1136. [Google Scholar] [CrossRef] [PubMed]
  16. Zhou, X.; Li, Y.Y.T.; Fu, A.K.Y.; Ip, N.Y. Polygenic Score Models for Alzheimer’s Disease: From Research to Clinical Applications. Front. Neurosci. 2021, 15, 650220. [Google Scholar] [CrossRef]
  17. Kauppi, K.; Fan, C.C.; McEvoy, L.K.; Holland, D.; Tan, C.H.; Chen, C.H.; Andreassen, O.A.; Desikan, R.S.; Dale, A.M. Alzheimer’s Disease Neuroimaging Initiative. Combining Polygenic Hazard Score with Volumetric MRI and Cognitive Measures Improves Prediction of Progression from Mild Cognitive Impairment to Alzheimer’s Disease. Front. Neurosci. 2018, 12, 260. [Google Scholar] [CrossRef]
  18. Han, S.H.; Roberts, J.S.; Mutchler, J.E.; Burr, J.A. Volunteering, polygenic risk for Alzheimer’s disease, and cognitive functioning among older adults. Soc. Sci. Med. 2020, 253, 112970. [Google Scholar] [CrossRef]
  19. Kauppi, K.; Rönnlund, M.; Nordin Adolfsson, A.; Pudas, S.; Adolfsson, R. Effects of polygenic risk for Alzheimer’s disease on rate of cognitive decline in normal aging. Transl. Psychiatry. 2020, 10, 250. [Google Scholar] [CrossRef]
  20. Harrison, T.M.; Mahmood, Z.; Lau, E.P.; Karacozoff, A.M.; Burggren, A.C.; Small, G.W.; Bookheimer, S.Y. An Alzheimer’s Disease Genetic Risk Score Predicts Longitudinal Thinning of Hippocampal Complex Subregions in Healthy Older Adults. eNeuro. 2016, 3, ENEURO.0098-16.2016. [Google Scholar] [CrossRef]
  21. Mormino, E.C.; Sperling, R.A.; Holmes, A.J.; Buckner, R.L.; De Jager, P.L.; Smoller, J.W.; Sabuncu, M.R. Alzheimer’s Disease Neuroimaging Initiative. Polygenic risk of Alzheimer disease is associated with early- and late-life processes. Neurology 2016, 87, 481–488. [Google Scholar] [CrossRef]
  22. Porter, T.; Burnham, S.C.; Milicic, L.; Savage, G.; Maruff, P.; Lim, Y.Y.; Li, Q.X.; Ames, D.; Masters, C.L.; Rainey-Smith, S.; et al. Utility of an Alzheimer’s Disease Risk-Weighted Polygenic Risk Score for Predicting Rates of Cognitive Decline in Preclinical Alzheimer’s Disease: A Prospective Longitudinal Study. J. Alzheimers Dis. 2018, 66, 1193–1211. [Google Scholar] [CrossRef]
  23. Sleegers, K.; Bettens, K.; De Roeck, A.; Van Cauwenberghe, C.; Cuyvers, E.; Verheijen, J.; Struyfs, H.; Van Dongen, J.; Vermeulen, S.; Engelborghs, S.; et al. A 22-single nucleotide polymorphism Alzheimer’s disease risk score correlates with family history, onset age, and cerebrospinal fluid Aβ42. Alzheimers Dement. 2015, 11, 1452–1460. [Google Scholar] [CrossRef] [PubMed]
  24. Tan, C.H.; Fan, C.C.; Mormino, E.C.; Sugrue, L.P.; Broce, I.J.; Hess, C.P.; Dillon, W.P.; Bonham, L.W.; Yokoyama, J.S.; Karch, C.; et al. Polygenic hazard score: An enrichment marker for Alzheimer’s associated amyloid and tau deposition. Acta Neuropathol. 2018, 135, 85–93. [Google Scholar] [CrossRef] [PubMed]
  25. Blennow, K.; Zetterberg, H. Biomarkers for Alzheimer’s disease: Current status and prospects for the future. J. Intern. Med. 2018, 284, 643–663. [Google Scholar] [CrossRef] [PubMed]
  26. Stocker, H.; Möllers, T.; Perna, L.; Brenner, H. The genetic risk of Alzheimer’s disease beyond APOE ε4: Systematic review of Alzheimer’s genetic risk scores. Transl. Psychiatry 2018, 8, 166. [Google Scholar] [CrossRef] [PubMed]
  27. Privé, F.; Aschard, H.; Carmi, S.; Folkersen, L.; Hoggart, C.; O’Reilly, P.F.; Vilhjálmsson, B.J. Portability of 245 polygenic scores when derived from the UK Biobank and applied to 9 ancestry groups from the same cohort. Am. J. Hum. Genet. 2022, 109, 12–23. [Google Scholar] [CrossRef]
  28. Marden, J.R.; Mayeda, E.R.; Walter, S.; Vivot, A.; Tchetgen Tchetgen, E.J.; Kawachi, I.; Glymour, M.M. Using an Alzheimer Disease Polygenic Risk Score to Predict Memory Decline in Black and White Americans Over 14 Years of Follow-up. Alzheimer Dis. Assoc. Disord. 2016, 30, 195–202. [Google Scholar] [CrossRef]
  29. Li, W.W.; Wang, Z.; Fan, D.Y.; Shen, Y.Y.; Chen, D.W.; Li, H.Y.; Li, L.; Yang, H.; Liu, Y.H.; Bu, X.L.; et al. Association of Polygenic Risk Score with Age at Onset and Cerebrospinal Fluid Biomarkers of Alzheimer’s Disease in a Chinese Cohort. Neurosci. Bull. 2020, 36, 696–704. [Google Scholar] [CrossRef]
  30. Cruchaga, C.; Del-Aguila, J.L.; Saef, B.; Black, K.; Fernandez, M.V.; Budde, J.; Ibanez, L.; Deming, Y.; Kapoor, M.; Tosto, G.; et al. Polygenic risk score of sporadic late-onset Alzheimer’s disease reveals a shared architecture with the familial and early-onset forms. Alzheimers Dement. 2018, 14, 205–214. [Google Scholar] [CrossRef]
  31. Gryadunov, D.A.; Shaskolskiy, B.L.; Nasedkina, T.V.; Rubina, A.Y.; Zasedatelev, A.S. The EIMB Hydrogel Microarray Technology: Thirty Years Later. Acta Naturae. 2018, 10, 4–18. [Google Scholar] [CrossRef] [PubMed]
  32. Shi, Z.; Yu, H.; Wu, Y.; Ford, M.; Perschon, C.; Wang, C.; Zheng, S.L.; Xu, J. Genetic risk score modifies the effect of APOE on risk and age onset of Alzheimer’s disease. Clinical genetics. 2019, 95, 302–309. [Google Scholar] [CrossRef]
  33. Naveed, M.; Mubeen, S.; Khan, A.; Ibrahim, S.; Meer, B. Plasma Biomarkers: Potent Screeners of Alzheimer’s Disease. Am. J. Alzheimers Dis. Other Demen. 2019, 34, 290–301. [Google Scholar] [CrossRef] [PubMed]
  34. Ebenau, J.L.; Timmers, T.; Wesselman, L.M.P.; Verberk, I.M.W.; Verfaillie, S.C.J.; Slot, R.E.R.; van Harten, A.C.; Teunissen, C.E.; Barkhof, F.; van den Bosch, K.A.; et al. ATN classification and clinical progression in subjective cognitive decline: The SCIENCe project. Neurology 2020, 95, e46–e58. [Google Scholar] [CrossRef]
  35. Sunderland, T.; Linker, G.; Mirza, N.; Putnam, K.T.; Friedman, D.L.; Kimmel, L.H.; Bergeson, J.; Manetti, G.J.; Zimmermann, M.; Tang, B.; et al. Decreased beta-amyloid1-42 and increased tau levels in cerebrospinal fluid of patients with Alzheimer disease. JAMA 2003, 289, 2094–2103. [Google Scholar] [CrossRef] [PubMed]
  36. Hansson, O.; Lehmann, S.; Otto, M.; Zetterberg, H.; Lewczuk, P. Advantages and disadvantages of the use of the CSF Amyloid β (Aβ) 42/40 ratio in the diagnosis of Alzheimer’s Disease. Alzheimers Res. Ther. 2019, 11, 34. [Google Scholar] [CrossRef]
  37. Giacomucci, G.; Mazzeo, S.; Bagnoli, S.; Casini, M.; Padiglioni, S.; Polito, C.; Berti, V.; Balestrini, J.; Ferrari, C.; Lombardi, G.; et al. Matching Clinical Diagnosis and Amyloid Biomarkers in Alzheimer’s Disease and Frontotemporal Dementia. J. Pers. Med. 2021, 11, 47. [Google Scholar] [CrossRef]
  38. Shaskolskiy, B.; Kandinov, I.; Kravtsov, D.; Vinokurova, A.; Gorshkova, S.; Filippova, M.; Kubanov, A.; Solomka, V.; Deryabin, D.; Dementieva, E.; et al. Hydrogel Droplet Microarray for Genotyping Antimicrobial Resistance Determinants in Neisseria gonorrhoeae Isolates. Polymers 2021, 13, 3889. [Google Scholar] [CrossRef]
  39. Ikonnikova, A.Y.; Filippova, M.A.; Surzhikov, S.A.; Pozhitnova, V.O.; Kazakov, R.E.; Lisitsa, T.S.; Belkov, S.A.; Nasedkina, T.V. Biochip-based approach for comprehensive pharmacogenetic testing. Drug Metab. Pers. Ther. 2021, 36, 33–40. [Google Scholar] [CrossRef]
  40. Yi, L.; Wu, T.; Luo, W.; Zhou, W.; Wu, J. A non-invasive, rapid method to genotype late-onset Alzheimer’s disease-related apolipoprotein E gene polymorphisms. Neural Regen. Res. 2014, 9, 69–75. [Google Scholar] [CrossRef]
  41. Solé, X.; Guinó, E.; Valls, J.; Iniesta, R.; Moreno, V. SNPStats: A web tool for the analysis of association studies. Bioinformatics. 2006, 22, 1928–1929. [Google Scholar] [CrossRef] [PubMed]
Figure 1. Distribution of PRS in patients with dementia and CN volunteers. The boxplots show the median, with the two hinges corresponding to the first and third quartiles and two whiskers. The upper and lower whiskers extend from the hinges to the largest value no further than 1.5 × IQR from the corresponding hinge (where IQR is the interquartile range). Points beyond the whiskers indicate the outliers.
Ijms 24 14765 g001
Figure 2. Discriminative ability for predictive models with genetic and social factors. (a) ROC curves for predictive models with genetic factors: PRS (AUC = 0.559), APOE-ɛ4 (AUC = 0.573), PRS, and APOE-ɛ4 (AUC = 0.604). (b) ROC curves for predictive models with social factors, including family, higher education, and intellectual job (AUC = 0.69), and both social and genetic (PRS and APOE-ɛ4) factors (AUC = 0.7343).
Ijms 24 14765 g002
Figure 3. Association of biomarkers in CSF with PRS and the presence of the ɛ4 allele of the APOE gene. (a) Aβ40; (b) Aβ42; (c) Aβ42/Aβ40; (d)tTau; (e) pTau181.
Ijms 24 14765 g003
Figure 4. DNA hydrogel microarray for genotyping SNPs associated with Alzheimer’s disease. (a) Configuration of the microarray. The analyzed SNPs are indicated within the circles, representing the microarray elements. The microarray included 92 hydrogel elements containing immobilized oligonucleotide probes, two marker elements (M) for image acquisition and processing software, and four empty hydrogel elements for signal normalization. The microarray elements were categorized into 23 groups denoted by distinct colors, which correspond to the analyzed SNPs. Each group comprises four elements, with two of them containing oligonucleotides that match the wild-type allele, while the other two hold probes that correspond to the minor allele. The microarray elements were duplicated to ensure reliable analysis. The right column lists the SNPs and their relevant genes. (b) Fluorescence hybridization pattern of the microarray following analysis of genomic DNA from a patient with Alzheimer’s disease. The genotypes obtained for each SNP, PRS, and APOE genotype are displayed in the right column.
Ijms 24 14765 g004
Table 1. Association of PRS and ɛ-alleles of APOE gene with dementia.
PredictorOR95%CIp-Value
PRS (per sd)1.261.09–1.450.0014
APOE-ɛ4_heterozygous1.811.31–2.51<0.001
APOE-ɛ4_homozygous7.982.89–28.11<0.001
APOE-ɛ2_heterozygous10.67–1.490.99
APOE-ɛ2_homozygous2.460.4–18.990.33
PRS, polygenic risk score; OR, odds ratio; CI, confidence interval; sd, standard deviation.
Table 2. Association of the ɛ4-allele of the APOE gene with dementia depending on the PRS quartile.
PredictorOR95%CIp-Value
APOE-ɛ4 + Qu11.560.89–2.720.12
APOE-ɛ4 + Qu2-31.780.89–2.640.0045
APOE-ɛ4 + Qu43.522–6.38<0.001
OR, odds ratio; CI, confidence interval; Qu, quartile of PRS.
Table 3. Linear regression analysis for the associations of biomarkers in CSF with PRS and the presence of the ɛ4 allele of the APOE gene.
PredictorCoefficient (β)SEp-ValueR2 Adjusted
Aβ40, lnPRS_per sd0.0950.0650.1510.004
APOE_ɛ4+−0.0510.1330.699
Aβ42, lnPRS_per sd−0.0110.0660.8670.1395
APOE_ɛ4+−0.4470.1350.0016
Aβ42/Aβ40, lnPRS_per sd−0.1060.0440.0190.3025
APOE_ɛ4+−0.3950.089<0.001
tTau, lnPRS_per sd0.3230.071<0.0010.3086
APOE_ɛ4+0.3410.1450.0224
pTau181, lnPRS_per sd0.2830.0980.00550.1795
APOE_ɛ4+0.4610.1990.0246
PRS, polygenic risk score; SE, standard error; sd, standard deviation.
Table 4. Characteristics of dementia patients and CN volunteers.
CN VolunteersDementia
Sex, female71.48% (371/519)65.71% (228/347)
Higher education57.14% (52/91)31.06% (91/293)
Family63.16% (60/95)46.69% (141/302)
Children100% (82/82)55% (165/300)
Intellectual Work82.6% (76/92)46.6% (124/266)
Age, mean (sd, min–max)71.42 (7.19, 59–94)73.09 (11.4, 35–97)
MMSE, mean (sd, min–max)28.84 (0.72, 28–30)9.97 (6.5, 0–24)
CDT mean (sd, min–max)7.31 (2.82, 1–10)3.81 (2.93, 0–10)
MoCA mean (sd, min–max)24.93 (2.71, 18–30)9.14 (5, 0–22)
Disclaimer/Publisher’s Note: The statements, opinions and data contained in all publications are solely those of the individual author(s) and contributor(s) and not of MDPI and/or the editor(s). MDPI and/or the editor(s) disclaim responsibility for any injury to people or property resulting from any ideas, methods, instructions or products referred to in the content.

