Article

A Neutral Polysaccharide from Spores of Ophiocordyceps gracilis Regulates Oxidative Stress via NRF2/FNIP1 Pathway

School of Food Science and Pharmaceutical Engineering, Nanjing Normal University, NO 1, Wen Yuan Road, Nanjing 210023, China
*
Authors to whom correspondence should be addressed.
Int. J. Mol. Sci. 2023, 24(19), 14721; https://doi.org/10.3390/ijms241914721
Submission received: 8 August 2023 / Revised: 21 September 2023 / Accepted: 26 September 2023 / Published: 29 September 2023

Abstract

:
Ophiocordyceps gracilis (O. gracilis) is a parasitic fungus used in traditional Chinese medicine and functional foods. In this study, a neutral heteropolysaccharide (GSP-1a) was isolated from spores of O. gracilis, and its structure and antioxidant capacities were investigated. GSP-1a was found to have a molecular weight of 72.8 kDa and primarily consisted of mannose (42.28%), galactose (35.7%), and glucose (22.02%). The backbone of GSP-1a was composed of various sugar residues, including →6)-α-D-Manp-(1→, →2,6)-α-D-Manp-(1→, →2,4,6)-α-D-Manp-(1→, →6)-α-D-Glcp-(1→, and →3,6)-α-D-Glcp-(1→, with some branches consisting of →6)-α-D-Manp-(1→ and α-D-Gal-(1→. In vitro, antioxidant activity assays demonstrated that GSP-1a exhibited scavenging effects on hydroxyl radical (OH), 2,2′-azino-bis-3-ethylbenzothiazoline-6-sulfonic acid radical cation (ABTS•+), and 2,2-diphenyl-1-picrylhydrazyl radical (DPPH). Moreover, GSP-1a was found to alleviate H2O2-induced oxidative stress in HepG2 cells by reducing the levels of reactive oxygen species (ROS) and malondialdehyde (MDA), while enhancing the activities of superoxide dismutase (SOD). Furthermore, GSP-1a upregulated the mRNA expression of antioxidant enzymes such as Ho-1, Gclm, and Nqo1, and regulated the NRF2/KEAP1 and FNIP1/FEM1B pathways. The findings elucidated the structural types of GSP-1a and provided a reliable theoretical basis for its usage as a natural antioxidant in functional foods or medicine.

1. Introduction

Cordyceps belong to Ascomycotina and is a parasitic fungus that grows on the larva or pupae of insects [1]. Cordyceps have a broad range of various pharmacological properties, where Ophiocordyceps sinensis (O. sinensis) is the most well-known and has been extensively used in Asian countries as a tonic and medicinal food [2]. In addition, Ophiocordyceps gracilis (O. gracilis) parasitizes the larvae of Hepialus, which belongs to the same genus and has a similar chemical composition and medicinal properties with O. sinensis and has been listed in the drug standards of Xinjiang China [3,4]. These might indicate that O. gracilis could have interesting medicinal properties, some of which also have been recently described [5,6]. Furthermore, Cordyceps has significant therapeutic effects on a variety of diseases, including renal, hepatic, respiratory, neurological, and cardiovascular diseases, cancer, aging, and hyperlipidemia [7,8,9,10]. The pharmacological components of Cordyceps include cordycepin, polysaccharides, bioactive peptides, mannitol, and ergosterol [2]. Among these constituents, polysaccharides are the major active compounds in Cordyceps and exhibit a broad range of biological activities [11,12,13,14]. Notably, the antioxidant property is one of the significant activities of Cordyceps polysaccharides, which would be also one of the mechanisms for its physiological function. Oxidative stress is associated with various diseases, such as cancer, cardiovascular disease, type-II diabetes, immunity diseases, and aging [15,16]. Reactive oxygen species (ROS) scavenging improves oxidative homeostasis and delays the onset and progression of aging and other diseases [12]. At present, many synthetic antioxidants are widely used, but they are unable to consistently prevent ROS-induced damage in vivo and can even increase the incidence of diseases [17]. Therefore, there is an urgent need to develop safe and effective natural antioxidants as alternatives to synthetic ones. Cordyceps polysaccharides possess excellent biocompatibility and non-toxic characteristics, making them easily tolerated by the human body. Consequently, the application of Cordyceps polysaccharides is a rising concern in the defense against a variety of oxidative stresses.
Previously, studies have tended to focus on natural Cordyceps polysaccharides as well as intracellular and extracellular polysaccharides of cultured Cordyceps rather than those originating from spores of Cordyceps [18,19]. Fungal spores contain all the genetic substances, possess similar bioactive components to the fruiting body, and even have greater pharmaceutical values than the fruiting body, such as Ganoderma lucidum spores. Ganoderma lucidum spore polysaccharides have been reported to contain various physiological and health effects, such as strong antioxidant activities, immunomodulating activities, and anti-tumor activities [20,21]. It is worth noting that the State Drugs Administration of China has approved the use of Ganoderma lucidum spore polysaccharides injection (GuoYaoZhunZi H20003510 and H20003123) for the treatment of neurosis, progressive muscular dystrophy, and various diseases caused by a compromised immune system [22]. These suggest that polysaccharides from spores of medicinal mushrooms are important resources for functional food development and new drug discovery. Studies have shown that polysaccharides from spores of Cordyceps cicadae exhibited a higher ability to promote glucose absorption, reduce insulin resistance, and improve type II diabetes compared to mycelia and sclerotia polysaccharides [23]. In addition, polysaccharides from spores of Cordyceps cicadae exhibited ameliorative effects in immunosuppressed mice through enhancing macrophage phagocytic activity, improving natural killer cytotoxicity, and modulating antioxidant enzyme system [22]. However, polysaccharides from Cordyceps spores are less studied. In our previous studies, large quantities of O. gracilis were obtained in submerged culture via the microcycle conidiation technique [24]. Numerous studies have shown that the functions of polysaccharides are closely linked to their structural characteristics, such as monosaccharide composition, molecular weight (Mw), and chemical linkages [25,26]. Therefore, it is crucial to understand the structure of polysaccharides originating from the spores of O. gracilis.
In this study, a neutral polysaccharide (GSP-1a) was isolated and purified from O. gracilis spores. Its structural characteristics, including molecular weight, monosaccharide composition, and glycosyl linkages, were elucidated, and the plausible structure was predicted. In addition, the extracellular antioxidant activity of GSP-1a was evaluated by free radical scavenging assays (OH, ABTS•+, DPPH). Furthermore, the protective effects of GSP-1a on H2O2-induced oxidative stress in HepG2 cells were investigated via cellular antioxidant activity assays and its possible mechanism was revealed. This work aims to help understand the structural characteristics of O. gracilis spore polysaccharides and provide a theoretical reference for the development of new antioxidants and functional foods or medicine.

2. Results and Discussion

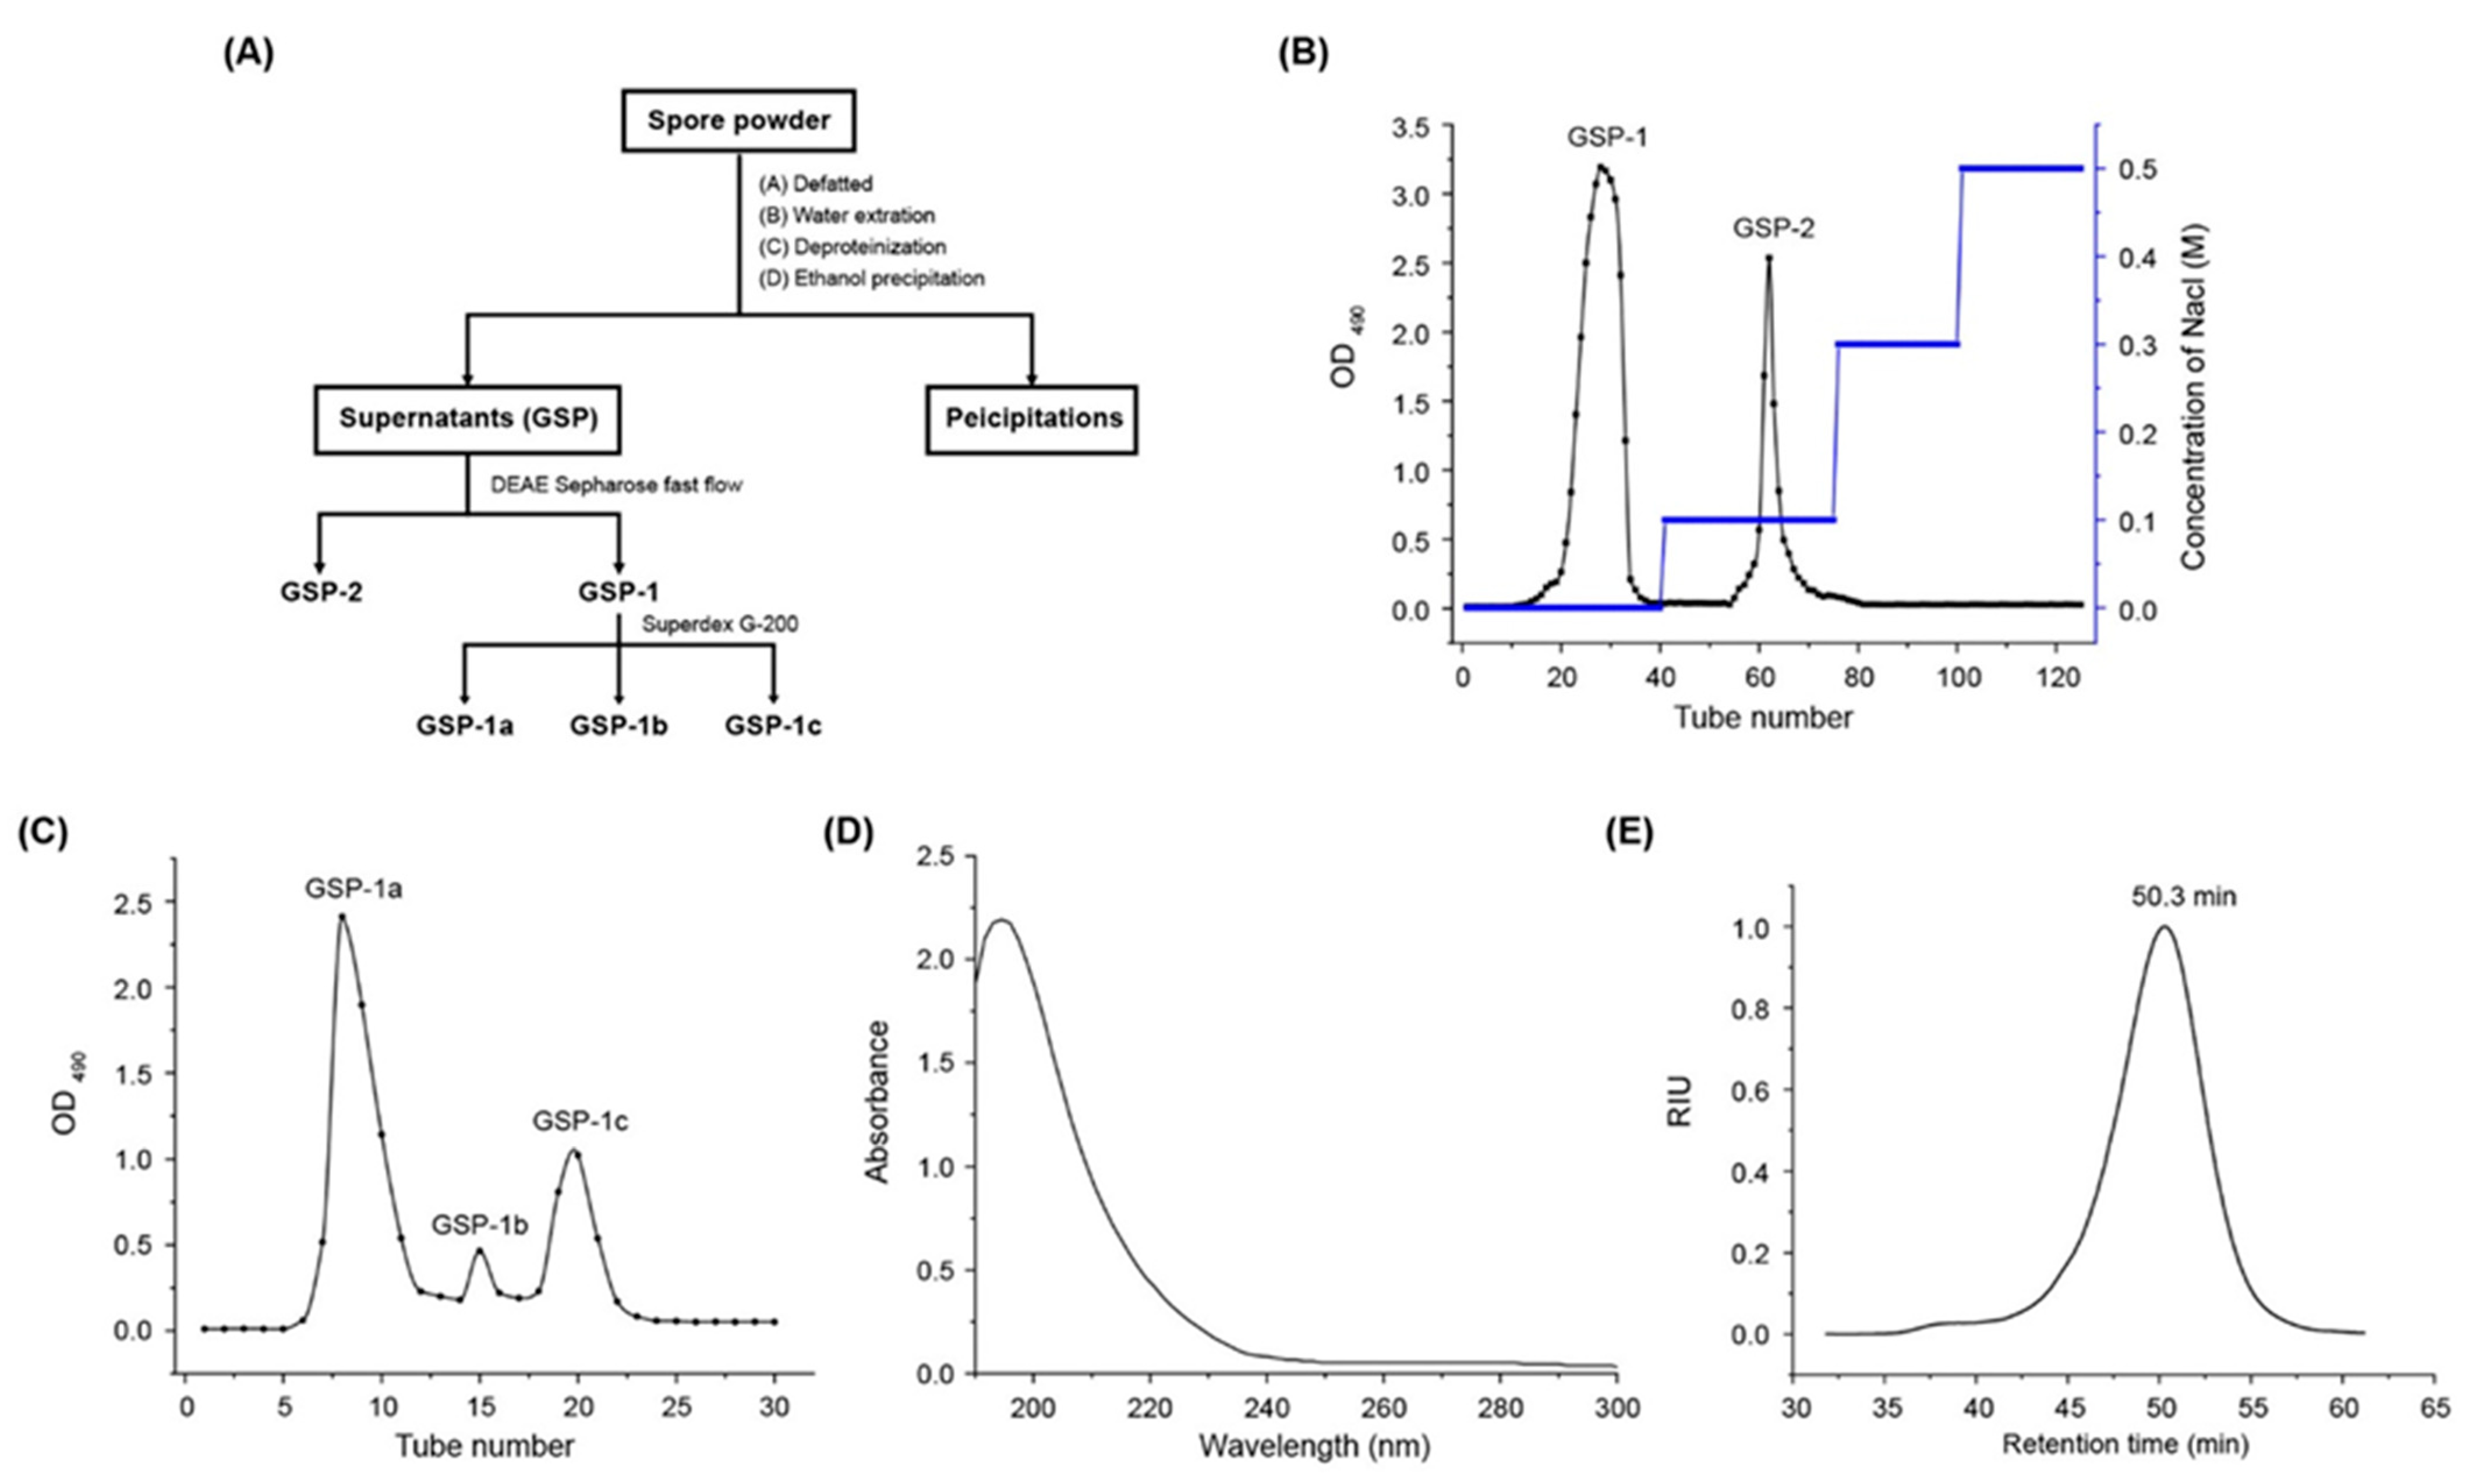
2.1. Molecular Weight and Chemical Composition of GSP-1a

The flow diagram for the isolation and purification of polysaccharides from O. gracilis spores is shown in Figure 1A. The extraction of crude polysaccharides (GSP) yielded 7.9%. Then GSP was dissolved in ultrapure water and loaded onto a DEAE Sepharose fast flow column (2.6 cm × 40 cm) with gradient elution of 0–0.3 M NaCl solutions. Figure 1B illustrates that two fractions GSP-1 and GSP-2 were eluted under 0 and 0.1 mol/L NaCl solution with a yield of 55% and 10%, respectively. The first peak, GSP-1, represented the major fraction of GSP, which was further purified using the Superdex G-200 column. Figure 1C shows the composition of GSP-1, primarily consisting of GSP-1a (61%), GSP-1b (3%), and GSP-1c (16%). This indicated that GSP-1a was the dominant fraction, thus warranting further analysis of its structure. UV–Vis spectra (Figure 1D) revealed the absence of absorption peaks at 260 nm and 280 nm, indicating the absence of protein and nucleic acids in GSP-1a. Furthermore, gel permeation chromatography (Figure 1E) demonstrated a single and symmetrical peak for GSP-1a, indicating its homogeneity. The molecular weight (Mw) of GSP-1a was determined to be 72.8 kDa, with an Mw/Mn of 1.1 (Table 1), indicating that GSP-1a was a homogeneous polysaccharide.
The HPAEC quantitative analysis of the monosaccharide composition of GSP-1a is shown in Table 1 and Figure S1. Comparing the chromatogram of the mixed standard monosaccharides with that of monosaccharide components in GSP-1a, it could be seen that GSP-1a mainly consisted of mannose (man, 42.28%), galactose (gal, 35.7%), and glucose (glc, 22.02%). The monosaccharide components of GSP-1a were different from those of Ganoderma lucidum spore polysaccharides (glucose:galactose:arabinose = 90.82:7.95:1.23, molar percentage), Paecilomyces cicadae spore polysaccharides (glucose:galactose:mannose:arabinose = 8:5:4:1, molar ratio), and Cordyceps cicadae spores polysaccharides (CCSP-2 glucose:mannose = 94.27:5.73, CCSP-3 xylose:mannose:glucose:galactose = 22.08:2.05:63.4:12.27, molar percentage) [21,22,27]. This suggests that there are significant differences in the structure of polysaccharides from the spores of different mushroom species.

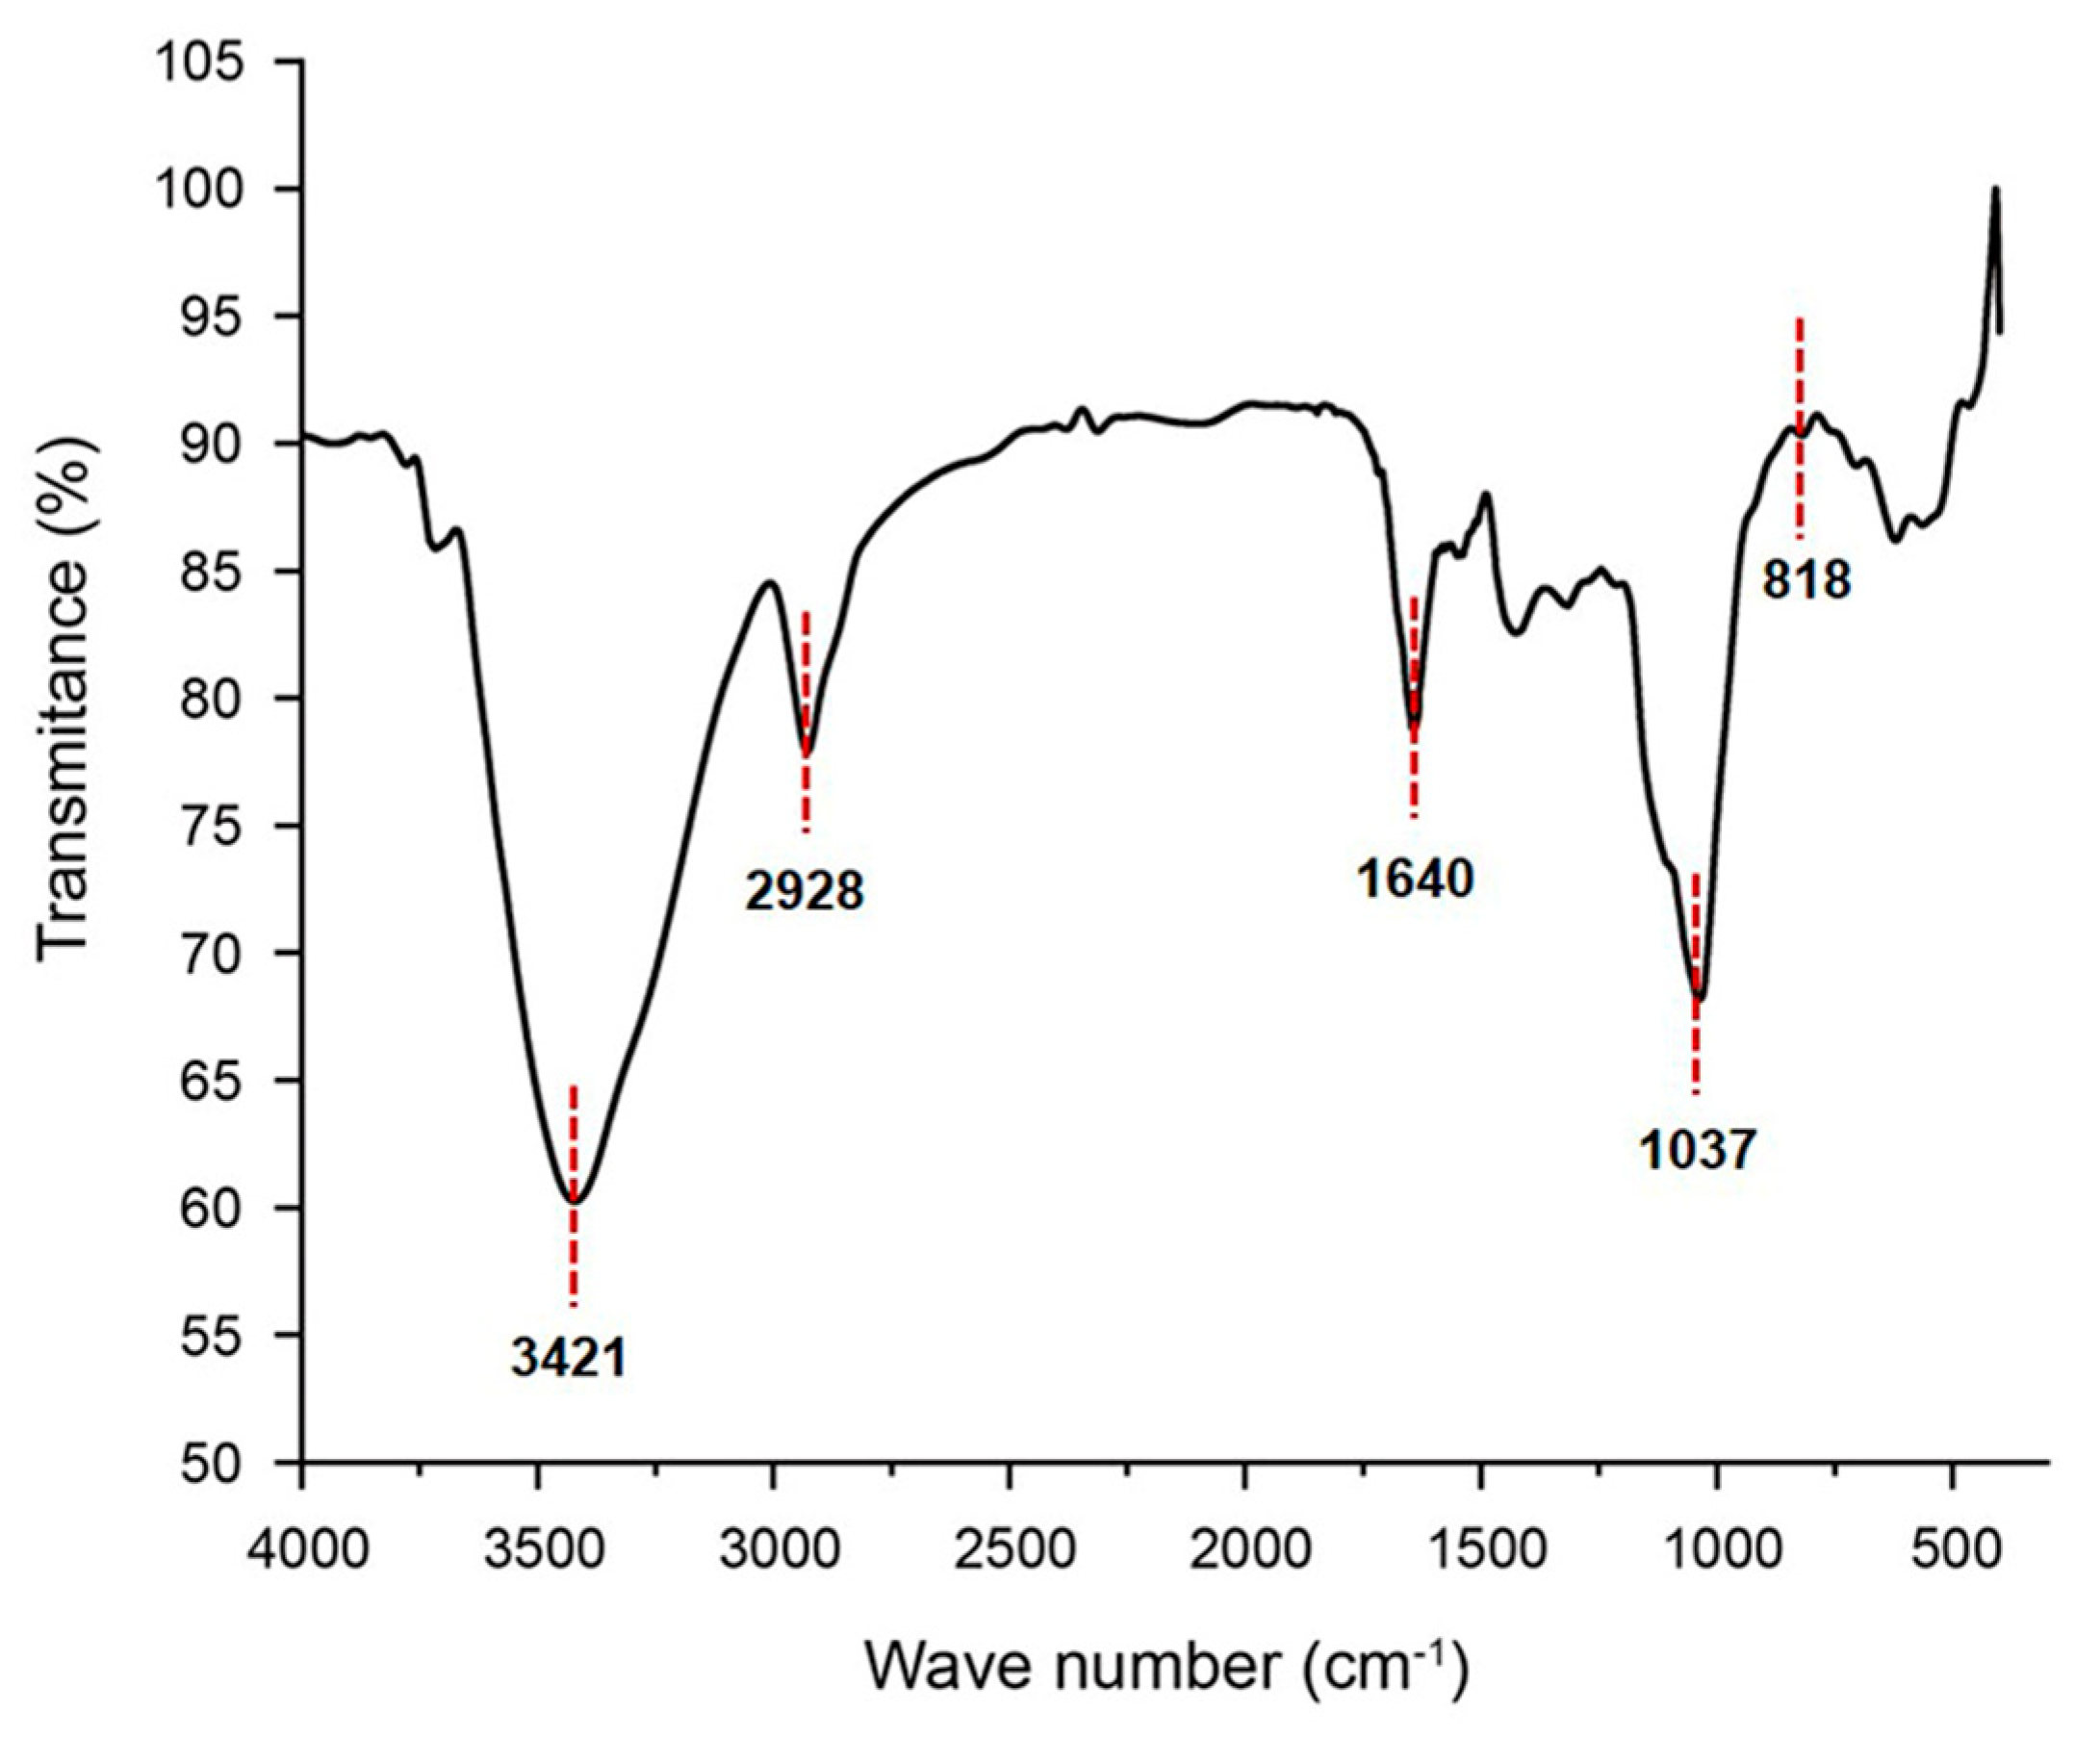
2.2. FT–IR Analysis of GSP-1a

Fourier transform infrared spectroscopy (FT–IR) spectrum of GSP-1a, presented in Figure 2, exhibited several characteristic peaks. The strong and broad peak at approximately 3421 cm−1 was assigned to the O-H stretching vibration, a typical feature of carbohydrates [28]. The signal at 2928 cm−1 corresponded to the stretching vibration of the C-H bonds in the sugar ring [29]. Additionally, the absorption between 1400 and 1200 cm−1 was indicative of carbohydrate-specific features [30]. The absence of a peak around 1730 cm−1 indicated the absence of uronic acid [13], which was consistent with the monosaccharide composition analysis. The peak at 1642 cm−1 may correspond to the hydroxyl group in the bound water [31]. The strong peak detected at approximately 1037 cm−1 represented the bending vibration of C-OH [32]. The signals in the range of 1000–1200 cm−1 were attributed to the stretching vibrations of C-O-C and C-O-H linkages [33]. Furthermore, the peak at 820 cm−1 indicated the presence of α-glycosidic bonds [34], which was consistent with the results of nuclear magnetic resonance (NMR) spectroscopy.

2.3. Methylation Analysis of GSP-1a

To ensure the linkage patterns of monosaccharides, GSP-1a was completely methylated; thereafter, the retention time, peak values, and ion fragment characteristics of partially methylated alditol acetates (PMAAs) products were detected using GC-MS and compared with a database [26]. The linkage analysis of GSP-1a is summarized in Table 2. For the polysaccharide, the non-reducing terminals consisted of Galp (34.36%). The branching points were at 3, 6-Glcp (9.6%), 2, 6-Manp (15.46%), and 2, 4, 6-Manp (5.09%), indicating that GSP-1a had a certain branching structure. Other residues were disubstituted, including 6-Manp (19.99%), 6-Glcp (9.87%), a small amount of 2-Manp (1.95%), and 4-Glcp (3.68%). Overall, the results of methylation were consistent with the findings of monosaccharide composition analysis.

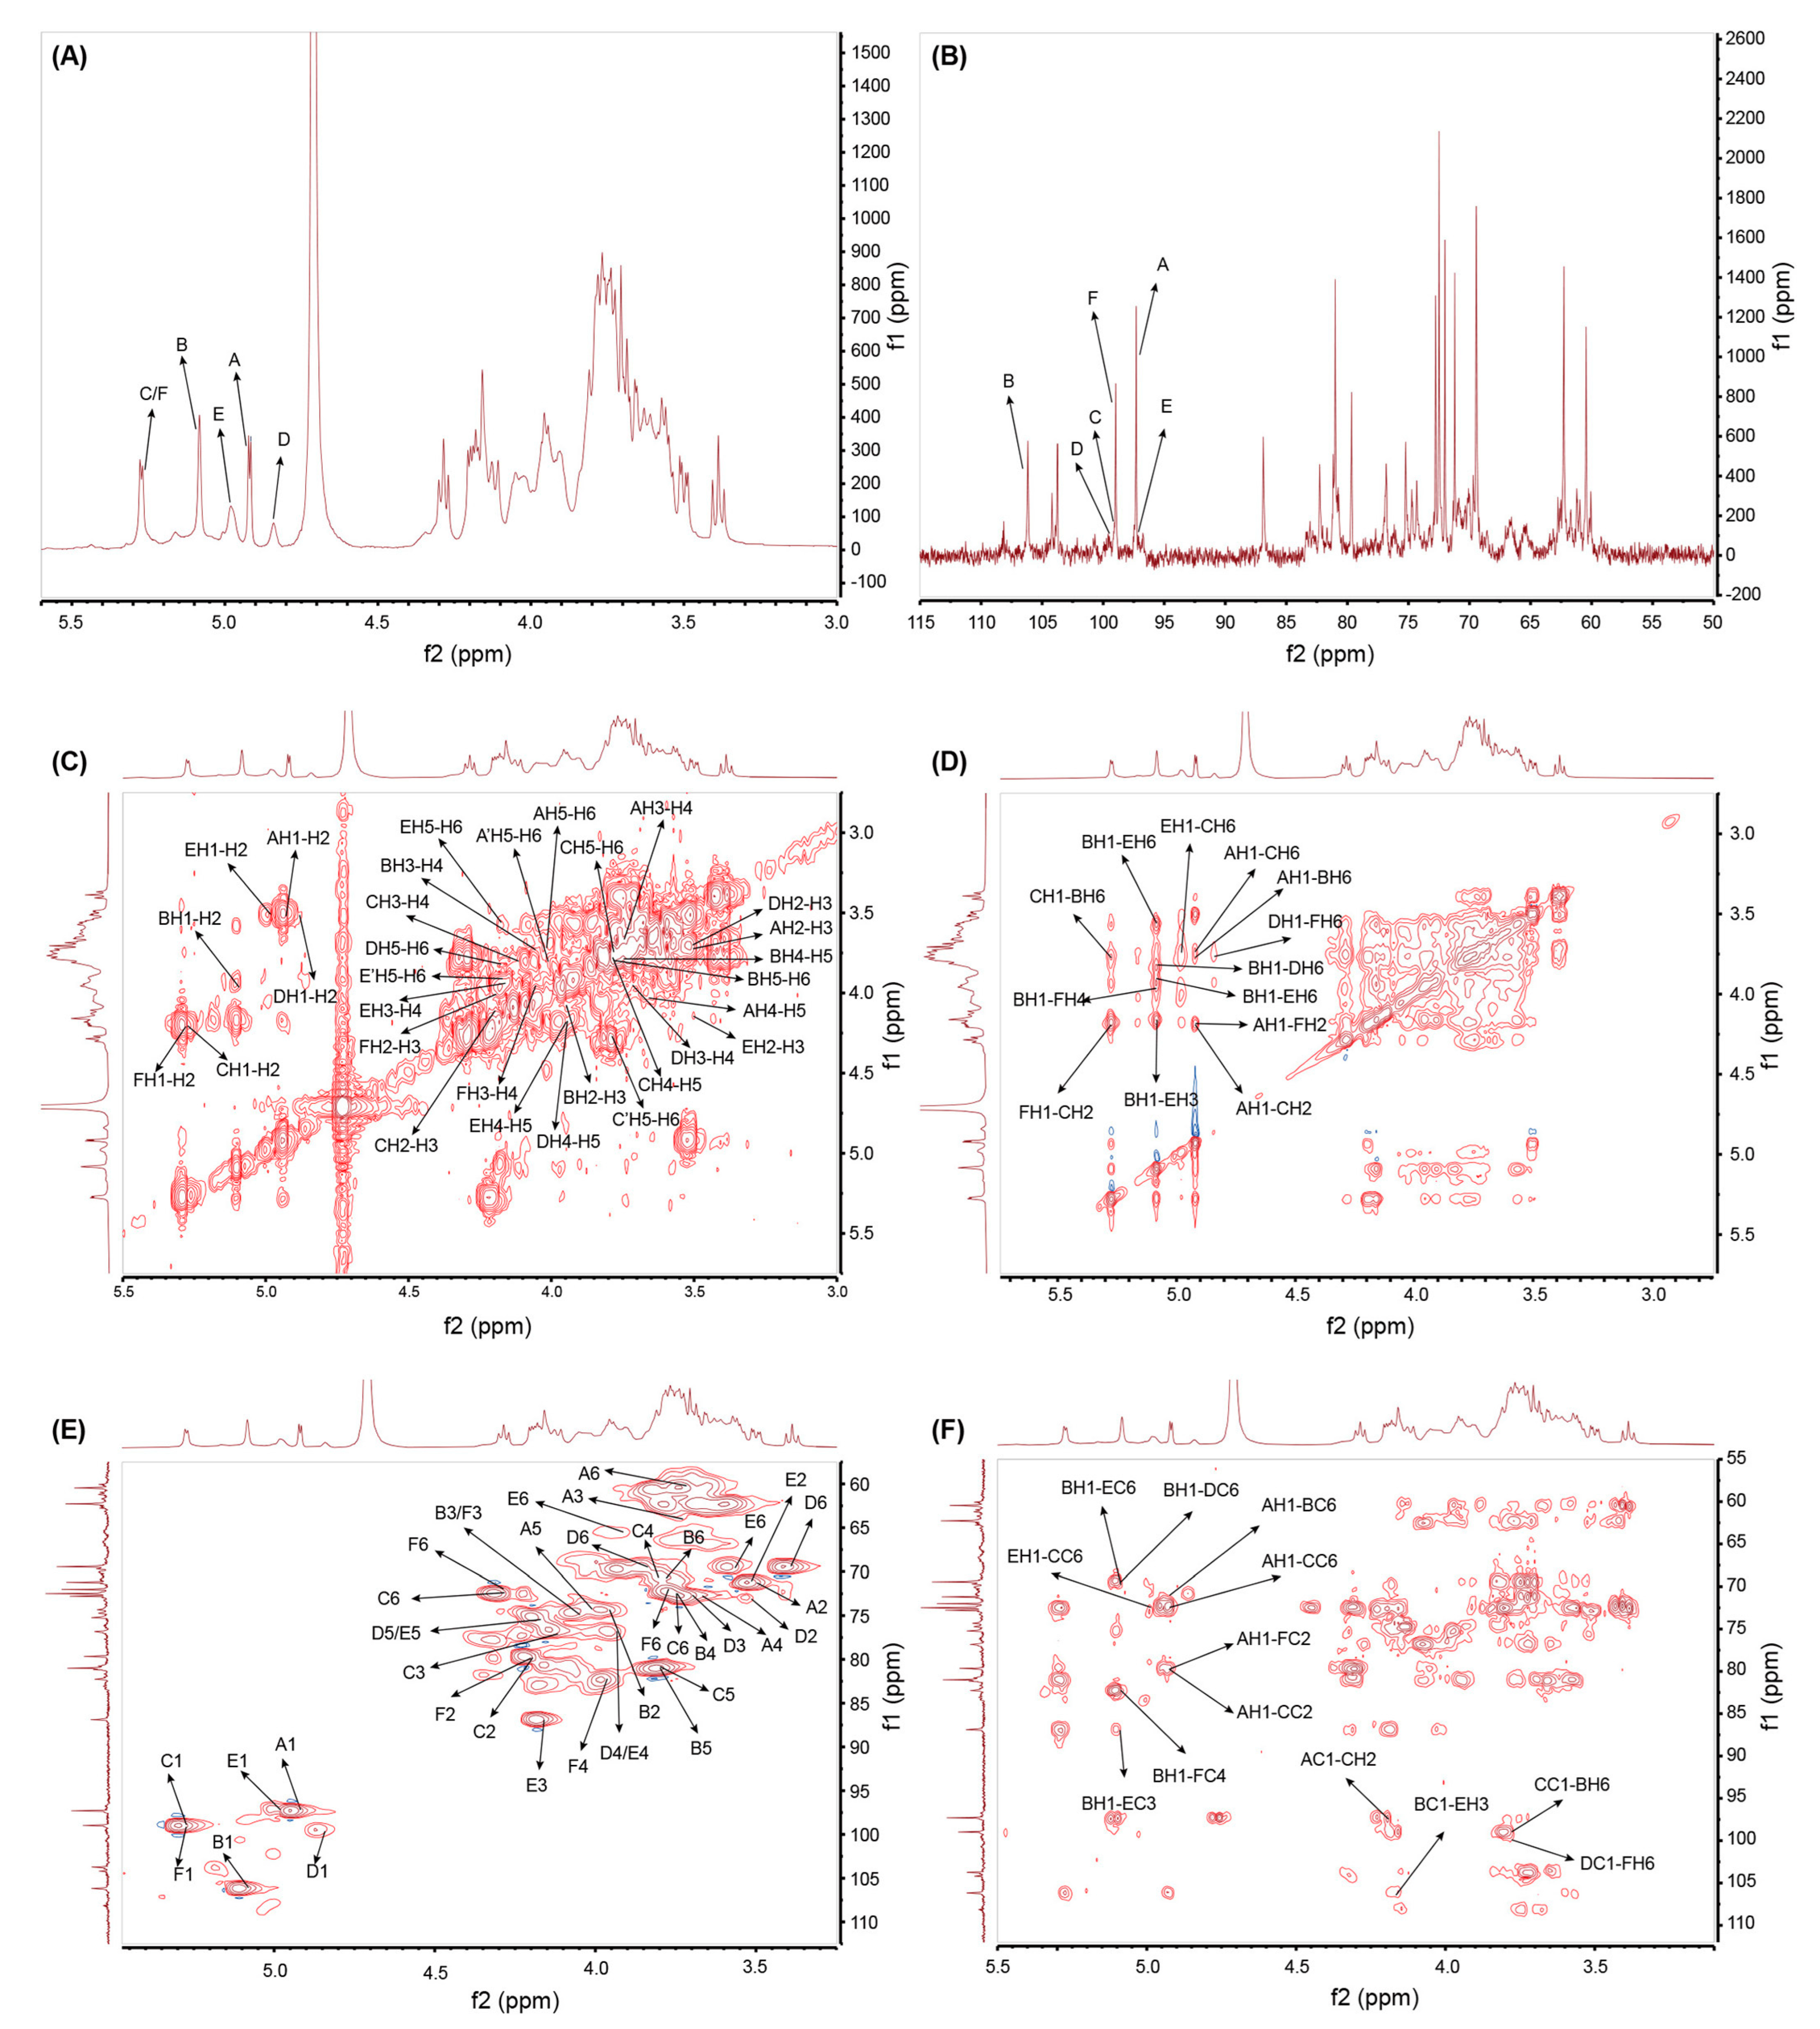
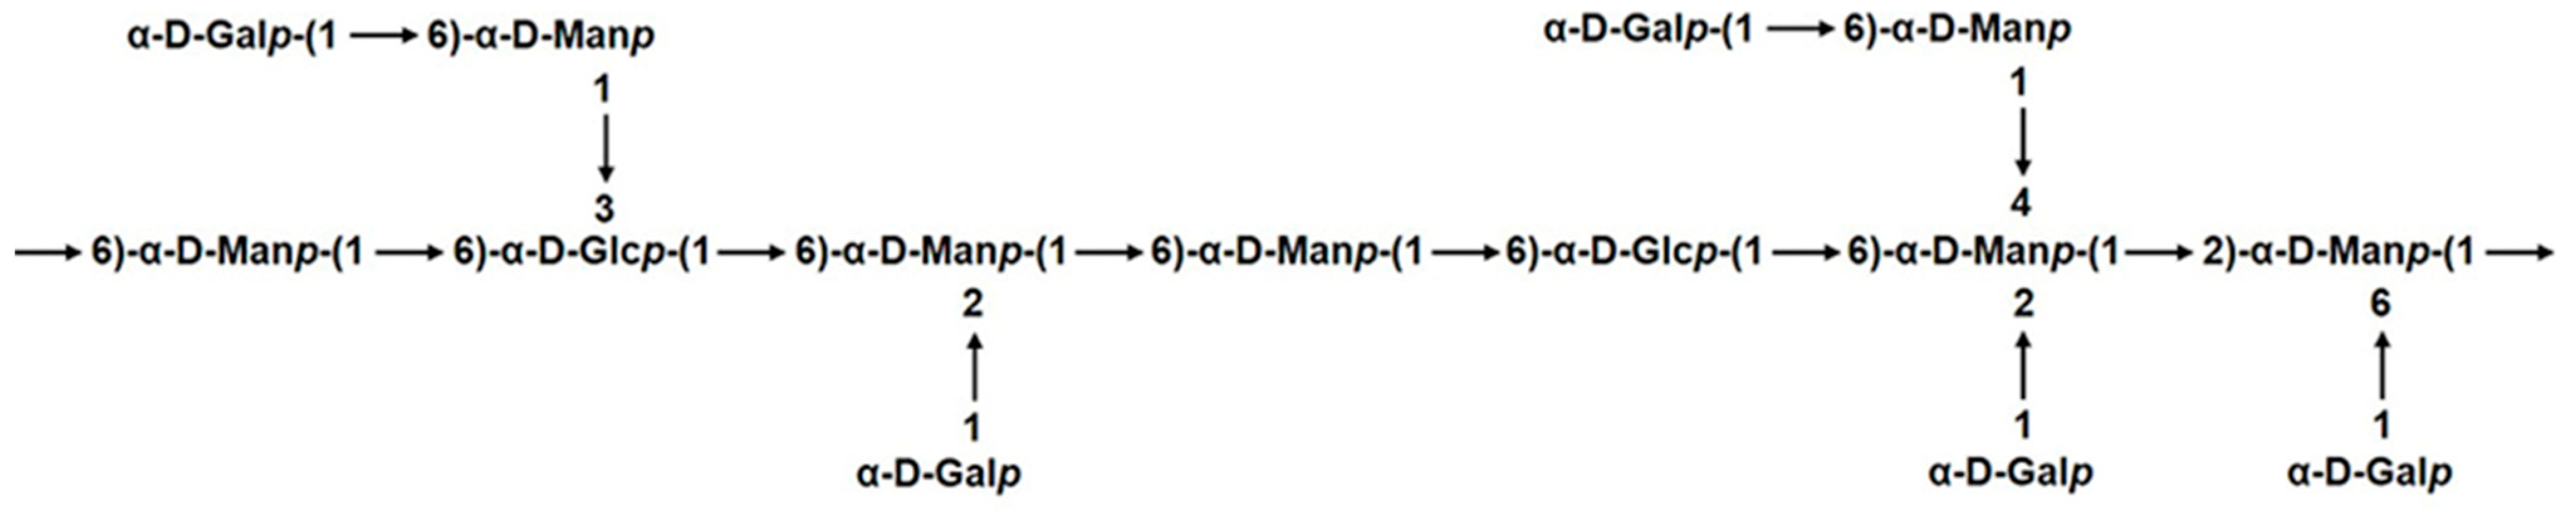
2.4. NMR Spectroscopy Analysis of GSP-1a

To further interpret the structure of GSP-1a, the polysaccharide was analyzed via 1D-NMR (1H NMR and 13C NMR) and 2D-NMR (1H−1H COSY, 1H−13C HSQC, 1H−1H NOESY, and 1H−13C HMBC). NMR spectroscopy is a powerful tool for obtaining detailed structural information for carbohydrates. It can aid identifying the monosaccharide composition, determining the α- or β-anomeric configurations, and establishing linkage patterns and sequences of sugar units in polysaccharides [35]. H/C chemical shifts in all sugar residues were fully assigned based on the NMR spectra data and literature.
The signals for GSP-1a in 1H and 13C NMR spectra were presented in Figure 3A,B. The proton signals were observed in the region ranging from δ 3.0 to 5.5 ppm, while the carbon signals appeared in the range of δ 90 to 110 ppm, which were the typical chemical shifts of polysaccharides [36]. In the 1H NMR spectrum, a strong signal at δ 4.71 ppm was assigned to the solvent proton peak, serving as a reference for other peaks. Six anomeric proton signals were observed at δ 4.92 ppm, δ 5.08 ppm, δ 5.27 ppm, δ 4.84 ppm, δ 4.98 ppm, and δ 5.27 ppm, corresponding to the H-1 positions of residues A–F, respectively. Furthermore, the corresponding anomeric carbon signals were observed at δ 97.29 ppm, δ 106.28 ppm, δ 98.97 ppm, δ 99.56 ppm, δ 97.24 ppm, and δ 99.08 ppm, as determined from the 13C NMR spectrum. According to the methylation analysis results, two sugar residues were not shown in NMR, which may be due to their low content. Additionally, the absence of signals in the range of δ 160–180 ppm in the 13C NMR spectrum indicates that GSP-1a does not contain uronic acid, confirming its classification as a neutral polysaccharide [37]. The 1H−1H COSY spectrum was employed to analyze the interconnectivity between adjacent hydrogen atoms within the same carbon atom [38]. On the other hand, the 1H−13C HSQC spectrum was utilized to study the distribution of 1H and 13C coupling within the same glycosidic bond [39]. By utilizing these spectra, the chemical shifts of glycosidic bonds A, B, C, D, E, and F were fully assigned based on the correlation peaks observed in the 1H−1H COSY and 1H−13C HSQC spectra.
For residue A, the cross-peaks were found at δ 4.92/3.50, δ 3.50/3.74, δ 3.74/3.66, δ 3.66/4.01, and δ 4.01/3.71, 3.80 in the 1H−1H COSY spectrum (Figure 3C), indicating that H2−H6 signals of residue A were at δ 3.50 ppm, δ 3.74 ppm, δ 3.66 ppm, δ 4.01 ppm, and δ 3.71/3.80 ppm. Similarly, the cross-peaks were at δ 3.50/71.24, δ 3.74/72.09, δ 3.66/72.68, δ 4.01/74.37, and δ 3.71/3.80, 60.39 in 1H−13C HSQC (Figure 3E), showing that C2−C6 resonances were at δ 71.24 ppm, δ 72.09 ppm, δ 72.68 ppm, δ 74.37 ppm, and δ 60.39 ppm. Combined with methylation results and references, it was speculated that the glycosidic bond A might be α-D-Galp-(1→[40]. Furthermore, the H2−H6 signals and C2−C6 signals of six anomeric residues of GSP-1a were obtained according to the 1H−1H COSY and 1H−13C HSQC spectra. All the hydrogen and carbon signals are listed in Table 3. The H-2/C-2 to H-6/C-6 of residue B were δ 3.95/74.37, 4.05/74.72, 3.75/72.34, 3.78/80.94, and 3.77/70.65 ppm, respectively. The H-2/C-2 to H-6/C-6 of residue C were δ 4.19/79.72, 4.11/76.88, 3.79/70.65, 3.78/80.94, and 3.75/72.36 ppm, respectively. The H-2/C-2 to H-5/C-5 of residue D were δ 3.50/73.06, 3.71/72.81, 3.94/76.75, 4.17/75.31, and 3.39/69.46 ppm, respectively. The H-2/C-2 to H-5/C-5 of residue E were δ 3.51/71.03, 4.16/86.89, 3.94/76.75, 4.17/75.31, and 3.91/69.59 ppm, respectively. The H-2/C-2 to H-4/C-4 of residue F were δ 4.19/79.72, 4.05/74.72, and 3.96/82.23, respectively.
Residue B exhibited a strong signal of anomeric proton and an anomeric carbon signal in the 1H NMR, 13C NMR, and 1H−13C HSQC spectra, suggesting its high content and proportion within GSP-1a. Based on the methylation analysis and monosaccharide component results, residue B was inferred to be an α-linked mannose (Man) residue. Further, according to the corresponding references, we speculated that the glycosidic bond B might be →6)-α-D-Manp-(1→[26,41,42,43]. In addition, combined with the methylation results and the relevant literature, it was inferred that the glycosidic bonds C, D, E, and F were→2,6)-α-D-Manp-(1→, →6)-α-D-Glcp-(1→, →3,6)-α-D-Glcp-(1→ and →2,4,6)-α-D-Manp-(1→[37,41,44,45,46,47].
The glycosidic linkage sequence among the sugar residues of GSP-1a was determined through correlation peaks obtained in the 1H−13C HMBC and 1H−1H NOESY spectrum. The 1H-13C HMBC spectrum shows carbon–hydrogen coupling between different sugar residues [38]. As shown in Figure 3F, a series of inter-residual correlations were found among residues. The cross peaks between H-1 of residue A and C-6 of residue B, H-1 of residue A and C-2 of residue C/F, and C-1 of residue A and H-2 of residue C/F indicated the presence of sequence of α-D-Galp-(1→6)-α-D-Manp-(1→, α-D-Galp-(1→2,6)-α-D-Manp-(1→ and α-D-Galp-(1→2,4,6)-α-D-Manp-(1→. The cross peaks between H-1 of residue B and C-6 of residue D/E, H-1 of residue B and C-3 of residue E, H-1 of residue B and C-4 of residue F, and C-1 of residue B and H-3 of residue E indicated the presence of sequence of →6)-α-D-Manp-(1→6)-α-D-Glcp-(1→, →6)-α-D-Manp-(1→3,6)-α-D-Glcp-(1→ and →6)-α-D-Manp-(1→6,3)-α-D-Glcp-(1→. The cross peak of C-1 of residue C and H-6 of residue B indicated the presence of sequence of →2,6)-α-D-Manp-(1→6)-α-D-Manp-(1. The cross peak of C-1 of residue D and H-6 of residue F indicated the presence of sequence of →6)-α-D-Glcp-(1→6,2,4)-α-D-Manp-(1→. The cross peak of H-1 of residue E and C-6 of residue C indicated the presence of sequence of →3,6)-α-D-Glcp-(1→6,2)-α-D-Manp-(1→. All the above inter-residual correlations were also found via NOSEY. Moreover, the cross-peaks between H-1 of residue A and H-6 of residue C, as well as H-1 of residue F and H-2 of residue C, were identified (Figure 3D), indicating the presence of two sequence α-D-Galp-(1→6,2)-α-D-Manp-(1→ and →2,4,6)-α-D-Manp-(1→2,6)-α-D-Manp-(1→. Therefore, the backbone of GSP-1a appeared to be mainly composed of →6)-α-D-Manp-(1→, →2,6)-α-D-Manp-(1→, →2,4,6)-α-D-Manp-(1→, →6)-α-D-Glcp-(1→, and →3,6)-α-D-Glcp-(1→ residues with some branches consisting of →6)-α-D-Manp-(1→ and α-D-Gal-(1→ residues. A hypothetical model structure of GSP-1a was inferred according to the comprehensive analysis of FT–IR, monosaccharide composition, methylation, and NMR, as shown in Figure 4.

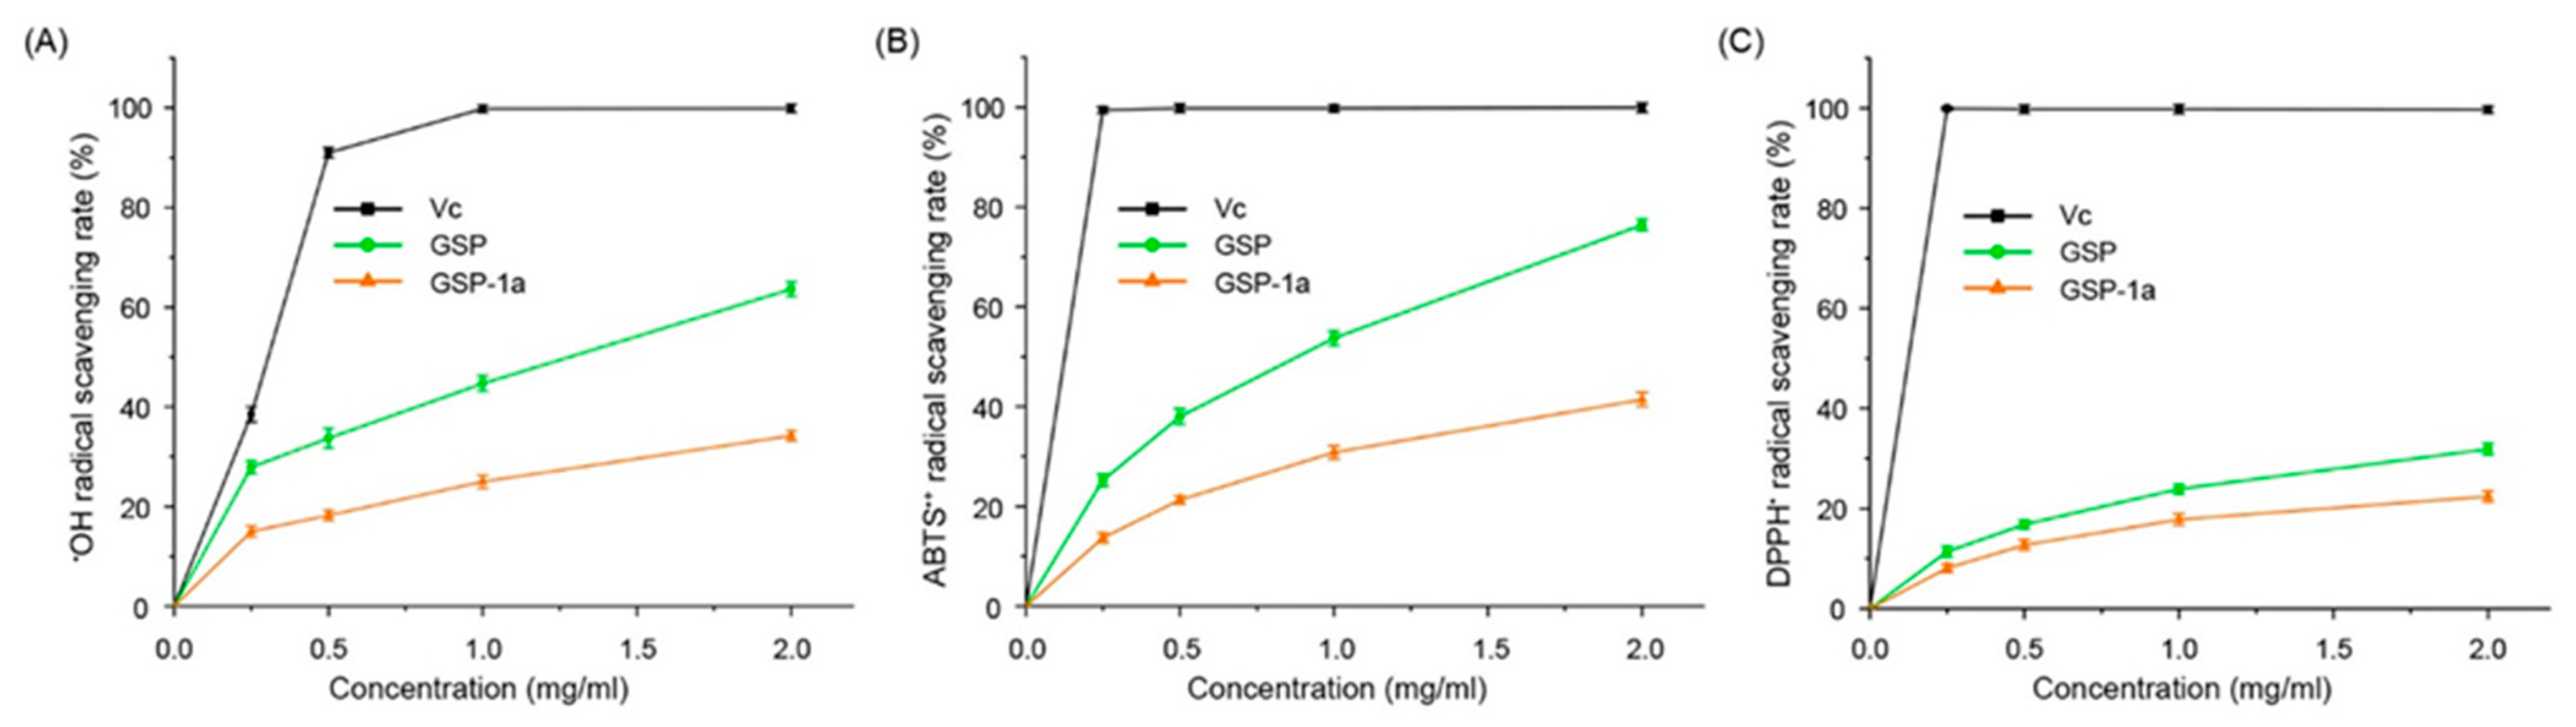
2.5. Antioxidant Activities In Vitro of GSP-1a

Excessive accumulation of free radicals in organisms can lead to a variety of diseases, particularly aging and age-related illnesses. Natural polysaccharides have gained widespread attention due to their excellent antioxidant activity, nontoxic, stable, and biocompatibility, especially fungal and plant polysaccharides [48]. Therefore, evaluating the antioxidant capacities of compounds of GSP-1a is crucial. In this study, we conducted OH, ABTS•+, and DPPH radical scavenging assays to evaluate the antioxidant capacities of GSP-1a, comparing them with the antioxidant activity of vitamin C (Vc). The OH is considered a strong reactive oxygen radical that can react with most biological molecules, causing tissue damage and cell death; so, removing hydroxyl radicals is vital to protect living systems [49]. As shown in Figure 5A, both GSP-1a and GSP exhibited a dose-dependent scavenging effect on OH radical. Within the concentration range of 0.25–2.0 mg/mL, the scavenging activity of GSP increased linearly from 27.9% to 63.6%. The half maximal inhibitory concentration (IC50) value of GSP was 1.25 mg/mL. While GSP-1a was less effective in scavenging OH radicals compared with GSP, the scavenging activity was 34.2% in 2 mg/mL. The ABTS•+ radical scavenging method is widely used to evaluate the total antioxidant ability of natural products [50]. As presented in Figure 5B, the trends for ABTS•+ radical scavenging activities of GSP-1a and GSP were similar. The scavenging activity of GSP-1a was enhanced from 13.7% to 41.4% with increasing concentration in the range of 0.25–2.0 mg/mL, while that of GSP was enhanced dramatically from 25.2 ± 1.2% to 76.4 ± 1.1%. The DPPH radical scavenging assay relies on the ability of antioxidants to donate hydrogen, and it is widely used as a means of estimating the free-radical scavenging activities of antioxidants [51]. Polysaccharides possess the unique capability to function as electron donors, allowing them to interact with free radicals and convert them into more stable forms [52]. This antioxidant activity enables polysaccharides to play a vital role in neutralizing and scavenging free radicals. As depicted in Figure 5C, the scavenging activity of both GSP-1a and GSP increased in a concentration-dependent manner. At a concentration of 2 mg/mL, GSP-1a exhibited a scavenging activity of 22.4%, while GSP demonstrated a scavenging activity of 32%.
Overall, the antioxidant activity of GSP-1a and GSP was lower than that of Vc at concentrations ranging from 0.25 to 2 mg/mL. However, the analysis of OH, ABTS•+, and DPPH radical scavenging activities still revealed that GSP-1a and GSP exhibit significant antioxidant activity in vitro. The antioxidant capacity of GSP-1a is comparable to that of certain Cordyceps polysaccharides with similar molecular weights and monosaccharide compositions. For example, when treated with a 2 mg/mL concentration, O. sinensis polysaccharides with a molecular weight of 28 kDa (backbone composed by α-1,4-Glc) and 43 kDa (man:gal:glc = 1.97:1:15.63, molar ratio) displayed OH scavenging capacities of 30% and 20%, respectively [53,54]. At a concentration of 1 mg/mL, the Cordyceps cicadae polysaccharides with a molecular weight of 60.7 kDa (gal:glu:man = 0.89:1:0.39, molar ratio) exhibited similar OH and ABTS•+ scavenging capacities of 20% and 30%, respectively [55]. Furthermore, the scavenging capacity for DPPH and OH of GSP-1a is superior to that of neutral polysaccharides with a molecular weight of 20 kDa from four types of mushrooms (Pleurotus eryngii, Flammulina velutipes, Pleurotus ostreatus, and white Hypsizygus marmoreus) [56]. It is worth noting that the crude polysaccharide fraction (GSP) tended to exhibit stronger antioxidant activity as compared to purified fractions (GSP-1a), which was consistent with previous research that the free radical scavenging ability of pure polysaccharide from Ziziphus jujuba was lower than that of crude polysaccharide [33]. The difference in antioxidant activity could potentially be attributed to impurities present in the crude polysaccharide fraction, such as proteins, amino acids, organic acids, and other compounds that possess inherent antioxidant properties [57]. These impurities may contribute to the overall antioxidant capacity of the crude polysaccharide fraction.

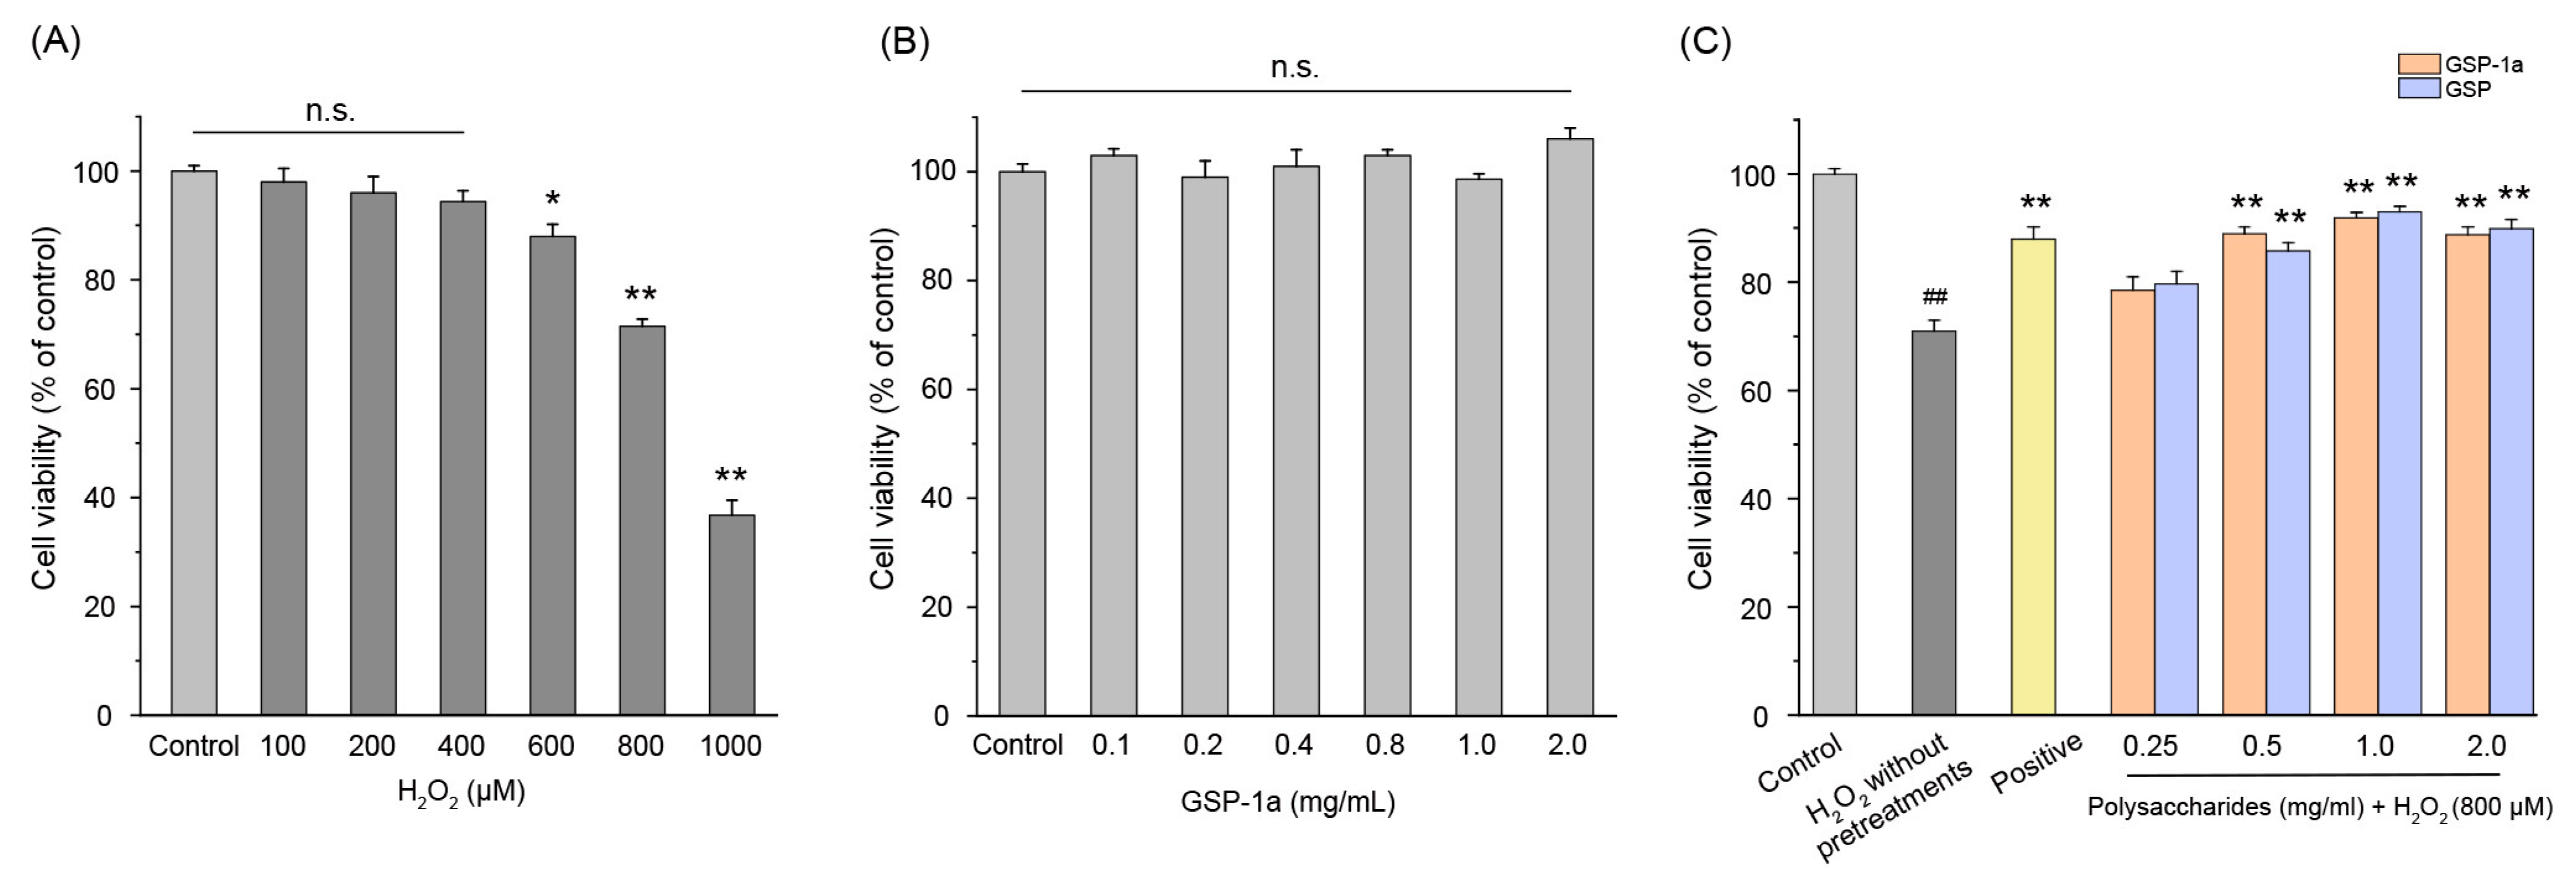
2.6. Effect of GSP-1a on H2O2-Induced Oxidative Stress

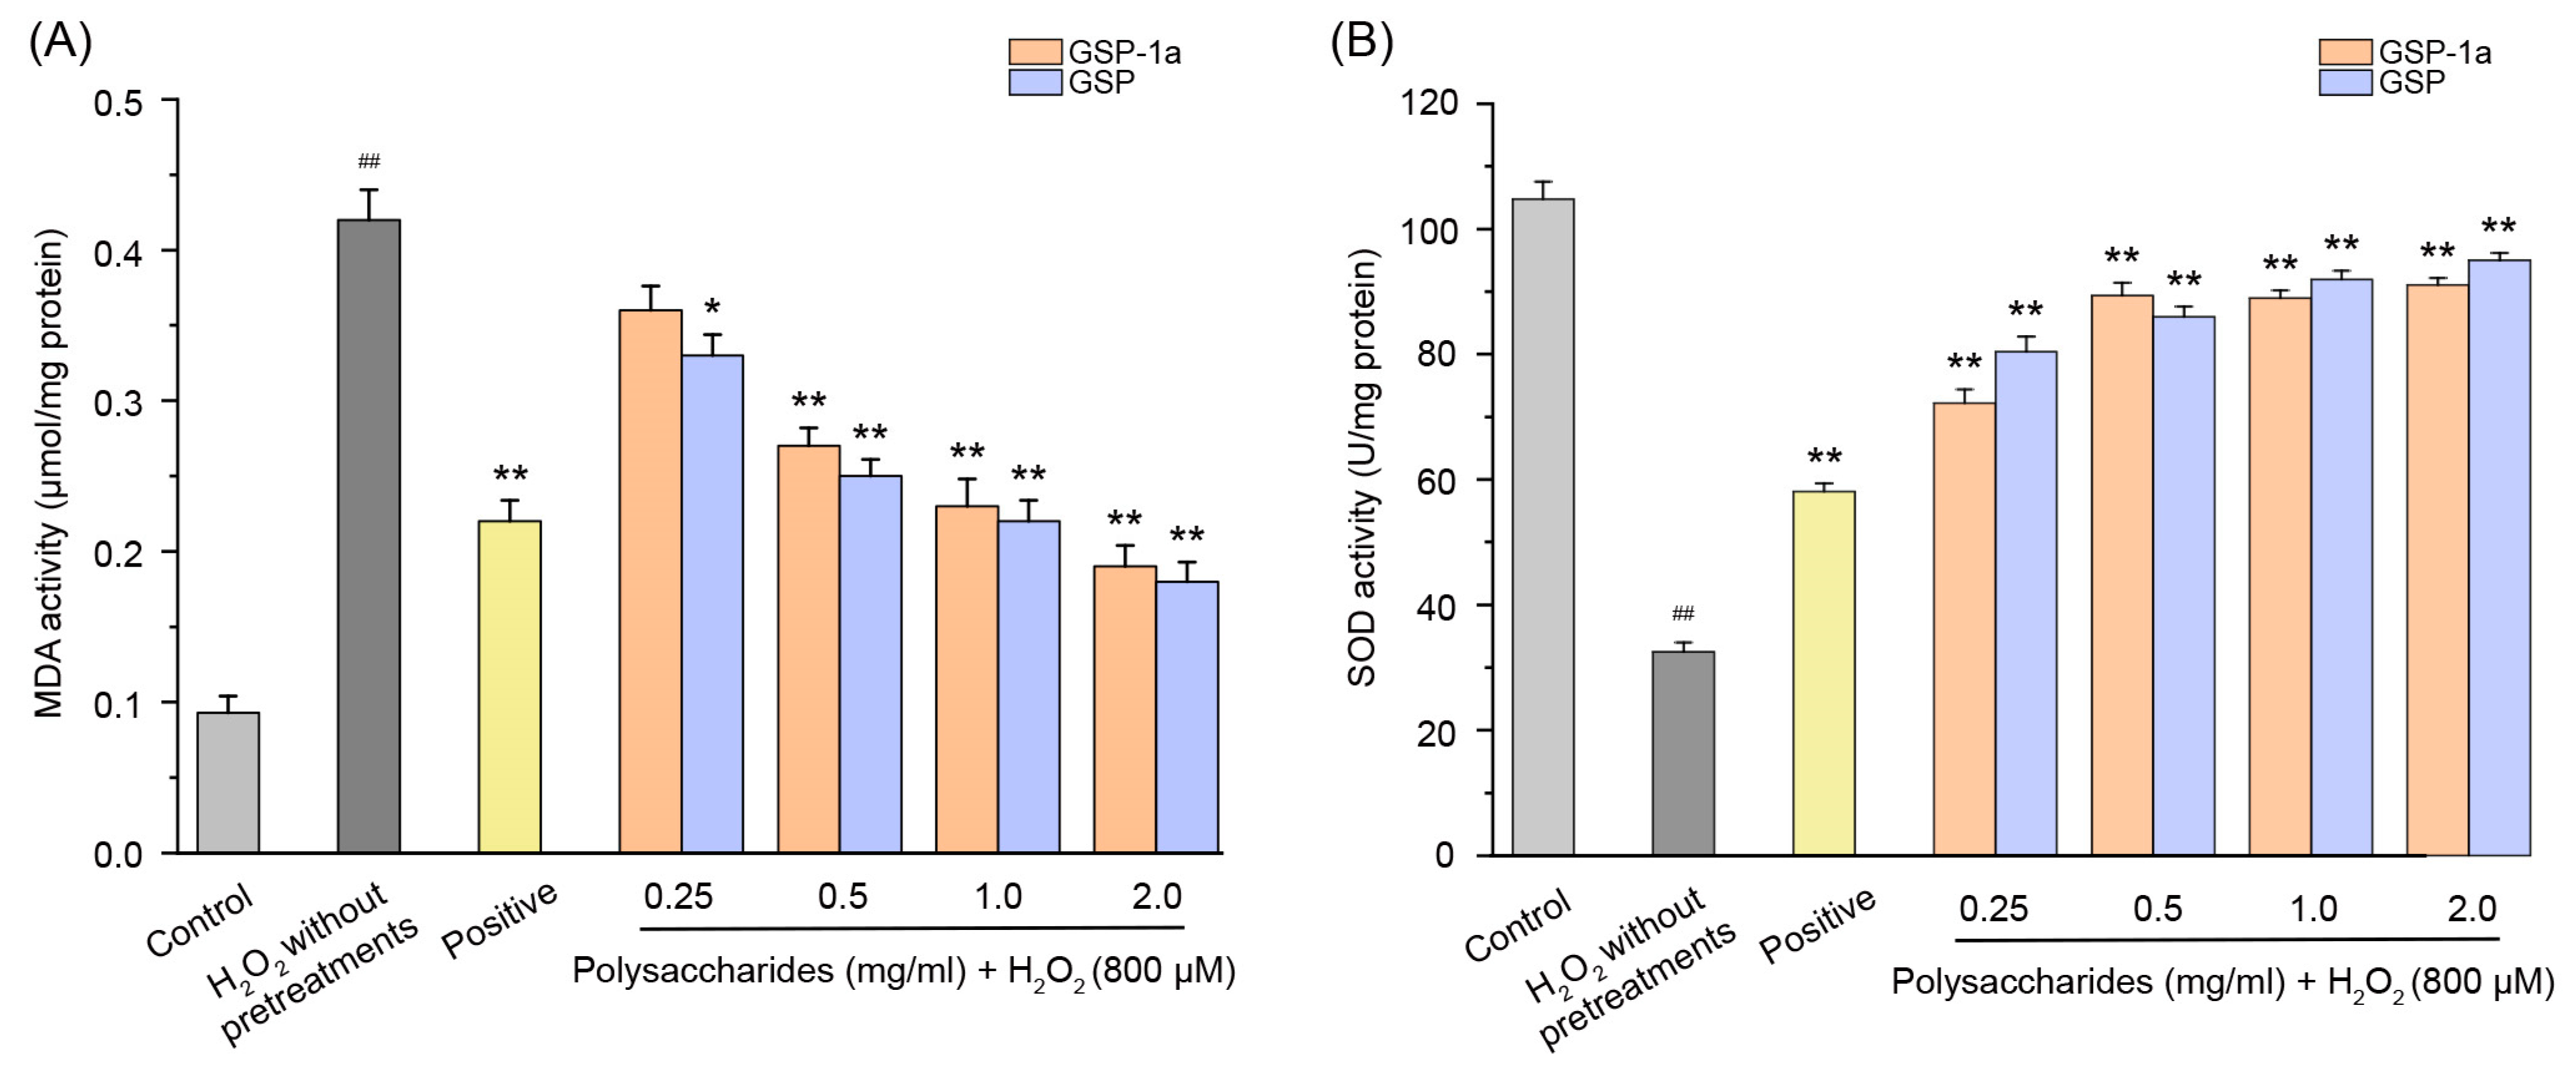
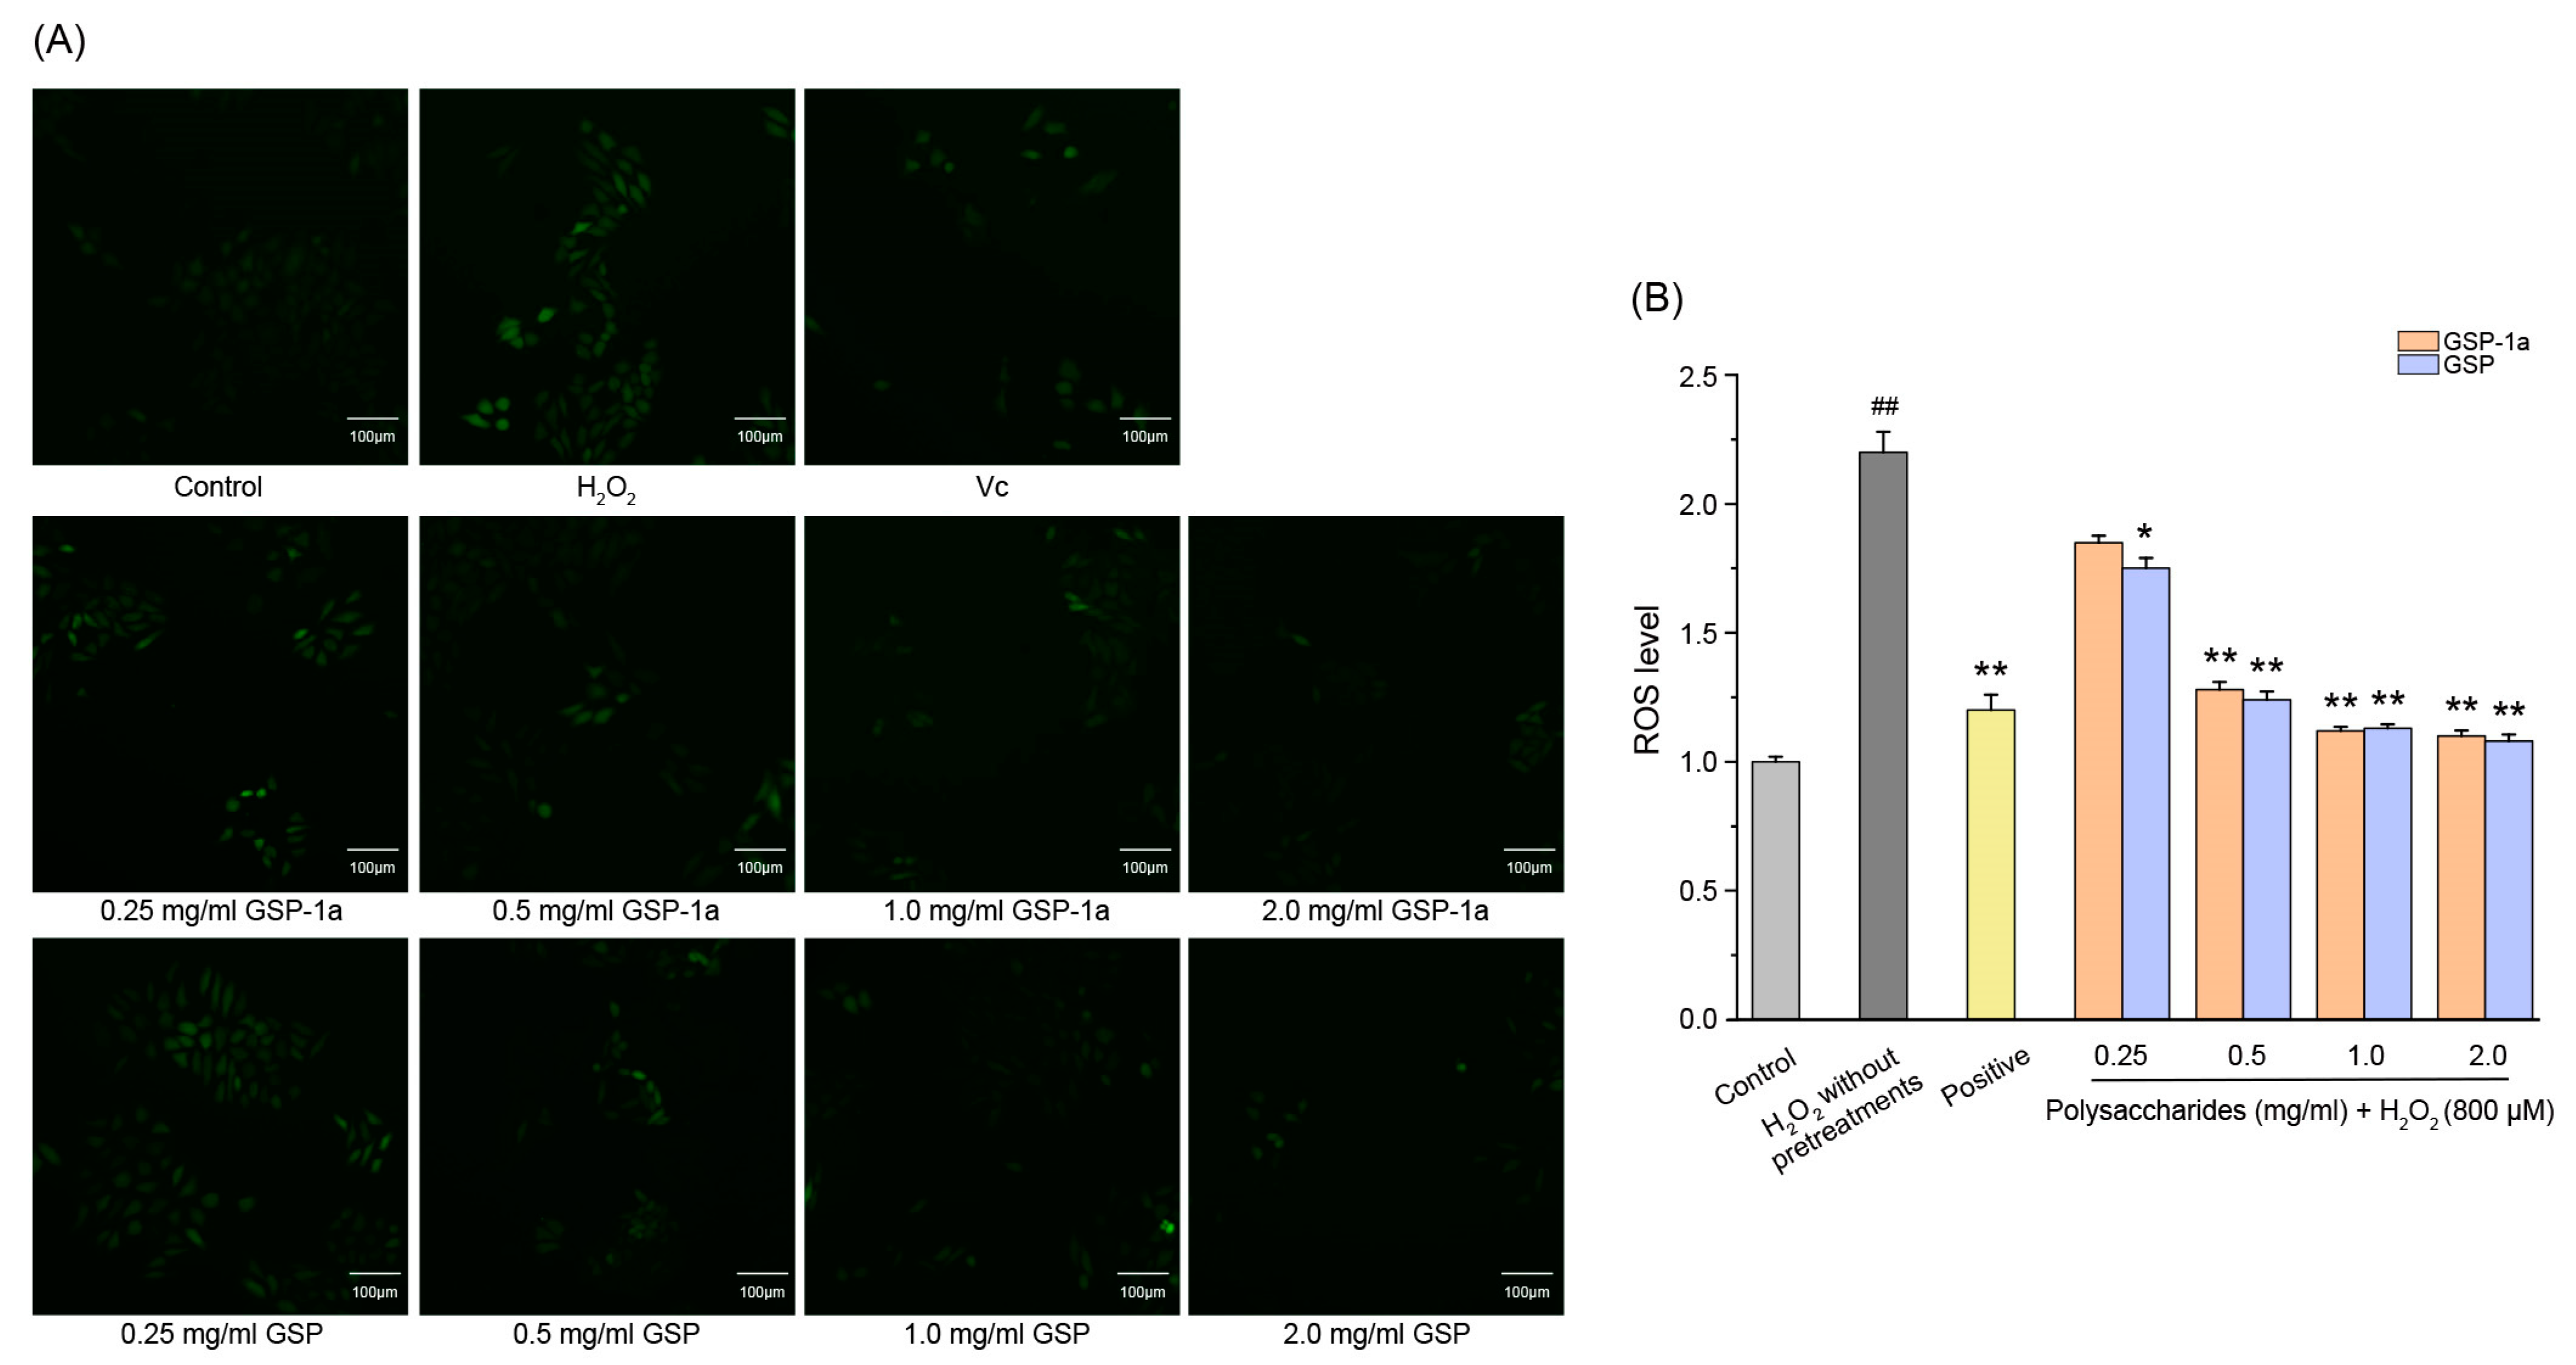
2.6.1. Effect of GSP-1a on the Change of ROS, MDA Content, and SOD Activities in H2O2-Treated HepG2 Cells

The hepatocellular carcinoma HepG2 cell has been widely used to evaluate antioxidant defense systems [33,58]. Thus, an oxidative stress model was established in HepG2 cells to assess the protective effect of GSP-1a. Initially, the optimal concentration of H2O2 required to induce oxidative stress in HepG2 cells was determined. As shown in Figure 6A, 600 μM or higher H2O2 concentrations decreased the percentage of living cells significantly compared with the control group. Considering that high H2O2 concentrations may cause cell death by non-apoptotic mechanisms [59], 800 μM H2O2 was selected to explore the protective effect of GSP-1a. According to Figure 6B, there was no significant difference in the viability of HepG2 cells when treated with a concentration range of 0 to 2 mg/mL of GSP-1a and GSP compared to the control group. This indicates that both GSP-1a and GSP concentrations were non-toxic to HepG2 cells. Consequently, different concentrations of GSP-1a (0.25, 0.5, 1, and 2 mg/mL) were selected to investigate their antioxidant activity in H2O2-induced oxidative stressed HepG2 cells. Based on the results shown in Figure 6C, the viability of HepG2 cells exhibited a significant increase when they were pretreated with GSP-1a and GSP, as compared to cells treated with H2O2 without any pretreatments. Notably, the viability of cells pretreated with 1 mg/mL GSP-1a reached 91.9% of the control value, and its protective effect was as good as the positive group. In addition, the cell viability under GSP-1a and GSP pretreatment were similar, and all were dose dependent. The results indicate that GSP-1a could be effective against H2O2-induced oxidative stress.
The addition of H2O2 can induce the production of excessive ROS in cells and excessive ROS further induces cell apoptosis [60]. ROS production serves as the most direct indicator for evaluating the antioxidative capacity. The lipid peroxide generated from the reaction between ROS and the double bond of polyunsaturated fatty acids forms a series of aldehyde compounds of which MDA is one of the main products, and excessive MDA can ultimately lead to disruption of cellular metabolism [61]. Therefore, the content of MDA can indirectly reflect the ROS-mediated cell oxidative stress degree. In addition, SOD converts superoxide anion free radicals into oxygen and hydrogen peroxide. The level of SOD reflects the intracellular antioxidant enzyme system load which serves as an indirect indicator for estimating the antioxidant effect; when oxidative stress is suffered, the activity of the SOD enzyme will decrease [62]. To elucidate the protective mechanism of GSP-1a on H2O2-mediated oxidative stress injury to HepG2 cells, ROS level and MDA content in HepG2 cells were investigated.
Intracellular ROS levels were determined using DCFH-DA, as shown in Figure 7A. The green fluorescence indicates that intracellular ROS formation was detected. In Figure 7B, the DCF fluorescence intensities of HepG2 cells treated with H2O2 without any pretreatments were significantly higher than those in the control group (p < 0.01), which indicated that H2O2 induced intracellular ROS generation. Compared to the H2O2 without pretreatments group, pretreatment with GSP-1a and GSP reduced DCF fluorescence intensity significantly. Notably, at a concentration of 0.5 mg/mL, GSP-1a exhibited a remarkable reduction in DCF fluorescence intensity, comparable to that of the positive group. In Figure 8A, a significant increase in MDA content was observed for cells treated with H2O2 without any pretreatment (0.42 μmol/mg) when compared to the control group, indicating the occurrence of oxidative stress and lipid peroxidation induced by H2O2. GSP-1a treatment led to significant alleviation of MDA levels in a dose-dependent manner. At a concentration of 2 mg/mL, the MDA content decreased to 0.19 μmol/mg, highlighting the effectiveness of GSP-1a in mitigating lipid peroxidation. Additionally, as depicted in Figure 8B, the SOD activity for cells treated with H2O2 without any pretreatment (32.5 U/mg) was significantly lower than that in the control group (104.8 U/mg) (p ˂ 0.01), suggesting that H2O2 caused damage to SOD. However, treatment with GSP-1a and GSP led to a significant increase in SOD activity compared to cells treated with H2O2 without pretreatments, showing a dose-dependent relationship. Notably, the SOD activity increased to 89.4 U/mg following pretreatment with 0.5 mg/mL GSP-1a. These results indicated that GSP-1a could protect against H2O2-induced oxidative stress in HepG2 cells by inhibiting intracellular ROS and MDA generation, as well as by improving SOD activity.

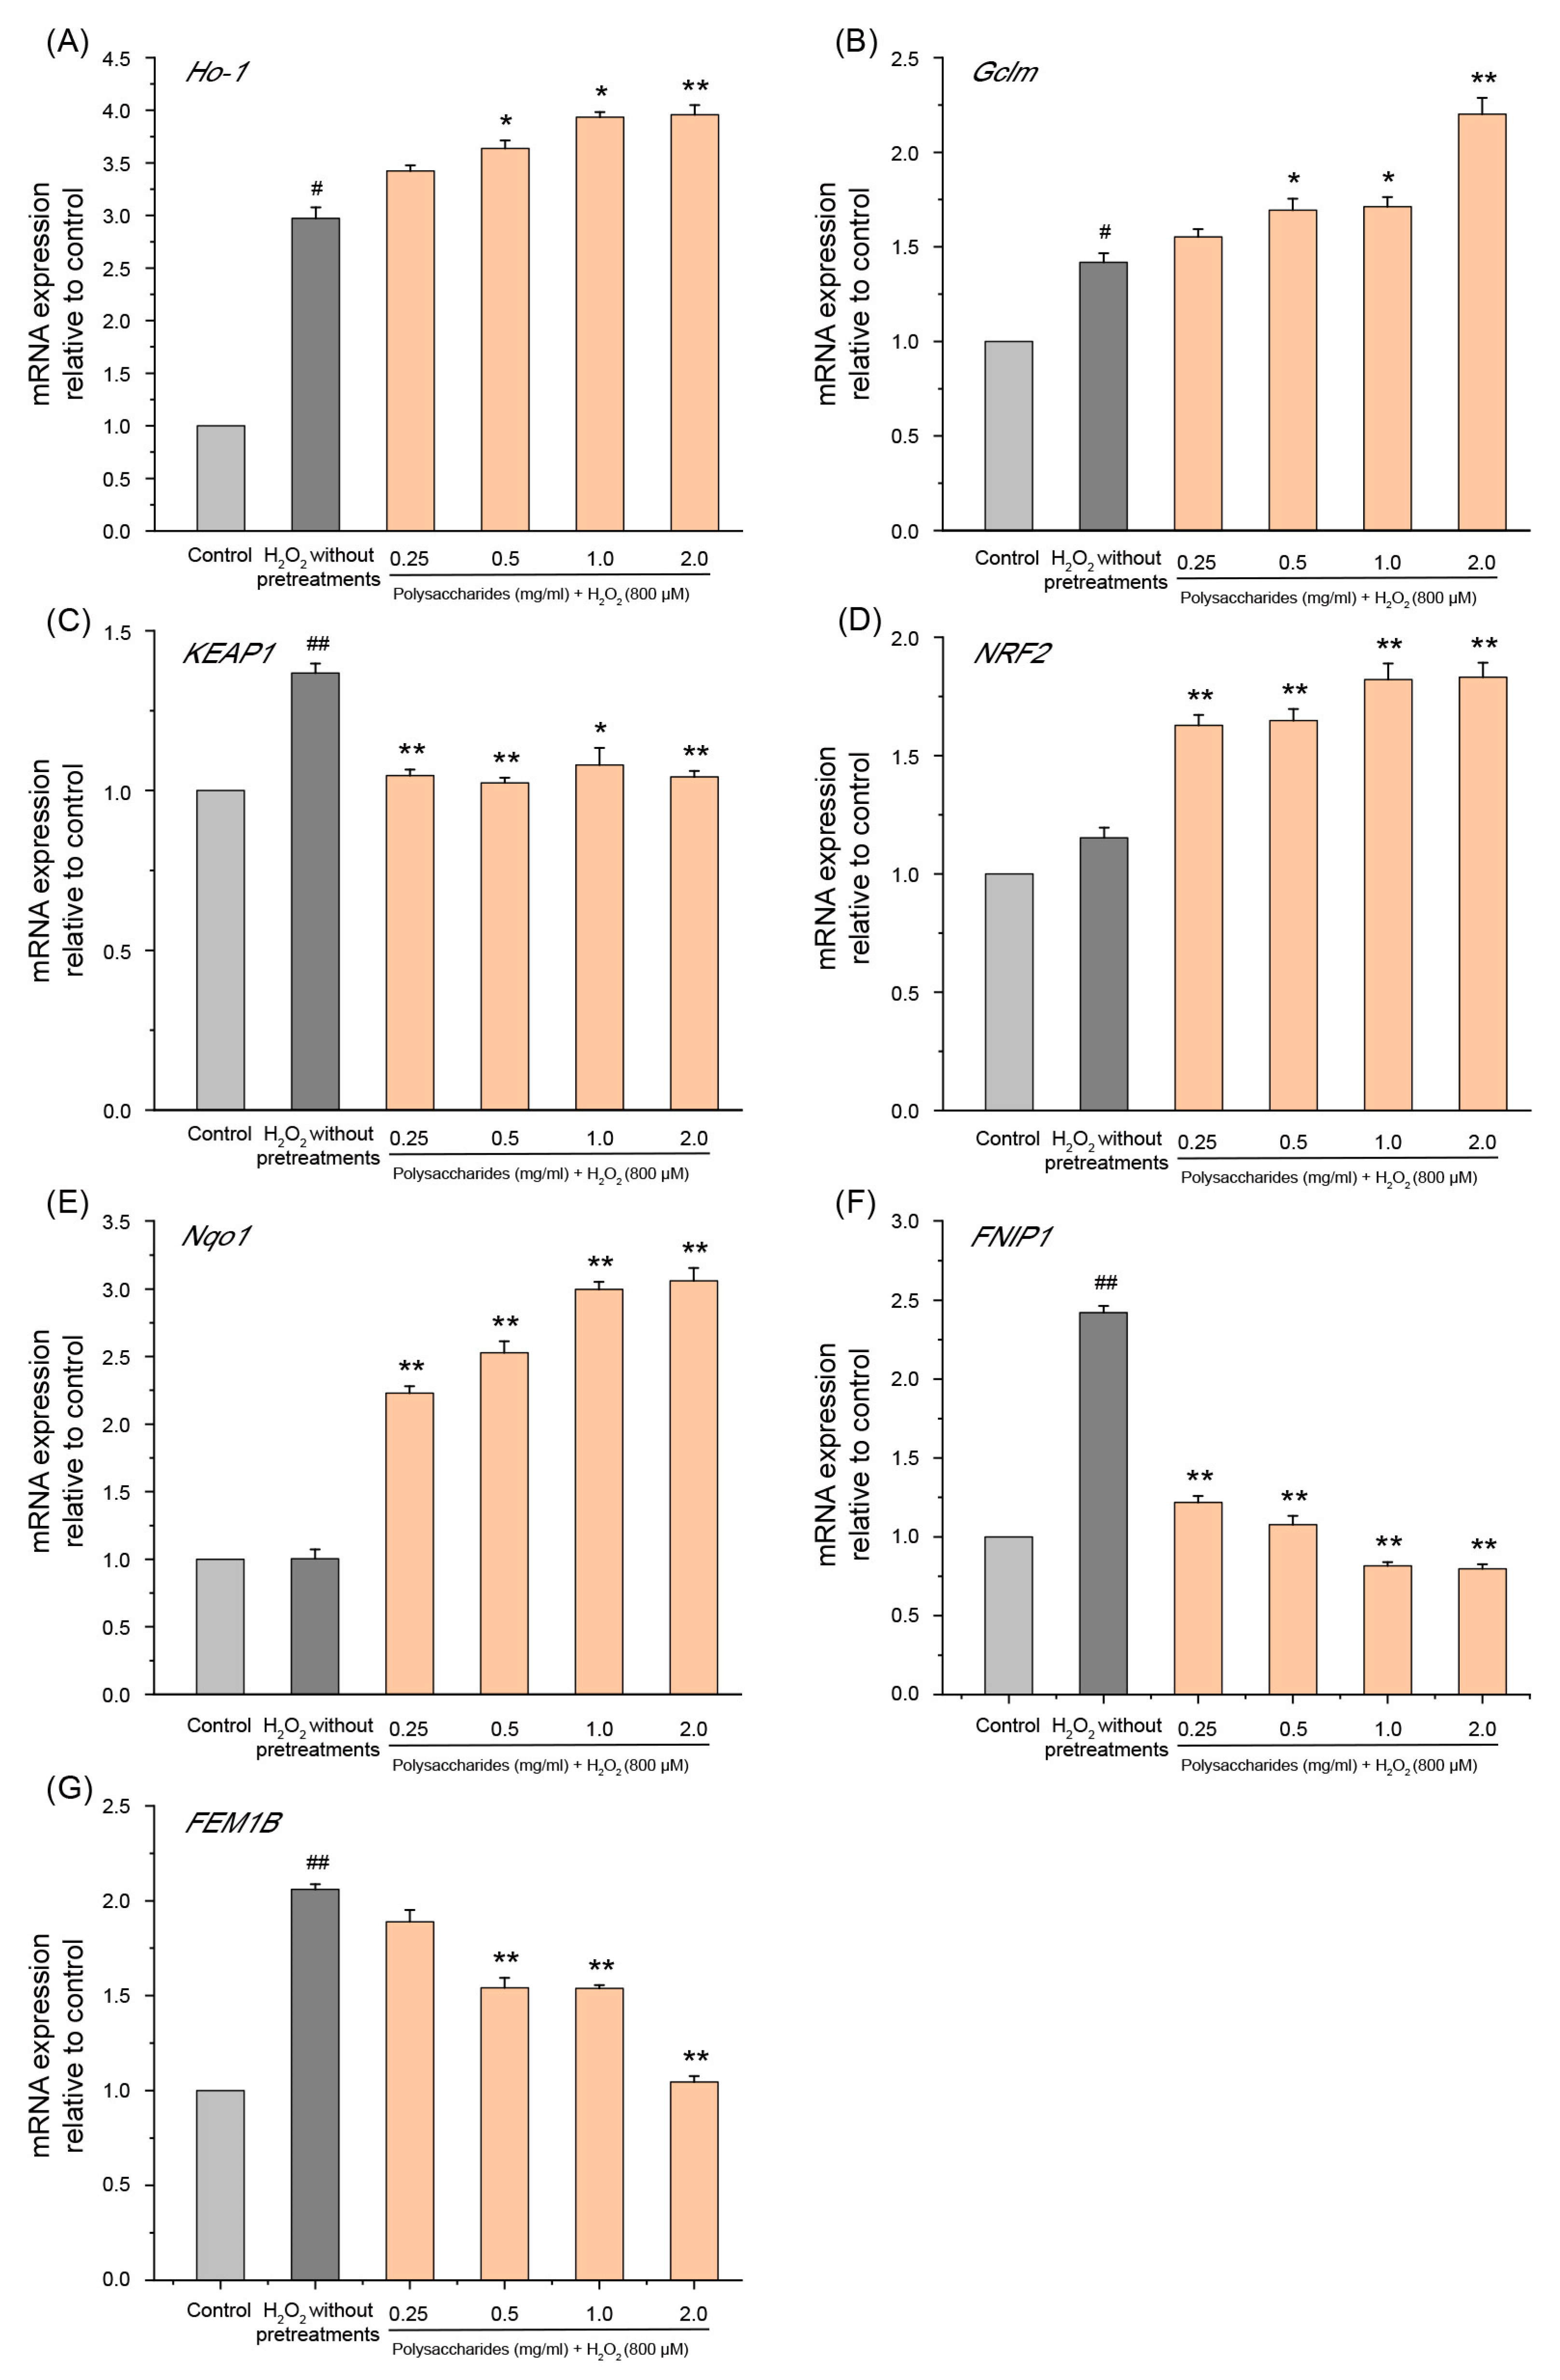
2.6.2. Effect of GSP-1a on mRNA Expression of NRF2 and FNIP1 Pathway

Nuclear factor erythroid 2-related factor 2 (NRF2) is a critical transcription factor protecting against oxidative stress by regulating the transcription of several antioxidant genes, such as heme oxygenase-1 (Ho-1), quinone oxidoreductase 1 (Nqo1), and glutamate-cysteine ligase modifier subunit (Gclm) [63,64,65]. Kelch-like ECH-associated protein-1 (KEAP1) is an inhibitor of NRF2 [66]. During oxidative stress, the NRF2 moiety from KEAP1 enters the nucleus to induce the expression of antioxidant genes [66]. In the current study, we found that the mRNA level of Ho-1, Gclm, and KEAP1 was enhanced during treatment with H2O2 (Figure 9A–C). This is consistent with previous reports that antioxidant genes are expressed at low levels in cells under non-stimulated conditions but are rapidly induced by oxidants, and this enhanced expression plays a vital role in cellular protection under oxidative stress [67,68]. GSP-1a significantly increased the mRNA expression of Ho-1, Gclm, Nqo1, and NRF2 in a concentration-dependent manner compared with cells treated with H2O2 without any pretreatment (Figure 9A–E). In addition, the pretreatment with GSP-1a reduced the mRNA expression of KEAP1, which contributes to alleviating the inhibitory effect of KEAP1 on NRF2. These results demonstrate that GSP-1a may activate the NRF2 pathway, upregulating downstream genes such as Ho-1, Gclm, and Nqo1, thereby protecting HepG2 cells from H2O2-induced oxidative stress. Additionally, Follicle-interacting protein 1 (FNIP1) and fem-1 homolog B (FEM1B) maintain mitochondrial redox homeostasis and are central components of the reductive stress response [69]. Recent studies have shown that the binding of FEM1B and FNIP1 proteins leads to the degradation of FNIP1, which activates ROS production in mitochondria in response to a reduction in ROS [70]. In this study, exposure to H2O2 led to a significant upregulation of mRNA levels for FNIP1 and FEM1B, aligning with the non-physiological production of ROS. However, GSP-1a downregulated the expression levels of FNIP1 and FEM1B in a concentration-dependent manner (Figure 9F,G), which may be due to the reduction in ROS production. Based on the above analysis, we propose that GSP-1a is likely to mitigate oxidative stress through the NRF2 and FNIP1 pathways.

3. Materials and Methods

3.1. Materials

O. gracilis fermentation spore powder was obtained from cultured Paraisaria dubia (anamorph of O. gracilis, CGMCC No. 20731, stored in China General Microbiological Culture Collection Center) according to the following methods. The strain was inoculated in the sporulation medium (glucose 20 g, yeast extract 30 g, KH2PO4 2 g, MgSO4·7H2O 1 g, ZnSO4·7H2O 6 g, H2O 1 L, pH 8) and cultured for 12 days at 20 °C and 120 rpm. After fermentation, a small number of mycelia pellets were separated from the fermentation broth containing spores via filtration through a 200 mesh press cloth. Then, the fermentation broth was centrifuged at 8000 rpm for 10 min and the pellet was collected to obtain spore powder. The collected spore powder was lyophilized. The preparation of O. gracilis fermentation spore is shown in Figure S2.
DEAE Sepharose fast flow and Superdex G-200 were purchased from GE Healthcare Life Science (Piscataway, NJ, USA). Monosaccharide standards, 3-methyl-1-phenyl-2-pyrazolin-5-one (PMP), 1,1-diphenyl-2-picrylhydrazyl (DPPH), 2,2′-azino-bis (3-ethylbenzothiazoline-6-sulphonic acid) (ABTS•+), and 3-(4,5-dimethylthiazol-2-yl)-2,5-diphenyltetrazolium bromide (MTT) were purchased from Sigma-Aldrich (Shanghai, China). Minimum essential medium (MEM), fetal bovine serum (FBS), and penicillin–streptomycin solution were obtained from KeyGEN Bio Tech (Nanjing, China). Alcohol, hydrogen peroxide (H2O2) solution, and dimethyl sulfoxide (DMSO) were obtained from Aladdin Industrial Corporation (Shanghai, China). ROS, MDA, SOD, and BCA protein concentration assay kits and cell lysis buffer for Western and IP were purchased from the Beyotime Institute of Biotechnology, Ltd. (Shanghai, China). HepG2 cells were purchased from Shanghai Cell Bank, Chinese Academy of Sciences (Shanghai, China).

3.2. Polysaccharides Extraction of O. gracilis Spores

3.2.1. Preparation of Crude Polysaccharides

The spores were defatted with hexane and thereafter extracted with 0.25 M NaOH solution (1:15, w/v) at 90 °C for 3 h. The above alkaline extracts were neutralized with acetic acid and then centrifuged at 8000× g for 10 min to obtain the supernatant. Polysaccharides in the supernatant were precipitated using 4 times the volume of 95% ethanol at 4 °C for 12 h, followed by centrifugation at 8000× g for 10 min to separate the precipitated polysaccharides, and then washed using ethanol. In addition, the precipitate was deproteinized three times with ethanol to obtain crude polysaccharides (GSP). The deproteinization method was conducted as described before [71,72], with minor modifications, as follows. The precipitated polysaccharides were redissolved in distilled water then centrifuged at 8000× g for 10 min to remove precipitated denatured proteins. The supernatant was retained and precipitated polysaccharides using 4 times the volume of 95% ethanol at 4 °C; then, it was centrifuged to obtain polysaccharides precipitate (8000× g, 10 min). The above deproteinization process was repeated three times, and the last time, the polysaccharides precipitate was dissolved in water and then freeze-dried to obtain GSPs in the form of a powder. The yield of crude polysaccharides was calculated via the following:
Y i e l d % , w / w = c r u d e   p o l y s a c c h a r i d e s   w e i g h t R a w   m a t e r i a l   w e i g h t × 100 .

3.2.2. Isolation and Purification of Polysaccharides

The deproteinized polysaccharides were dissolved in distilled water and centrifuged (8000 rpm, 10 min); subsequently, they were elutied in DEAE Sepharose fast flow column (26 mm × 300 mm). GSP was gradient-eluted with 0, 0.1, and 0.3 mol/L NaCl at a flow rate of 1 mL/min. After 5 min, each tube was collected via an automatic fraction collector (BSZ-100, Huxi, China). Among the fractions collected, two peaks were detected by the phenol sulfuric acid method (GSP-1, GSP-2). The eluent of the two fractions was collected separately and was dialyzed to remove sodium chloride, free protein, and small-molecular-weight polysaccharides. Thereafter, the eluent of the two fractions was lyophilized using a vacuum dryer (Biosafer-10A, Biosafer, Nanjing, China) to obtain the polysaccharides in the form of a powder. GSP-1 was further purified with a Superdex G-200 gel column (16 mm × 600 mm) at a flow rate of 0.2 mL/min. One tube was collected every 20 min. The main fraction (GSP-1a) was collected and eluted samples were freeze-dried. The yield of pure polysaccharide was calculated via the following:
Y i e l d % , w / w = F r a c t i o n s   w e i g h t C r u d e   p o l y s a c c h a r i d e s   w e i g h t × 100 .

3.3. Chemical Composition, UV Spectroscopy, and Molecular Weight Analysis

The phenol–sulfuric acid method was used to determine total sugar content with glucose as the standard. The protein content of GSP-1a was determined using a BCA protein concentration assay kit. Additionally, GSP-1a was dissolved in distilled water and subjected to UV–Visible spectroscopy in the range of 190–300 nm using a UV–Visible spectrometer (UV-T9, Persee, Beijing, China).
GSP-1a was dissolved in 0.1 M NaNO3 aqueous solution (0.02% NaN3, w/w) at a concentration of 1 mg/mL, and the solution was thereafter filtered through a 0.45 μm membrane. The molecular weight of GSP-1a was determined using high-performance gel permeation chromatography (HPGPC) with a binary HPLC pump (U3000, Thermo, Waltham, MA, USA) and a refractive index detector (Optilab T-rEX, Wyatt Technology, Co., St Milford, MA, USA). The polysaccharides solution was separated using three tandem columns (300 × 8 mm, Shodex OH-pak SB-805, 804, and 803; Showa Denko K.K., Tokyo, Japan) maintained at a temperature of 45 °C. The eluent employed for the separation was 0.1M NaNO3 containing 0.02% NaN3 (w/w). Each run involved injecting 100 μL of the sample at a flow rate of 0.5 mL/min.

3.4. Structural Characterization of GSP-1a

3.4.1. FT–IR Analysis

The polysaccharide sample was prepared by grinding KBr to determine using FT–IR (Nicolet iS20, Thermo Fisher Scientific, Waltham, MA, USA) with a spectral range of 4000 to 400 cm−1.

3.4.2. Monosaccharide Composition Analysis

The monosaccharide composition of GSP-1a was determined via high-performance anion-exchange chromatography (HPAEC). Briefly, 5 mg of the polysaccharide sample was hydrolyzed with 2 M trifluoroacetic acid (TFA) at 121 °C for 2 h in a sealed tube. The polysaccharide sample was dried with nitrogen then supplemented with methanol and blown dry to remove TFA. This process was repeated three times. The residue was re-dissolved in deionized water and filtered through 0.22 μm microporous filtering film for measurement. The processed sample was analyzed via high-performance anion-exchange chromatography (HPAEC) on a CarboPac PA-20 anion-exchange column (3 × 150 mm; Dionex, Sunnyvale, CA, USA) using a pulsed amperometric detector (Dionex ICS 5000 system, Thermo Fisher Scientific, Waltham, MA, USA) by Sanshu Biotech. Co., Ltd. (Shanghai, China). Flow rate, 0.5 mL/min; injection volume, 5 μL; solvent system A: (ddH2O), solvent system B: (0.1 M NaOH); solvent system C: (0.1 M NaOH, 0.2 M NaAc). The gradient program volume ratio of solution A, B, and C was 95:5:0 at 0 min, 85:5:10 at 26 min, 85:5:10 at 42 min, 60:0:40 at 42.1 min, 60:40:0 at 52 min, 95:5:0 at 52.1 min, and 95:5:0 at 60 min. Data were acquired on the ICS5000 (Thermo Fisher Scientific, Waltham, MA, USA) and processed using Chromeleon 7.2 CDS (Thermo Scientific, Waltham, MA, USA).

3.4.3. Methylation Analysis

The GSP-1a was methylated according to the Ciucanu method with minor modifications [73]. GSP-1a was dissolved in anhydrous dimethyl sulfoxide (DMSO) and methylated in DMSO/NaOH with CH3I several times. After complete methylation, the permethylated products were hydrolyzed with 2 mol/L TFA at 121 °C for 1.5 h, reduced by sodium borodeuteride (NaBH4), and acetylated with acetic anhydride for 2.5 h (100 °C). After evaporating with toluene, the resulting methylated derivatives were analyzed with GC-MS on an Agilent 6890A-5975C equipped with Agilent BPX70 chromatographic column (30 m × 0.25 mm × 0.25 µm, SGE Analytical Science, Melbourne, Australia), and high purity helium (split ratio 10:1) was used as the carrier gas with an injection volume of 1 μL. Mass spectrometry analysis was performed at the initial temperature of 140 °C for 2 min, and the temperature was increased to 230 °C by 3 °C/min for 3 min. The scan mode was SCAN with a range (m/z) from 30 to 600.

3.4.4. Nuclear Magnetic Resonance (NMR) Spectroscopy

The GSP-1a was dissolved in 0.5 mL D2O to a final concentration of 40 mg/mL. Recordings of 1D and 2D NMR (1H−NMR, 13C−NMR, 1H−1H COSY, 1H−1H NOESY, 1H−13C HMBC, and 1H−13C HSQC) were performed at 25 °C with a Bruker AVANCE NEO 500 M spectrometer system (Bruker, Rheinstetten, Germany), operating at 500 MHz, from Sanshu Biotech. Co., Ltd. (Shanghai, China).

3.5. Assay of Antioxidant Activity In Vitro

Hydroxyl radical (OH), 2,2′-azino-bis-3-ethylbenzothiazoline-6-sulfonic acid radical cation (ABTS•+) and 2-diphenyl-1-picrylhydrazyl radical (DPPH) scavenging ability of GSP-1a and GSP were measured to evaluate in vitro antioxidant activity. The OH, ABTS•+ and DPPH radical scavenging activity of polysaccharides were determined as described before [74,75,76]. Vc was used as the positive control.

3.6. Cellular Antioxidant Activity

3.6.1. Cell Culture

Human hepatocellular carcinoma cell line HepG2 was cultured in Dulbecco’s Modified Eagle’s Medium (DMEM, Gibco, Waltham, MA, USA), supplemented with 10% FBS, 100 units/mL penicillin, and 100 units/mL streptomycin at 37 °C in a humidified atmosphere with 5% CO2.

3.6.2. Oxidative Stress Model Induced by H2O2

In order to obtain stable experimental results, different concentrations (100, 200, 400, 600, 800, and 1000 μM) of H2O2 were treated in the HepG2 cells for 4 h to verify an appropriate concentration in the cell injury model. Cells without treatment were regarded as the control group. The cell viability was determined based on the MTT assay. We found that 800 μM H2O2 was sufficient to reduce the cell viability in HepG2 cells significantly.

3.6.3. Treatment of Cells and Cell Viability Assay

HepG2 cells (1 × 10⁴ cells/mL, 100 μL) were cultured in 96-well plates for 24 h and then treated with GSP-1a (0, 0.1, 0.2, 0.4, 0.8, 1, and 2 mg/mL) for 24 h to evaluate its toxicity. The cell viability was determined based on the MTT assay.
After HepG2 cells were cultured for 24 h, the cells treated with different methods were divided into four groups: (1) the sample group consisted of cells pretreated with different doses of GSP-1a (0.25, 0.5, 1, 2 mg/mL) for 24 h, followed by treatment with 800 μmol/L H2O2 for 4 h; (2) the positive group included cells pretreated with 0.1 mg/mL Vc for 24 h, followed by treatment with 800 μmol/L H2O2 for 4 h; (3) the control group included the normal cells; (4) the H2O2 without pretreatments group consisted of cells which were only treated with 800 μM H2O2 for 4 h. After the different treatments above, the cell viability was evaluated via MTT assays, as described by Li et al. [77]. Each wall was supplemented with 10 μL MTT (0.5 mg/mL) for 4 h in an incubator with 5% CO2 at 37 °C. Then, the supernatant was removed, and the formazan was dissolved in DMSO. The absorbance at 570 nm was measured via a microplate reader. Cell viability was calculated using the following formula:
T h e   c e l l   v i a b i l i t y % = A i A j × 100
where Ai is the absorbance of the treatment group, and Aj is the absorbance of the blank control group (without treatment).

3.6.4. Determination of ROS, MDA Content and SOD Activity

HepG2 cells were cultured in 6-well plates (1 × 10⁶ cells/mL, 2.5 mL) for 24 h then incubated with GSP-1a for 24 h followed by H2O2 (800 μM) for 6 h to determine ROS and MDA levels as well as the SOD activity.
The ROS level of the cells was determined using the hydrophilic probe 2′,7′-dichlorofluorescin diacetate (DCFH-DA). DCFH-DA permeates across the cell membrane and is de-esterified by cytosolic esterases to 2′,7′-dichlorodihydrofluorescein (DCFH), which is oxidized to 2′,7′-dichlorofluorescein (DCF) by ROS [36]. Oxidation is associated with an increase in green fluorescence. After completing the cell culture for the above four groups (control group, H2O2 without pretreatments group, sample group, positive group), they were washed in PBS buffer three times and then incubated with 1 mL of DCFH-DA probe (diluted by serum-free MEM culture medium with the final concentration of 10 μM) for 30 min (37 °C, 5%CO2). Subsequently, we removed the DCFH-DA solution, washed the cells three times with PBS buffer, and added 1 mL of PBS buffer to each well to keep the cells moist in preparation for measuring cell fluorescence intensity. Finally, the DCF fluorescence intensity was tested via a multi-detection microplate reader (Synergy, Biotek Instruments, Inc., Winooski, VT, USA) with an excitation wavelength of 488 nm and an emission wavelength of 525 nm. All these experiments were also performed in triplicate. The final statistical results were expressed as a percentage of the control group. In addition, HepG2 cells in the four groups were observed via inverted fluorescence microscope (Olympus-IX73P2F, Tokyo, Japan).
The MDA content was measured using a kit according to the manufacturer’s protocol. Cells were washed three times with PBS buffer and lysed with Western and IP cell lysis buffer. The supernatant was then collected via centrifuging at 4 °C, 12,000× g for 5 min. MDA was determined using the thiobarbituric acid-reactive substances (MDA-TBA adduct). Samples (0.1mL) were treated with TBA reagent (6.32 mM TBA, 0.2mL) and then heated at 100 °C for 15 min. Subsequently, we centrifuged the reaction mixture, took 200 µL of the supernatant into a 96-well plate, and measured the absorbance at 532nm. The results are expressed in terms of protein content per unit weight (µmol/mg protein).
The intracellular SOD activity was determined using a total SOD assay kit with WST-8, according to the manufacturer’s instructions. Cells were washed three times with PBS buffer and lysed with Western and IP cell lysis buffer. The supernatant was then collected via centrifuging at 4 °C, 12,000× g, for 5 min. We mixed the SOD detection buffer, WST-8 solution, and enzyme solution in proportion to prepare the WST-8/enzyme working solution and added 160 μL to each well of a 96-well plate. The sample group was supplemented with 20 μL sample solution and 20 μL reaction initiation solution, blank control hole 1 was supplemented with 20 μL SOD detection buffer and 20 μL reaction initiation solution, the blank control hole 2 was supplemented with 40 μL SOD detection buffer, while the blank control hole 3 was supplemented with 20 μL SOD detection buffer and 20 μL samples. Next, the solution was incubated at 37 °C for 30 min, and absorbance at 450 nm was measured. We calculated enzyme activity (U/mg protein) based on the protein content of the sample.
The concentration of protein was also measured via a BCA protein assay kit according to the manufacturer’s protocols. The absorbance was determined by the microplate reader (Biotek Synergy, Winooski, VT, USA). All these experiments were also performed in triplicate.

3.6.5. Total RNA Extraction and qRT-PCR

The total RNA of the control, H2O2 model, and sample group cells were extracted via Trizol Kit according to the manufacturer’s instructions. Total RNA was reverse transcribed into cDNA with HiScript II Q RT SuperMix. Real-time quantitative polymerase chain reaction (qPCR) was performed on QuantStudio 3 (Thermo Fisher Scientific, Waltham, MA, USA) by using SYBR Green master mix, with each sample prepared in triplicate. The above kits and reagents were purchased from Vazyme Biotech Co., Ltd., Nanjing, China. The primer sequences were shown in Table S1, and GAPDH was used as a reference gene. The relative expression level of the mRNAs was calculated using the 2−ΔΔCT method.

3.7. Statistical Analysis

The data from three independent experiments are presented as means ± SD. The GraphPad Prism 8.0 (GraphPad Software, Inc., San Diego, CA, USA) was used to conduct one-way ANOVA tests for inter-group comparison. p < 0.05 and p < 0.01 were considered statistically significant.

4. Conclusions

In this study, we isolated a neutral heteropolysaccharide, GSP-1a (72.8 kDa), from O. gracilis spores, which mainly consisted of mannose, galactose, and glucose. GSP-1a was composed of α-D-Galp-(1→, →6)-α-D-Manp-(1→, →2,6)-α-D-Manp-(1→, →6)-α-D-Glcp-(1→, →3,6)-α-D-Glcp-(1→ and →2,4,6)-α-D-Manp-(1→ residues, and its partial hypothetical model structure was inferred. Furthermore, GSP-1a exhibits protective effects against H2O2-induced oxidative stress in HepG2 cells. This protective mechanism involved the regulation of the NRF2 and FNIP1 pathways. These findings highlight the antioxidant activity of polysaccharides derived from O. gracilis fermentation spores.

Supplementary Materials

The following supporting information can be downloaded at: https://www.mdpi.com/article/10.3390/ijms241914721/s1.

Author Contributions

Y.W.: Writing—original draft preparation, Investigation, Data curation. S.W.: Investigation, Methodology. H.L.: Investigation, Visualization. L.T.: Formal analysis, Software. L.Y.: Validation, Formal analysis. B.R.: Software, Methodology, Writing—review and editing. D.G.: Conceptualization, Supervision, Writing—review and editing. H.H.: Conceptualization, Supervision, Writing—review and editing. All authors have read and agreed to the published version of the manuscript.

Funding

This work was financially supported by the National Key Research and Development Program of China (No. 2021YFC2103200), the Natural Science Foundation of Jiangsu Province of China (No. BK20220372), and the Natural Science Foundation of the Jiangsu Higher Education Institutions of China (No. 22KJB550011).

Institutional Review Board Statement

Not applicable.

Informed Consent Statement

Not applicable.

Data Availability Statement

The data presented in this study are available in the article.

Conflicts of Interest

The authors declare that they have no known competing financial interests or personal relationshipss that could have appeared to influence the work reported in this paper.

References

  1. Kaushik, V.; Singh, A.; Arya, A.; Sindhu, S.C.; Sindhu, A.; Singh, A. Enhanced production of cordycepin in Ophiocordyceps sinensis using growth supplements under submerged conditions. Biotechnol. Rep. 2020, 28, e00557. [Google Scholar] [CrossRef] [PubMed]
  2. Zhao, J.; Xie, J.; Wang, L.Y.; Li, S.P. Advanced development in chemical analysis of Cordyceps. J. Pharm. Biomed. Anal. 2014, 87, 271–289. [Google Scholar] [CrossRef]
  3. Li, L.F.; But, G.W.C.; Zhang, Q.W.; Liu, M.; Chen, M.M.; Wen, X.; Wu, H.Y.; Cheng, H.Y.; Puno, P.T.; Zhang, J.X.; et al. A specific and bioactive polysaccharide marker for Cordyceps. Carbohydr. Polym. 2021, 269, 118343. [Google Scholar] [CrossRef]
  4. Perez-Villamares, J.C.; Burrola-Aguilar, C.; Aguilar-Miguel, X.; Sanjuan, T.; Jimenez-Sanchez, E. New records of entomopathogenous fungi of the genus Cordyceps s. l. (Ascomycota: Hypocreales) from the State of Mexico. Rev. Mex. Biodivers. 2017, 88, 773–783. [Google Scholar] [CrossRef]
  5. Tong, L.L.; Wang, Y.; Yuan, L.; Liu, M.Z.; Du, Y.H.; Mu, X.Y.; Yang, Q.H.; Wei, S.X.; Li, J.Y.; Wang, M.A.; et al. Enhancement of polysaccharides production using microparticle enhanced technology by Paraisaria dubia. Microb. Cell Factories 2022, 21, 12. [Google Scholar] [CrossRef]
  6. Tong, L.L.; Wang, Y.; Du, Y.H.; Yuan, L.; Liu, M.Z.; Mu, X.Y.; Chen, Z.L.; Zhang, Y.D.; He, S.J.; Li, X.J.; et al. Transcriptomic Analysis of Morphology Regulatory Mechanisms of Microparticles to Paraisaria dubia in Submerged Fermentation. Appl. Biochem. Biotechnol. 2022, 194, 4333–4347. [Google Scholar] [CrossRef]
  7. Yue, G.G.L.; Lau, C.B.S.; Fung, K.P.; Leung, P.C.; Ko, W.H. Effects of Cordyceps sinensis, Cordyceps militaris and their isolated compounds on ion transport in Calu-3 human airway epithelial cells. J. Ethnopharmacol. 2008, 117, 92–101. [Google Scholar] [CrossRef]
  8. Das, S.K.; Masuda, M.; Sakurai, A.; Sakakibara, M. Medicinal uses of the mushroom Cordyceps militaris: Current state and prospects. Fitoterapia 2010, 81, 961–968. [Google Scholar] [CrossRef]
  9. Chiu, C.P.; Liu, S.C.; Tang, C.H.; Chan, Y.; El-Shazly, M.; Lee, C.L.; Du, Y.C.; Wu, T.Y.; Chang, F.R.; Wu, Y.C. Anti-inflammatory Cerebrosides from Cultivated Cordyceps militaris. J. Agric. Food Chem. 2016, 64, 1540–1548. [Google Scholar] [CrossRef] [PubMed]
  10. Zhang, J.X.; Wen, C.T.; Duan, Y.Q.; Zhang, H.H.; Ma, H.L. Advance in Cordyceps militaris (Linn) Link polysaccharides: Isolation, structure, and bioactivities: A review. Int. J. Biol. Macromol. 2019, 132, 906–914. [Google Scholar] [CrossRef] [PubMed]
  11. Jing, Y.S.; Cui, X.L.; Chen, Z.Y.; Huang, L.J.; Song, L.Y.; Liu, T.; Lv, W.J.; Yu, R.M. Elucidation and biological activities of a new polysaccharide from cultured Cordyceps militaris. Carbohydr. Polym. 2014, 102, 288–296. [Google Scholar] [CrossRef] [PubMed]
  12. Zhu, Y.L.; Yu, X.F.; Ge, Q.; Li, J.; Wang, D.J.; Wei, Y.; Ouyang, Z. Antioxidant and anti-aging activities of polysaccharides from Cordyceps cicadae. Int. J. Biol. Macromol. 2020, 157, 394–400. [Google Scholar] [CrossRef] [PubMed]
  13. Zhang, Y.; Zeng, Y.; Cui, Y.S.; Liu, H.M.; Dong, C.X.; Sun, Y.X. Structural characterization, antioxidant and immunomodulatory activities of a neutral polysaccharide from Cordyceps militaris cultivated on hull-less barley. Carbohydr. Polym. 2020, 235, 115969. [Google Scholar] [CrossRef] [PubMed]
  14. Yang, S.L.; Yang, X.; Zhang, H. Extracellular polysaccharide biosynthesis in Cordyceps. Crit. Rev. Microbiol. 2020, 46, 359–380. [Google Scholar] [CrossRef] [PubMed]
  15. Sugamura, K.; Keaney, J.F. Reactive oxygen species in cardiovascular disease. Free Radic. Biol. Med. 2011, 51, 978–992. [Google Scholar] [CrossRef]
  16. Wen, X.; Wu, J.M.; Wang, F.T.; Liu, B.; Huang, C.H.; Wei, Y.Q. Deconvoluting the role of reactive oxygen species and autophagy in human diseases. Free Radic. Biol. Med. 2013, 65, 402–410. [Google Scholar] [CrossRef]
  17. Milisav, I.; Ribaric, S.; Poljsak, B. Antioxidant Vitamins and Ageing. Subcell. Biochem. 2018, 90, 1–23. [Google Scholar] [CrossRef]
  18. Wu, D.T.; Lv, G.P.; Zheng, J.; Li, Q.; Ma, S.C.; Li, S.P.; Zhao, J. Cordyceps collected from Bhutan, an appropriate alternative of Cordyceps sinensis. Sci. Rep. 2016, 6, 37668. [Google Scholar] [CrossRef]
  19. Wang, L.Y.; Cheong, K.L.; Wu, D.T.; Meng, L.Z.; Zhao, J.; Li, S.P. Fermentation optimization for the production of bioactive polysaccharides from Cordyceps sinensis fungus UM01. Int. J. Biol. Macromol. 2015, 79, 180–185. [Google Scholar] [CrossRef]
  20. Zhao, S.; Rong, C.B.; Gao, Y.; Wu, L.F.; Luo, X.H.; Song, S.; Liu, Y.; Wong, J.H.; Wang, H.X.; Yi, L.T.; et al. Antidepressant-like effect of Ganoderma lucidum spore polysaccharide-peptide mediated by upregulation of prefrontal cortex brain-derived neurotrophic factor. Appl. Microbiol. Biotechnol. 2021, 105, 8675–8688. [Google Scholar] [CrossRef]
  21. Wen, L.R.; Sheng, Z.L.; Wang, J.P.; Jiang, Y.M.; Yang, B. Structure of water-soluble polysaccharides in spore of Ganoderma lucidum and their anti-inflammatory activity. Food Chem. 2022, 373, 131374. [Google Scholar] [CrossRef] [PubMed]
  22. Zheng, Y.; Li, S.Y.; Li, C.; Shao, Y.; Chen, A.H. Polysaccharides from Spores of Cordyceps cicadae Protect against Cyclophosphamide-Induced Immunosuppression and Oxidative Stress in Mice. Foods 2022, 11, 515. [Google Scholar] [CrossRef]
  23. Wang, Y.N.; Zeng, T.T.; Li, H.; Wang, Y.D.; Wang, J.H.; Yuan, H.B. Structural Characterization and Hypoglycemic Function of Polysaccharides from Cordyceps cicadae. Molecules 2023, 28, 526. [Google Scholar] [CrossRef] [PubMed]
  24. Wang, Y.; Tong, L.L.; Yuan, L.; Liu, M.Z.; Du, Y.H.; Yang, L.H.; Ren, B.; Guo, D.S. Integration of Physiological, Transcriptomic and Metabolomic Reveals Molecular Mechanism of Paraisaria dubia Response to Zn2+ Stress. J. Fungi 2023, 9, 693. [Google Scholar] [CrossRef] [PubMed]
  25. Ren, B.; Wei, S.; Huang, H. Recent advances in Grifola frondosa polysaccharides: Production, properties, and bioactivities. Curr. Opin. Food Sci. 2022, 49, 100946. [Google Scholar] [CrossRef]
  26. Li, Y.M.; Zhong, R.F.; Chen, J.; Luo, Z.G. Structural characterization, anticancer, hypoglycemia and immune activities of polysaccharides from Russula virescens. Int. J. Biol. Macromol. 2021, 184, 380–392. [Google Scholar] [CrossRef]
  27. Chen, Y.; Wang, T.; Zhang, X.; Zhang, F.M.; Linhardt, R.J. Structural and immunological studies on the polysaccharide from spores of a medicinal entomogenous fungus Paecilomyces cicadae. Carbohydr. Polym. 2021, 254, 117462. [Google Scholar] [CrossRef]
  28. Li, F.; Wei, Y.L.; Liang, L.; Huang, L.L.; Yu, G.Y.; Li, Q.H. A novel low-molecular-mass pumpkin polysaccharide: Structural characterization, antioxidant activity, and hypoglycemic potential. Carbohydr. Polym. 2021, 251, 117090. [Google Scholar] [CrossRef]
  29. Wang, S.N.; Zhao, L.L.; Li, Q.H.; Liu, C.; Han, J.L.; Zhu, L.J.; Zhu, D.S.; He, Y.T.; Liu, H. Rheological properties and chain conformation of soy hull water-soluble polysaccharide fractions obtained by gradient alcohol precipitation. Food Hydrocolloid 2019, 91, 34–39. [Google Scholar] [CrossRef]
  30. Mateos-Aparicio, I.; Mateos-Peinado, C.; Jimenez-Escrig, A.; Ruperez, P. Multifunctional antioxidant activity of polysaccharide fractions from the soybean byproduct okara. Carbohydr. Polym. 2010, 82, 245–250. [Google Scholar] [CrossRef]
  31. Li, F.S.; Hu, X.; Qin, L.Y.; Li, H.S.; Yang, Y.; Zhang, X.L.; Lu, J.R.; Li, Y.M.; Bao, M.T. Characterization and protective effect against ultraviolet radiation of a novel exopolysaccharide from Bacillus marcorestinctum QDR3-1. Int. J. Biol. Macromol. 2022, 221, 1373–1383. [Google Scholar] [CrossRef] [PubMed]
  32. Liang, Z.H.; Yin, Z.H.; Liu, X.P.; Ma, C.Y.; Wang, J.M.; Zhang, Y.; Kang, W.Y. A glucomannogalactan from Pleurotus geesteranus: Structural characterization, chain conformation and immunological effect. Carbohydr. Polym. 2022, 287, 119346. [Google Scholar] [CrossRef] [PubMed]
  33. Yang, Y.M.; Qiu, Z.C.; Li, L.Y.; Vidyarthi, S.K.; Zheng, Z.J.; Zhang, R.T. Structural characterization and antioxidant activities of one neutral polysaccharide and three acid polysaccharides from Ziziphus jujuba cv. Hamidazao: A comparison. Carbohydr. Polym. 2021, 261, 117879. [Google Scholar] [CrossRef] [PubMed]
  34. Liang, Z.H.; Song, M.M.; Yin, Z.H.; Wang, G.S.; Wang, J.M.; Liu, L.J.; Kang, W.Y. Structural characterization and anticoagulant activity of homogalacturonan from durian peel. J. Mol. Struct. 2022, 1248, 131467. [Google Scholar] [CrossRef]
  35. Tian, J.J.; Zhang, C.P.; Wang, X.M.; Rui, X.; Zhang, Q.Q.; Chen, X.H.; Dong, M.S.; Li, W. Structural characterization and immunomodulatory activity of intracellular polysaccharide from the mycelium of Paecilomyces cicadae TJJ1213. Food Res. Int. 2021, 147, 110515. [Google Scholar] [CrossRef]
  36. Liu, Z.J.; Jiao, Y.C.; Lu, H.Y.; Shu, X.L.; Chen, Q.H. Chemical characterization, antioxidant properties and anticancer activity of exopolysaccharides from Floccularia luteovirens. Carbohydr. Polym. 2020, 229, 115432. [Google Scholar] [CrossRef]
  37. Huo, J.Y.; Wu, J.H.; Huang, M.Q.; Zhao, M.M.; Sun, W.Z.; Sun, X.T.; Zheng, F.P. Structural characterization and immuno-stimulating activities of a novel polysaccharide from Huangshui, a byproduct of Chinese Baijiu. Food Res. Int. 2020, 136, 109493. [Google Scholar] [CrossRef]
  38. Hu, J.H.; Yao, W.Z.; Chang, S.Y.; You, L.J.; Zhao, M.M.; Cheung, P.C.K.; Hileuskaya, K. Structural characterization and anti-photoaging activity of a polysaccharide from Sargassum fusiforme. Food Res. Int. 2022, 157, 111267. [Google Scholar] [CrossRef]
  39. Shi, Q.; Yan, J.Y.; Jiang, B.; Chi, X.J.; Wang, J.H.; Liang, X.M.; Ai, X.J. A general strategy for the structural determination of carbohydrates by multi-dimensional NMR spectroscopies. Carbohydr. Polym. 2021, 267, 118218. [Google Scholar] [CrossRef]
  40. Wang, Y.D.; Han, W.W.; Song, L.L.; Zhao, X. Compositional analysis and structural characterization of raffinose family oligosaccharides from Eupatorium. J. Food Compos. Anal. 2019, 84, 103298. [Google Scholar] [CrossRef]
  41. Tang, N.Y.; Wang, X.M.; Yang, R.; Liu, Z.M.; Liu, Y.X.; Tian, J.J.; Xiao, L.Y.; Li, W. Extraction, isolation, structural characterization and prebiotic activity of cell wall polysaccharide from Kluyveromyces marxianus. Carbohydr. Polym. 2022, 289, 119457. [Google Scholar] [CrossRef] [PubMed]
  42. Yuan, Q.X.; Zhao, L.Y.; Li, Z.H.; Harqin, C.; Peng, Y.F.; Liu, J.K. Physicochemical analysis, structural elucidation and bioactivities of a high-molecular-weight polysaccharide from Phellinus igniarius mycelia. Int. J. Biol. Macromol. 2018, 120, 1855–1864. [Google Scholar] [CrossRef] [PubMed]
  43. Wang, Y.F.; Hou, G.H.; Li, J.L.; Surhio, M.M.; Ye, M. Structure characterization, modification through carboxymethylation and sulfation, and in vitro antioxidant and hypoglycemic activities of a polysaccharide from Lachnum sp. Process Biochem. 2018, 72, 177–187. [Google Scholar] [CrossRef]
  44. Huo, J.Y.; Wu, J.H.; Zhao, M.M.; Sun, W.Z.; Sun, J.Y.; Li, H.H.; Huang, M.Q. Immunomodulatory activity of a novel polysaccharide extracted from Huangshui on THP-1 cells through NO production and increased IL-6 and TNF-alpha expression. Food Chem. 2020, 330, 127257. [Google Scholar] [CrossRef] [PubMed]
  45. Xiao-Jun, L.; Wan-Rong, B.; Chung-Hang, L.; Dik-Lung, M.; Ge, Z.; Ai-Ping, L.; Shun-Chun, W.; Quan-Bin, H.J.M. Chemical Structure and Immunomodulating Activities of an α-Glucan Purified from Lobelia chinensis Lour. Molecules 2016, 21, 779. [Google Scholar] [CrossRef]
  46. Feng, Y.Q.; Qiu, Y.J.; Duan, Y.Q.; He, Y.Q.; Xiang, H.; Sun, W.X.; Zhang, H.H.; Ma, H.L. Characterization, antioxidant, antineoplastic and immune activities of selenium modified Sagittaria sagittifolia L. polysaccharides. Food Res. Int. 2022, 153, 110913. [Google Scholar] [CrossRef]
  47. Gong, P.; Guo, Y.X.; Chen, X.F.; Cui, D.D.; Wang, M.R.; Yang, W.J.; Chen, F.X. Structural Characteristics, Antioxidant and Hypoglycemic Activities of Polysaccharide from Siraitia grosvenorii. Molecules 2022, 27, 4192. [Google Scholar] [CrossRef]
  48. Bai, L.; Xu, D.; Zhou, Y.M.; Zhang, Y.B.; Zhang, H.; Chen, Y.B.; Cui, Y.L. Antioxidant Activities of Natural Polysaccharides and Their Derivatives for Biomedical and Medicinal Applications. Antioxidants 2022, 11, 2491. [Google Scholar] [CrossRef]
  49. Qian, L.; Liu, H.; Li, T.; Liu, Y.H.; Zhang, Z.J.; Zhang, Y.N. Purification, characterization and in vitro antioxidant activity of a polysaccharide AAP-3-1 from Auricularia auricula. Int. J. Biol. Macromol. 2020, 162, 1453–1464. [Google Scholar] [CrossRef]
  50. Zhu, Z.Y.; Song, X.Y.; Jiang, Y.Z.; Yao, J.R.; Jiang, Y.; Li, Z.; Dai, F. Chemical structure and antioxidant activity of a neutral polysaccharide from Asteris Radix et Rhizoma. Carbohydr. Polym. 2022, 286, 119309. [Google Scholar] [CrossRef]
  51. Wang, S.Q.; Li, G.; Zhang, X.F.; Wang, Y.Q.; Qiang, Y.; Wang, B.L.; Zou, J.B.; Niu, J.F.; Wang, Z.Z. Structural characterization and antioxidant activity of Polygonatum sibiricum polysaccharides. Carbohydr. Polym. 2022, 291, 119524. [Google Scholar] [CrossRef] [PubMed]
  52. Fan, L.P.; Li, J.W.; Deng, K.Q.; Ai, L.Z. Effects of drying methods on the antioxidant activities of polysaccharides extracted from Ganoderma lucidum. Carbohydr. Polym. 2012, 87, 1849–1854. [Google Scholar] [CrossRef]
  53. Wang, J.; Nie, S.; Kan, L.; Chen, H.; Cui, S.W.; Phillips, A.O.; Phillips, G.O.; Xie, M. Comparison of structural features and antioxidant activity of polysaccharides from natural and cultured Cordyceps sinensis. Food Sci. Biotechnol. 2017, 26, 55–62. [Google Scholar] [CrossRef] [PubMed]
  54. Meng, L.; Sun, S.; Li, R.; Shen, Z.; Wang, P.; Jiang, X. Antioxidant activity of polysaccharides produced by Hirsutella sp. and relation with their chemical characteristics. Carbohydr. Polym. 2015, 117, 452–457. [Google Scholar] [CrossRef] [PubMed]
  55. Tang, Z.; Lin, W.; Chen, Y.; Feng, S.; Qin, Y.; Xiao, Y.; Chen, H.; Liu, Y.; Chen, H.; Bu, T.; et al. Extraction, Purification, Physicochemical Properties, and Activity of a New Polysaccharide From Cordyceps cicadae. Front. Nutr. 2022, 9, 911310. [Google Scholar] [CrossRef] [PubMed]
  56. Yan, J.; Zhu, L.; Qu, Y.; Qu, X.; Mu, M.; Zhang, M.; Muneer, G.; Zhou, Y.; Sun, L. Analyses of active antioxidant polysaccharides from four edible mushrooms. Int. J. Biol. Macromol. 2019, 123, 945–956. [Google Scholar] [CrossRef]
  57. Li, G.Q.; Chen, P.F.; Zhao, Y.T.; Zeng, Q.H.; Ou, S.Y.; Zhang, Y.H.; Wang, P.C.; Chen, N.H.; Ou, J.Y. Isolation, structural characterization and anti-oxidant activity of a novel polysaccharide from garlic bolt. Carbohydr. Polym. 2021, 267, 118194. [Google Scholar] [CrossRef]
  58. Alia, M.; Ramos, S.; Mateos, R.; Bravo, L.; Goya, L. Response of the antioxidant Defense system to tert-butyl hydroperoxide and hydrogen peroxide in a human hepatoma cell line (HepG2). J. Biochem. Mol. Toxicol. 2005, 19, 119–128. [Google Scholar] [CrossRef]
  59. Guzman, T.J.; Dufer, M.; Wiedemann, M.; Olguin-Alor, R.; Soldevila, G.; Gurrola-Diaz, C.M. Lupin gamma-conglutin protects against cell death induced by oxidative stress and lipotoxicity, but transiently inhibits in vitro insulin secretion by increasing K-ATP channel currents. Int. J. Biol. Macromol. 2021, 187, 76–90. [Google Scholar] [CrossRef]
  60. Sun, S.Q.; Zhang, C.X.; Gao, J.H.; Qin, Q.Y.; Zhang, Y.Y.; Zhu, H.; Yang, X.J.; Yang, D.R.; Yan, H.T. Benzoquinone induces ROS-dependent mitochondria-mediated apoptosis in HL-60 cells. Toxicol. Ind. Health 2018, 34, 270–281. [Google Scholar] [CrossRef]
  61. Wu, J.H.; Huo, J.Y.; Huang, M.Q.; Zhao, M.M.; Luo, X.L.; Sun, B.G. Structural Characterization of a Tetrapeptide from Sesame Flavor-Type Baijiu and Its Preventive Effects against AAPH-Induced Oxidative Stress in HepG2 Cells. J. Agric. Food Chem. 2017, 65, 10495–10504. [Google Scholar] [CrossRef] [PubMed]
  62. Wang, F.X.; Liu, Q.; Wang, W.; Li, X.B.; Zhang, J. A polysaccharide isolated from Cynomorium songaricum Rupr. protects PC12 cells against H2O2-induced injury. Int. J. Biol. Macromol. 2016, 87, 222–228. [Google Scholar] [CrossRef] [PubMed]
  63. de Vries, H.E.; Witte, M.; Hondius, D.; Rozermuller, A.J.M.; Drukarch, B.; Hoozemans, J.; van Horssen, J. Nrf2-induced antioxidant Protection: A Promising target to counteract ROS-mediated damage in neurodegenerative disease? Free Radic. Biol. Med. 2008, 45, 1375–1383. [Google Scholar] [CrossRef] [PubMed]
  64. Cui, W.; Leng, B.; Wang, G. Pharmacology, Klotho protein inhibits H2O2-induced oxidative injury in endothelial cells via regulation of PI3K/AKT/Nrf2/HO-1 pathways. Can. J. Physiol. Pharmacol. 2019, 97, 370–376. [Google Scholar] [CrossRef] [PubMed]
  65. Zhao, Y.; Sun, Y.; Wang, G.; Ge, S.; Liu, H.J.O.M.; Longevity, C. Dendrobium officinale polysaccharides protect against MNNG-induced PLGC in rats via activating the NRF2 and antioxidant enzymes HO-1 and NQO-1. Oxid. Med. Cell. Longev. 2019, 2019, 9310245. [Google Scholar] [CrossRef] [PubMed]
  66. Jaramillo, M.C.; Zhang, D.D. The emerging role of the Nrf2-Keap1 signaling pathway in cancer. Genes Dev. 2013, 27, 2179–2191. [Google Scholar] [CrossRef]
  67. Sugimoto, M.; Ko, R.S.; Goshima, H.; Koike, A.; Shibano, M.; Fujimori, K. Formononetin attenuates H2O2-induced cell death through decreasing ROS level by PI3K/Akt-Nrf2-activated antioxidant gene expression and suppressing MAPK-regulated apoptosis in neuronal SH-SY5Y cells. Neurotoxicology 2021, 85, 186–200. [Google Scholar] [CrossRef]
  68. Garrido-Pascual, P.; Alonso-Varona, A.; Castro, B.; Burón, M.; Palomares, T. H2O2-preconditioned human adipose-derived stem cells (HC016) increase their resistance to oxidative stress by overexpressing Nrf2 and bioenergetic adaptation. Stem Cell Res. Ther. 2020, 11, 335. [Google Scholar] [CrossRef]
  69. Henning, N.J.; Manford, A.G.; Spradlin, J.N.; Brittain, S.M.; Zhang, E.; McKenna, J.M.; Tallarico, J.A.; Schirle, M.; Rape, M.; Nomura, D.K. Discovery of a covalent FEM1B recruiter for targeted protein degradation applications. J. Am. Chem. Soc. 2022, 144, 701–708. [Google Scholar] [CrossRef]
  70. Manford, A.G.; Rodriguez-Perez, F.; Shih, K.Y.; Shi, Z.; Berdan, C.A.; Choe, M.Y.; Titov, D.V.; Nomura, D.K.; Rape, M. A Cellular Mechanism to Detect and Alleviate Reductive Stress. Cell 2020, 183, 46–61. [Google Scholar] [CrossRef]
  71. Dai, H.; Han, X.Q.; Gong, F.Y.; Dong, H.; Tu, P.F.; Gao, X.M. Structure elucidation and immunological function analysis of a novel β-glucan from the fruit bodies of Polyporus umbellatus (Pers.) Fries. Glycobiology 2012, 22, 1673–1683. [Google Scholar] [CrossRef] [PubMed]
  72. Liu, G.K.; Yang, T.X.; Wang, J.R. Polysaccharides from Polyporus umbellatus: A review on their extraction, modification, structure, and bioactivities. Int. J. Biol. Macromol. 2021, 189, 124–134. [Google Scholar] [CrossRef] [PubMed]
  73. Ciucanu, I.; Kerek, F. A simple and rapid method for the permethylation of carbohydrates. Carbohydr. Res. 1984, 131, 209–217. [Google Scholar] [CrossRef]
  74. Silva, V.; Igrejas, G.; Falco, V.; Santos, T.P.; Torres, C.; Oliveira, A.M.P.; Pereira, J.E.; Amaral, J.S.; Poeta, P. Chemical composition, antioxidant and antimicrobial activity of phenolic compounds extracted from wine industry by-products. Food Control 2018, 92, 516–522. [Google Scholar] [CrossRef]
  75. Wang, J.; Wang, J.; Ye, J.H.; Vanga, S.K.; Raghavan, V. Influence of high-intensity ultrasound on bioactive compounds of strawberry juice: Profiles of ascorbic acid, phenolics, antioxidant activity and microstructure. Food Control 2019, 96, 128–136. [Google Scholar] [CrossRef]
  76. Shi, M.; Zhang, Z.Y.; Yang, Y.N. Antioxidant and immunoregulatory activity of Ganoderma lucidum polysaccharide (GLP). Carbohydr. Polym. 2013, 95, 200–206. [Google Scholar] [CrossRef]
  77. Zheng, Q.S.; Chen, J.C.; Yuan, Y.; Zhang, X.; Li, L.; Zhai, Y.Z.; Gong, X.; Li, B. Structural characterization, antioxidant, and anti-inflammatory activity of polysaccharides from Plumula Nelumbinis. Int. J. Biol. Macromol. 2022, 212, 111–122. [Google Scholar] [CrossRef]
Figure 1. The procedure of GSP-1a extraction and purification. (A) Elution profile of GSP on DEAE Sepharose fast flow column. (B) Elution profile of GSP-1 on Superdex G-200 column. (C) UV–Vis spectrum of GSP-1a. (D) HPGPC profile of GSP-1a (E).
Ijms 24 14721 g001
Figure 2. The FT–IR spectrum of GSP-1a.
Ijms 24 14721 g002
Figure 3. 1H NMR (A), 13C NMR (B), 1H−1H COSY (C), 1H−1H NOSEY (D), 1H−13C HSQC (E), and 1H−13C HMBC (F) spectrum of GSP-1a.
Ijms 24 14721 g003
Figure 4. Predicted model structure of GSP-1a.
Ijms 24 14721 g004
Figure 5. The OH (A), ABTS•+ (B), and DPPH (C) radical scavenging ability of GSP-1a and GSP. Vc is the positive control. The data are expressed as the mean ± SD (n = 3).
Ijms 24 14721 g005
Figure 6. The effects of different concentrations of H2O2 on the viability of HepG2 cells (A), the effects of GSP-1a on HepG2 cells viability (B), and the protective effects of GSP-1a and GSP on HepG2 cells under H2O2-induced oxidative stress (C). The control group was normal cells without any treatment. The H2O2 without pretreatments group was only treated with 800 μM H2O2 for 4 h. The positive and sample groups were pretreated with Vc and polysaccharides for 24 h, respectively, and then treated with 800 μM H2O2 for 4 h. The data were expressed as the percentage of viable cells compared to the blank control and were presented as the mean ± SD (n ≥ 3). n.s. p > 0.05. ## p < 0.01, in contrast to control group. * p < 0.05 and ** p < 0.01, in contrast to H2O2 without pretreatments group.
Ijms 24 14721 g006
Figure 7. The MDA (A) and SOD (B) activities of HepG2 cells at different treatments. The control group was normal cells without any treatment. The H2O2 without pretreatments group was only treated with 800 μM H2O2 for 4 h. The positive and sample groups were pretreated with Vc and polysaccharides for 24 h, respectively, and then treated with 800 μM H2O2 for 4 h. The data were expressed as the means ± SD (n ≥ 3). ## p < 0.01, in contrast to control group. * p < 0.05 and ** p < 0.01, in contrast to H2O2 without pretreatments group.
Ijms 24 14721 g007
Figure 8. Effect of GSP-1a on ROS generation in HepG2 cells. DCF fluorescence intensity (A). Images of HepG2 cells captured by fluorescence microscopy (B). The control group was normal cells without any treatment. The H2O2 without pretreatments group was only treated with 800 μM H2O2 for 4 h. The positive and sample groups were pretreated with Vc and polysaccharides for 24 h, respectively, and then treated with 800 μM H2O2 for 4 h. The data were expressed as the means ± SD (n ≥ 3). ## p < 0.01, in contrast to control group. * p < 0.05 and ** p < 0.01, in contrast to H2O2 without pretreatments group.
Ijms 24 14721 g008
Figure 9. Effects of GSP-1a on Ho-1 (A), Gclm (B), KEAP1 (C), NRF2 (D), Nqo1 (E), FNIP1 (F), and FEM1B (G) on mRNA expression. The control group was normal cells without any treatment. The H2O2 without pretreatments group was only treated with 800 μM H2O2 for 4 h. The sample group was pretreated with GSP-1a for 24 h, and then treated with 800 μM H2O2 for 4 h. The data were expressed as the means ± SD (n ≥ 3). # p < 0.05 and ## p < 0.01, in contrast to control group. * p < 0.05 and ** p < 0.01, in contrast to H2O2 without pretreatments group.
Ijms 24 14721 g009
Table 1. Molecular weights and chemical compositions of GSP-1a.
SamplesGSP-1a
Yield/%33.5 ± 0.64
Total carbohydrate (%)82 ± 1.5
Protein (%)ND
Nucleic acid (%)ND
Mw (kDa)72.8
Mw/Mn1.1
Monosaccharide composition (molar ratio)
Man42.28%
Gal35.7%
Glc22.02%
“ND” refers to “not detected”.
Table 2. Methylation analysis data for GSP-1a.
Retention Time (min)Type of LinkagesPMAAsRelative Molar Ratio (%)Mass Fragments (m/z)
8.477t-Gal(p)1,5-di-O-acetyl-2,3,4,6-tetra-O-methyl galactitol34.3660, 71, 87, 102, 118, 145, 162, 205
11.8472-Man(p)1,2,5-tri-O-acetyl-3,4,6-tri-O-methyl mannitol1.9560, 71, 88, 118, 129, 145, 161, 190
13.0746-Man(p)1,5,6-tri-O-acetyl-2,3,4-tri-O-methyl mannitol19.9971, 87, 99, 102, 118, 129, 162, 173.1, 189
13.1536-Glc(p)1,5,6-tri-O-acetyl-2,3,4-tri-O-methyl glucitol 9.8760, 87, 102, 118, 129, 137, 162, 173, 189
13.5084-Glc(p)1,4,5-tri-O-acetyl-2,3,6-tri-O-methyl glucitol3.6860, 87, 102, 118, 129, 137, 162, 191
17.3163,6-Glc(p)1,3,5,6-tetra-O-acetyl-2,4-di-O-methyl glucitol9.6071, 87, 101, 118, 129, 137, 49, 174, 189, 202, 234, 245, 299
17.6102,6-Man(p)1,2,5,6-tetra-O-acetyl-3,4-di-O-methyl mannitol15.4671, 87, 99, 118, 129, 149, 167, 189, 202, 218, 261, 299, 338
18.2922,4,6-Man(p)1,2,4,5,6-penta-O-acetyl-3-O-methyl mannitol5.0960, 74, 88, 117, 130, 159, 190, 202, 218, 233.1, 260, 299, 338
Table 3. The detailed 1H and 13C NMR spectral assignments of GSP-1a.
CodeGlycosyl Residues Chemical Shifts (ppm)
123456
Aα-D-Galp-(1→H4.923.503.743.664.013.71, 3.8
C97.2971.2472.0972.6874.3760.39
B→6)-α-D-Manp-(1→H5.083.954.053.753.783.77
C106.2874.3774.7272.3480.9470.65
C→2,6)-α-D-Manp-(1→H5.274.194.113.793.783.75, 4.28
C98.9779.7276.8870.6580.9472.36
D→6)-α-D-Glcp-(1→H4.843.503.713.944.173.39, 3.83
C99.5673.0672.8176.7575.3169.46
E→3,6)-α-D-Glcp-(1→H4.983.514.163.944.173.91, 3.56
C97.2471.0386.8976.7575.3169.59
F→2,4,6)-α-D-Manp-(1→H5.274.194.053.96ND3.76, 4.28
C99.0979.7274.7282.23ND72.09
“ND” refers to “no signals were detected”.
Disclaimer/Publisher’s Note: The statements, opinions and data contained in all publications are solely those of the individual author(s) and contributor(s) and not of MDPI and/or the editor(s). MDPI and/or the editor(s) disclaim responsibility for any injury to people or property resulting from any ideas, methods, instructions or products referred to in the content.

