Article

Analysis of Functional Single-Nucleotide Polymorphisms (SNPs) and Leaf Quality in Tea Collection under Nitrogen-Deficient Conditions

1
Center of Genetics and Life Sciences Sirius University of Science and Technology, Olimpiyskiy Ave. b.1, 354340 Sirius, Russia
2
Federal Research Centre the Subtropical Scientific Centre of the Russian Academy of Sciences, 344002 Sochi, Russia
3
State Key Laboratory of Tea Plant Biology and Utilization, Anhui Agricultural University, Hefei 230036, China
4
Agrarian and Technological Institute, Peoples’ Friendship University of Russia, 117198 Moscow, Russia
5
Federal Research Center N. I. Vavilov All-Russian Institute of Plant Genetic Resources (VIR), 196632 Saint Petersburg, Russia
*
Author to whom correspondence should be addressed.
These authors contributed equally to this work.
Int. J. Mol. Sci. 2023, 24(19), 14538; https://doi.org/10.3390/ijms241914538
Submission received: 26 June 2023 / Revised: 19 September 2023 / Accepted: 20 September 2023 / Published: 26 September 2023

Abstract

:
This study discusses the genetic mutations that have a significant association with economically important traits that would benefit tea breeders. The purpose of this study was to analyze the leaf quality and SNPs in quality-related genes in the tea plant collection of 20 mutant genotypes growing without nitrogen fertilizers. Leaf N-content, catechins, L-theanine, and caffeine contents were analyzed in dry leaves via HPLC. Additionally, the photochemical yield, electron transport efficiency, and non-photochemical quenching were analyzed using PAM-fluorimetry. The next generation pooled amplicon–sequencing approach was used for SNPs-calling in 30 key genes related to N metabolism and leaf quality. The leaf N content varied significantly among genotypes (p ≤ 0.05) from 2.3 to 3.7% of dry mass. The caffeine content varied from 0.7 to 11.7 mg g−1, and the L-theanine content varied from 0.2 to 5.8 mg g−1 dry leaf mass. Significant positive correlations were detected between the nitrogen content and biochemical parameters such as theanine, caffeine, and most of the catechins. However, significant negative correlations were observed between the photosynthetic parameters (Y, ETR, Fv/Fm) and several biochemical compounds, including rutin, Quercetin-3-O-glucoside, Kaempferol-3-O-rutinoside, Kaempferol-3-O-glucoside, Theaflavin-3′-gallate, gallic acid. From our SNP-analysis, three SNPs in WRKY57 were detected in all genotypes with a low N content. Moreover, 29 SNPs with a high or moderate effect were specific for #316 (high N-content, high quality) or #507 (low N-content, low quality). The use of a linear regression model revealed 16 significant associations; theaflavin, L-theanine, and ECG were associated with several SNPs of the following genes: ANSa, DFRa, GDH2, 4CL, AlaAT1, MYB4, LHT1, F35Hb, UFGTa. Among them, seven SNPs of moderate effect led to changes in the amino acid contents in the final proteins of the following genes: ANSa, GDH2, 4Cl, F35Hb, UFGTa. These results will be useful for further evaluations of the important SNPs and will help to provide a better understanding of the mechanisms of nitrogen uptake efficiency in tree crops.

1. Introduction

Nitrogen (N) is an essential element that is a part of proteins, nucleic acids, enzymes, hormones, and bioactive compounds. Under insufficient N conditions, the synthesis of enzymes slows down, which leads to the disruption of biosynthesis, metabolism, and, as a result, decrease in yield [1,2]. It is well known that plants uptake nitrogen from soil as nitrates, ammonium, urea, or amino acids. The mechanisms of nitrogen assimilation and utilization are complex, especially in perennial tree crops. Moreover, different genotypes can assimilate nitrogen with different levels of efficiency. Under low nitrogen conditions, some varieties are characterized by better agricultural quality compared to others [1,3,4,5]. The identification of plant genotypes that are highly efficient with respect to nitrogen uptake and utilization is important for the sustainable agriculture [6,7].
Efficient nitrogen-utilizing plants have evolved adaptive mechanisms to detect nitrogen concentrations in soils [8,9,10] and systemic signals that come from other parts of plant, such as the distant roots or shoots [8,10,11,12,13,14,15,16,17]. Some transcription factors related to these processes have been identified, such as MADS-box TF ANR1, AP2/ERF, TGA1/TGA4, TCP20, NLP7,MYB, LBD37/38/39, bHLH35, bHLH36, WRKY [5,7,10,18,19]. In addition, various hormonal pathways are controlled by soil nitrate concentrations and, in turn, regulate morphological and physiological plant responses [20,21,22,23,24].
Tea plant (Camellia sinensis (L.) Kuntze) is an important agricultural tree crop that is widely grown in more than 52 countries and used to produce the world’s second most popular non-alcoholic beverage [25,26,27]. Over the last 20 years, the world’s tea processing has doubled with the growth of the world’s population, and an increase in tea plantation demand has also taken place (from two to four million hectares) [28]. Tea quality depends on the contents of bioactive compounds such as polyphenols, caffeine, and theanine, amino acids, volatile compounds, and alkaloids [4,29,30,31,32,33,34,35], which underly the delicious taste, pleasant flavor, and beneficial health effects of tea [36,37,38,39,40,41,42,43]. Transcriptome research has provided new insights into the metabolic pathways and key genes involved in the biosynthesis, transport, and metabolism of catechins, theanine, and caffeine in tea plant tissues, as well as their relationship with genes that regulate abiotic stress responses [44,45,46,47,48,49,50,51,52].
On the one hand, the further expansion of tea farming is limited due to the lack of appropriate plantation areas with sufficient nitrogen supply. On the other hand, the excessive use of nitrogen fertilizers in tea plantations can cause damage to the environment [53], leading to soil acidification [54] and the accumulation of high levels of aluminum, fluorine, and heavy metals (e.g., chromium) in tea leaves, posing potential risks to human health [55]. Additionally, the long-term application of large amounts of N fertilizers can reduce soil fungal diversity in tea plantations [56]. Thus, the identification of nitrogen-efficient tea genotypes is critically important to maintain quality and yield under nitrogen-deficient conditions. Such genotypes can help to reduce the need for nitrogen fertilizers and expand the potential of tea production. In this context, it is necessary to analyze the differences within tea plant germplasms, which can affect nitrogen uptake efficiency and utilization [6].
The current knowledge of the relationships between the elements and metabolites in tree crops, particularly in tea, is still fragmentary. Recently, a set of genes involved in nitrogen metabolism in plants, including tea, were identified. Specifically, the co-expression of key genes such as AMT, AQP, NRT, GOGAT, and GS regulates ammonium uptake and assimilation [4]. Moreover, N-transporter genes, along with GS and GOGAT, are responsible for the regulation of theanine and glutamine contents [4]. Through employing the Kyoto Encyclopedia of Genes and Genomes (KEGG) analysis, the authors of [6] revealed that differentially expressed genes (DEGs) are primarily related to “nitrogen metabolism”, “amino acid metabolism”, and “hormone signal transduction”. For tea plants, the high-affinity uptake system is considered to be the main control factor for tea plant N metabolism. The regulators of soil N uptake (AMT1.2, NRT2.4, and PIP) and the regulators of N assimilation into amino acids in leaves and young shoots (GS1.2, GDHa, GDH2) and root-amino-acid transporters (LHT1) have been identified [5,6,33,57,58,59]. Additionally, amino-acid transporters such as AAPs, LHTs, CATs, ProTs, and UMAMITs play important roles in the N assimilation [60]. However, the polymorphisms in these genes have not been evaluated in genotypes with different N efficiencies. The goal of this study was to analyze the diversity of and the SNPs in the key N metabolism genes and their correspondence with specific phenotypes in the collection of 20 tea genotypes in Northwest Caucasia.

2. Results

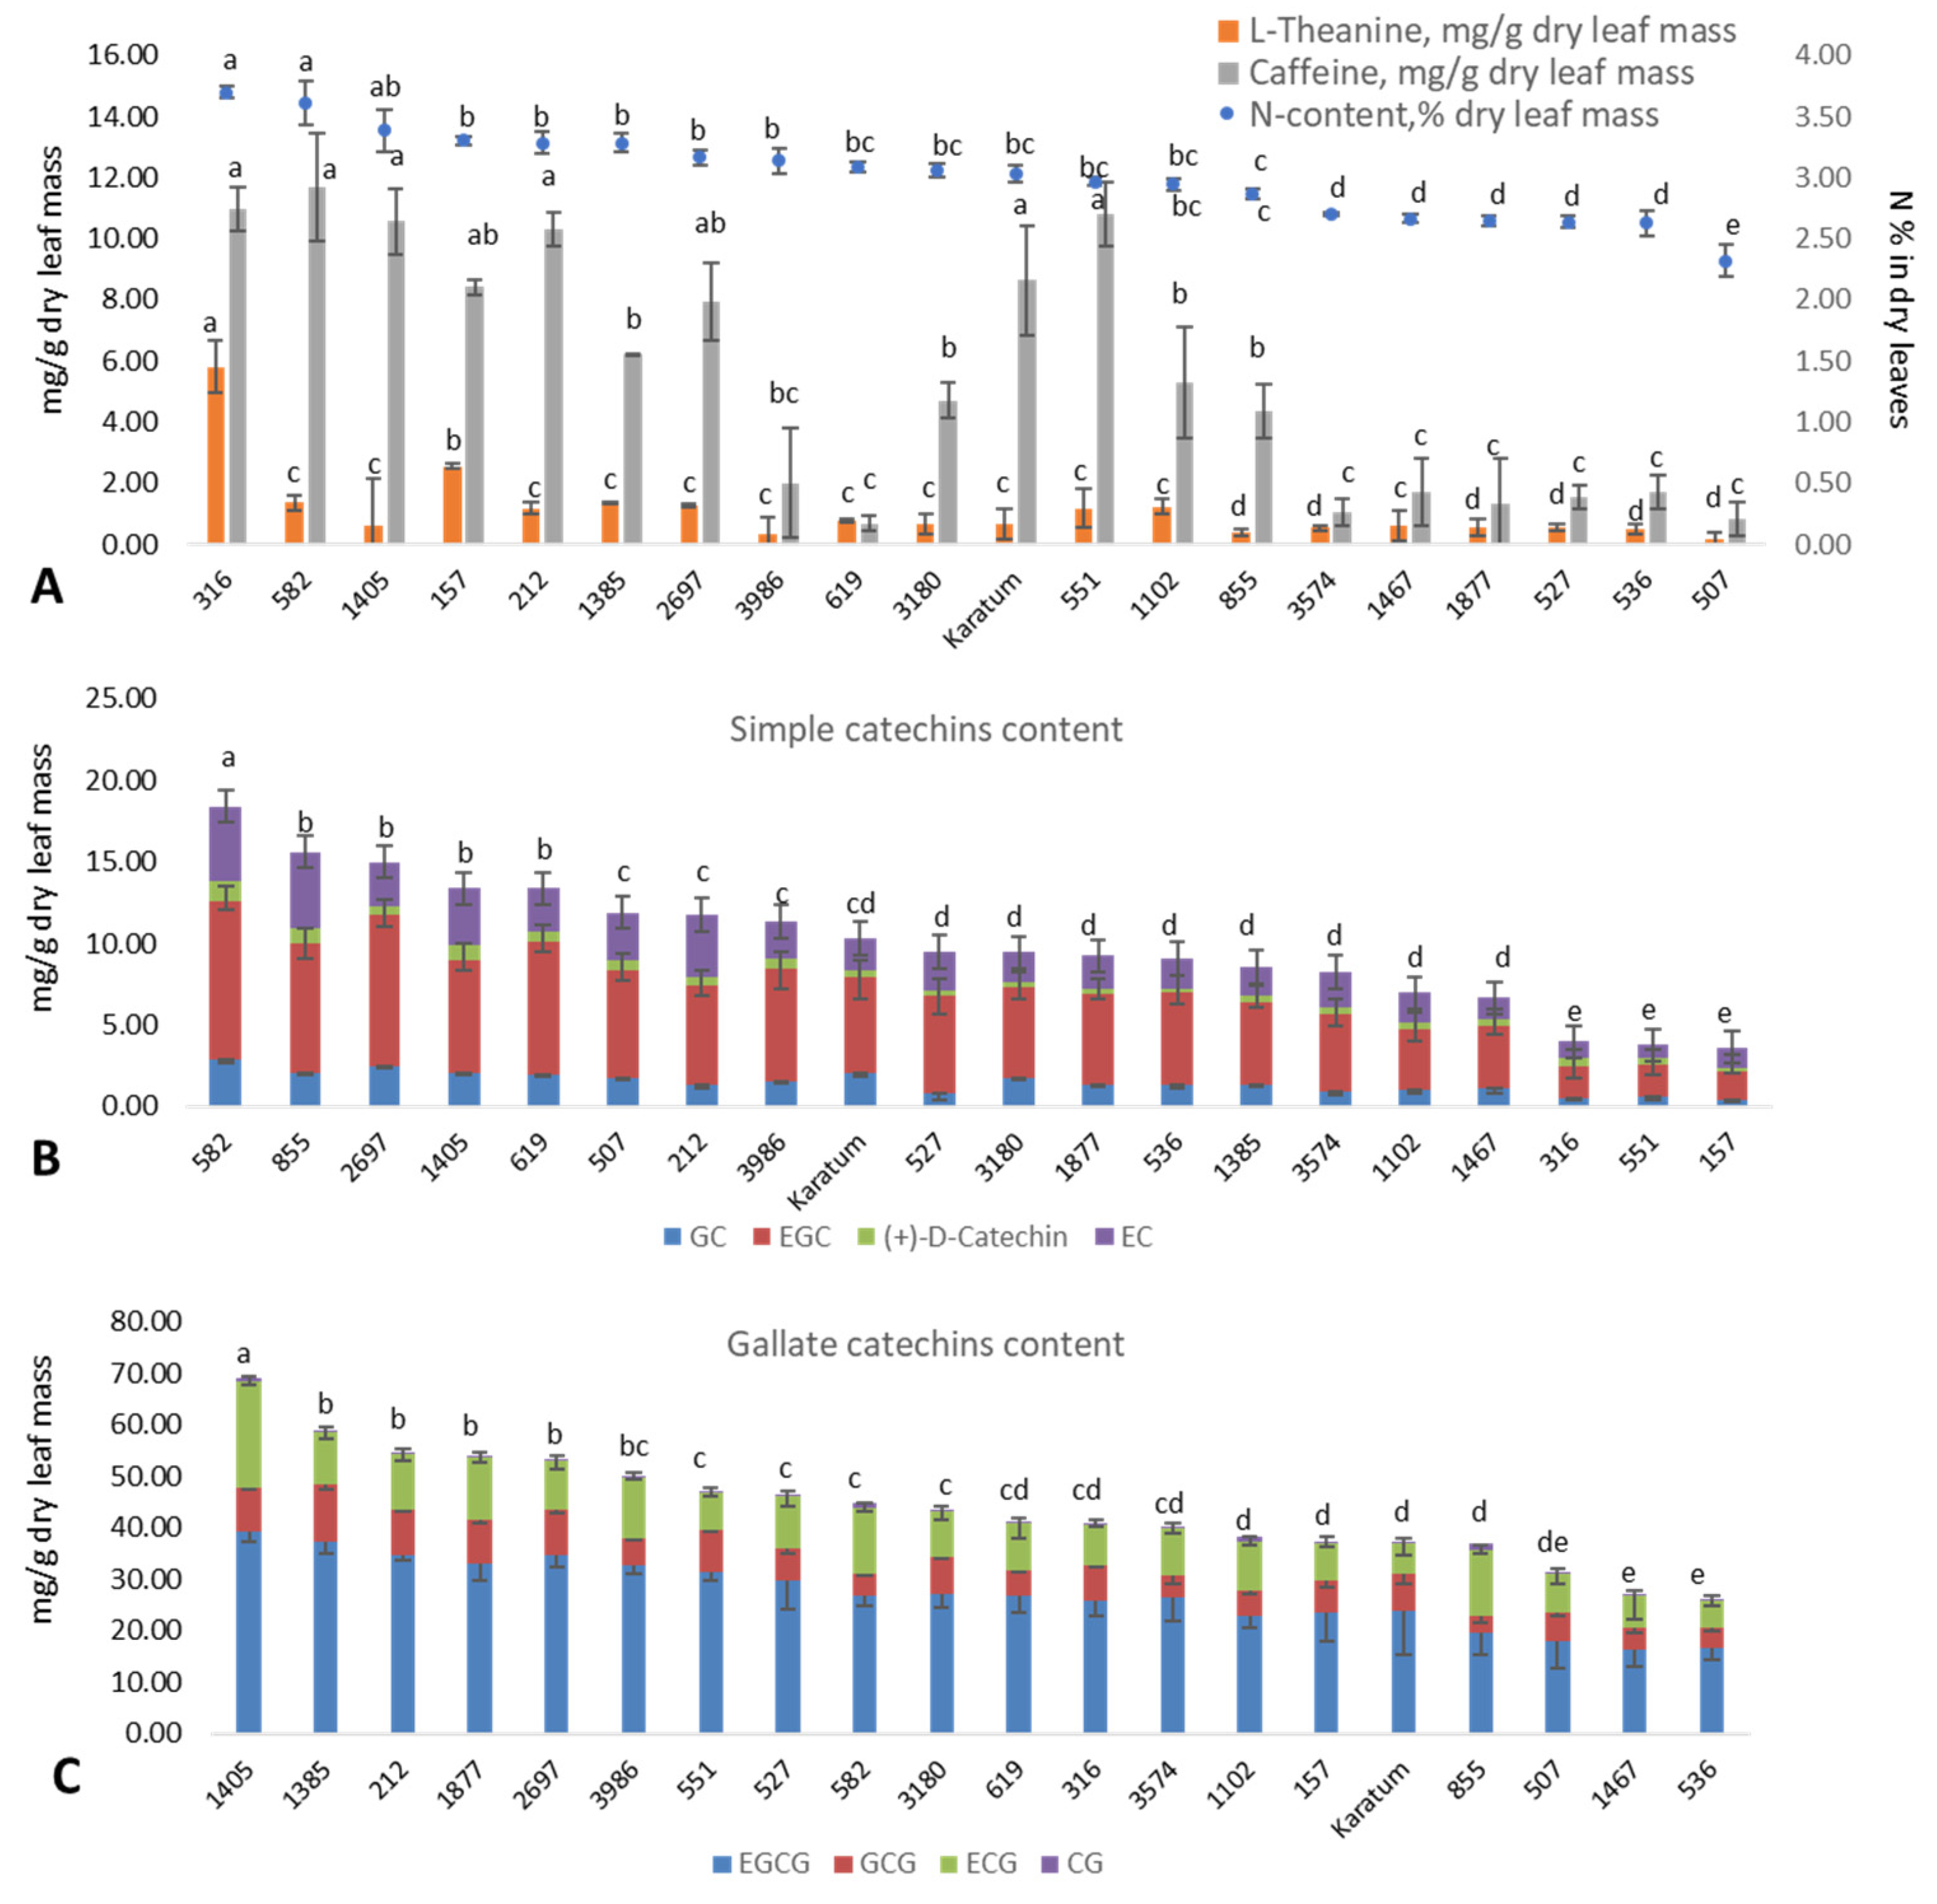
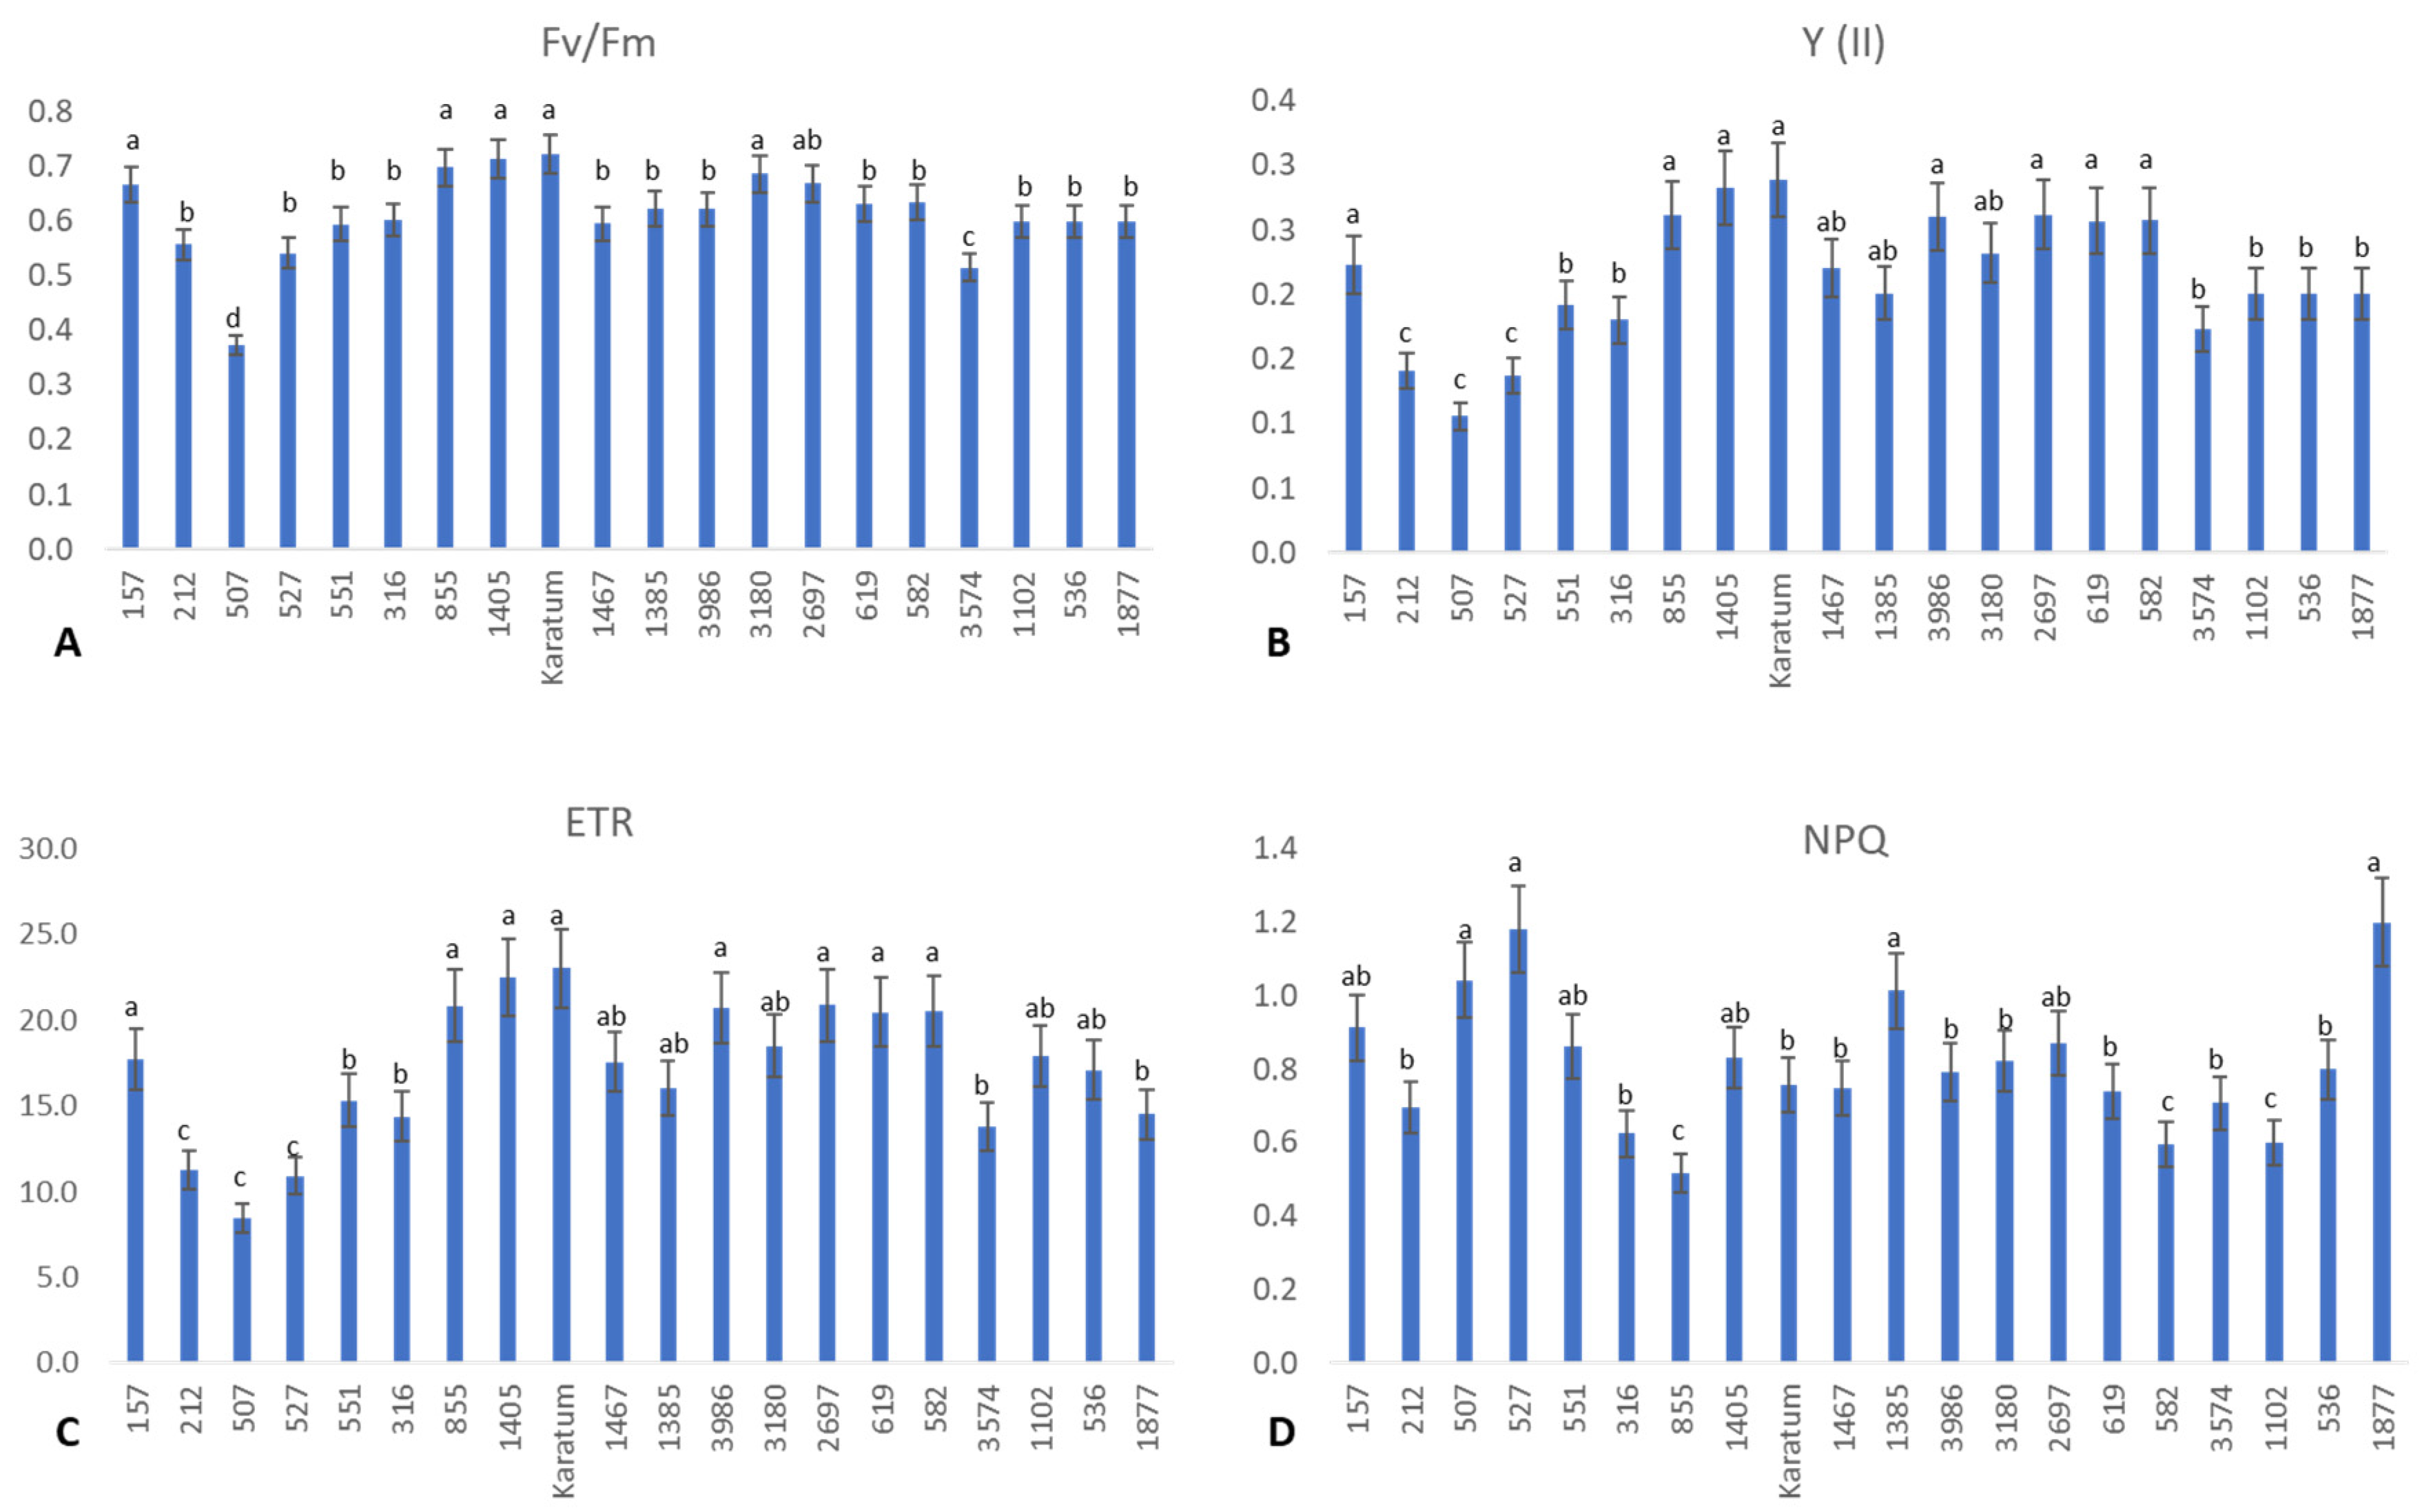
2.1. Phenotypic Evaluation of the Collection

Among the 20 genotypes, significant differences were observed according to their leaf size, leaf N content, photosynthetic efficiency, and leaf quality. Fifteen genotypes were classified as extra large according to their leaf area (Table 1). These genotypes were separated into three groups: (a) those with a mean leaf area of 149 cm2 (tetra-ploidy genotype #619), (b) those with a mean leaf area of 83–112 cm2 (#1102, #316, #2697, Karatum, #1385, #212), and (c) those with a mean leaf area of 65–75 cm2 (#551, #157, #3180, #536, #1405, #1877, #582, #1467). Most of the genotypes in the (b) and (c) groups were characterized by an increased genome size and related to are tri- and aneuploidy (Supplementary Table S1).
Significant differences (p ≤ 0.05) in leaf N content were observed among the studied genotypes, with leaf N content values varying from 2.3 to 3.7%, and the mean standard deviation was 0.05–0.20% (Figure 1A). The highest leaf nitrogen content (3.4–3.7%) was detected in several mutant forms, namely #316, #582, and #1405. The lowest N-content (2.3%) was detected in the #507 mutant form. The caffeine content (mg g−1 dry leaf mass) varied significantly among the genotypes, with values ranging from 0.7 to 11.7 mg g−1. The highest caffeine content (8.6–11.7 mg g−1) was observed in several genotypes with a high leaf nitrogen content, namely #316, #582, #1405, #212, #551, and cv Karatum. The content of L-theanine (mg g−1 dry leaf mass) varied significantly among the genotypes, with values ranging from 0.2 (in #507) to 5.8 (in #316) mg g−1. Additionally, most of the genotypes with a low N content (#3574, #1467, #1877, #527, #536, and #507) were also characterized by low caffeine and low theanine contents compared to the genotypes with greater N contents. Thus, 5.8 mg g−1 of L-theanine and 11.0 mg g−1 of caffeine were observed in #316. The lowest nitrogen (2.3%), theanine (0.19 mg g−1), and caffeine (0.84 mg g−1) contents were observed in the mutant form #507. However, the correspondence between the N content in the leaves and catechins were not clear. The highest contents of simple catechins (13–20 mg g−1) were observed in the following genotypes: #582, #619, #2697, #1405, and #855. The lowest content (about 5 mg g−1) was observed in #316, #551, and #157 (Figure 1B). The highest gallated catechin contents (55–70 mg g−1) were observed in #2697, #1405, #1385, #212, and #1877, and the lowest (25–35 mg g−1) were observed in #536, #1467, and #507 (Figure 1C). Thus, mutant forms #2697 and #1405 were exhibited the highest content of both simple and gallated catechins.
Interestingly, significant differences were detected among the genotypes with respect to photosynthetic efficiency and the functional state of the PSII (Figure 2). The highest photochemical yield (about 0.7) was observed in Karatum, #157, #855, #1405, #3180, and #2697, and the lowest photochemical yields (about 0.4–0.5) were observed in #3574 and #507 (Figure 2A), indicating the differences in photosynthetic efficiency in these genotypes. Additionally, the highest operating efficiencies of PSII (Y) (about 20–30%) and the highest electron transport rates (ETRs) (about 16–23%) were detected in the following genotypes: #157, #855, #1405, cv Karatum, #1467, #3180, #3986, #2697, #619, and #582. On the other hand, the lowest Y (about 10%) and lowest ETRs (about 8–11%) were detected in three genotypes: #212, #507, and #527 (Figure 2B,C). Interestingly, the highest non-photochemical quenching (NPQ) value was detected in #507, #527, #1385, #157, #1405, #2697 and #1877, indicating a higher level of light energy to heat energy dissipation compared to the other genotypes. On the other hand, the lowest NPQ value was detected in #855, #582, and #1102, evidencing the higher level of photochemical energy utilization in these three genotypes compared to the other genotypes.
Significant positive correlations were detected between the nitrogen content and biochemical parameters such as L-theanine, caffeine, and most of the catechin contents (Figure 3). However, nitrogen content was not correlated with Y, ETR, NPQ, and Fv/Fm. Interestingly, significant negative correlations were detected between photosynthetic parameters (Y, ETR, Fv/Fm) and several biochemical compounds, such as rutin, Quercetin-3-O-glucoside, Kaempferol-3-O-rutinoside, Kaempferol-3-O-glucoside, Theaflavin-3′-gallate, and gallic acid.

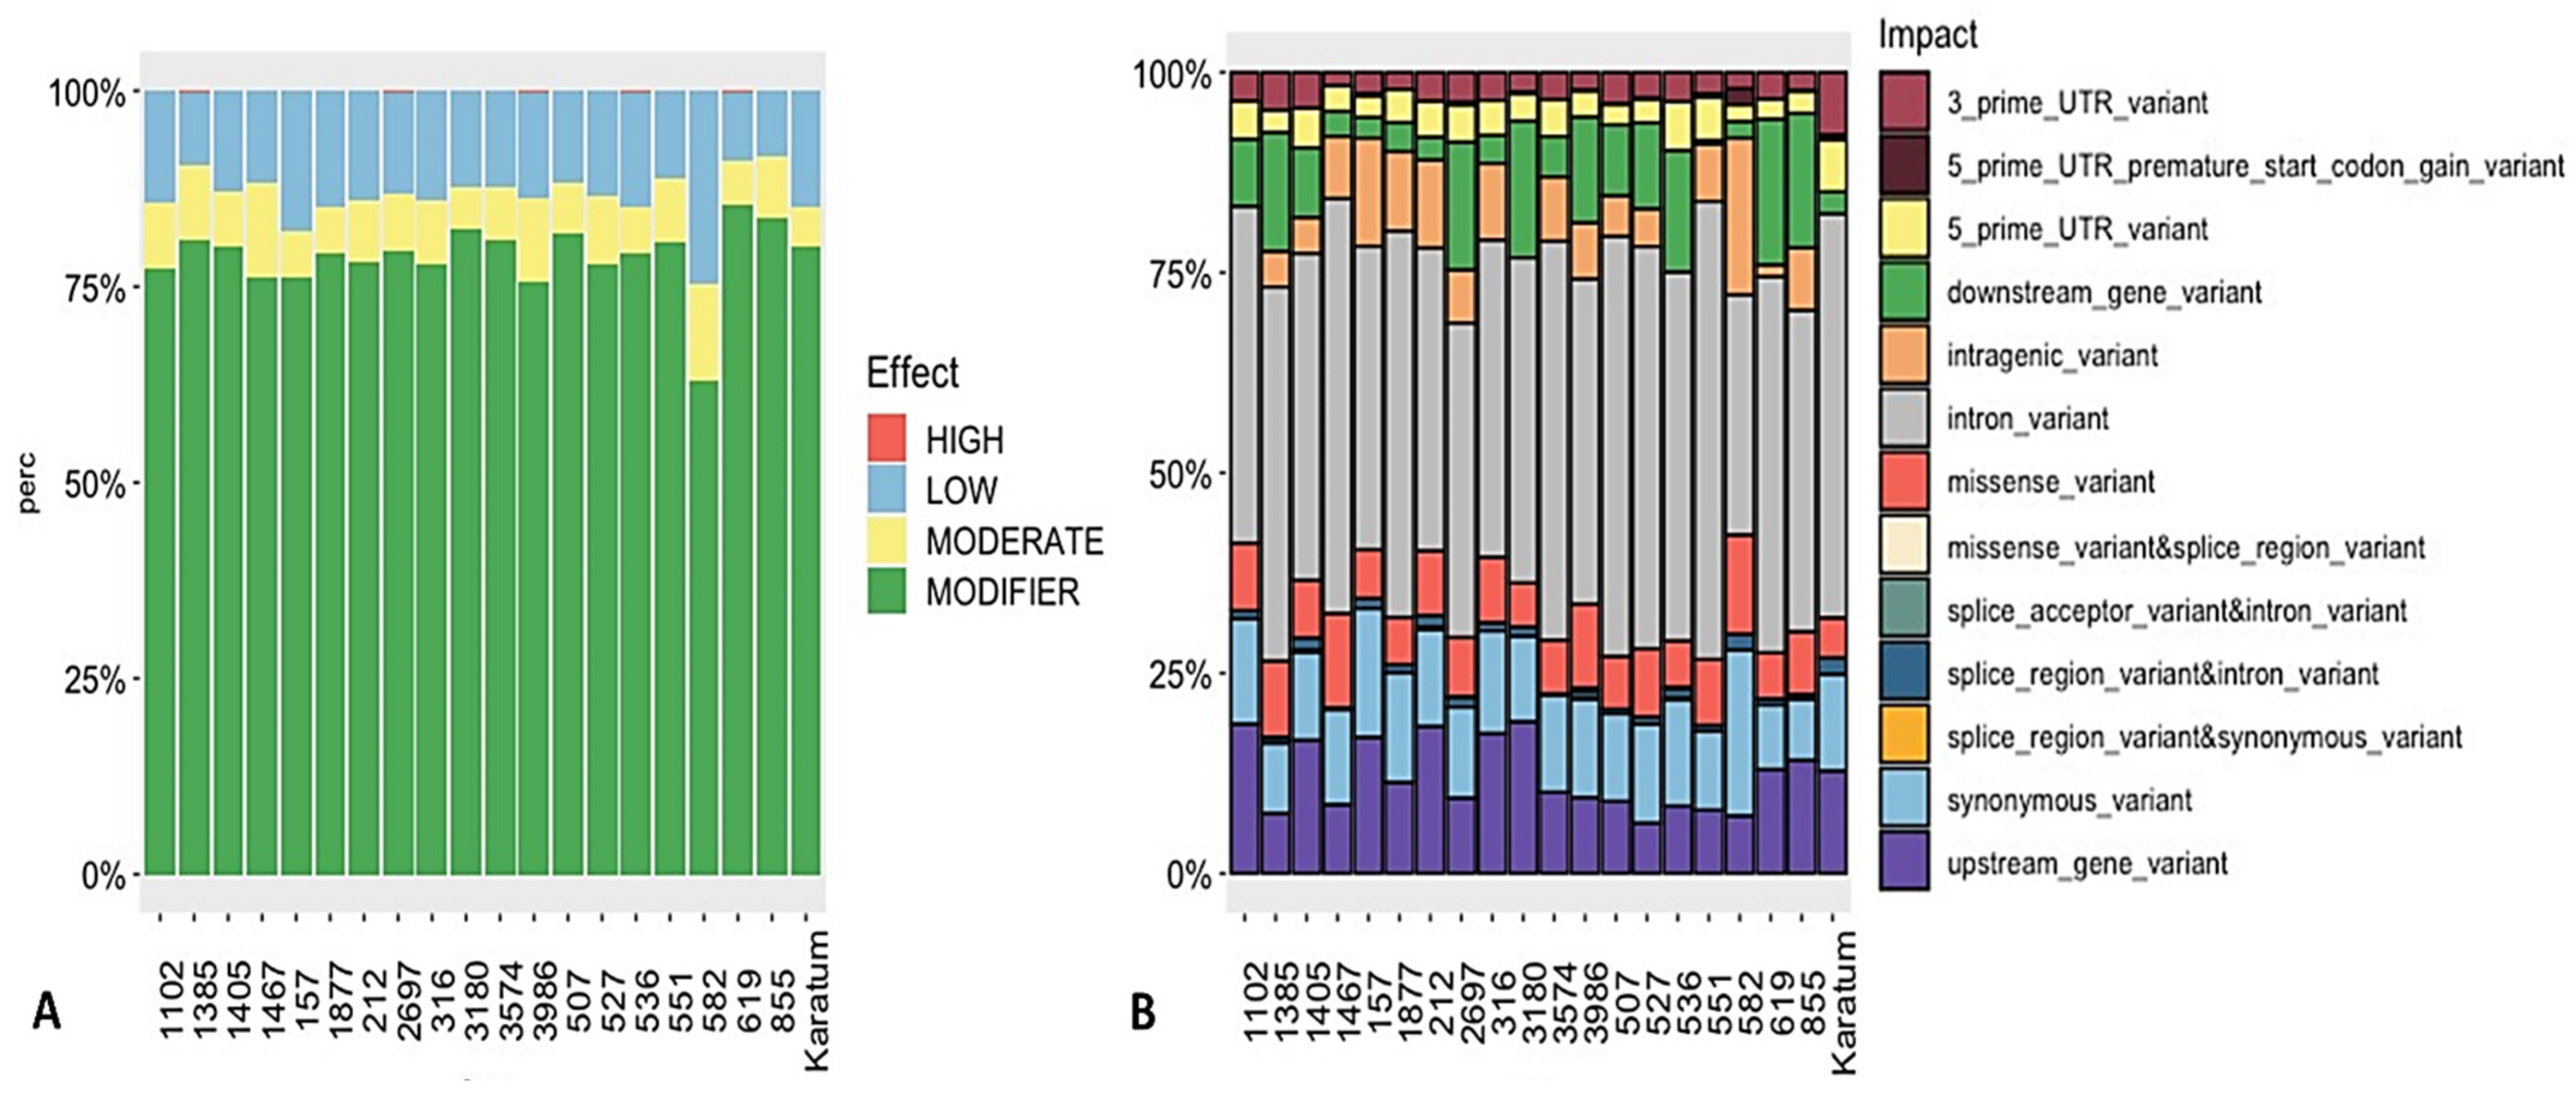
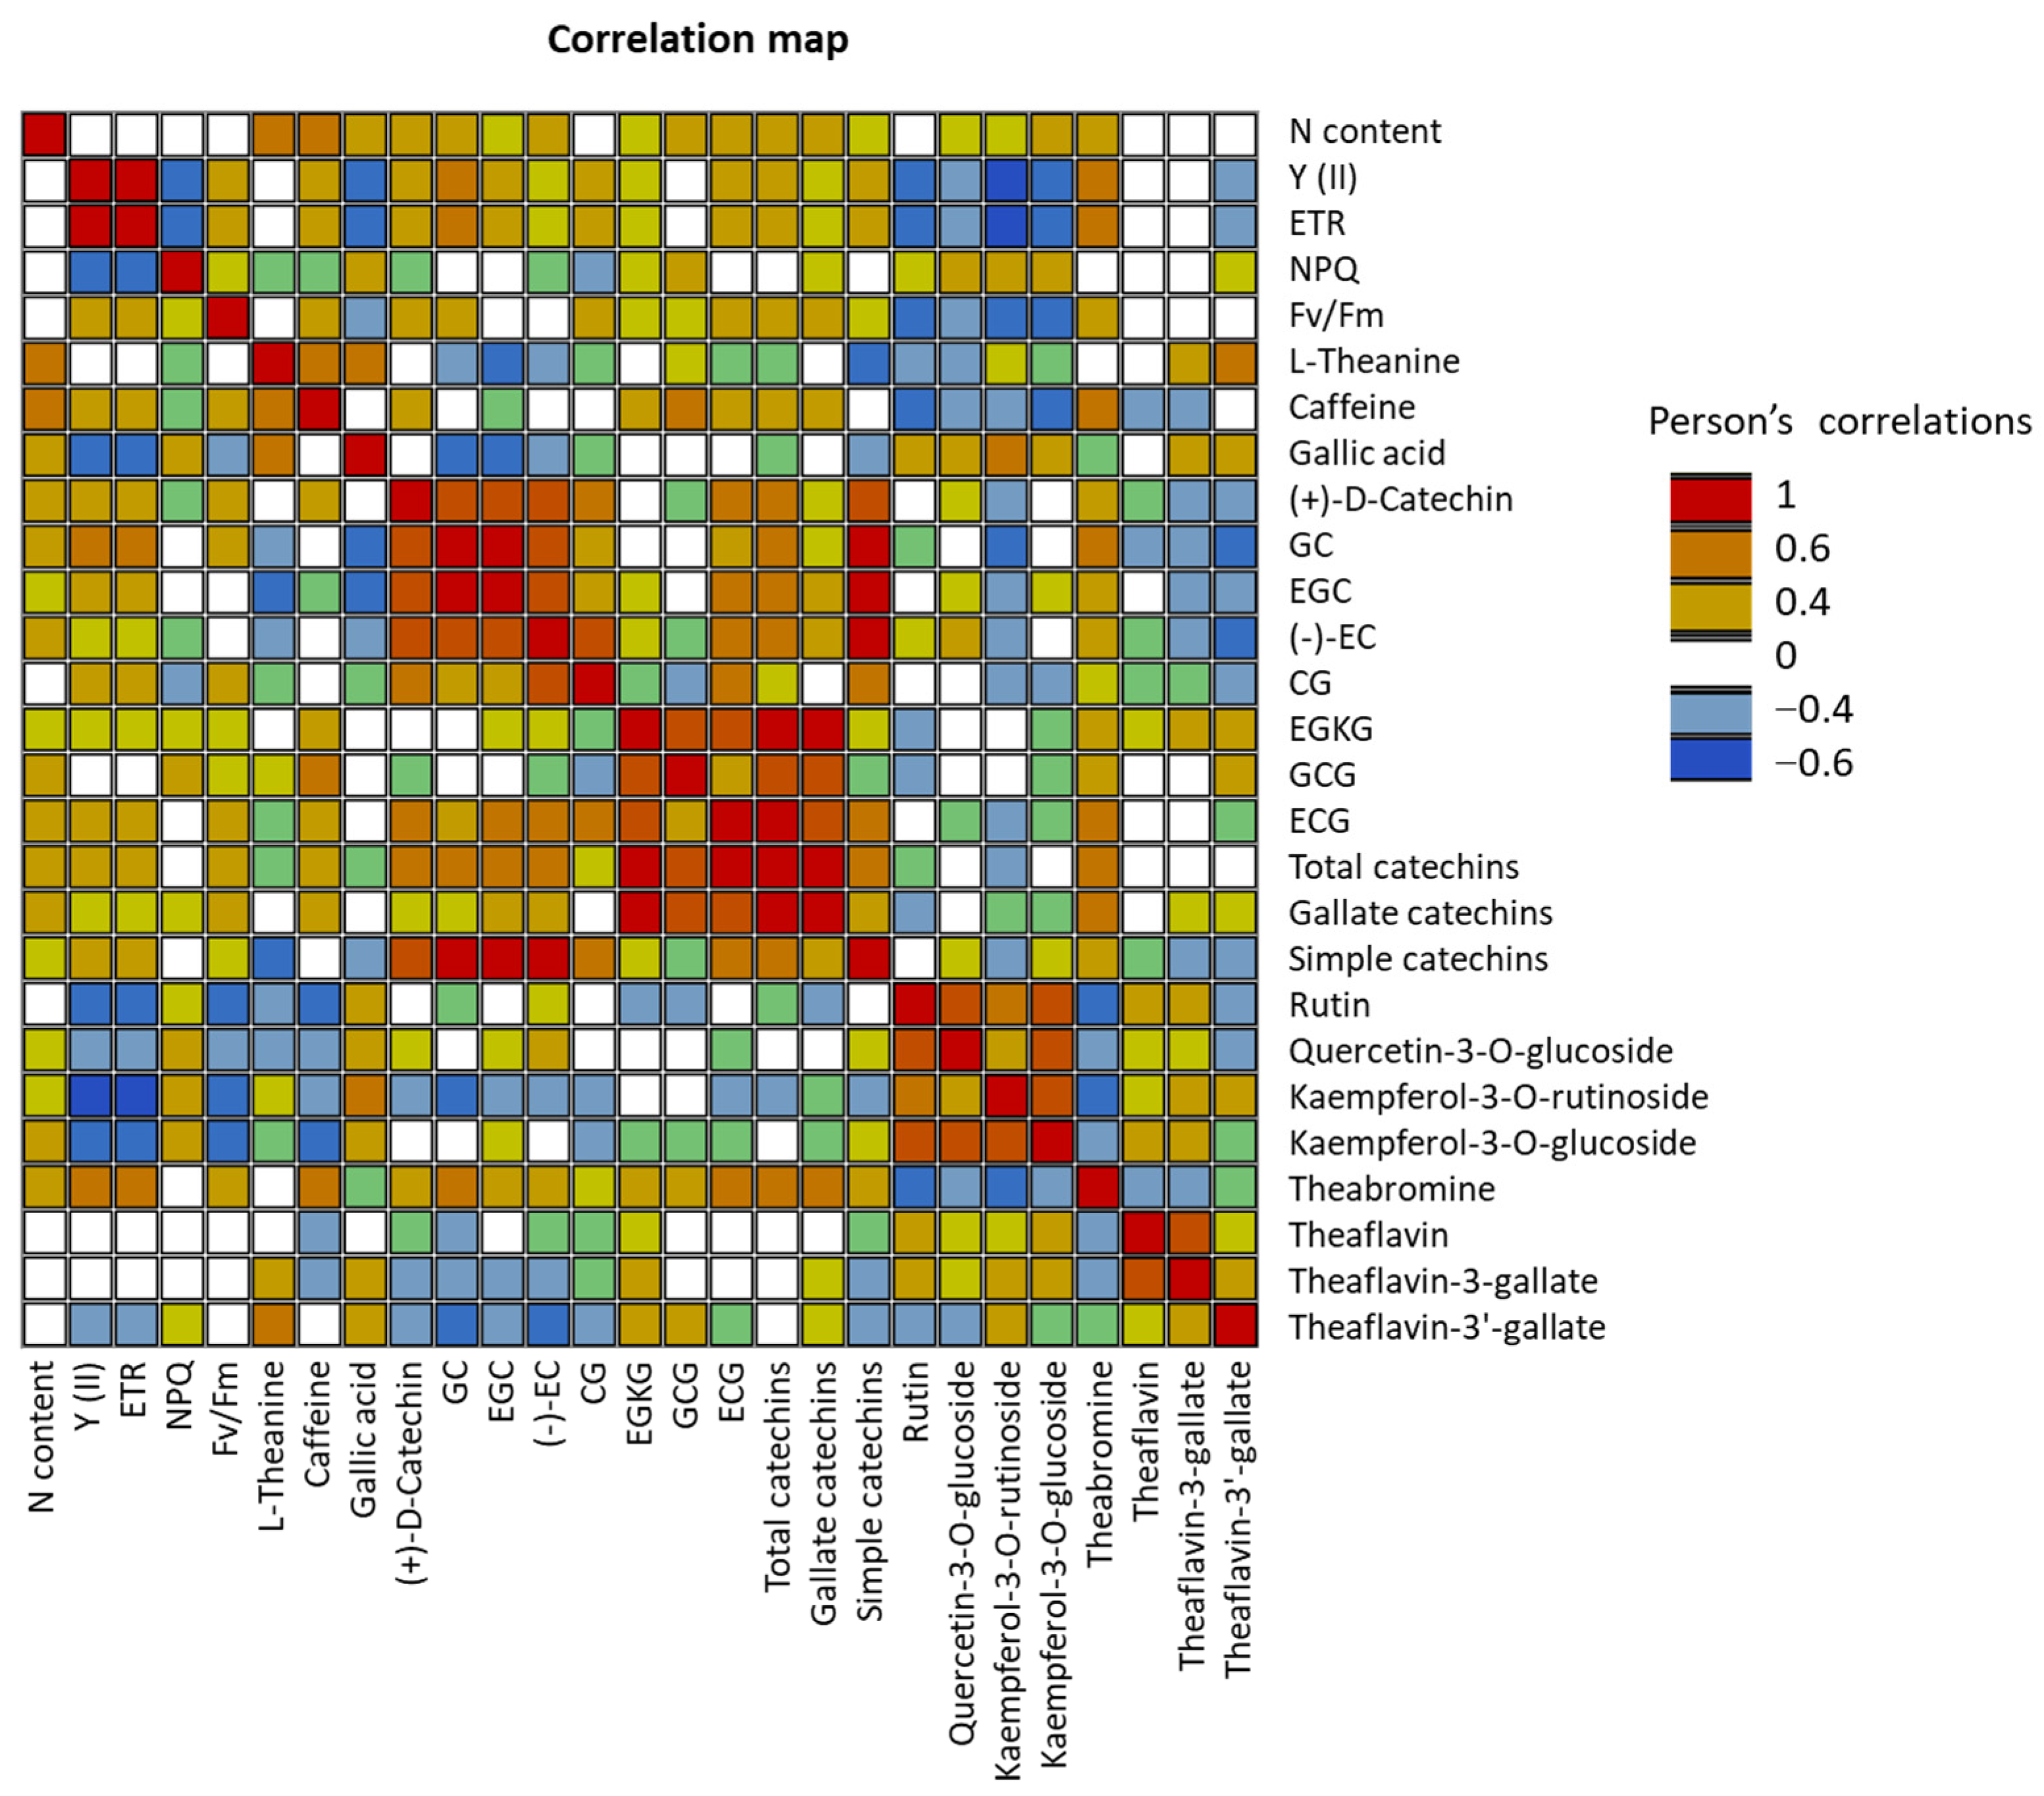
2.2. Detection of SNPs in the Selected Genes and their Relationships with Phenotypes

A high level of variability in SNP number was observed in target genes (Table 2). The highest SNP density in the exone regions (about 2) was observed in three genes, namely F35Hb, 4CL, and AMT1.2, while the lowest SNP density (about 0.0–0.1) was detected in the exons of bG, WD40, GDH2, LAR, AlaAT1, bHLH35, MYB7, and bHLH36. Additionally, the highest rate of SNPS/exon (more than 30%) was detected in F35Hb, AMT1.2, DFRa, PIP, and bG.
Interestingly, no polymorphisms were detected in FLS, CHS, and ANRa.
The SnpEff tool variation annotation was used to classify the SNPs according to their effect impact, and the SNPs were classified as either high-effect, moderate-effect, or low-effect or considered to have a modifier effect. In total, 0.2–0.3% of the SNPs were classified as a high-effect SNPs, and these were detected in the following genotypes: #619, #2697, #536, #1385, and #3986 (Figure 4A). Additionally, 7–12% were classified as moderate-effect SNPs, which were identified in all 20 genotypes. The majority of the SNPs were related to those with a modifier effect. An analysis of SNP distribution among the 20 genotypes indicated that 2–8% of the SNPs belonged to 3′-UTR (three prime untranslated region), and 2–6% belonged to the 5′-UTR variants (Figure 4B), with the highest percentage being observed in cv. Karatum. Additionally, broad distributions of the downstream (0.5–18.0%) and upstream (6.0–19.0%) gene variants were detected among the 20 genotypes. The highest percentages of the downstream gene variants (10–18%) were detected in #527, #3986, #1385, #536, #2697, #855, #3180, and #619, and the lowest percentages (0.5–3.0%) were detected in #551, #582, #157, cv Karatum, #212, #1467, #316, and #1877. The highest percentages of the upstream gene variants (11.0–19.0%) were detected in cv Karatum, #619, #855, #1405, #157, #316, #212, #1102, and #3180, and the lowest (6.0–8.0%) were detected in #527, #582, #1385, #551, and #536. In total, 0.2–2.1 of the detected SNPs were related to splice region variant and intron variants, with the highest percentages (2.0–2.1%) being observed in #1405, #582, and cv Karatum, and the lowest (0.2–0.3%) being observed in #3574, #3986, #536, and #212. Approximately 5.0–13.0% of the SNPs were detected as missense variants, with the highest levels (10.0–13.0%) being observed in #3986, #1467, #582, and #1385, and the lowest levels (5.0–6.0%) being observed in cv Karatum, #3180, #619, #536, #1877, and #157. Additionally, the lowest percentage of intragenic variants (1.5%) was detected in #619, and the highest percentages (10.0–20.0%) were observed in #212, #157, #582, #316, and #1877. Finally, 0.2–0.3% of the splice acceptor and intron variants were detected in the following genotypes: #3986, #619, #2697, #1385, and #536.
We generated heatmaps to compare the SNP frequencies in the exon regions of the studied genes (Figure 5). The heatmaps indicated that the highest frequencies occurred in AMT1.2, UFGTa, UFGTb, and 4Cl in most of the genotypes, while the lowest frequencies were observed in GDHa, GDH2, WD40, bHLH35, AlaAT1, LAR, and bG. The application of the neighbor joining method to the studied mutant forms indicated two distinct branches, and one of them was divided into two sub-branches. The first branch consisted of six genotypes with the highest SNP frequencies, namely #507, #855, #1385, #3986, #1467, and #619. Most of them were characterized by a low N content and low caffeine and L-theanine contents. The second branch consisted of 14 genotypes and was divided into two sub-branches. Most of the genotypes with high leaf quality shared the same sub-branch.
The sets of SNPs that were classified as high- or moderate-effect SNPs were finally identified (Table S3). Among them, two SNPs in WRKY57 were most frequent among the most genotypes with a low nitrogen content and low tea quality. Moreover, 29 SNPs with a high or moderate effect were associated with #316 or #507 (two genotypes that contrast according to their leaf N content and leaf quality). Specifically, for #507, these specific SNPs were observed in the following genes: GDHa (1 SNP), GDH2 (1), WD40 (2), 4CL (7), F35Hb (3), WRKY57 (2), and UFGTa (2). Additionally, a few specific SNPs were observed in #316, namely 4Cl (1), NRT2.4 (1), F35Ha (1), F35Hb (2), AlaDC (3), and UFGTa (1). Most of these SNPs may be responsible for changes to the biochemical properties of proteins.
A linear regression model was applied to reveal the possible associations between the phenotypic data and the SNPs. This analysis led to the recording of 16 significant associations, and the level of significance was set at p value < 0.05 (Table 3). Theaflavin, L-theanine, and ECG were associated with several SNPs of the following genes: ANSa, DFRa, GDH2, 4CL, AlaAT1, MYB4, LHT1, F35Hb, and UFGTa. Among them, seven SNPs of moderate effect may be responsible for changes in the amino acid contents of the final proteins of the following genes: ANSa, GDH2, 4Cl, F35Hb, and UFGTa.

3. Discussion

The new regulatory approaches regarding plant mineral nutrition have been outlined to improve yield quality and quantity and are based on a desire to create cultivars that can effectively adapt to a specific level of soil fertility and are characterized by high nitrogen uptake and utilization efficiency [1,61]. Different plant genotypes can uptake and utilize soil nitrogen with different levels of efficiency [6,7]. Thus, the identification of these genotypes and the discovery of the mechanisms underlying high-level N deficiency are important to develop molecular markers and facilitate their further application in breeding programs [3,4,5].
In this study, twenty tea genotypes displayed significant differences according to their leaf size; ploidy level; and N, caffeine, L-theanine, and catechin contents. The genotype #507 was characterized by having the smallest leaf size; lowest N, L-theanine, and caffeine contents; lowest photochemical yield (Fv/Fm), operating efficiency of the PSII (Y), and Electron transport rate (ETR); and the highest non-photochemical quenching compared to the other genotypes. These results indicate this genotype’s low level of photochemical utilization of light energy, leading to the low photosynthetic capacity of this genotype [62,63,64]. The mutant form #316 was characterized by an extra-large leaf size and showed the highest N, caffeine, and theanine contents. This genotype was characterized by having average values of Y, ETR, and Fv/Fm compared to the other genotypes. The SNP distribution and frequencies of these two genotypes showed great dissimilarity, and the two were placed in two different branches, showing the highest genetic difference among these two genotypes.
Significant positive correlations were detected between the nitrogen content and biochemical parameters such as theanine, caffeine, and catechin contents. L-theanine and caffeine have been shown to be positively correlated with soil N content, which is consistent with our results [65]. However, according to our results, no negative correlation was observed between theanine and catechins. This is not consistent with the other studies in the literature, as some have reported that catechin and L-theanine contents are negatively correlated [66]. Surprisingly, in this study, we observed no correlations between nitrogen content and the parameters of photosynthetic efficiency (Y, ETR, NPQ, Fv/Fm).
The allele frequency data are useful for identifying the loci underlying phenotypic responses to selection or natural variation in phenotypes. The highest SNP frequencies were detected in the following genes: UFGTa, UFGTb, 4Cl, and AMT1.2, indicating their high variability among tea accessions. Among them, the first three genes are related to tea quality; UFGT encodes UDP-flavonoid 3-O-glucosyl transferase and genes related to the anthocyanin biosynthesis pathway, while 4Cl encodes 4-coumaric acid, CoA ligase, which participates in the biosynthesis of flavonoids [67]. AMT1.2 is one of the key genes that encodes the ammonium transporter that regulates NH4+ uptake [68]. Tea plants have been reported to utilize ammonium more efficiently than nitrate, resulting in better growth [69,70]. However, nitrate-fertilized young shoots have been shown to exhibit a greater total catechin content and higher expression of genes encoding the flavonoid biosynthetic enzymes dihydroflavonol 4-reductase (DFR), chalcone synthase (CHS), and phenylalanine ammonia-lyase (PAL) compared to ammonium-fertilized shoots [71].
SNPeff can determine the different impact of SNPs [72]. A high-impact variant can cause function loss or gain, a premature stop codon, or a change in protein structure or function. A moderately significant variation may result in a non-disruptive change in protein function or structure. A low-impact variant may result in a silent mutation, which means that the genetic change has no influence on amino acid sequence or protein function. It could be a conservative missense variation with the same amino acid alteration. A modifier impact variant is one that is expected to alter the effect of another variant on the protein or to affect regulatory regions that control gene expression. Through analyzing SNPs with a high or moderate effect, we identified 18 SNPs that are unique to the low-quality genotype #507 in the following genes: GDHa (1 SNP), GDH2 (1), WD40 (2), 4CL (7), F35Hb (3), WRKY57 (2), and UFGTa (2). Among them, only two SNPs in GDH2 and 4CL are significantly associated with theaflavin and ECG and promote changes in protein structures. As mentioned above, 4Cl has been shown to participate in the flavonoid biosynthesis pathway, and this finding is consistent with our results. GDH encodes glutamate dehydrogenases, central enzymes in nitrogen metabolism, assimilating ammonia into glutamine or deaminating glutamate into α-oxoglutarate. Tea plant has two GDH genes: CsGDH1 encodes the β-GDH subunit, and CsGDH2/3 encode the α-GDH subunit, and their proteins all feature an NADH-specific motif [73].
To summarize, in this study, we revealed significant positive correlations between nitrogen content and biochemical parameters such as theanine, caffeine, and catechin contents. However, significant negative correlations between photosynthetic parameters (Y, ETR, Fv/Fm) and several biochemical compounds, such as rutin, Quercetin-3-O-glucoside, Kaempferol-3-O-rutinoside, Kaempferol-3-O-glucoside, Theaflavin-3’-gallate, and gallic acid, were observed. The application of a linear regression model revealed 16 significant associations; theaflavin, L-theanine, and ECG were associated with several SNPs of the following genes: ANSa, DFRa, GDH2, 4CL, AlaAT1, MYB4, LHT1, F35Hb, and UFGTa. Among them, seven SNPs of moderate effect led to changes in the amino acid contents of the final proteins of the following genes: ANSa, GDH2, 4Cl, F35Hb, and UFGTa. Among the 18 SNPs that were found to be unique to the low-quality genotype #507, only two SNPs (in GDH2 and in 4CL) were observed to have significant associations with theaflavin and ECG and promote changes in protein structure. Our results will be useful for further analyses of the associations of these SNPs in broad germplasm diversity with respect to tea collection and for the development of molecular markers for trait-oriented tea breeding.

4. Materials and Methods

4.1. Plant Materials and Phenotypic Evaluation

The plant materials were obtained from the field gene bank of the Federal Research Centre the Subtropical Scientific Centre of the Russian Academy of Sciences (FRC SSC RAS). Mutant forms derived in USSR between 1970 and 1980 via the γ-irradiation of seeds (mostly cv. “Kolkhida”, cv. “Qimen”) were included in this study (Table S1). All plants were about 31–33 years old. All plants were clonally propagated with 30–60 replicates per genotype and grown on brown forest acid soil (pH 5.5) with a nitrogen content of 30 mg kg−1 (compared to the optimal 80 mg kg−1 N for tea plantation). No fertilizers have been applied in the experimental plot for the last 27 years.
The leaf-related traits were characterized using the ten most fully expanded mature leaves collected from each cultivar and each replicate. The leaf area size was classified for all 106 genotypes of the entire tea collection according to Wang and Tang [74]: (1) small-leaf (leaf area ≤ 20 cm2); (2) middle-leaf (leaf area 20–40 cm2); (3) large leaf (leaf area 40–60 cm2); and (4) extra-large leaf (leaf area ≥ 60 cm2).
Photosynthetic efficiency was analyzed in the dark-acclimated leaves using the JuniorPAM chlorophyll-fluorometer with default settings. Ten mature leaves from each plant were included in the analysis. After applying actinic light, the following parameters were analyzed: Fv/Fm—maximum photochemical quantum yield of PS II; Y(II)—Effective photochemical quantum yield of PS II; NPQ—Stern-Volmer type non-photochemical fluorescence quenching; and ETR—electron transport rate [62,63,64].
The leaf nitrogen content in the mature leaves was analyzed spectrophotometrically using the Kjeldahl method, which includes the digestion (samples were heated in the presence of sulfuric acid) and distillation of the solution and the conversion of ammonium salt to ammonia via the addition of sodium hydroxide, followed by trapping the distilled vapors in HCl–water solution. Finally, the amount of ammonia or the amount of nitrogen present in the sample was then determined via back titration via the neutralization of HCl using NaOH solution [75].
The contents of caffeine, L-theanine and catechins (gallocatechin (GC), epigallocatechin (EGC), epicatechin (EC), epicatechin gallate (ECG), gallocatechin gallate (GCG), and epigallocatechin gallate (EGCG)) (mg g−1 dry leaf mass) were evaluated via HPLC using the following extraction protocol: adult tea leaves (3–4 leaves from the top of the branch) were fixed via steam treatment at 100 °C for 20 min in a water bath and subsequently dried. Approximately 200 mg of dried tea leaves were placed into a hermetically sealed container containing 4.0 mL 80% methanol-water solution, which was subsequently incubated for one week at +4 °C in the dark. After that, the vessels with the methanol leaf extracts were placed in a UV bath for 30 min and then centrifuged at 13,000× g rpm 10 min. A total of 1 mL of supernatants were injected into a HPLC column. The Agilent Technologies 1100 HPLC chromatographer, equipped with a flow-through vacuum degasser G1379A, 4th channel low-pressure gradient channel pump G13111A, automatic injector G1313A, column thermostat G13116A, and diode array detector G1316A, was used. The 2.1 × 150 mm column filled with octadecyl silyl sorbent, grain size of 3.5 µm, “ZORBAX-XDB C18” was applied. The acetonitrile solution was used for the gradient; the initial composition of the mobile phase, consisting of 90% (v/v) of solvent A (0.1% H3PO4) and 10% of solvent B (90.0% acetonitrile), was maintained for 8 min. Solvent A was then decreased linearly to 40% at 25 min and 0% at 90 min before being increased to 100% at 29.1 min to 34 min. Programming was then continued in the isocratic mode as follows: 40% A at 70.1 to 75.0 min and 7% A at 75.1 to 90.1 min (flow rate of 0.30 mL/min, column temperature of 40 °C). The detection wavelengths were 195 nm for L-theanine and 273 nm for caffeine and catechins. The identification of the substances was performed based on the holding time of the standards of the respective compounds.

4.2. Gene Selection and Primer Design and Long-Range Polymerase Chain Reaction (LR-PCR)

Thirty target genes were selected from the literature data (Table S2). The flanking primers were designed based on the reference tea genome Camellia sinensis var. sinensis cv. Shuchazao [76,77] using the following instruments: Primer3web https://primer3.ut.ee/ (accessed on 21 September 2023), GeneAlign https://pubmed.ncbi.nlm.nih.gov/16845010/ (accessed on 21 September 2023), OligoCalc https://pubmed.ncbi.nlm.nih.gov/17452344/ (accessed on 21 September 2023), https://www.ncbi.nlm.nih.gov/guide/sequence-analysis/ (accessed on 21 September 2023), https://molbiol-tools.ca/Alignments.htm (accessed on 21 September 2023), OligoAnalyzer https://eu.idtdna.com/pages/tools/oligoanalyzer (accessed on 21 September 2023), https://www.bioinformatics.org/sms/rev_comp.html (accessed on 21 September 2023) (Table 4).
The LR-PCR mixture of 20 µL consisted of 10 µL 2 × LR-PCR buffer containing a mix of HS-Taq and Pfu DNA-polymerases (Biolabmix, Novosibirsk, Russia https://biolabmix.ru/catalog/pcr/long-range/ (accessed on 21 September 2023), 0.3 µL (10 µM) of each primer (forward and reverse), sterile PCR water, and 1 µL of the DNA sample (50 ng µL−1). Amplification was performed in a MiniAmp thermal cycler (Thermo Fisher Scientific, USA) according to the following protocol: one cycle of preheating at 94 °C–4 min, 35 cycles of amplification (denaturation at 94 °C—20 s, annealing at 58–62 °C—20 s, elongation at 68 °C—2.5–5.5 min), and final elongation at 68 °C—10 min. The PCR products were separated in 2% agarose gel for 2.5 h at 90 V. After that, the fragments were cut out from the agarose gel, filtered through absorbent cotton [78], and then spined at 10,000× g for 15 min; 1/5 volume of acetate Na 3M and 80% volume of isopropanol were added, mixed, incubated vertically at −80 °C at 15 min, and centrifuged at 13,000× g for 20 min at +4 °C. Finally, the pellets were washed twice with 500 µL of 80% ethanol and dissolved in 10 µL of PCR water.

4.3. Pooled Amplicon Sequencing, Filtering and Variation Calling

For sequencing, one sample was obtained from each variety. To prepare fragment DNA libraries, we used PCR products that were obtained via the amplification of the target genes of tea collection. Fragment DNA libraries were prepared equimolarly from the mixed PCR products using the NEBNext Ultra II DNA Reagent Kit Library Prep Kit for Illumina according to the manufacturer’s protocol. Briefly, 526 ng of amplified PCR product was fragmented to 200–300 bp. using Covaris S220 with microTUBE-50 AFA Fiber Screw-Cap (Covaris, Woburn, MA, USA) in 50 µL of sterile water. Fragmented DNA was used for the further 3′ adenylation and ligation of the NEBNext Adapter for Illumina and following 3 cycles of amplification. A qualitative evaluation of the resulting libraries was carried out on an Agilent bioanalyzer TapeStation 4150 using High Sensitivity D5000 ScreenTape and High kits Sensitivity D5000 Reagents (Agilent, Santa Clara, CA, USA). A quantitative evaluation of the products was performed via real-time PCR using the KAPA Library Quantification Kit (KAPA biosystems, Wilmington, MA, USA).
The obtained fragments of the DNA library were mixed equimolarly into a pool and sequenced on the Illumina MiSeq via pair-end reads 76 + 76 bp. Sequencing data were demultiplexed via index sequences using the bcl2fastq v2.20.0.422 program with default parameters. In total, 184,000–392,000 pairs of reads were obtained for each DNA library. The initial quality assessment of the deep sequencing data was performed using the FastQC v0.11.2 software [79]. AdapterRemoval v2 programs [80] (with parameters --trimqualities, --minquality 20, --minlength 50) was used to remove adapters and low-quality sequences. A total of 94.34% of pairs of reads were preserved after filtering (Table S2).
Filtered data were mapped against the reference genome of tea plant (GCF_004153795.1). Mapping was performed using the bwa mem function from the package BWA programs [81]. The MarkDuplicates function of the picard-tools v2.22.2 (Picard toolkit [82]) software package was applied to remove duplicates. The quality of the alignments was evaluated using the Samtools v1.9 software package [83]. The depth coverage of the target genome regions was assessed using the CollectWgsMetrics function of picard-tools software package (https://broadinstitute.github.io/picard/ accessed on 21 September 2023) (with COVERAGE_CAP = 10,000 parameter). On average, 96.44% of reads were mapped to the tea genome. For each sample, on average, we obtained 229-fold coverage of the target genome regions of tea.
To control the raw read quality, FastQC (version 0.11.9) was used, and Trimmomatic (version 0.39) was employed with the parameters ‘ILLUMINACLIP:TruSeq3-PE-2.fa:2:30:10 LEADING:3 TRAILING:3 SLIDINGWINDOW:4:15 MINLEN:50’ to remove adapter sequences and low-quality sequences. The clean reads were aligned to the reference genome ‘Shuchazao’ with BWA-MEM (version 0.7.12) and sorted using SAMtools (version 1.16.1). To add read groups, GATK software (version 4.2) was used, and the GATK-HaplotypeCaller method was applied for variation calling. GATK software was used to select and filter SNPs/InDels according to the following parameters: ‘QD < 2.0||FS > 60.0||MQ < 40.0||SOR_filter||SOR > 4.0||DP < 10’ and ‘QD < 2.0||FS > 200.0||SOR > 10.0||DP < 10’, respectively. The database for the reference genome ‘Shuchazao’ was built using snpEFF (version 5.0) [72], which was then used to annotate the remaining variations. SnpEff tool variation annotation provided the effect impact classifications (high, moderate, low, or modifier). These impact variations are genetic variants predicted to cause a severe, moderate, low, or indirect effect on the protein.
SNP density was calculated as mean SNP per gene/fragment length of gene in kb. To obtain an overview of the SNP distribution and the possible enrichments of the SNPs for the genes, we normalized the SNP frequency in each gene. The SNP frequency in each gene was calculated using the following formula:
SNP_freq = (SNP_count/per_gene)/gene length × 103
where SNP_count/per_gene is the amount of the SNPs detected in a certain gene, and gene_length is the length of the gene. The factor 103 was applied to the denominator to leverage the SNP_Freq values in order to facilitate a fair and easy comparison.

4.4. Statistical Analysis

Statistical analyses of the data were carried out using XLSTAT software (free trial version) (https://www.xlstat.com/ Accessed on 21 September 2023). A one-way ANOVA, Student’s t-test, and Tukey’s test were applied to determine the significant differences between the variants. Additionally, hierarchical clustering was performed, and dissimilarities were calculated using the DICE coefficient (with agglomeration using Ward’s method). Additionally, a principal component analysis was conducted based on Pearson (n) correlations. To find the associations between SNPs and the phenotypes, a linear regression model was applied in conjunction with a statistical test adjusted for multiple comparisons (Bonferroni), with significant associations being noted at p values < 0.05.

Supplementary Materials

The following supporting information can be downloaded at: https://www.mdpi.com/article/10.3390/ijms241914538/s1.

Author Contributions

Conceptualization, L.S. and L.M.; methodology, J.F., K.M. and D.K.; software, J.F., K.M. and D.K.; validation, J.F., L.S. and L.M.; formal analysis, Z.Z., W.T. and E.X.; investigation, J.F., T.K., A.M. and D.K.; resources, A.R., L.M. and L.S.; data curation, E.K.K., E.X. and Z.Z.; writing—original draft preparation, J.F. and L.S.; writing—review and editing, E.X., Z.Z., E.K.K., L.M. and Y.L.O.; visualization, L.S., D.K., J.F. and K.M.; supervision, L.S., L.M. and E.K.K.; project administration, L.M. and A.R.; funding acquisition, L.M. and L.S. All authors have read and agreed to the published version of the manuscript.

Funding

LR-PCR sequencing and the identification of SNPs were funded by a grant from the Russian Science Foundation (# 22-16-00058) (https://rscf.ru/prjcard_int?22-16-00058 Accessed on 21 September 2023) and conducted at the Center of Genetics and Life Science, Sirius University of Science and Technology (Sochi, Russia). The phenotypical characterization of the tea collection was funded via a grant from the Russian Science Foundation (# 18-76-10001) (https://rscf.ru/project/21-76-03003/ Accessed on 21 September 2023) and conducted at the Federal Research Centre the Subtropical Scientific Centre of the Russian Academy of Sciences.

Institutional Review Board Statement

Not applicable.

Informed Consent Statement

Not applicable.

Data Availability Statement

All sequencing data are available in NCBI project # PRJNA97758.4.

Acknowledgments

We are grateful to the State Key Laboratory of Tea plant Biology and Utilization Anhui Agricultural University and Vavilov All-Russian Institute of Plant Genetic Resources for data support and methodological assistance. We are grateful to Agrarian and Technological Institute, Peoples’ Friendship University of Russia for publication assistance.

Conflicts of Interest

The authors declare no conflict of interest.

References

  1. Sedaghathoor, S.; Torkashvand, A.M.; Hashemabadi, D.; Kaviani, B. Yield and quality response of tea plant to fertilizers. Afr. J. Agric. Res. 2009, 4, 568–570. [Google Scholar]
  2. Cao, Q.; Cao, Q.; Yang, G.; Duan, D.; Chen, L.; Wang, F.; Xu, B.; Zhao, C.; Niu, F. Combining multispectral and hyperspectral data to estimate nitrogen status of tea plants (Camellia sinensis (L.) O. Kuntze) under field conditions. Comput. Electron. Agric. 2022, 198, 107084. [Google Scholar] [CrossRef]
  3. Zavalin, A.A.; Sokolov, O.A. Nitrogen Fluxes in the Agroecosystem: From the Ideas of D.N. Pryanishnikov to the Present Day; VNIIA: Moscow, Russia, 2016. [Google Scholar]
  4. Li, W.; Zhong, M.; Zhou, L.; Liu, H.; Li, S.; Wang, X. Transcriptome and metabolite analysis identifies nitrogen utilization genes in tea plant (Camellia sinensis). Sci. Rep. 2017, 7, 1693. [Google Scholar] [CrossRef] [PubMed]
  5. Huang, H.; Yao, Q.; Xia, E.; Gao, L. Metabolomics and Transcriptomics Analyses Reveal Nitrogen Influences on the Accumulation of Flavonoids and Amino Acids in Young Shoots of Tea Plant (Camellia sinensis L.) Associated with Tea Flavor. J. Agric. Food Chem. 2018, 66, 9828–9838. [Google Scholar] [CrossRef] [PubMed]
  6. Zhang, X.; Liu, H.; Pilon-Smits, E.; Huang, W.; Wang, P.; Wang, M.; Guo, F.; Wang, Y.; Li, R.; Zhao, H.; et al. Transcriptome-wide analysis of nitrogen-regulated genes in tea plant (Camellia sinensis LO Kuntze) and characterization of amino acid transporter CsCAT9. Plants 2020, 9, 1218. [Google Scholar] [CrossRef] [PubMed]
  7. Cochetel, N.; Escudié, F.; Cookson, S.J.; Dai, Z.; Vivin, P.; Bert, P.-F.; Muñoz, M.S.; Delrot, S.; Klopp, C.; Ollat, N.; et al. Root transcriptomic responses of grafted grapevines to heterogeneous nitrogen availability depend on rootstock genotype. J. Exp. Bot. 2017, 68, 4339–4355. [Google Scholar] [CrossRef] [PubMed]
  8. Gojon, A.; Krouk, G.; Perrine-Walker, F.; Laugier, E. Nitrate transceptor(s) in plants. J. Exp. Bot. 2011, 62, 2299–2308. [Google Scholar] [CrossRef]
  9. Medici, A.; Krouk, G. The primary nitrate response: A multifaceted signalling pathway. J. Exp. Bot. 2014, 65, 5567–5576. [Google Scholar] [CrossRef]
  10. O’Brien, J.A.; Vega, A.; Bouguyon, E.; Krouk, G.; Gojon, A.; Coruzzi, G.; Gutiérrez, R.A. Nitrate transport, sensing, and responses in plants. Mol. Plant 2016, 9, 837–856. [Google Scholar] [CrossRef]
  11. Ruffela, S.; Krouka, G.; Ristovaa, D.; Shashac, D.; Birnbauma, K.D.; Coruzzi, G.M. Nitrogen economics of root foraging: Transitive closure of the nitrate–cytokinin relay and distinct systemic signaling for N supply vs. demand. Proc. Natl. Acad. Sci. USA 2011, 108, 18524–18529. [Google Scholar] [CrossRef]
  12. Alvarez, J.M.; Vidal, E.A.; Gutiérrez, R.A. Integration of local and systemic signaling pathways for plant N responses. Curr. Opin. Plant Biol. 2012, 15, 185–191. [Google Scholar] [CrossRef]
  13. Bouguyon, E.; Gojon, A.; Nacry, P. Nitrate sensing and signaling in plants. In Seminars in Cell & Developmental Biology; Academic Press: Cambridge, MA, USA, 2012; Volume 23, pp. 648–654. [Google Scholar] [CrossRef]
  14. Nacry, P.; Bouguyon, E.; Gojon, A. Nitrogen acquisition by roots: Physiological and developmental mechanisms ensuring plant adaptation to a fluctuating resource. Plant Soil 2013, 370, 1–29. [Google Scholar] [CrossRef]
  15. Krapp, A.; David, L.C.; Chardin, C.; Girin, T.; Marmagne, A.; Leprince, A.-S.; Chaillou, S.; Ferrario-Méry, S.; Meyer, C.; Daniel-Vedele, F. Nitrate transport and signalling in Arabidopsis. J. Exp. Bot. 2014, 65, 789–798. [Google Scholar] [CrossRef]
  16. Krapp, A. Plant nitrogen assimilation and its regulation: A complex puzzle with missing pieces. Curr. Opin. Plant Biol. 2015, 25, 115–122. [Google Scholar] [CrossRef]
  17. Li, Y.; Krouk, G.; Coruzzi, G.M.; Ruffel, S. Finding a nitrogen niche: A systems integration of local and systemic nitrogen signaling in plants. J. Exp. Bot. 2014, 65, 5601–5610. [Google Scholar] [CrossRef]
  18. Gan, Y.; Bernreiter, A.; Filleur, S.; Abram, B.; Forde, B.G. Overexpressing the ANR1 MADS-box gene in transgenic plants provides new insights into its role in the nitrate regulation of root development. Plant Cell Physiol. 2012, 53, 1003–1016. [Google Scholar] [CrossRef]
  19. Mounier, E.; Pervent, M.; Ljung, K.; Gojon, A.; Nacry, P. Auxin-mediated nitrate signaling by NRT1.1 participates in the adaptive response of Arabidopsis root architecture to the spatial heterogeneity of nitrate availability. Plant Cell Environ. 2014, 37, 162–174. [Google Scholar] [CrossRef]
  20. Kiba, T.; Feria-Bourrellier, A.-B.; Lafouge, F.; Lezhneva, L.; Boutet-Mercey, S.; Orsel, M.; Bréhaut, V.; Miller, A.; Daniel-Vedele, F.; Sakakibara, H.; et al. The Arabidopsis nitrate transporter NRT2.4 plays a double role in roots and shoots of nitrogen-starved plants. Plant Cell 2012, 24, 245–258. [Google Scholar] [CrossRef]
  21. Ruffel, S.; Gojon, A.; Lejay, L. Signal interactions in the regulation of root nitrate uptake. J. Exp. Bot. 2014, 65, 5509–5517. [Google Scholar] [CrossRef]
  22. Tabata, R.; Sumida, K.; Yoshii, T.; Ohyama, K.; Shinohara, H.; Matsubayashi, Y. Perception of root-derived peptides by shoot LRR-RKs mediates systemic N-demand signaling. Science 2014, 346, 343–346. [Google Scholar] [CrossRef]
  23. Krouk, G. Hormones and nitrate: A two-way connection. Plant Mol. Biol. 2016, 91, 599–606. [Google Scholar] [CrossRef] [PubMed]
  24. Ohkubo, Y.; Tanaka, M.; Tabata, R.; Ogawa-Ohnishi, M.; Matsubayashi, Y. Shoot-to-root mobile polypeptides involved in systemic regulation of nitrogen acquisition. Nat. Plants 2017, 3, 17029. [Google Scholar] [CrossRef] [PubMed]
  25. Chen, L.; Apostolides, Z.; Chen, Z.M. Global Tea Breeding; Chen, L., Apostolides, Z., Chen, Z.M., Eds.; Springer: Berlin/Heidelberg, Germany, 2012; Volume 378, p. 588. [Google Scholar]
  26. Jayasinghe, S.L.; Kumar, L. Potential impact of the current and future climate on the yield, quality, and climate suitability for tea [Camellia sinensis (L.) O. Kuntze]: A systematic review. Agronomy 2021, 11, 619. [Google Scholar] [CrossRef]
  27. Pan, S.Y.; Nie, Q.; Tai, H.C.; Song, X.L.; Tong, Y.F.; Zhang, L.J.; Wu, X.W.; Lin, Z.H.; Zhang, Y.Y.; Ye, D.Y.; et al. Tea and tea drinking: China’s outstanding contributions to the mankind. Chin. Med. 2022, 17, 27. [Google Scholar] [CrossRef]
  28. Available online: www.fao.org/faostat/ (accessed on 30 May 2023).
  29. Mamati, G.E.; Liang, Y.; Lu, J. Expression of basic genes involved in tea polyphenol synthesis in relation to accumulation of catechins and total tea polyphenols. J. Sci. Food Agric. 2006, 86, 459–464. [Google Scholar] [CrossRef]
  30. Mahmood, T.; Akhtar, N.; Khan, B.A. The morphology, characteristics and medicinal properties of Camellia sinensis tea. J. Med. Plants Res. 2010, 4, 2028–2033. [Google Scholar] [CrossRef]
  31. Donlao, N.; Ogawa, Y. The influence of processing conditions on catechin, caffeine and chlorophyll contents of green tea (Camelia sinensis) leaves and infusions. LWT 2019, 116, 108567. [Google Scholar] [CrossRef]
  32. Zhu, J.Y.; Xu, Q.; Zhao, S.; Xia, X.; Yan, X.; An, Y.; Mi, X.; Guo, L.; Samarina, L.; Wei, C. Comprehensive co-expression analysis provides novel insights into temporal variation of flavonoids in fresh leaves of the tea plant (Camellia sinensis). Plant Sci. 2020, 290, 110306. [Google Scholar] [CrossRef]
  33. Li, F.; Dong, C.; Yang, T.; Bao, S.; Fang, W.; Lucas, W.J.; Zhang, Z. The tea plant CsLHT1 and CsLHT6 transporters take up amino acids, as a nitrogen source, from the soil of organic tea plantations. Hortic. Res. 2021, 8, 178. [Google Scholar] [CrossRef]
  34. Samynathan, R.; Thiruvengadam, M.; Nile, S.H.; Shariati, M.A.; Rebezov, M.; Mishra, R.K.; Venkidasamy, B.; Periyasamy, S.; Chung, I.M.; Pateiro, M.; et al. Recent insights on tea metabolites, their biosynthesis and chemo-preventing effects: A review. Crit. Rev. Food Sci. Nutr. 2023, 63, 3130–3149. [Google Scholar] [CrossRef]
  35. Fang, K.X.; Xia, Z.; Li, H.; Jiang, X.; Qin, D.; Wang, Q.; Wang, Q.; Pan, C.; Li, B.; Wu, H. Genome-wide association analysis identified molecular markers associated with important tea flavor-related metabolites. Hortic. Res. 2021, 8, 42. [Google Scholar] [CrossRef] [PubMed]
  36. Hollman, P.C.; Feskens, E.J.; Katan, M.B. Tea flavonols in cardiovascular disease and cancer epidemiology. Proc. Soc. Exp. Biol. Med. 1999, 220, 198–202. [Google Scholar] [CrossRef]
  37. Auvichayapat, P.; Prapochanung, M.; Tunkamnerdthai, O.; Sripanidkulchai, B.O.; Auvichayapat, N.; Thinkhamrop, B.; Kunhasura, S.; Wongpratoom, S.; Sinawat, S.; Hongprapas, P. Effectiveness of green tea on weight reduction in obese Thais: A randomized, controlled trial. Physiol. Behav. 2008, 93, 486–491. [Google Scholar] [CrossRef] [PubMed]
  38. Kurita, I.; Maeda-Yamamoto, M.; Tachibana, H.; Kamei, M. Antihypertensive effect of Benifuuki tea containing O-methylated EGCG. J. Agric. Food Chem. 2010, 58, 1903–1908. [Google Scholar] [CrossRef] [PubMed]
  39. Sasazuki, S.; Tamakoshi, A.; Matsuo, K.; Ito, H.; Wakai, K.; Nagata, C.; Mizoue, T.; Tanaka, K.; Tsuji, I.; Inoue, M.; et al. Green tea consumption and gastric cancer risk: An evaluation based on a systematic review of epidemiologic evidence among the Japanese population. JpnJ Clin Oncol. 2012, 42, 335–346. [Google Scholar] [CrossRef] [PubMed]
  40. Hodgson, J.M.; Croft, K.D.; Woodman, R.J.; Puddey, I.B.; Fuchs, D.; Draijer, R.; Lukoshkova, E.; Head, G.A. Black tea lowers the rate of blood pressure variation: A randomized controlled trial. Am. J. Clin. Nutr. 2013, 97, 943–950. [Google Scholar] [CrossRef]
  41. Ng, K.W.; Cao, Z.J.; Chen, H.B.; Zhao, Z.Z.; Zhu, L.; Yi, T. Oolong tea: A critical review of processing methods, chemical composition, health effects, and risk. Crit. Rev. Food Sci. Nutr. 2018, 58, 2957–2980. [Google Scholar] [CrossRef]
  42. Kuban-Jankowska, A.; Kostrzewa, T.; Musial, C.; Barone, G.; Lo Bosco, G.; Lo Celso, F.; Gorska-Ponikowska, M. Green tea catechins induce inhibition of PTP1B phosphatase in breast cancer cells with potent anti-cancer properties: In vitro assay, molecular docking, and dynamics studies. Antioxidants 2020, 9, 1208. [Google Scholar] [CrossRef]
  43. Fujimura, Y.; Fujino, K.; Yoshimoto, T.; Nezu, A.; Marugame, Y.; Bae, J.; Kumazoe, M.; Tachibana, H. Eriodictyol-Amplified 67-kDa laminin receptor signaling potentiates the antiallergic effect of O-Methylated catechin. J. Nat. Prod. 2021, 84, 1823–1830. [Google Scholar] [CrossRef]
  44. Zhang, L.Q.; Wei, K.; Cheng, H.; Wang, L.-Y.; Zhang, C.-C. Accumulation of catechins and expression of catechin synthetic genes in Camellia sinensis at different developmental stages. Bot. Stud. 2016, 57, 31. [Google Scholar] [CrossRef]
  45. Fang, R.; Redfern, S.P.; Kirkup, D.; Porter, E.A.; Kite, G.C.; Terry, L.A.; Berry, M.J.; Simmonds, M.S. Variation of theanine, phenolic, and methylxanthine compounds in 21 cultivars of Camellia sinensis harvested in different seasons. Food Chem. 2017, 220, 517–526. [Google Scholar] [CrossRef] [PubMed]
  46. Chen, C.S.; Wei, K.; Wang, L.; Ruan, L.; Li, H.; Zhou, X.; Lin, Z.; Shan, R.; Cheng, H. Expression of key structural genes of the phenylpropanoid pathway associated with catechin epimerization in tea cultivars. Front. Plant Sci. 2017, 8, 702. [Google Scholar] [CrossRef] [PubMed]
  47. Luo, Y.; Yu, S.; Li, J.; Li, Q.; Wang, K.; Huang, J.; Liu, Z. Molecular characterization of WRKY transcription factors that act as negative regulators of O-methylated catechin biosynthesis in tea plants (Camellia sinensis L.). J. Agric. Food Chem. 2018, 66, 11234–11243. [Google Scholar] [CrossRef]
  48. Wang, W.Z.; Zhou, Y.; Wu, Y.; Dai, X.; Liu, Y.; Qian, Y.; Li, M.; Jiang, X.; Wang, Y.; Gao, L.; et al. Insight into catechins metabolic pathways of Camellia sinensis based on genome and transcriptome analysis. J. Agric. Food Chem. 2018, 66, 4281–4293. [Google Scholar] [CrossRef]
  49. Cui, X.; Zhao, P.; Liang, W.; Cheng, Q.; Mu, B.; Niu, F.; Yan, J.; Liu, C.; Xie, H.; Kav, N.N.V.; et al. A Rapeseed WRKY transcription factor phosphorylated by CPK modulates cell death and leaf senescence by regulating the expression of ROS and SA-Synthesis-Related genes. J. Agric. Food Chem. 2020, 68, 7348–7359. [Google Scholar] [CrossRef]
  50. Su, H.; Zhang, X.; He, Y.; Li, L.; Wang, Y.; Hong, G.; Xu, P. Transcriptomic analysis reveals the molecular adaptation of three major secondary metabolic pathways to multiple macronutrient starvation in tea (Camellia sinensis). Genes 2020, 11, 241. [Google Scholar] [CrossRef]
  51. Malyukova, L.S.; Samarina, L.S.; Zagoskina, N.V. Genetic mechanisms of the biosynthesis of catechins, caffeine and L-theanine in the tea plant Camellia sinensis (L.) Kuntze (review). Sel’skokhozyaistvennaya Biol. 2022, 57, 882–896. [Google Scholar] [CrossRef]
  52. Kong, W.; Jiang, M.; Wang, Y.; Chen, S.; Zhang, S.; Lei, W.; Chai, K.; Wang, P.; Liu, R.; Zhang, X. Pan-transcriptome assembly combined with multiple association analysis provides new insights into the regulatory network of specialized metabolites in the tea plant Camellia sinensis. Hortic. Res. 2022, 9, uhac100. [Google Scholar] [CrossRef]
  53. Chen, C.F.; Lin, J.Y. Estimating the gross budget of applied nitrogen and phosphorus in tea plantations. Sustain. Environ. Res. 2016, 26, 124–130. [Google Scholar] [CrossRef]
  54. Yan, P.; Shen, C.; Fan, L.; Li, X.; Zhang, L.; Zhang, L.; Han, W. Tea planting affects soil acidification and nitrogen and phosphorus distribution in soil. Agric Ecosyst. Environ. 2018, 254, 20–25. [Google Scholar] [CrossRef]
  55. Ruan, J.Y.; Ma, L.; Shi, Y.; Han, W. Uptake of fluoride by tea plant (Camellia sinensis L) and the impact of aluminium. J. Sci. Food Agric. 2003, 83, 1342–1348. [Google Scholar] [CrossRef]
  56. Yang, X.D.; Ma, L.; Ji, L.; Shi, Y.; Yi, X.; Yang, Q.; Ni, K.; Ruan, J. Long-term nitrogen fertilization indirectly affects soil fungi community structure by changing soil and pruned litter in a subtropical tea (Camellia sinensis L.) plantation in China. Plant Soil. 2019, 444, 409–426. [Google Scholar] [CrossRef]
  57. Fan, K.; Zhang, Q.; Tang, D.; Shi, Y.; Ma, L.; Liu, M.; Ruan, J. Dynamics of nitrogen translocation from mature leaves to new shoots and related gene expression during spring shoots development in tea plants (Camellia sinensis L.). J. Plant Nutr. Soil Sci. 2020, 183, 180–191. [Google Scholar] [CrossRef]
  58. Zhang, F.; He, W.; Yuan, Q.; Wei, K.; Ruan, L.; Wang, L.; Cheng, H. Transcriptome analysis identifies CsNRT genes involved in nitrogen uptake in tea plants, with a major role of CsNRT2. 4. Plant Physiol. Biochem. 2021, 167, 970–979. [Google Scholar] [CrossRef]
  59. Wang, Y.; Cheng, Y.; Yang, T.; Su, Y.; Lin, S.; Zhang, S.; Zhang, Z. Nitrogen-regulated theanine and flavonoid biosynthesis in tea plant roots: Protein-level regulation revealed by multiomics analyses. J. Agric. Food Chem. 2021, 69, 10002–10016. [Google Scholar] [CrossRef] [PubMed]
  60. Dinkeloo, K.; Boyd, S.; Pilot, G. Update on amino acid transporter functions and on possible amino acid sensing mechanisms in plants. Semin Cell Dev. Biol. 2018, 74, 105–113. [Google Scholar] [CrossRef]
  61. Fernández-Escobar, R.; Antonaya-Baena, F.; Almeida-Lavado, S. Nitrogen Uptake Efficiency of Olive Cultivars. Horticulturae 2021, 7, 136. [Google Scholar] [CrossRef]
  62. Kitajima, M.; Butler, W.L. Quenching of chlorophyll fluorescence and primary photochemistry in chloroplasts by dibromothymoquinone. Biochim. Biophys. Acta 1975, 376, 105–115. [Google Scholar] [CrossRef]
  63. Genty, B.; Briantais, J.-M.; Baker, N.R. The relationship between the quantum yield of photosynthetic electron transport and quenching of chlorophyll fluorescence. Biochim Biophys Acta 1989, 990, 87–92. [Google Scholar] [CrossRef]
  64. Brugnoli, E.; Björkman, O. Chloroplast movements in leaves: Influence on chlorophyll fluorescence and measurements of light-induced absorbance changes related to ΔpH and zeaxanthin formation. Photosynth. Res. 1992, 32, 23–35. [Google Scholar] [CrossRef]
  65. Ye, J.; Wang, Y.; Kang, J.; Chen, Y.; Hong, L.; Li, M.; Jia, Y.; Wang, Y.; Jia, X.; Wu, Z.; et al. Effects of Long-Term Use of Organic Fertilizer with Different Dosages on Soil Improvement, Nitrogen Transformation, Tea Yield and Quality in Acidified Tea Plantations. Plants 2022, 12, 122. [Google Scholar] [CrossRef]
  66. Wang, W.; Xin, H.; Wang, M.; Ma, Q.; Wang, L.; Kaleri, N.A.; Wang, Y.; Li, X. Transcriptomic Analysis Reveals the Molecular Mechanisms of Drought-Stress-Induced Decreases in Camellia sinensis Leaf Quality. Front Plant Sci. 2016, 7, 385. [Google Scholar] [CrossRef] [PubMed]
  67. Xie, X.; Sun, Z.; Zhang, X.; Han, X. Novel Aspects of Regulation of Nitrogen Responses in the Tea Plant (Camellia sinensis (L.)). Agronomy 2023, 13, 144. [Google Scholar] [CrossRef]
  68. Li, M.; Guo, L.; Wang, Y.; Li, Y.; Jiang, X.; Liu, Y.; Xie, D.; Gao, L.; Xia, T. Molecular and biochemical characterization of two 4-coumarate: CoA ligase genes in tea plant (Camellia sinensis). Plant Mol. Biol. 2022, 109, 579–593. [Google Scholar] [CrossRef] [PubMed]
  69. Ruan, J.Y.; Gerendas, J.; Hardter, R.; Sattelmacher, B. Effect of nitrogen form and root-zone pH on growth and nitrogen uptake of tea (Camellia sinensis L.) plants. Ann. Bot. 2008, 99, 301–310. [Google Scholar] [CrossRef]
  70. Yang, Y.Y.; Li, X.H.; Ratcliffe, R.G.; Ruan, J.Y. Characterization of ammonium and nitrate uptake and assimilation in roots of tea plants. Russ. J. Plant Physiol. 2013, 60, 91–99. [Google Scholar]
  71. Fan, K.; Fan, D.; Ding, Z.; Su, Y.; Wang, X. Cs-miR156 is involved in thenitrogen form regulation of catechins accumulation in tea plant (Camellia sinensis L.). Plant Physiol. Bioch. 2015, 97, 350–360. [Google Scholar] [CrossRef]
  72. Cingolani, P.; Platts, A.; Wang, L.; Coon, M.; Nguyen, T.; Wang, L.; Land, S.J.; Lu, X.; Ruden, D.M. A program for annotating and predicting the effects of single nucleotide polymorphisms, SnpEff. Fly 2012, 6, 80–92. [Google Scholar] [CrossRef]
  73. Tang, D.; Jiao, Z.; Zhang, Q.; Liu, M.Y.; Ruan, J. Glutamate dehydrogenase isogenes CsGDHs cooperate with glutamine synthetase isogenes CsGSs to assimilate ammonium in tea plant (Camellia sinensis L.). Plant Sci. 2021, 312, 111031. [Google Scholar] [CrossRef]
  74. Wang, C.M.; Tang, Q. Investigation of wild germplasm resources of loquat tea in Chongzhou. Southwest China J. Agric. Sci. 2012, 25, 642–648. [Google Scholar]
  75. Ates, F.; Kaya, O. The Relationship Between Iron and Nitrogen Concentrations Based On Kjeldahl Method and SPAD-502 Readings in Grapevine (Vitis vinifera L. cv. ‘Sultana Seedless’). Erwerbs-Obstbau 2021, 63, S53–S59. [Google Scholar] [CrossRef]
  76. Wei, C.; Yang, H.; Wang, S.; Zhao, J.; Liu, C.; Gao, L.; Xia, E.; Lu, Y.; Tai, Y.; She, G.; et al. Draft genome sequence of Camellia sinensis var. sinensis provides insights into the evolution of the tea genome and tea quality. Proc. Natl. Acad. Sci. USA 2018, 115, E4151–E4158. [Google Scholar] [CrossRef] [PubMed]
  77. Xia, E.H.; Li, F.D.; Tong, W.; Li, P.H.; Wu, Q.; Zhao, H.J.; Ge, R.H.; Li, R.P.; Li, Y.Y.; Zhang, Z.Z.; et al. Tea Plant Information Archive: A comprehensive genomics and bioinformatics platform for tea plant. Plant Biotechnol. J. 2019, 17, 1938–1953. [Google Scholar] [CrossRef] [PubMed]
  78. Sun, Y.; Sriramajayam, K.; Luo, D.; Liao, D.J. A Quick, Cost-Free Method of Purification of DNA Fragments from Agarose Gel. J. Cancer 2012, 3, 93–95. [Google Scholar] [CrossRef]
  79. Andrews, S. FastQC: A Quality Control Tool for High Throughput Sequence Data. 2010. Available online: http://www.bioinformatics.babraham.ac.uk/projects/fastqc (accessed on 15 September 2023).
  80. Schubert, M.; Lindgreen, S.; Orlando, L. AdapterRemoval v2: Rapid adapter trimming, identification, and read merging. BMC Res. Notes 2016, 9, 88. [Google Scholar] [CrossRef]
  81. Li, H.; Durbin, R. Fast and accurate short read alignment with Burrows-Wheeler transform. Bioinformatics 2009, 25, 1754–1760. [Google Scholar] [CrossRef]
  82. Picard Toolkit [Online Tool]. Available online: http://broadinstitute.github.io/picard/ (accessed on 30 May 2023).
  83. Li, H.; Handsaker, B.; Wysoker, A.; Fennell, T.; Ruan, J.; Homer, N.; Marth, G.; Abecasis, G.; Durbin, R. 1000 Genome Project Data Processing Subgroup. The Sequence Alignment/Map format and SAMtools. Bioinformatics 2009, 25, 2078–2079. [Google Scholar] [CrossRef]
Figure 1. Leaf quality characteristics of the analyzed mutant forms. (A) Nitrogen content (%), theanine content (mg g−1), caffeine content (mg g−1) in dry leaf mass. (B) Simple catechins content (mg g−1 dry leaf mass). (C) Gallate catechins content (mg g−1 dry leaf mass). Different lowercase letters indicate significant differences according to Tukey’s range test (p ≤ 0.05).
Ijms 24 14538 g001
Figure 2. The efficiency of photosynthesis in 20 tea genotypes. (A) Photochemical yield (Fv/Fm). (B) Operating efficiency of the PSII. (C) Electron transport rate. (D) Non-photochemical quenching. Different lowercase letters indicate significant differences according to Tukey’s range test (p < 0.05).
Ijms 24 14538 g002
Figure 3. Pearson correlations between different biochemical parameters. Statistically significant Pearson correlations at p ≤ 0.05 are indicated by colored cells.
Ijms 24 14538 g003
Figure 4. SNPs’ effect (A) and impact (B) on the phenotypes of 20 tea genotypes.
Ijms 24 14538 g004
Figure 5. Heatmap of exon SNP frequencies calculated according to the following: SNP_freq = SNP_count_per_gene/gene length × 103. The columns represent the tea genotypes, and the rows represent the different genes.
Ijms 24 14538 g005
Table 1. Leaf trait characteristics of the analyzed mutant forms. Different lowercase letters indicate significant differences according to Tukey’s range test (p < 0.05).
GenotypeBreeding StatusOriginLeaf Area, cm2 ± SDGroup
#507mutant formɣ-mutant40.8 ± 4.1 cMiddle
#3574mutant formɣ-mutant46.1 ± 4.6 cLarge
#855mutant formɣ-mutant55.6 ± 3.9 bcLarge
#527mutant formɣ-mutant57.4 ± 5.0 bcLarge
#3986mutant formɣ-mutant58.2 ± 5.1 bcLarge
#551mutant formɣ-mutant65.6 ± 5.9 bExtra-large
#157mutant formɣ-mutant66.5 ± 5.8 bExtra-large
#3180mutant formɣ-mutant68.0 ± 6.0 bExtra-large
#536mutant formɣ-mutant68.7 ± 6.2 bExtra-large
#1405mutant formɣ-mutant69.8 ± 6.0 bExtra-large
#1877mutant formɣ-mutant70.6 ± 6.3 bExtra-large
#582mutant formɣ-mutant 71.0 ± 6.3 bExtra-large
#1467mutant formɣ-mutant74.9 ± 6.7 bExtra-large
KaratumCultivarSport mutation83.3 ± 6.5 abExtra-large
#1385mutant formɣ-mutant83.8 ± 7.1 abExtra-large
#212breeding lineClonal selection84.6 ± 7.1 abExtra-large
#1102mutant formɣ-mutant92.4 ± 8.3 aExtra-large
#316mutant formɣ-mutant 97.3 ± 7.2 aExtra-large
#2697mutant formɣ-mutant 112.3 ± 7.0 aExtra-large
#619mutant formɣ-mutant149.1 ± 7.3 aExtra-large
Table 2. The distribution of SNPs in the intron and exon regions of the target genes (N = 20). SNP density was calculated as mean SNP per gene/fragment length of gene in kb. Blue colors indicate lowest rates while red colors indicate highest rates of each parameter.
GeneFragment Length, bpMean SNPs Number in IntronsMean SNPs Number in ExonsSNP Density in IntronsSNP Density in ExonsSNP % in Exons
F35Hb44356.257.601.411.7154.87
MYB453428.8501.051.660.2010.61
LHT151073.501.400.690.2728.57
4CL526431.859.956.051.8923.80
AMT1.226439.455.753.582.1837.83
GS1.2620258.054.859.360.787.71
DFRa66004.454.350.670.6649.43
WRKY5711,21441.854.253.730.389.22
NRT2.4306010.504.153.431.3628.33
F35H_a511811.353.252.220.6422.26
AlaDC72275.001.850.690.2627.01
PIP20062.251.251.120.6235.71
bG86050.200.650.020.0876.47
WD40384402.050.550.530.1421.15
GDH249154.500.200.920.044.26
LAR86000.450.10.050.0118.18
AlaAT180581.850.050.230.012.63
bHLH3557433.350.050.580.011.47
MYB733760.050.000.010.000.00
bHLH3629530.250.000.080.000.00
Table 3. Significant associations between SNPs and the phenotypes at p value < 0.05. Italics indicate the SNPs with moderate effect where amino acids have changed. The SNPs specific for #507 are presented in bold italics.
SNPsGenePositionGenotype (REF/ALT)Phenotypep ValueAmino (REF/ALT)Property (REF/ALT)
SNP2ANSa1026570G/TL-Theanine6.376794 × 10−8
SNP3ANSa1026588A/CTheaflavin3.458851 × 10−6
SNP6ANSa1027478A/GTheaflavin3.458851 × 10−6p.Leu165ProHydrophobic/
Unique
SNP11DFRa1286200C/TECG/
Theabromine
0.0001012753/
1.208252 × 10⁻⁶
SNP16GDH21343623T/CECG/
Theabromine
0.0001012753/
1.208252 × 10⁻⁶
p.Lys368ArgCharged_basic/
Charged_basic
SNP674CL2130618C/AL-Theanine1.841082 × 10−6
SNP184AlaAT1531832A/GL-Theanine6.376794 × 10−8
SNP594CL2130419A/GTheaflavin3.458851 × 10−6p.Asn15SerNeutral/Neutral
SNP604CL2130421A/TTheaflavin3.458851 × 10−6p.Thr16SerNeutral/Neutral
SNP684CL2130888T/CTheaflavin3.458851 × 10−6
SNP120MYB4254145A/GTheaflavin3.458851 × 10−6
SNP187LHT1565216G/ATheaflavin3.458851 × 10−6
SNP193F35Hb649286T/ATheaflavin3.458851 × 10−6p.Lys505MetCharged_basic/
Hydrophobic
SNP194F35Hb649465G/ATheaflavin0.0001046889
SNP195F35Hb649575G/ATheaflavin3.458851 × 10−6p.Pro409SerHydrophobic+ Unique/
Neutral
SNP260UFGTa883919A/GTheaflavin3.458851 × 10−6p.Thr274AlaNeutral/
Hydrophobic
Table 4. Designed primers and LR-PCR conditions for the amplification of the selected genes.
GenePrimer F 5′-3′Primer R 5′-3′Fragment Length, bpAnnealing TempElongation, Min
UFGT_aACTCACAGGGATAAGAACACTC CCATCTGGCAACATCTCCTC 1455583
UFGT_aACTCACAGGGATAAGAACACTC CACACTCCTCACCGCTCTT 1747583
PIPCCAAATGCCAAATATAGGGAGGC GACCATAGAGAGAGTGGGTGG 2006622.5
CHSTTCGACCGCTTTGACCCGA TGTTGCAGGCTCACATCACTC 2201594
UFGT_bTGATTGCTCATGTTATTTGGTCTC TTGCCCATAACCTCTCCCTC 2600623
AMT1.2CCATTGCTGCTGAGACTGATAA TGAGGTGATGGTGATTTGACGG 2643612.5
ANSaGGATGAAGGTGAGGGCAGAG TGTCAGGGCTTTTTCTAAATCGT 2707622.5
bHLH36TCCATCAAAGAAGACAGACCACC CCATTTGTCACCTTCTTGGTTTG 2953603
NRT2.4TTGTCCTTCCTTGGCTCCTTG ACCAACTGTGCTCATTAACAAATC 3060612.5
MYB7GTTTGTGCTCTCACCGATTTCA GTAGTAAACCCATACGTGGCCT 3376593.5
WD40AGGTCGGTGTAATTTCCGCT ACAAGTGGCTAACTCTCATTGGT 3844603
ANS_bGTTGAAGGTTGCATTATTGAAGTTG CCATGAGGTTTTGATTAGTGGAGT 3900603
F’3’5’HbAGCCTCCTCTGTGGTAAGTG CTCGACTCCACGAATACTAACA 4435603.5
GDH2GTCCTCCTATAACCTCCATTG ATATTTGTTTTCTTGGTCACGTTTG 4915583.5
ANRbAGTCGTTGGTGCTGTGTGTT AGGTTTACTTGGGTCTTCTTCAGG 5000613
ANRaGGTCCGTATGTGTGAATGAATCT TGACTTGATCGTCGGAGTGC 5023594
LHT1GCTGTCTTCAGTAGCGGACTT TTGCACGTTAGAATCAGGGTCAT 5107585.5
F3’5’HaTGTGGTTGAGAAGAAAGGATACCA GGAGACACCATAGCCGAAAGA 5118583.5
4CLGAGCTGCAATAGGCCTCACC ACGACAGTAAAACCATAACAGAGT 5264614
MYB4TGACCCCTCATCACATTTAGT CGTAAGTTCGTGGTGGTAGTG 5342593.5
FLSAGCAAGGCTATCGAAGGTGT AGGGGAAGGTTTTAGGCAAG 5568583.5
bHLH35CGGAGAAATGATGGCGTGGT GGCAAGTGGTTATGGGCGAA 5743593.5
GS1.2TGTTGGTTGATGTTGATGATGTT CCATTTAAGTAGGAAGATTTCGCC 6202614
DFRaAATGTGGTGAAAGTGGACGTAG TCTTGTTGCTGGATGACTGAC 6600594
AlaDCTGACCCACCCAAACAACGAG TGGCACACACAAACGATAGTAGA 7227596
GDHaACCATCCTAGTCACGCCCAT CATGTATTTCCACAACAGAACAAG 7617585.5
AlaAT1GCTTCGTAAATGGAATCGCC CCTTGGGCATTCGCAGCTT 8058597
LARACCTACACCAAAGACAACGAA TGTTGTTATGGTGTTTGGTTGGTT 8600586
bGTCAGTAAGCCTTGAGAAAAGCA GATGAAGTGTCACCTATTATGAGC 8605596
WRKY57TGATTCTTCTTGGGTCTAAACAG GCCCACACTCACTCAAATCC 11,214589
Disclaimer/Publisher’s Note: The statements, opinions and data contained in all publications are solely those of the individual author(s) and contributor(s) and not of MDPI and/or the editor(s). MDPI and/or the editor(s) disclaim responsibility for any injury to people or property resulting from any ideas, methods, instructions or products referred to in the content.

