
Epitomics: Analysis of Plasma C9 Epitope Heterogeneity in the Plasma of Lung Cancer Patients and Control Subjects

 , and
, and
Abstract
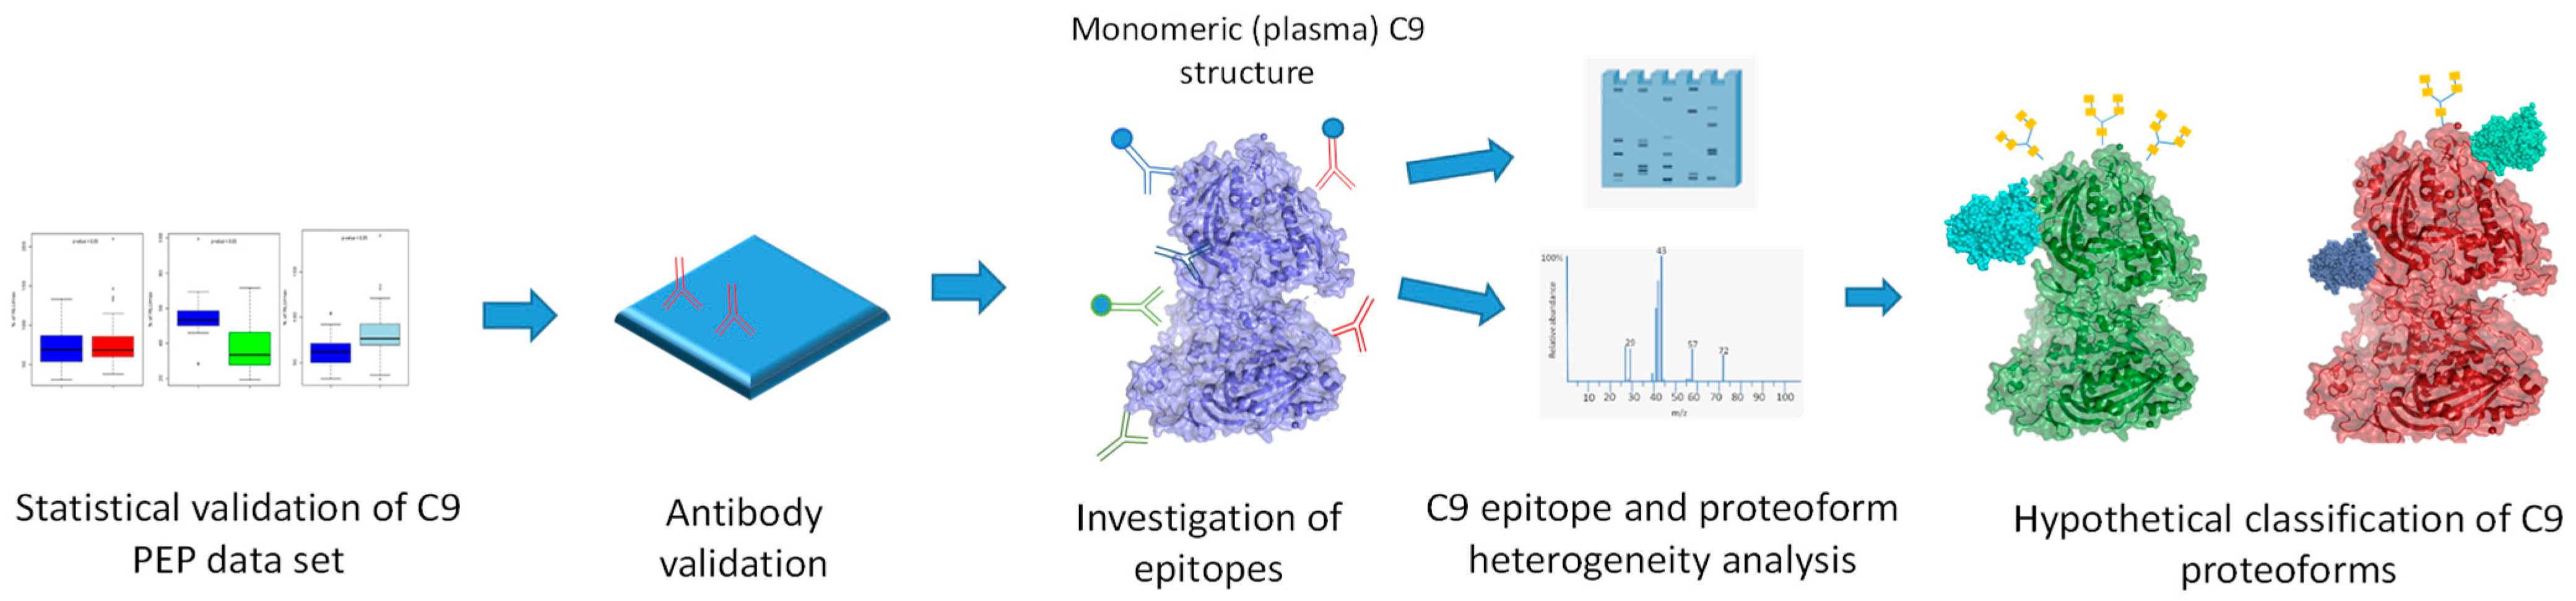
:1. Introduction
2. Results
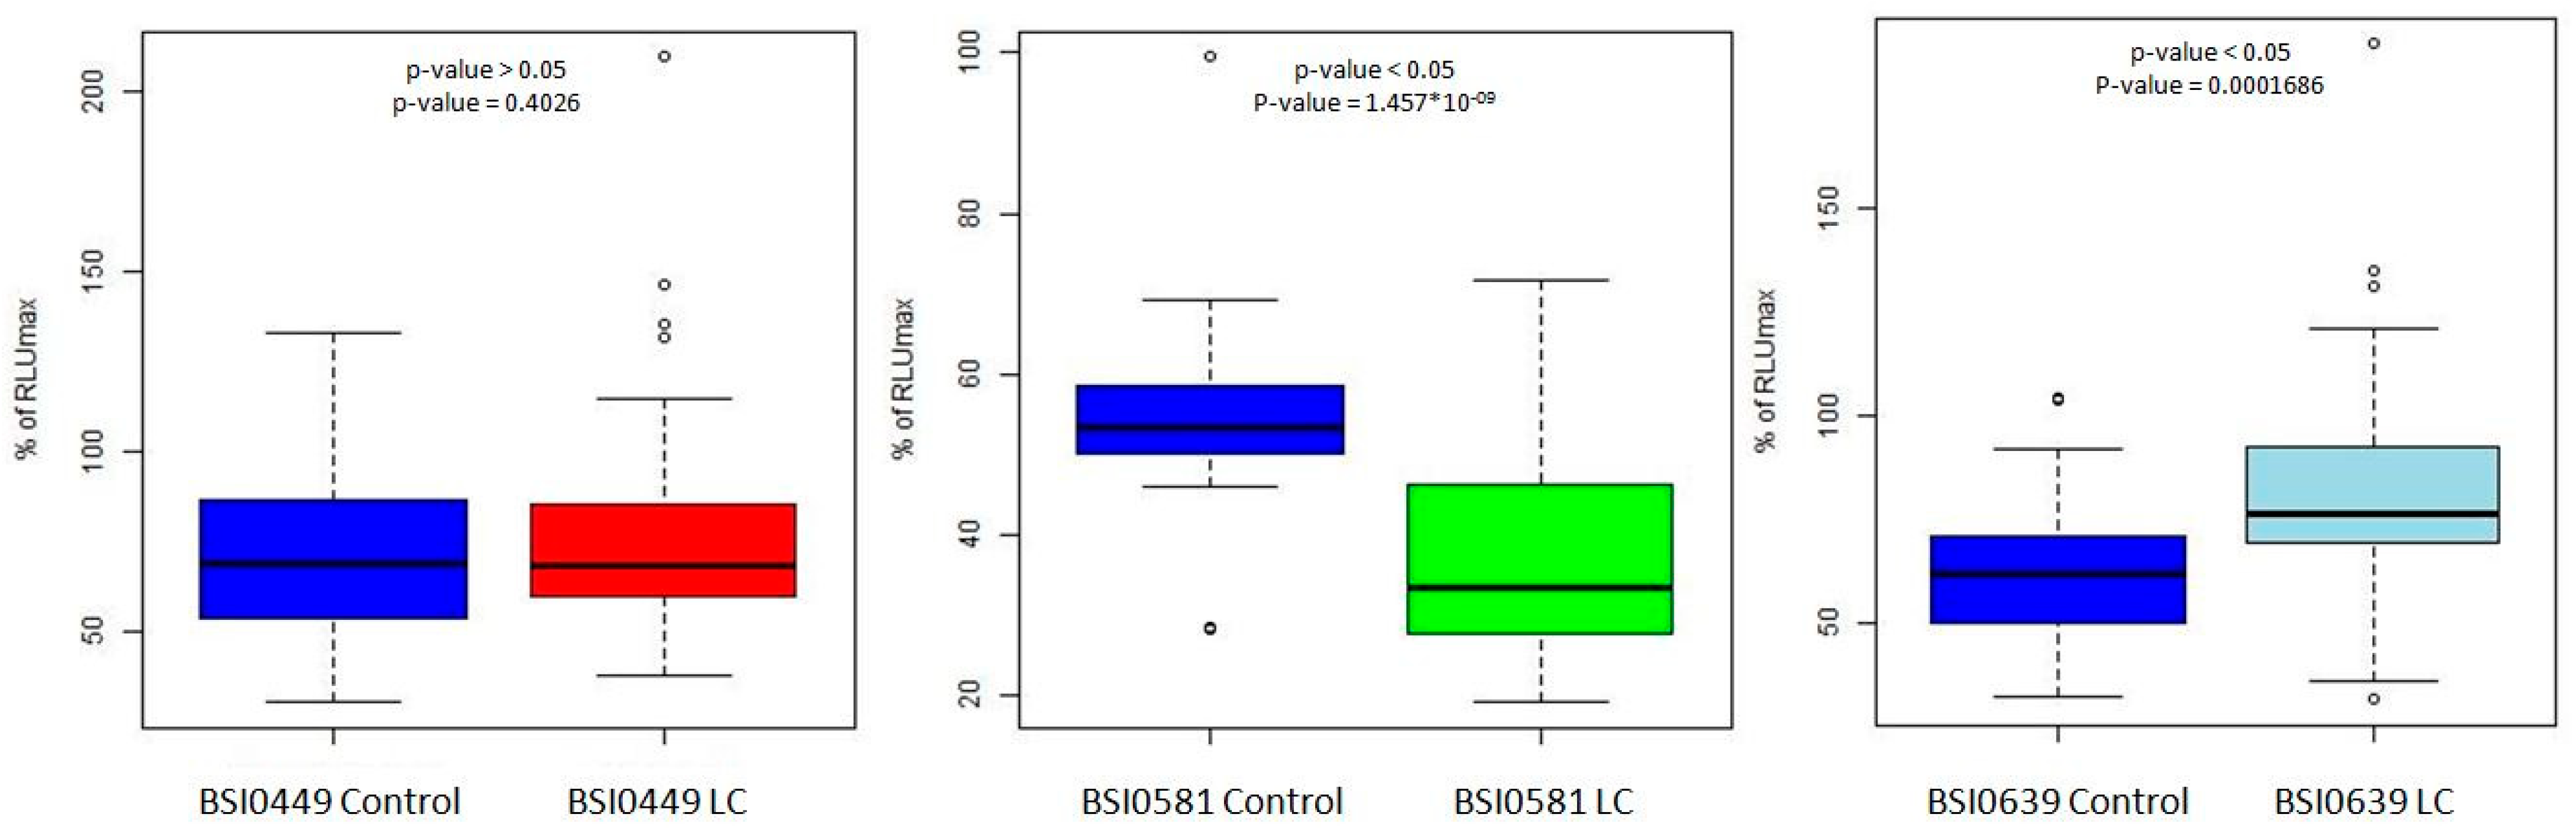
2.1. Statistical Validation of C9 PEP Data
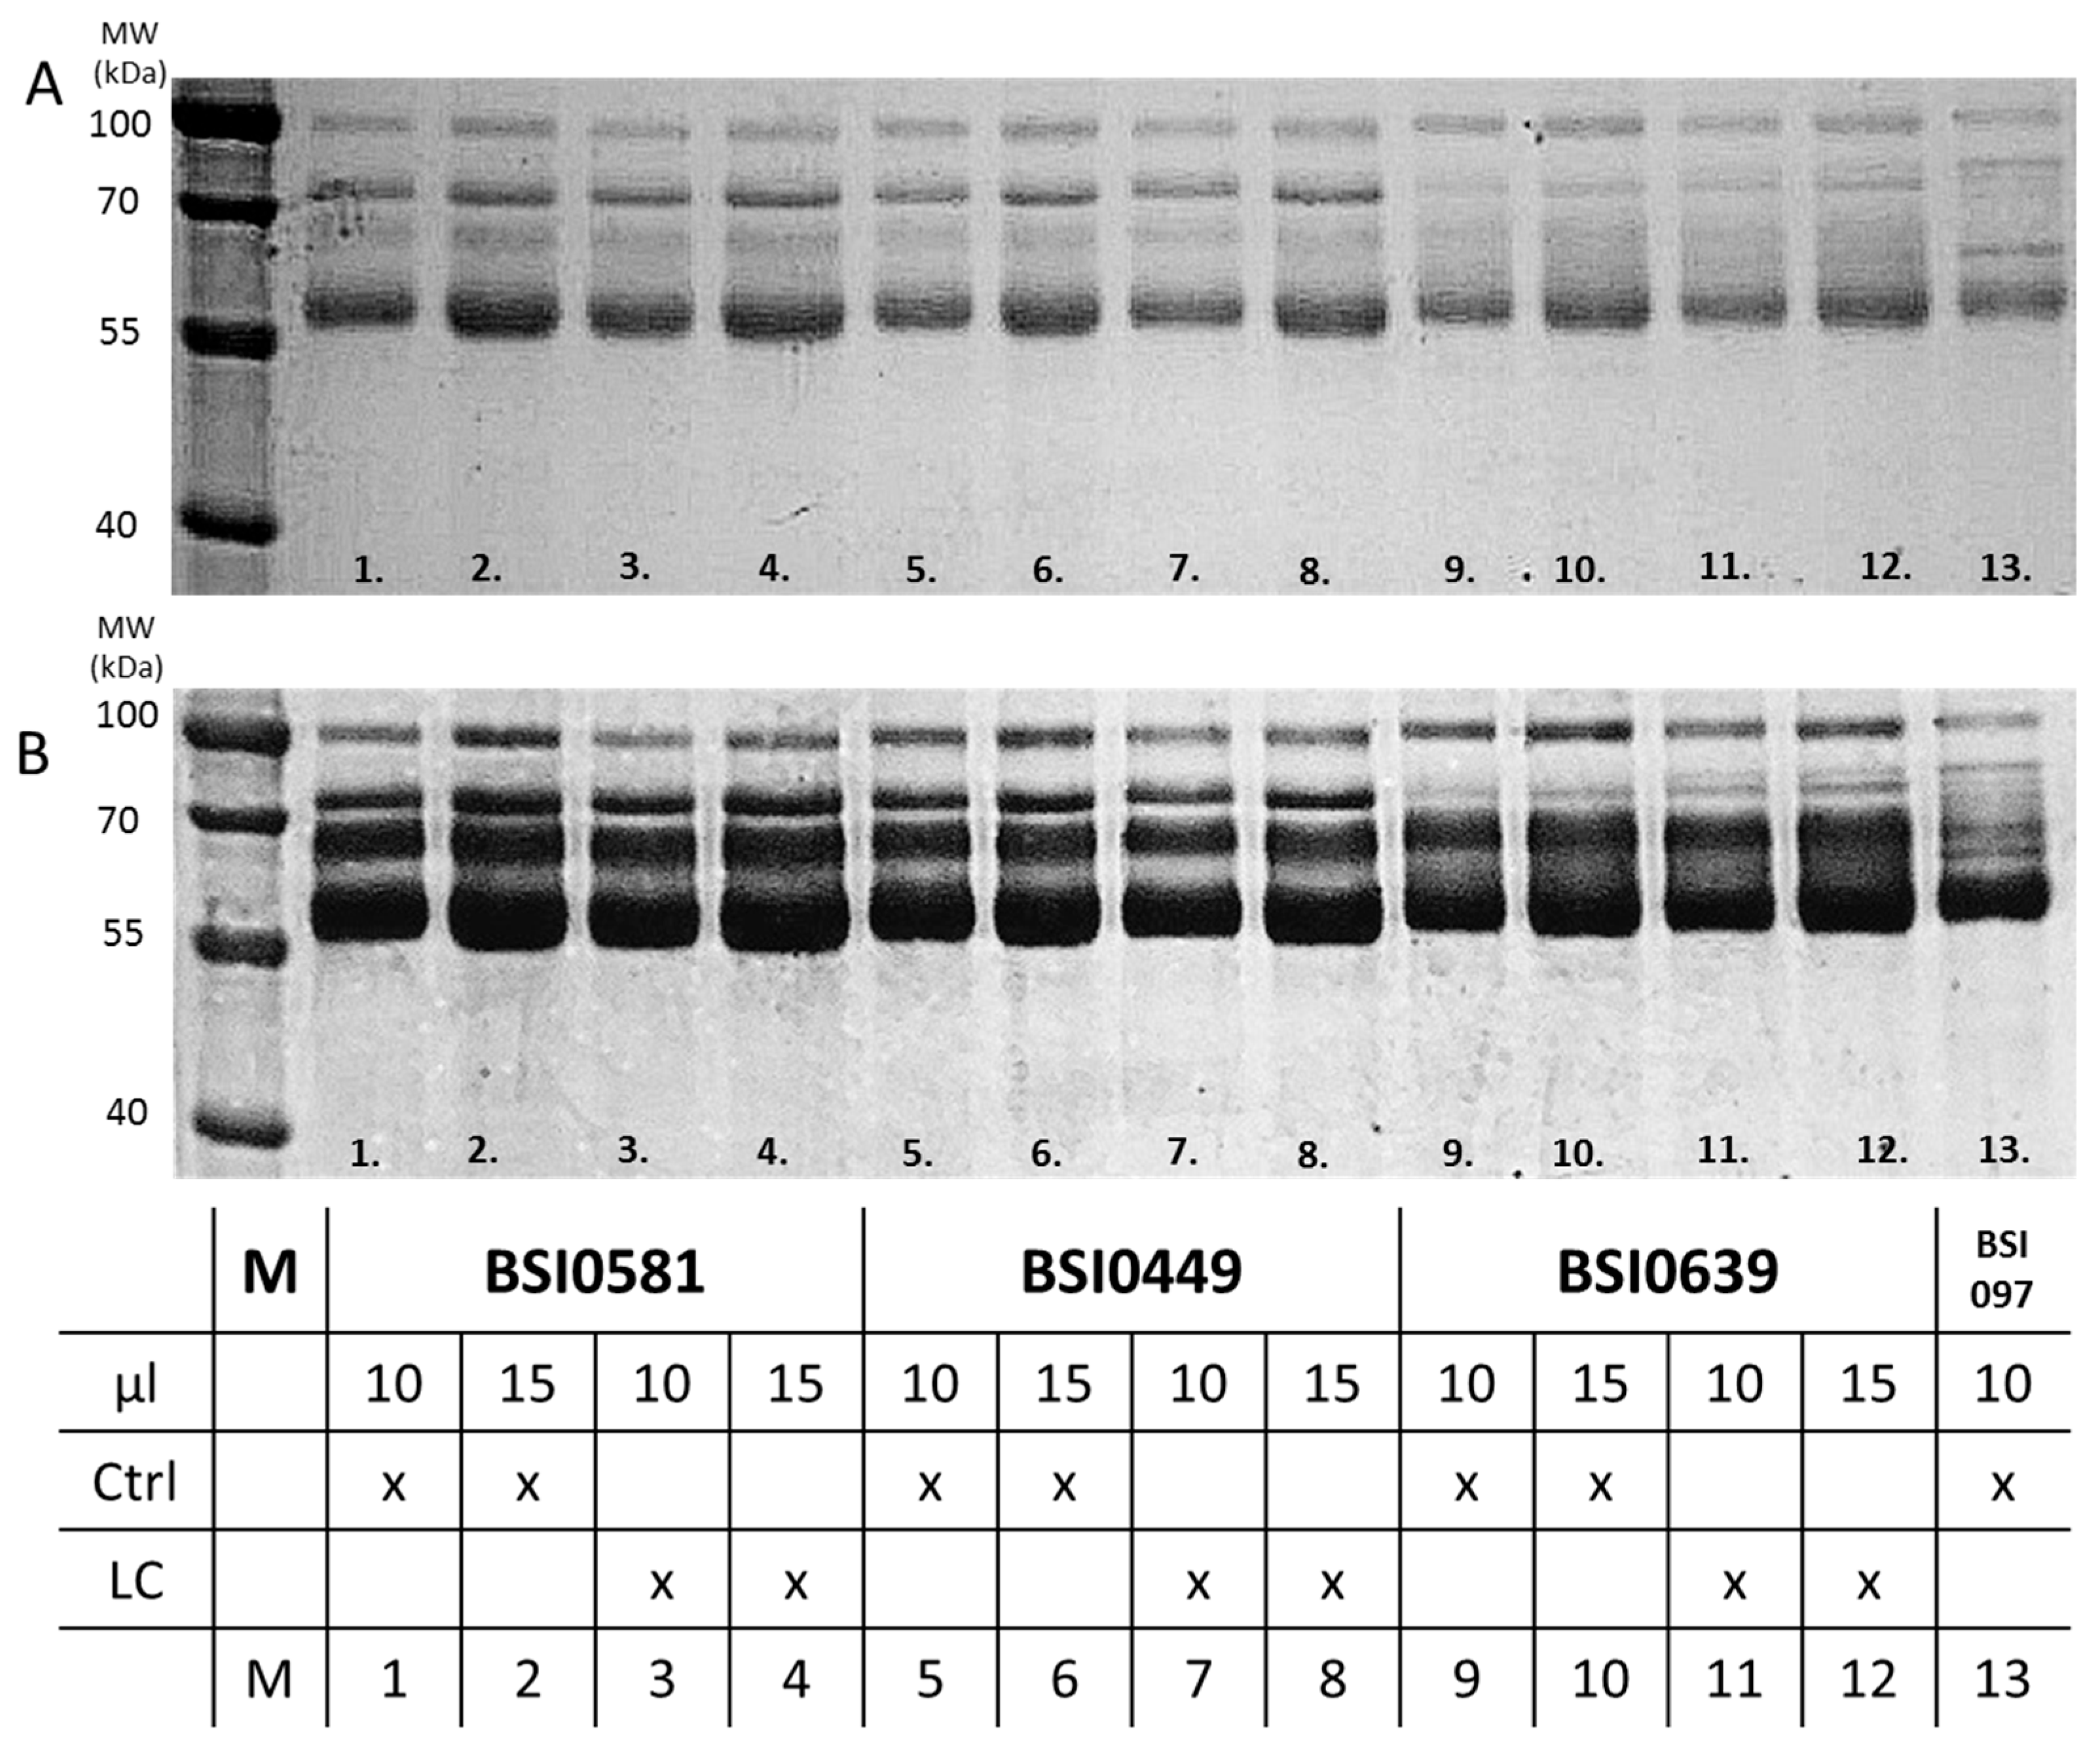
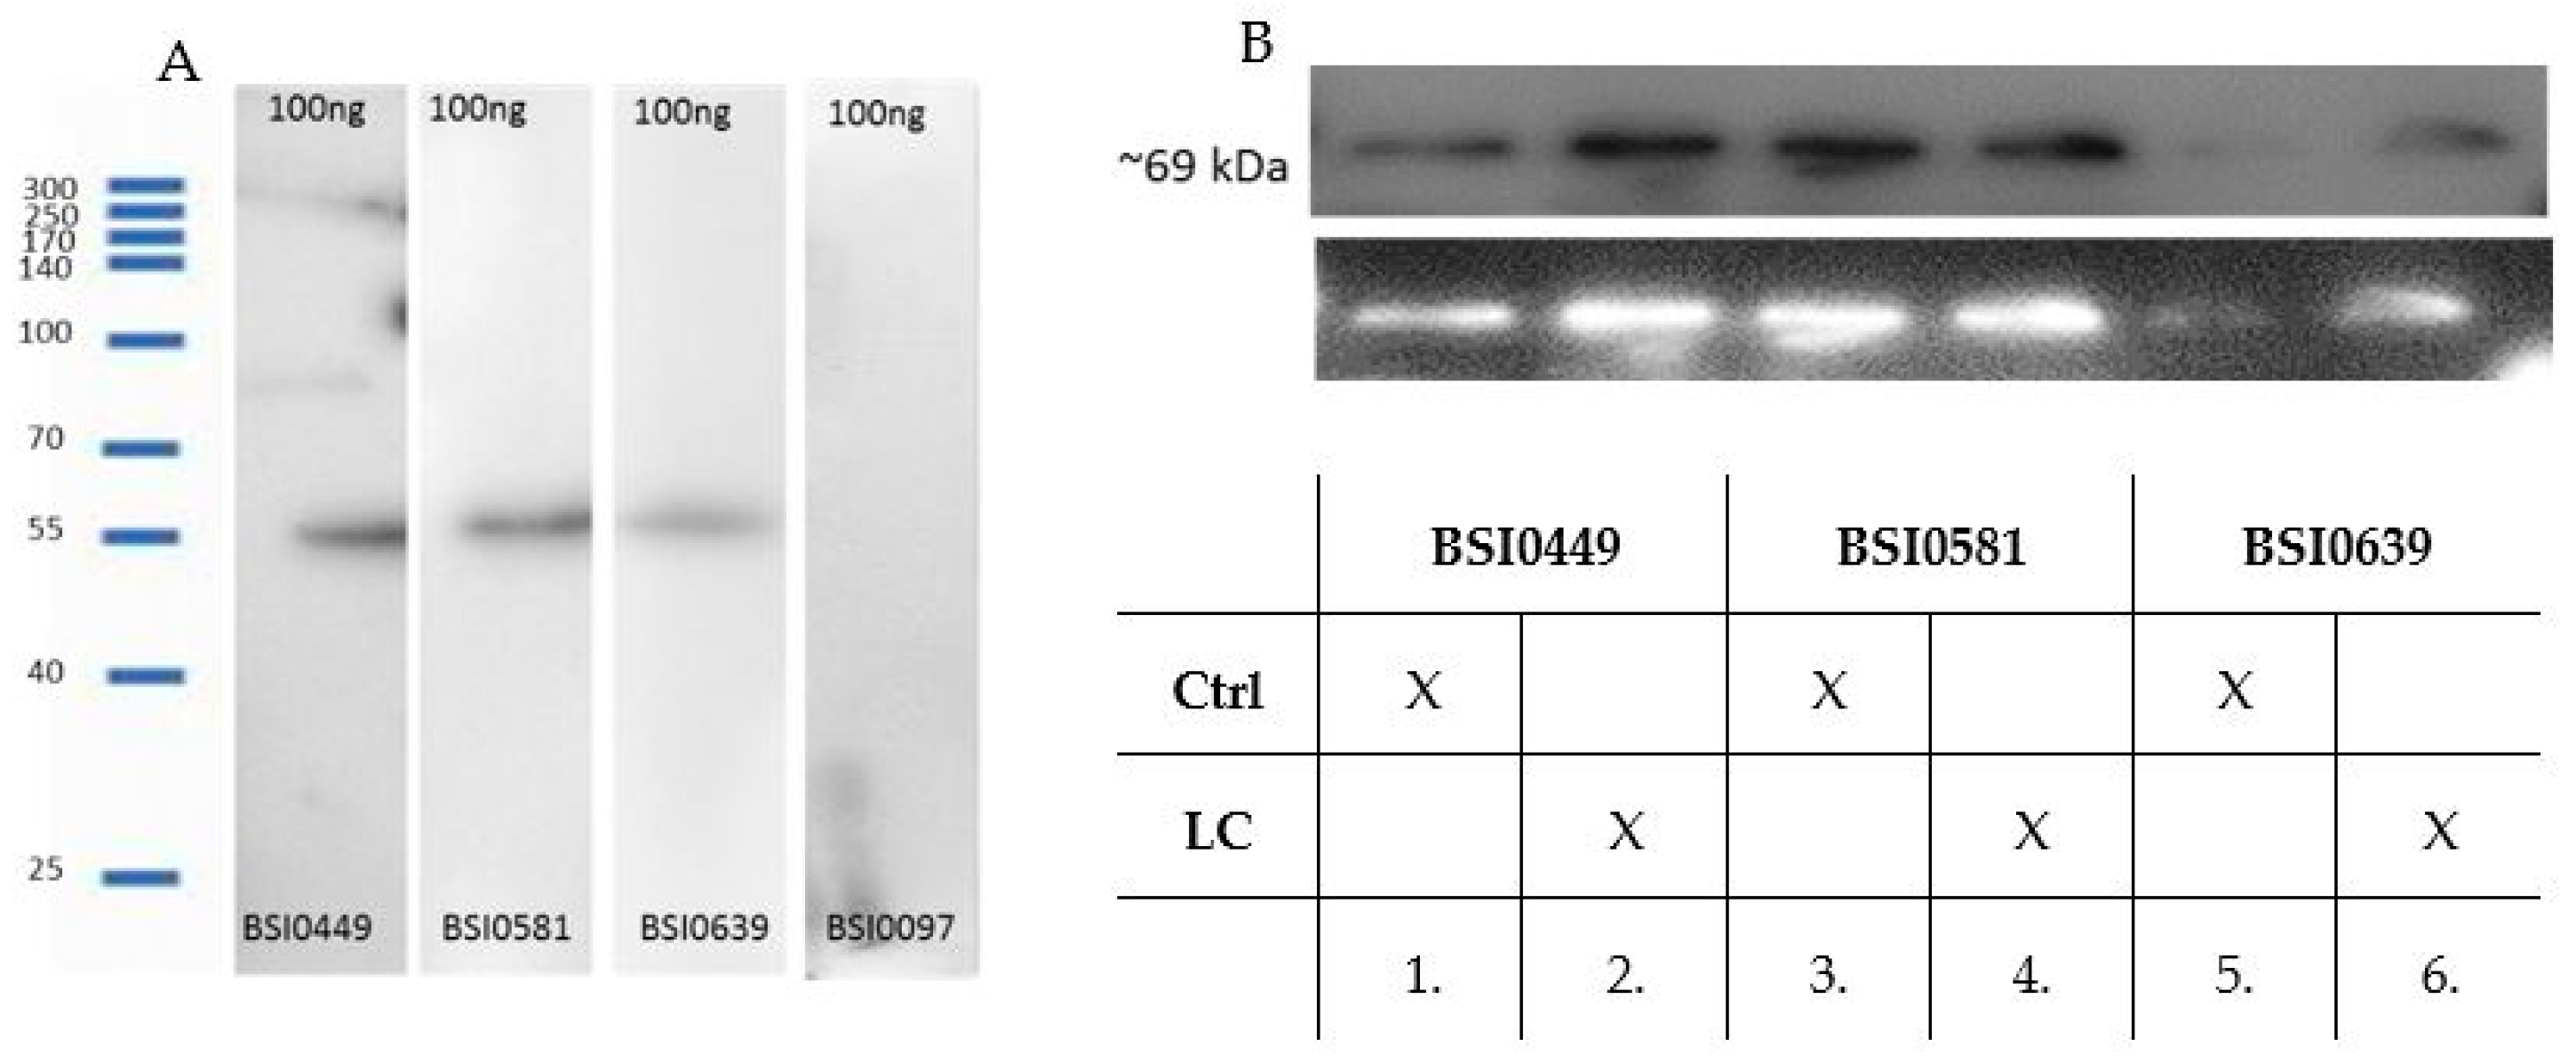
2.2. Validation of Monoclonal Antibodies
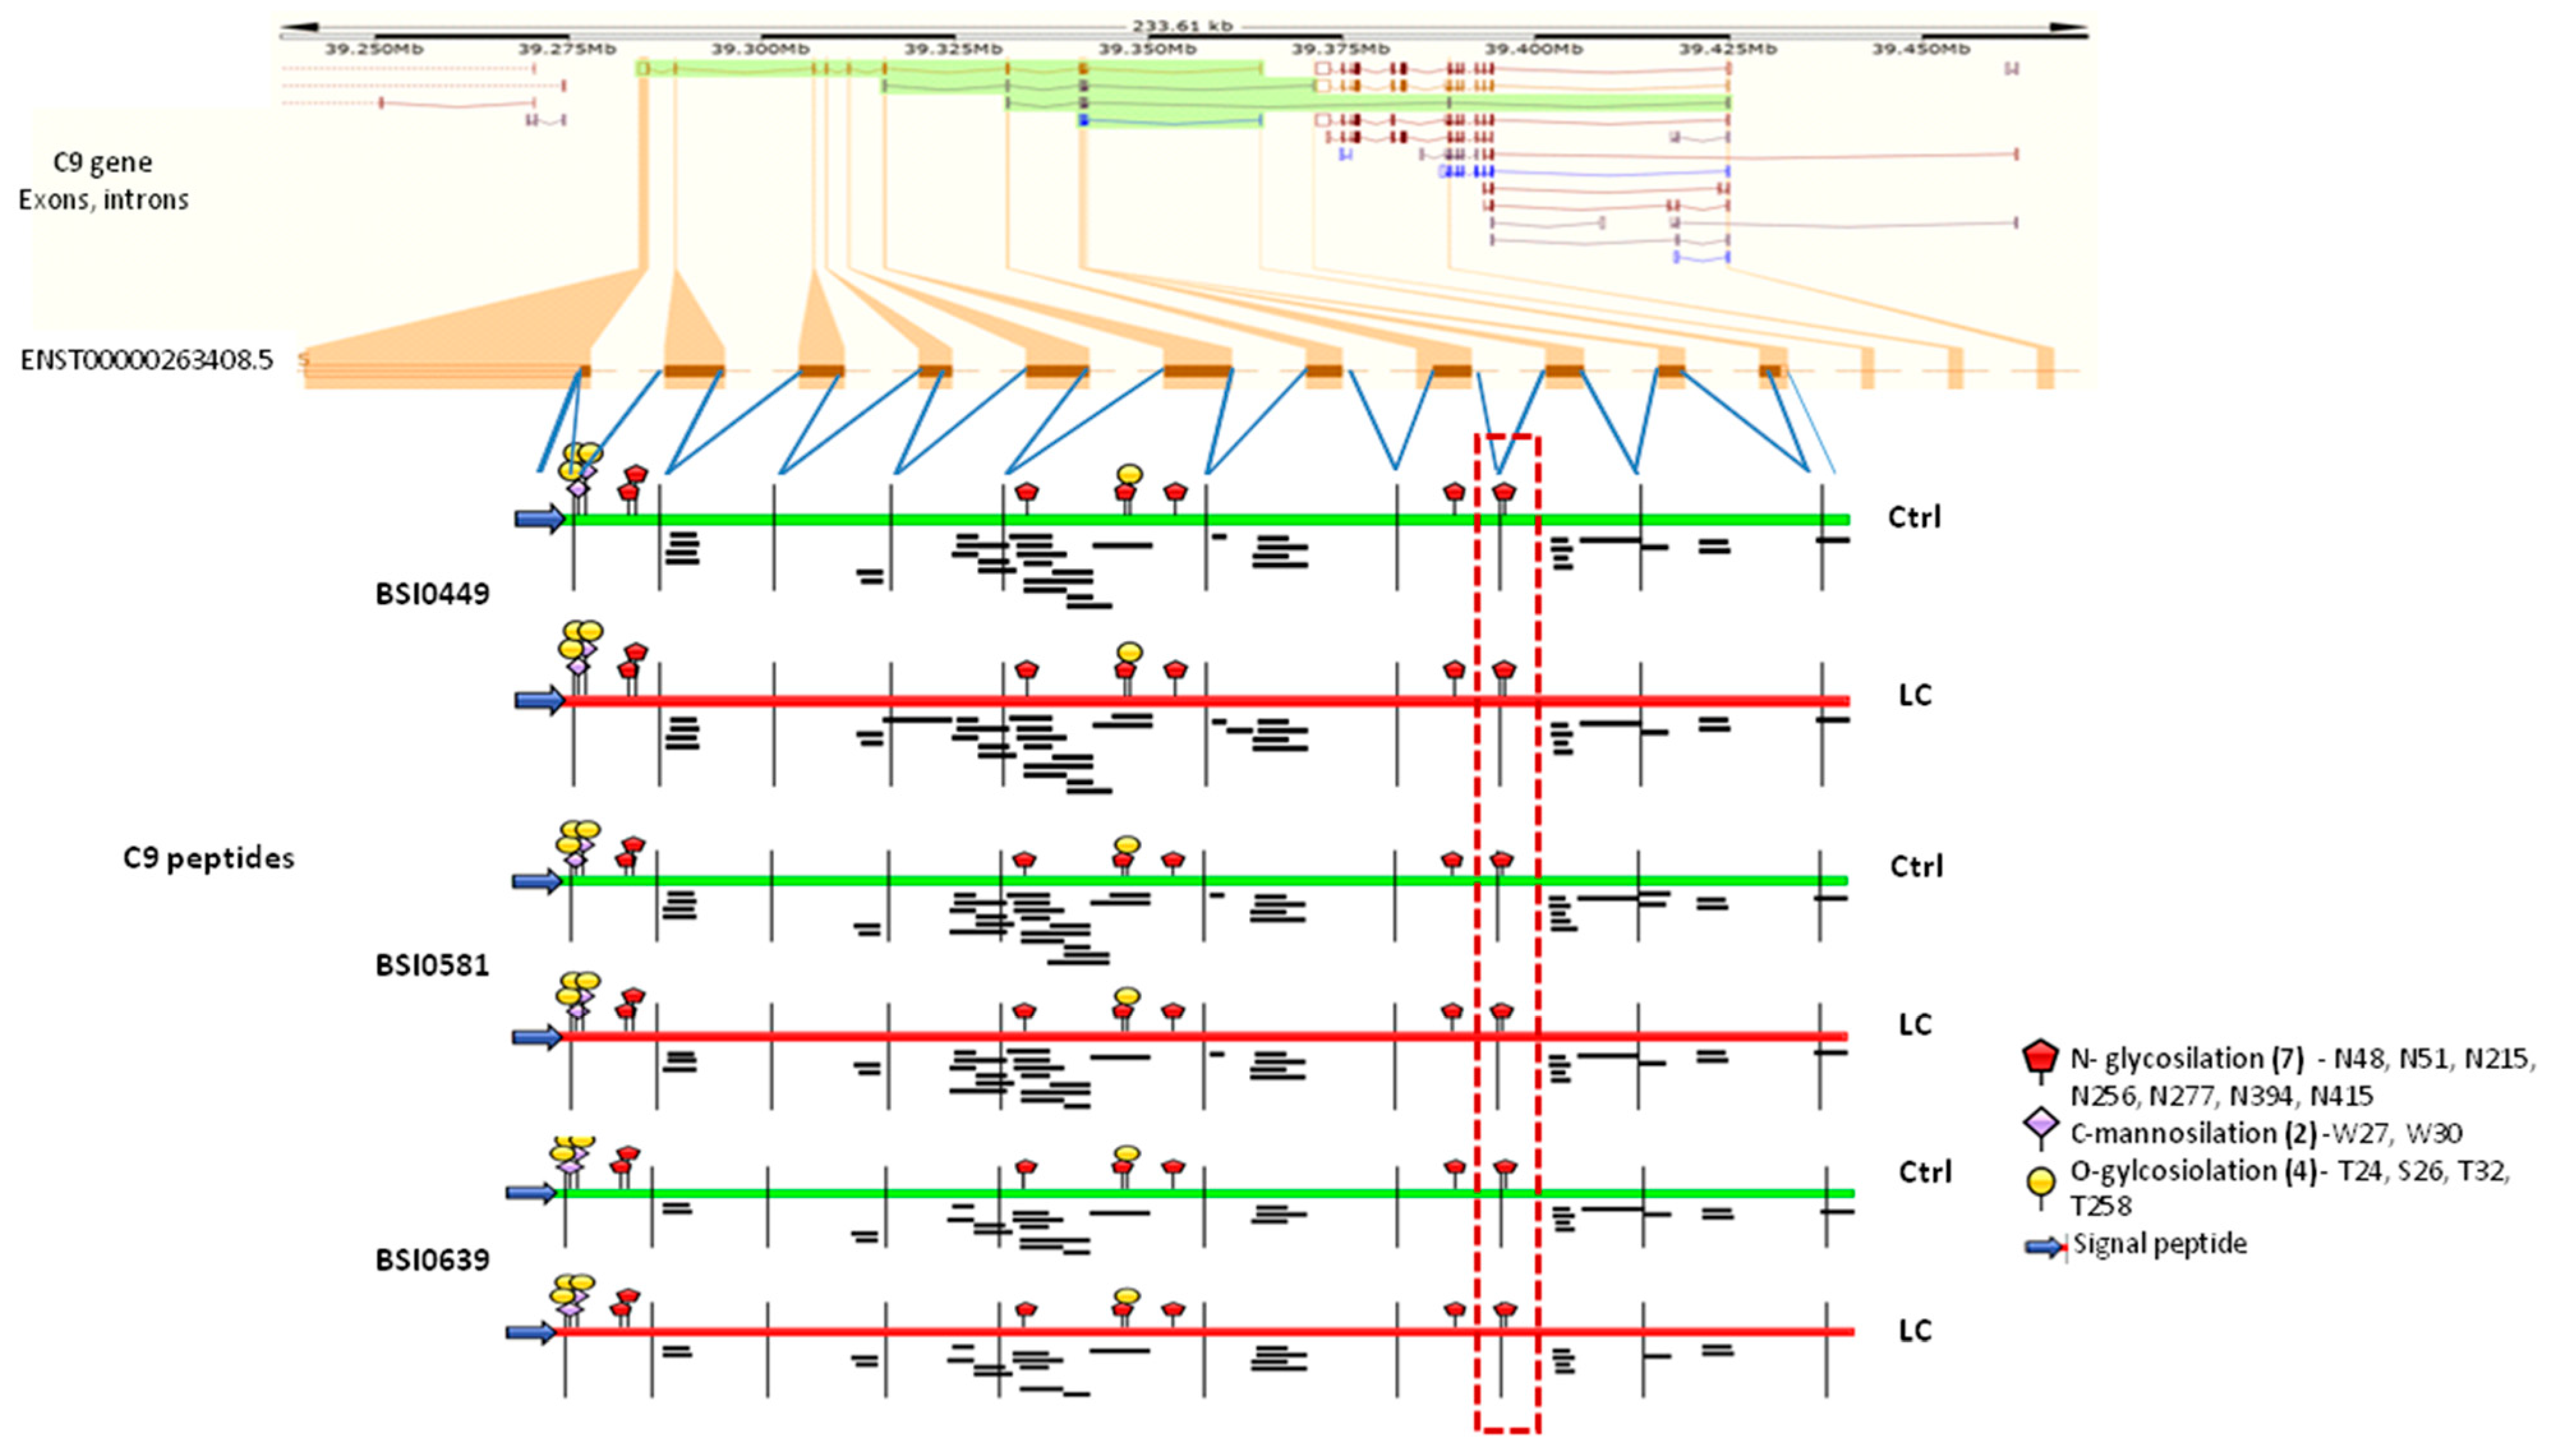
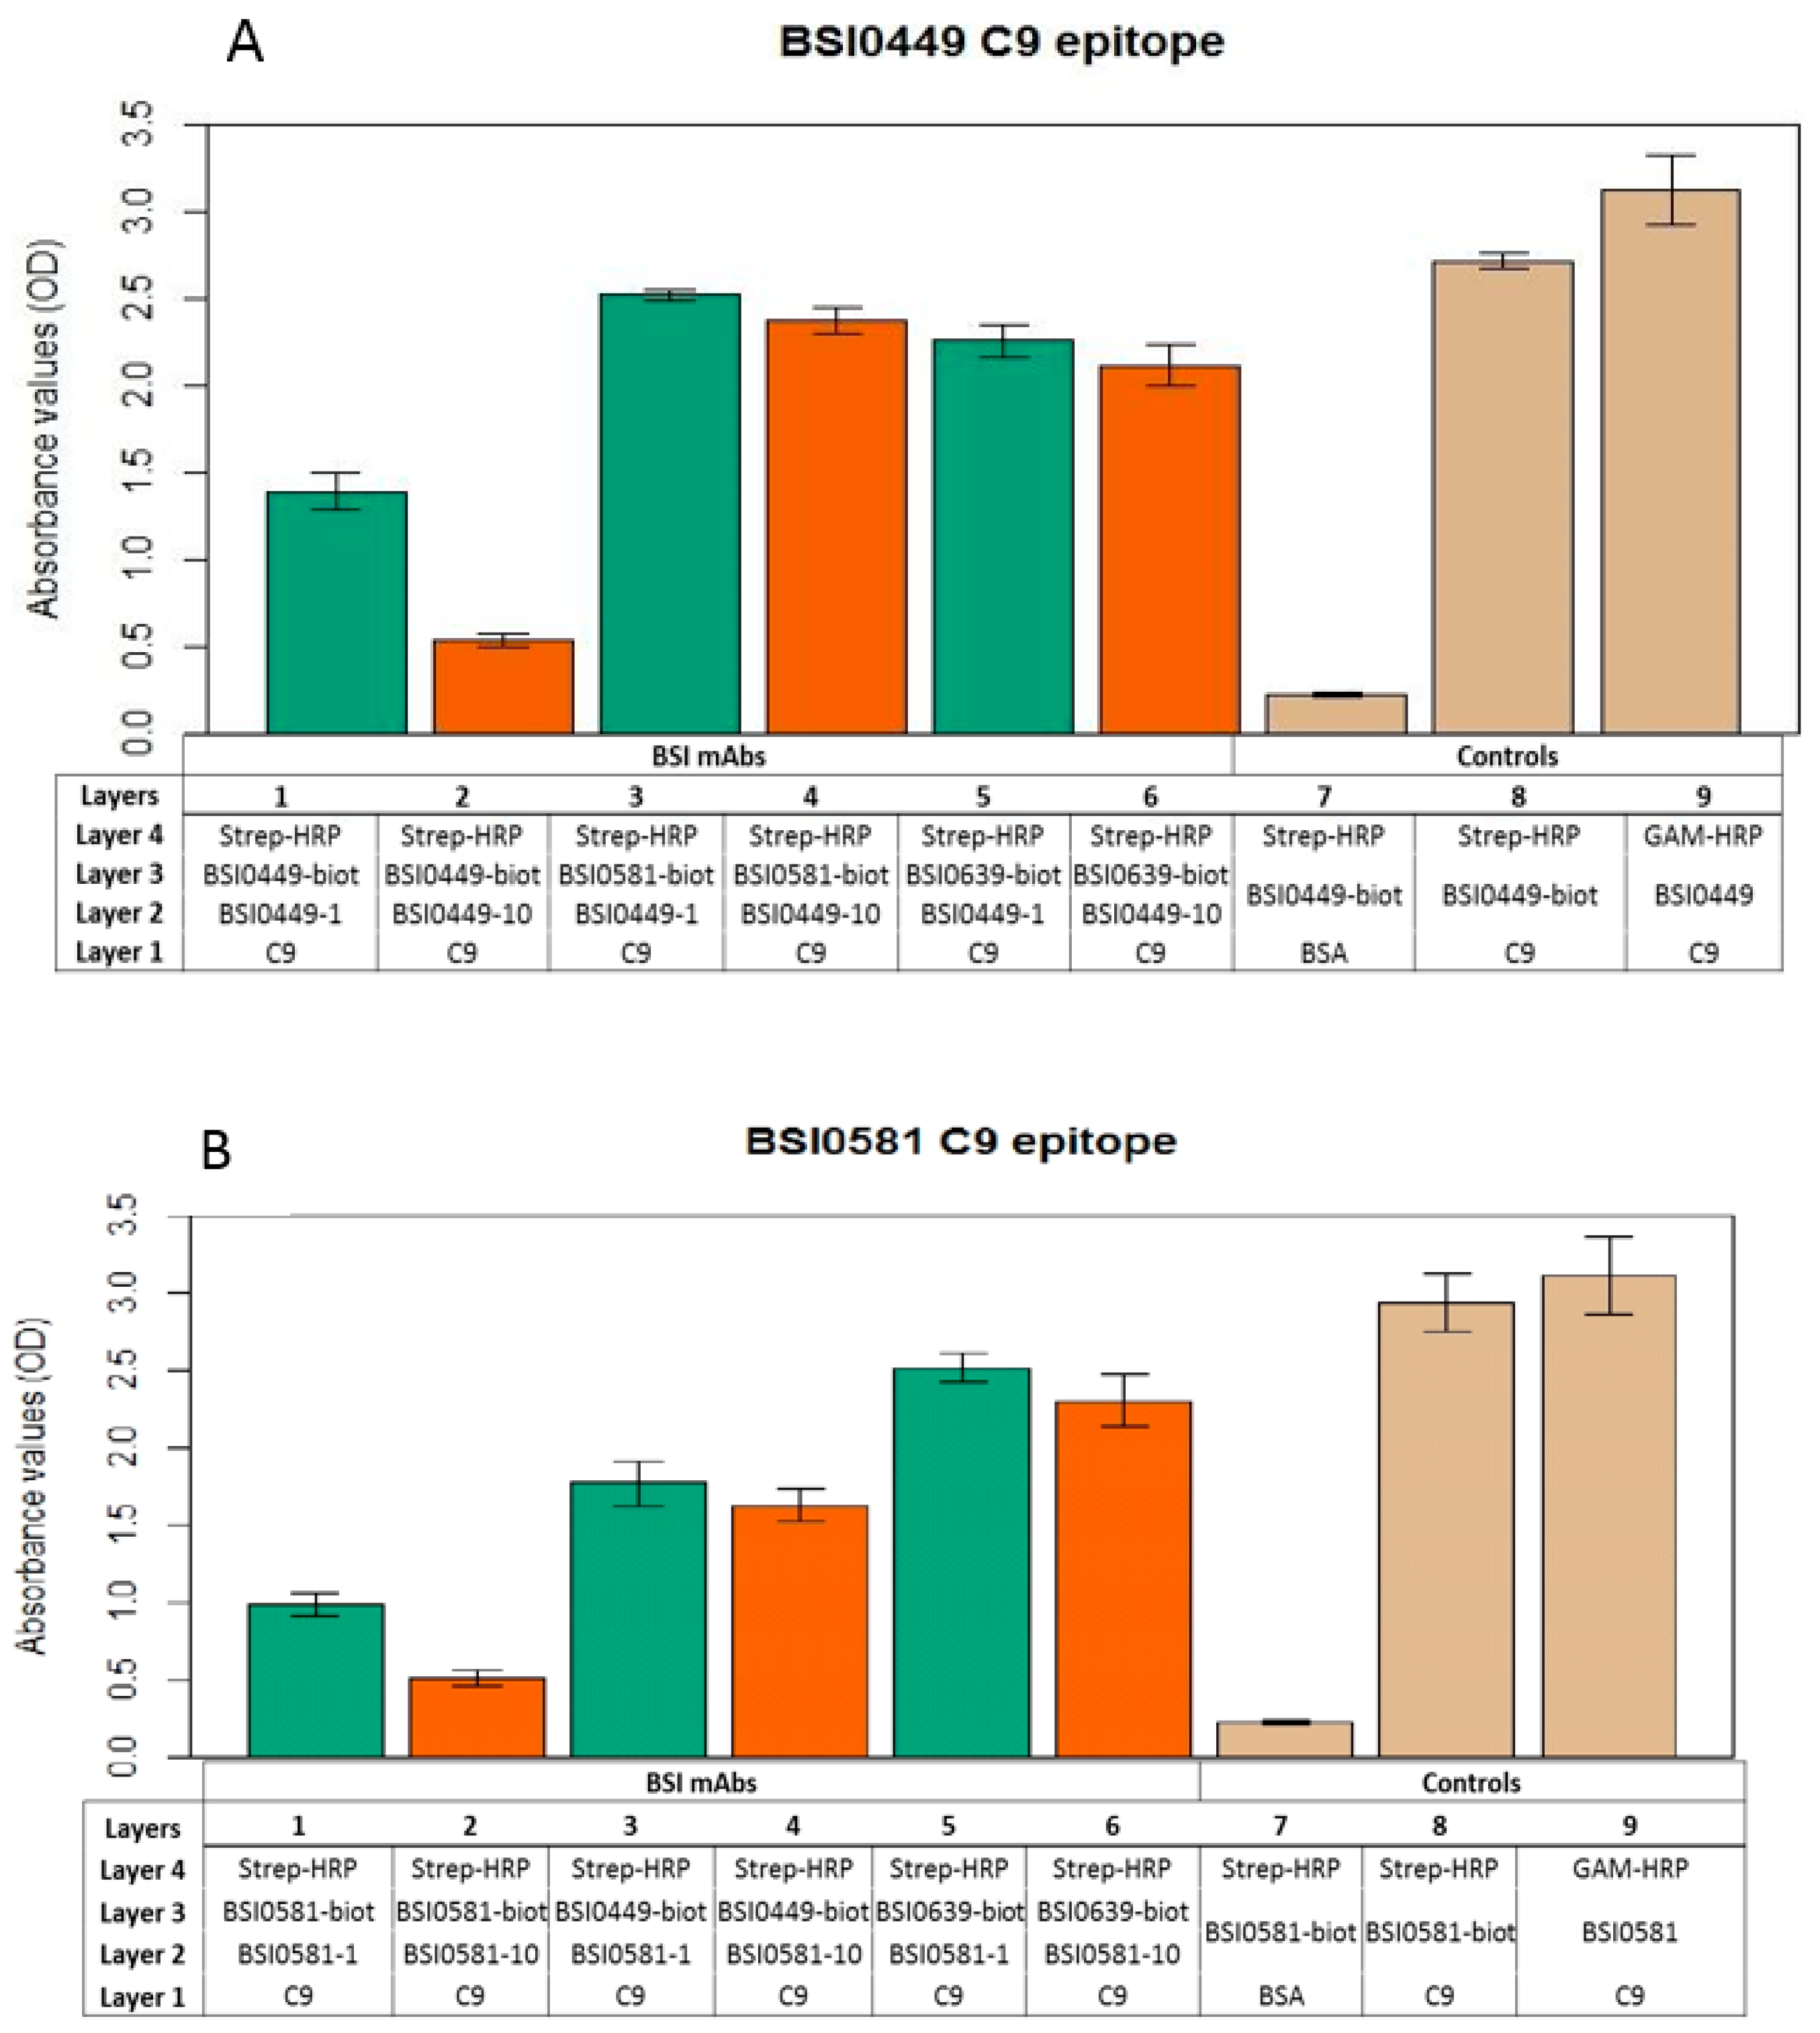
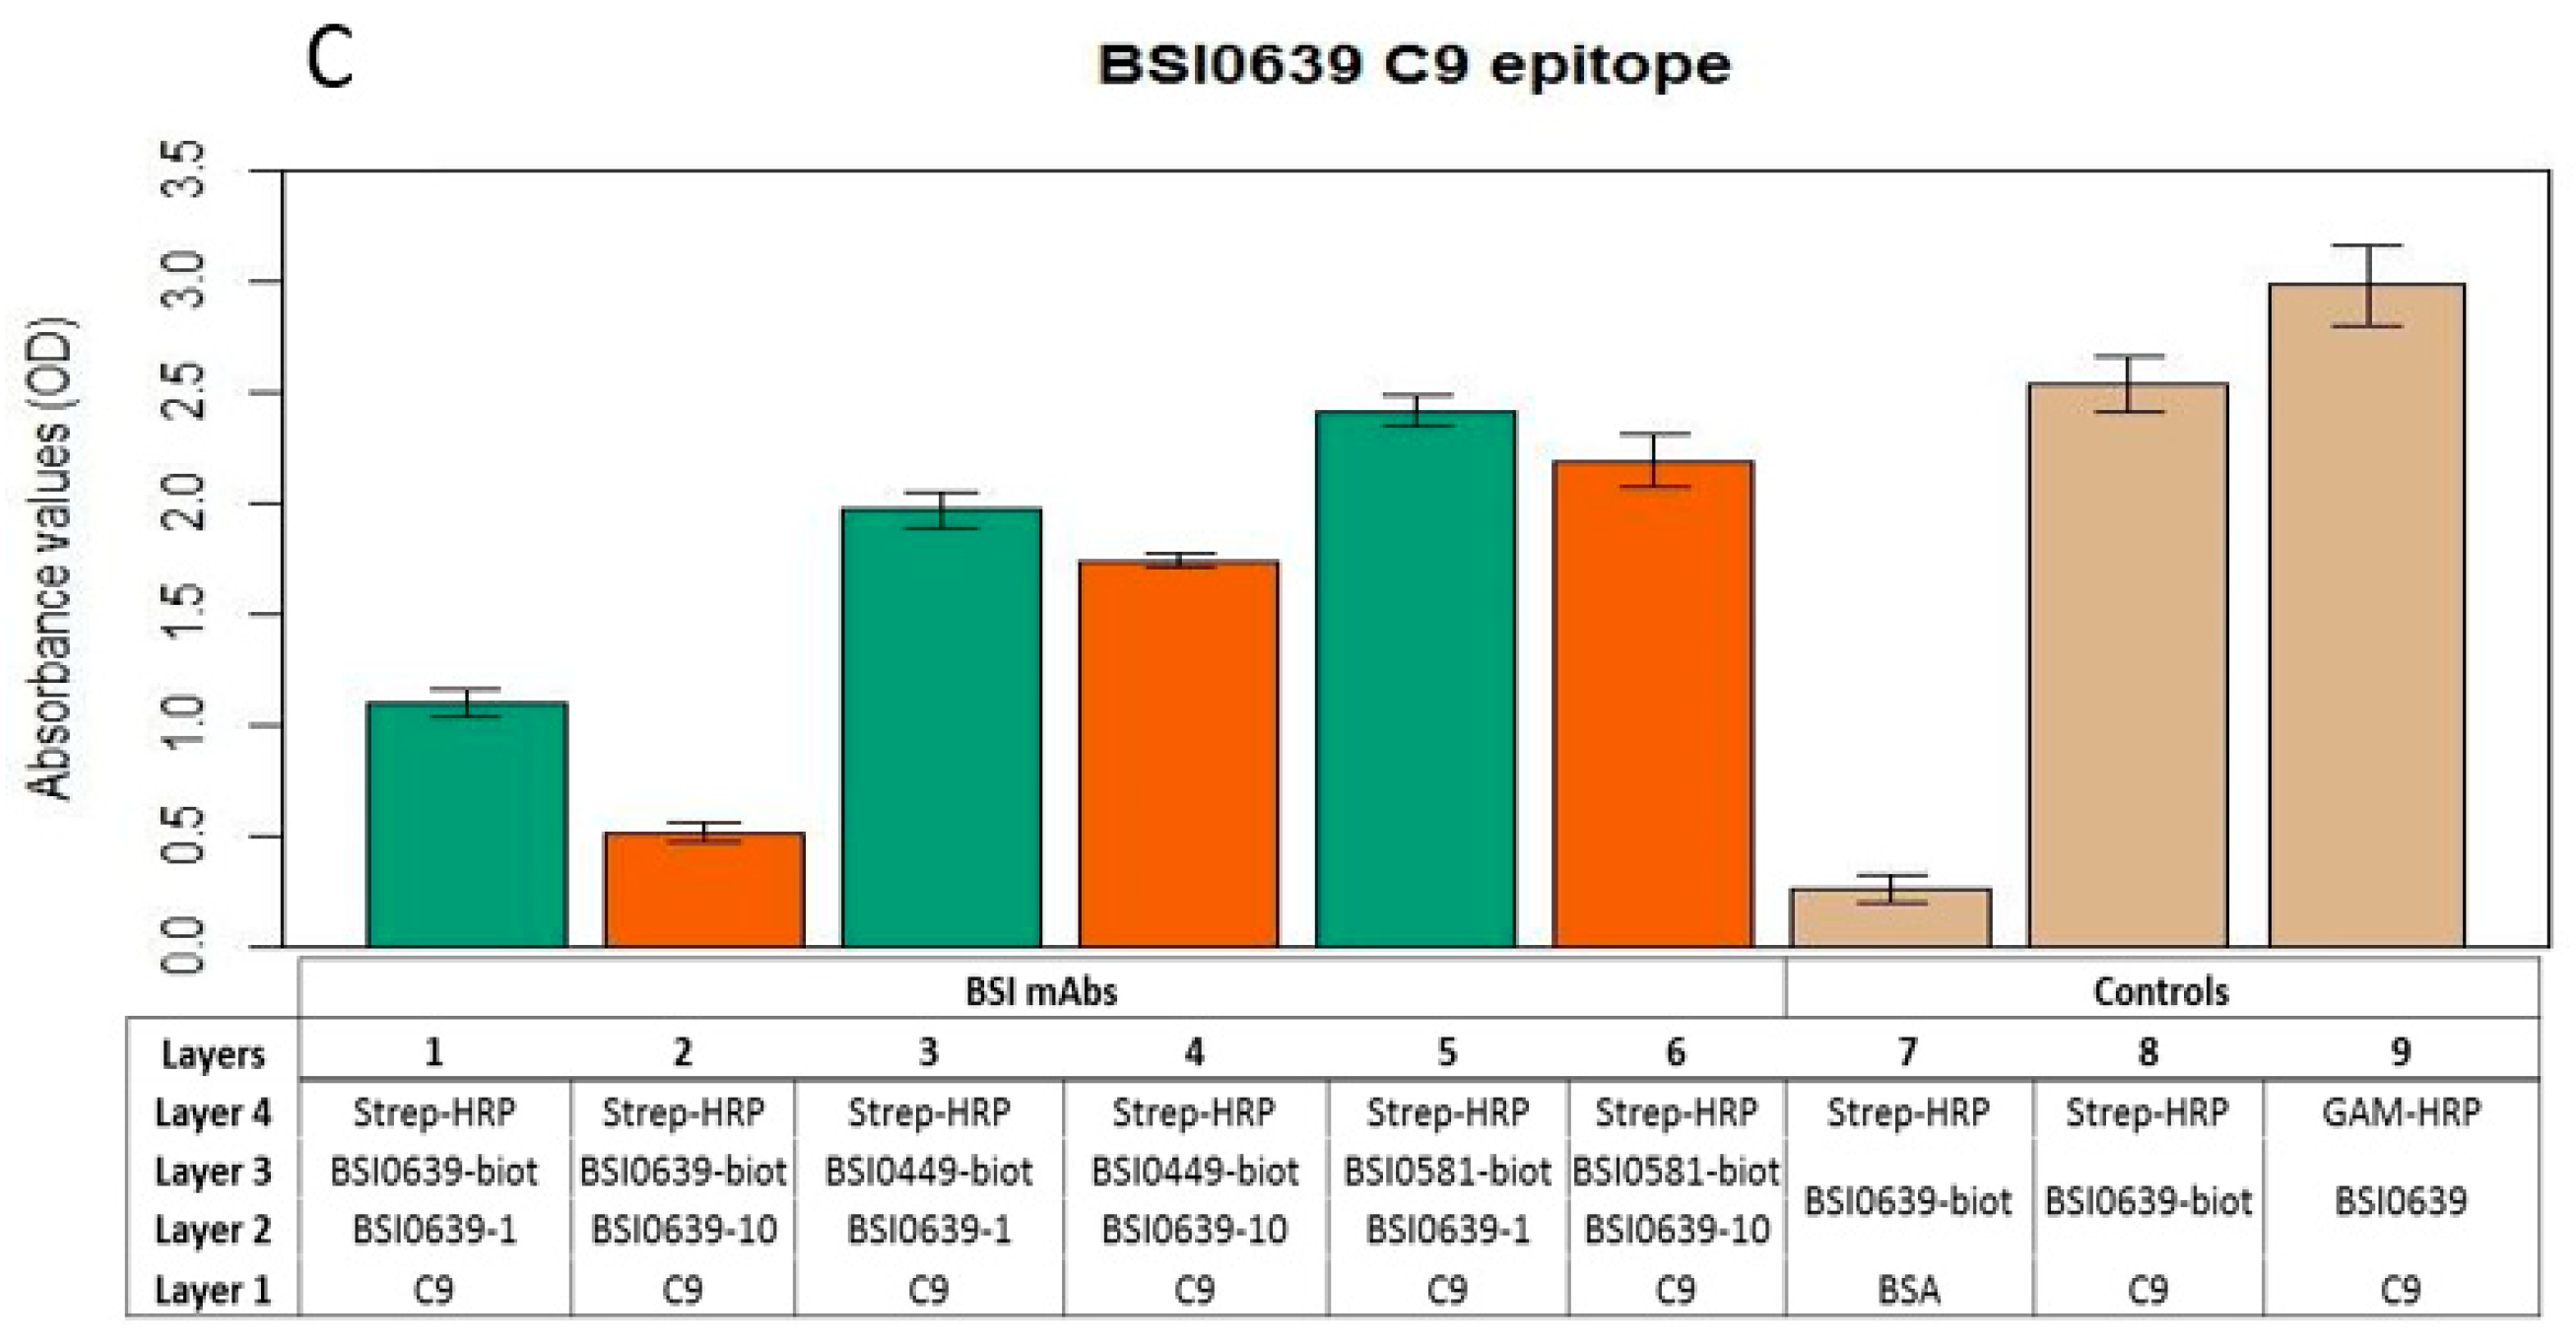
2.3. Investigation of C9 Epitopes
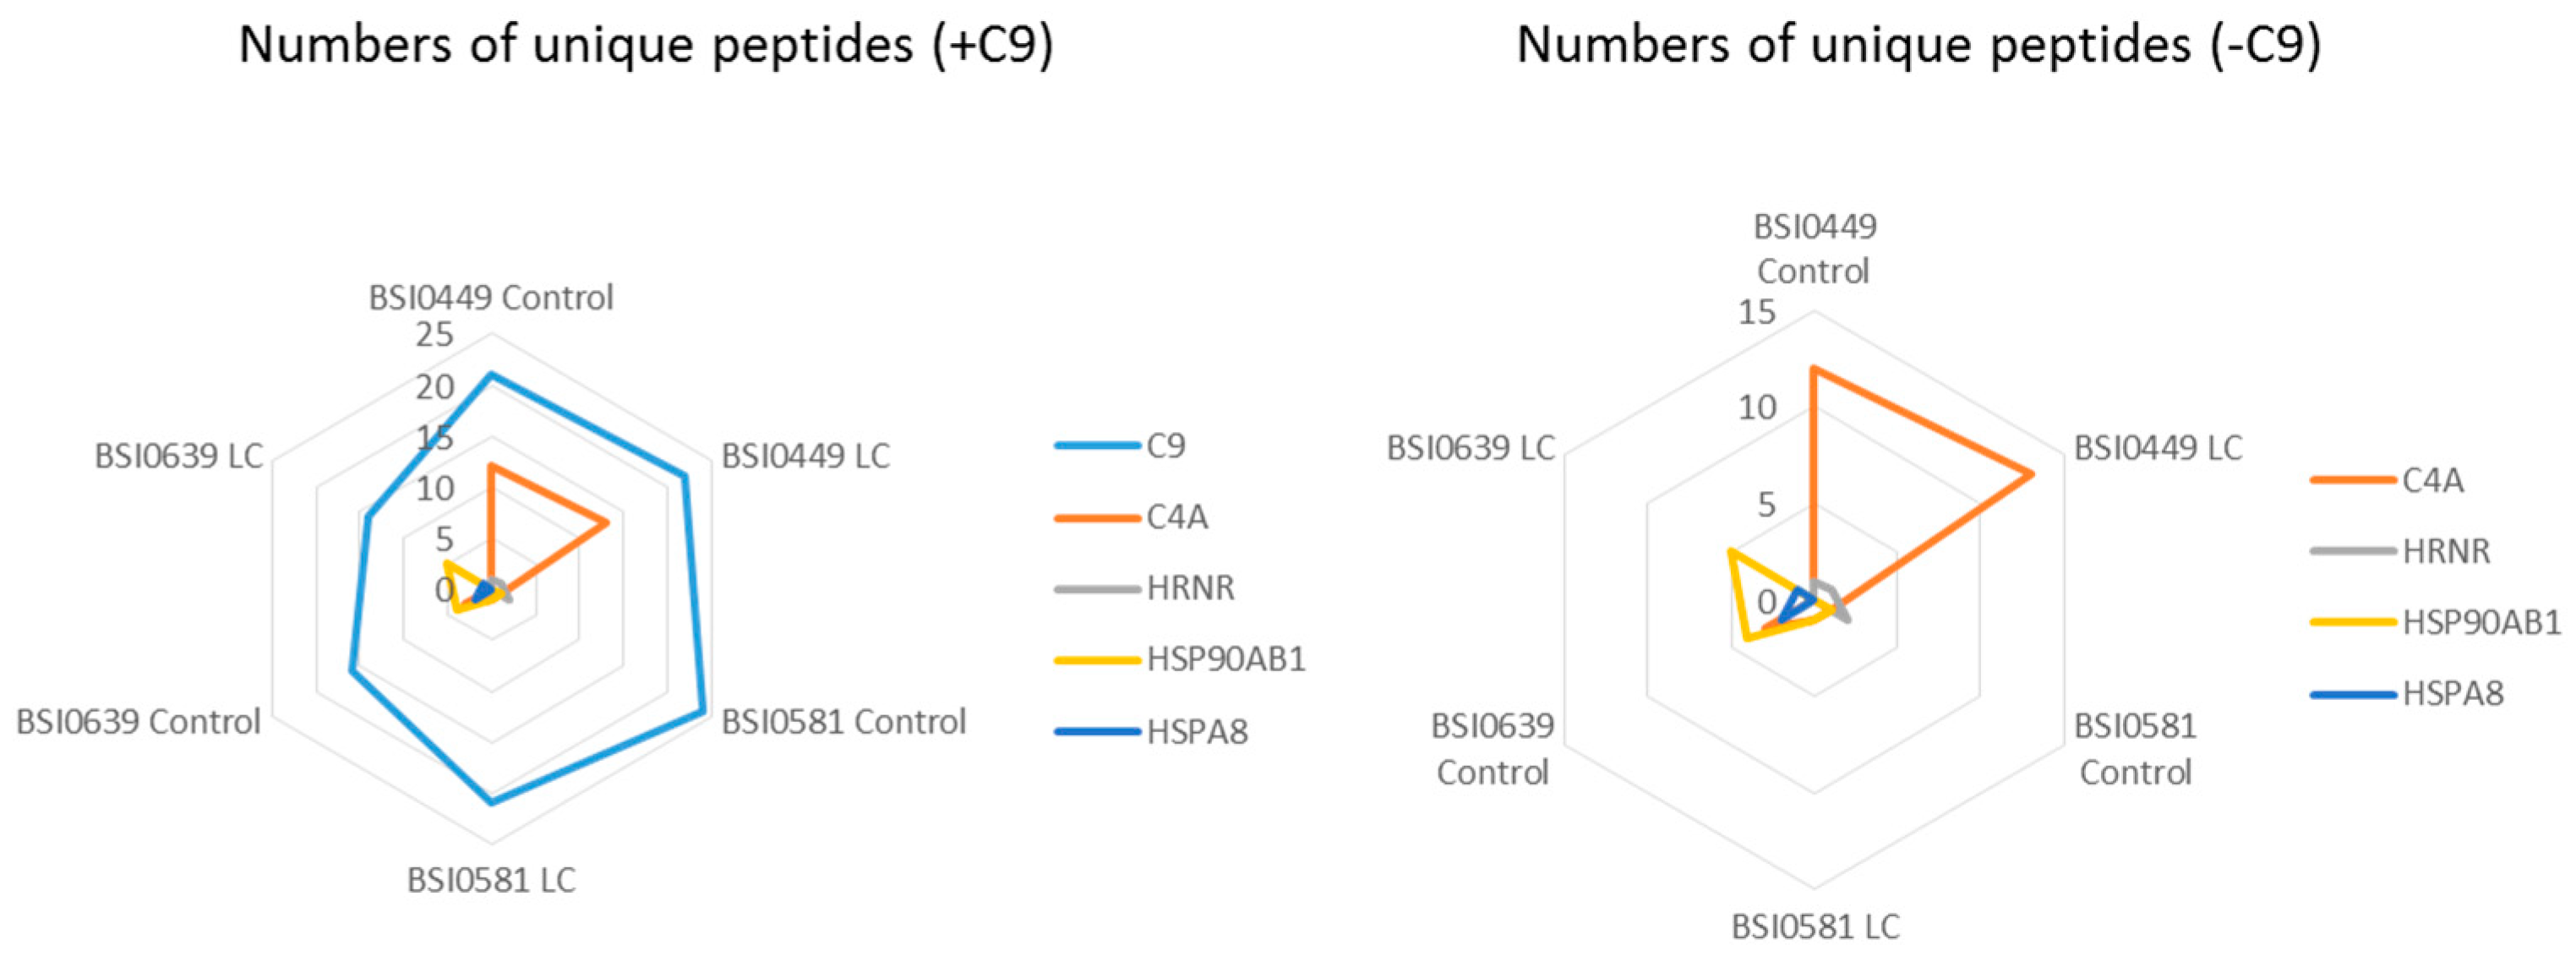
2.4. C9 Epitope and Proteoform Heterogeneity in Control and Lung Cancer Subjects
3. Discussion
4. Materials and Method
4.1. Pooled Plasma Samples
4.2. C9 Immunoprecipitation
4.3. SDS-PAGE
4.4. Staining
4.5. Western Blotting
4.6. Mass Spectrometry Analysis
4.6.1. Sample Preparation
4.6.2. Mass Spectrometry
4.6.3. Data Interpretation
4.7. mAb Biotinylation
4.8. C9 Epitope Test
4.9. Statistical Analysis
Supplementary Materials
Author Contributions
Funding
Institutional Review Board Statement
Informed Consent Statement
Data Availability Statement
Conflicts of Interest
References
- Aebersold, R.; Agar, J.N.; Amster, I.J.; Baker, M.S.; Bertozzi, C.R.; Boja, E.S.; Costello, C.E.; Cravatt, B.F.; Fenselau, C.; Garcia, B.A.; et al. How many human proteoforms are there? Nat. Chem. Biol. 2018, 14, 206–214. [Google Scholar] [CrossRef] [PubMed]
- Adhikari, S.; Nice, E.C.; Deutsch, E.W.; Lane, L.; Omenn, G.S.; Pennington, S.R.; Paik, Y.K.; Overall, C.M.; Corrales, F.J.; Cristea, I.M.; et al. A high-stringency blueprint of the human proteome. Nat. Commun. 2020, 11, 5301. [Google Scholar] [CrossRef] [PubMed]
- Deutsch, E.W.; Omenn, G.S.; Sun, Z.; Maes, M.; Pernemalm, M.; Palaniappan, K.K.; Letunica, N.; Vandenbrouck, Y.; Brun, V.; Tao, S.C.; et al. Advances and utility of the human plasma proteome. J. Proteome Res. 2021, 20, 5241–5263. [Google Scholar] [CrossRef]
- Uhlen, M.; Oksvold, P.; Fagerberg, L.; Lundberg, E.; Jonasson, K.; Forsberg, M.; Zwahlen, M.; Kampf, C.; Wester, K.; Hober, S.; et al. Towards a knowledge-based human protein atlas. Nat. Biotechnol. 2010, 28, 1248–1250. [Google Scholar] [CrossRef] [PubMed]
- Omenn, G.S. Reflections on the HUPO human proteome project, the flagship project of the human proteome organization, at 10 years. Mol. Cell. Proteom. 2021, 20, 100062. [Google Scholar] [CrossRef]
- Smith, L.M.; Kelleher, N.L. Proteoform: A single term describing protein complexity. Nat. Methods 2013, 10, 186–187. [Google Scholar] [CrossRef]
- Smith, L.M.; Agar, J.N.; Chamot-Rooke, J.; Danis, P.O.; Ge, Y.; Loo, J.A.; Paša-Tolić, L.; Tsybin, Y.O.; Kelleher, N.L. Consortium for Top-Down Proteomics. The human proteoform project: Defining the human proteome. Sci. Adv. 2021, 7, eabk0734. [Google Scholar] [CrossRef]
- Lazar, J.; Antal-Szalmas, P.; Kurucz, I.; Ferenczi, A.; Jozsi, M.; Tornyi, I.; Muller, M.; Fekete, J.T.; Lamont, J.; FitzGerald, P.; et al. Large scale plasma proteome epitome profiling is an efficient tool for the discovery of cancer biomarkers. Mol. Cell Proteom. 2023, 22, 100580. [Google Scholar] [CrossRef]
- Spicer, B.A.; Law, R.H.; Caradoc-Davies, T.T.; Ekkel, S.M.; Bayly-Jones, C.; Pang, S.S.; Conroy, P.J.; Ramm, G.; Radjainia, M.; Venugopal, H.; et al. The first transmembrane region of complement component-9 acts as a brake on its self-assembly. Nat. Commun. 2018, 9, 3266. [Google Scholar] [CrossRef]
- Stanley, K.K.; Kocher, H.P.; Luzio, J.P.; Jackson, P.; Tschopp, J. The sequence and topology of human complement component C9. EMBO J. 1985, 4, 375–382. [Google Scholar] [CrossRef]
- Morgan, B.P. The complement system: An overview. In Methods in Molecular Biology Complement Methods and Protocols; Walker, J.M., Ed.; Springer: Cham, Switzerland, 2000; pp. 1–13. [Google Scholar]
- Heukeshoven, J.; Dernick, R. Simplified method for silver staining of proteins in polyacrylamide gels and the mechanism of silver staining. Electrophoresis 1985, 6, 103–112. [Google Scholar] [CrossRef]
- Franc, V.; Yang, Y.; Heck, A.J. Proteoform profile mapping of the human serum complement component C9 revealing unexpected new features of N-, O-, and C-glycosylation. Anal. Chem. 2017, 89, 3483–3491. [Google Scholar] [CrossRef] [PubMed]
- Yang, W.; Ao, M.; Hu, Y.; Li, Q.K.; Zhang, H. Mapping the O-glycoproteome using site-specific extraction of O-linked glycopeptides (EXoO). Mol. Syst. Biol. 2018, 14, e8486. [Google Scholar] [CrossRef] [PubMed]
- Liu, W.; Xie, Y.; Ma, J.; Luo, X.; Nie, P.; Zuo, Z.; Lahrmann, U.; Zhao, Q.; Zheng, Y.; Zhao, Y.; et al. IBS: An illustrator for the presentation and visualization of biological sequences. Bioinformatics 2015, 31, 3359–3361. [Google Scholar] [CrossRef] [PubMed]
- Lingwood, D.; Simons, K. Lipid rafts as a membrane-organizing principle. Science 2010, 327, 46–50. [Google Scholar] [CrossRef] [PubMed]
- Dunkelberger, J.R.; Song, W.C. Complement and its role in innate and adaptive immune responses. Cell Res. 2010, 20, 34–50. [Google Scholar] [CrossRef] [PubMed]
- Tschopp, J.; Masson, D.; Schaefer, S.; Peitsch, M.; Preissner, K.T. The heparin binding domain of S-protein/vitronectin binds to complement components C7, C8, and C9 and perforin from cytolytic T-cells and inhibits their lytic activities. Biochemistry 1988, 27, 4103–4109. [Google Scholar] [CrossRef]
- Tschopp, J.; Chonn, A.; Hertig, S.; French, L.E. Clusterin, the human apolipoprotein and complement inhibitor, binds to complement C7, C8 beta, and the b domain of C9. J. Immunol. 1993, 151, 2159–2165. [Google Scholar] [CrossRef]
- Menny, A.; Lukassen, M.V.; Couves, E.C.; Franc, V.; Heck, A.J.; Bubeck, D. Structural basis of soluble membrane attack complex packaging for clearance. Nat. Commun. 2021, 12, 6086. [Google Scholar] [CrossRef]
- Chong, P.K.; Lee, H.; Loh, M.C.; Choong, L.Y.; Lin, Q.; So, J.B.; Lim, K.H.; Soo, R.A.; Yong, W.P.; Chan, S.P.; et al. Upregulation of plasma C9 protein in gastric cancer patients. Proteomics 2010, 10, 3210–3221. [Google Scholar] [CrossRef]
- Narayanasamy, A.; Ahn, J.M.; Sung, H.J.; Kong, D.H.; Ha, K.S.; Lee, S.Y.; Cho, J.Y. Fucosylated glycoproteomic approach to identify a complement component 9 associated with squamous cell lung cancer (SQLC). J. Proteom. 2011, 74, 2948–2958. [Google Scholar] [CrossRef] [PubMed]
- Chantaraamporn, J.; Champattanachai, V.; Khongmanee, A.; Verathamjamras, C.; Prasongsook, N.; Mingkwan, K.; Luevisadpibul, V.; Chutipongtanate, S.; Svasti, J. Glycoproteomic analysis reveals aberrant expression of complement C9 and fibronectin in the plasma of patients with colorectal cancer. Proteomes 2020, 8, 26. [Google Scholar] [CrossRef]
- Jia, W.; Lu, Z.; Fu, Y.; Wang, H.P.; Wang, L.H.; Chi, H.; Yuan, Z.F.; Zheng, Z.B.; Song, L.N.; Han, H.H.; et al. A Strategy for Precise and Large Scale Identification of Core Fucosylated Glycoproteins*S. Mol. Cell Proteom. 2009, 8, 913–923. [Google Scholar] [CrossRef]
- Zhou, Z.; Xu, M.J.; Gao, B. Hepatocytes: A key cell type for innate immunity. Cell. Mol. Immunol. 2016, 13, 301–315. [Google Scholar] [CrossRef] [PubMed]
- Lubbers, R.; Van Essen, M.F.; Van Kooten, C.; Trouw, L.A. Production of complement components by cells of the immune system. Clin. Exp. Immunol. 2017, 188, 183–194. [Google Scholar] [CrossRef] [PubMed]
- Pinho, S.S.; Reis, C.A. Glycosylation in cancer: Mechanisms and clinical implications. Nat. Rev. Cancer 2015, 15, 540–555. [Google Scholar] [CrossRef]
- Váradi, C.; Mittermayr, S.; Szekrényes, Á.; Kádas, J.; Takacs, L.; Kurucz, I.; Guttman, A. Analysis of haptoglobin N-glycome alterations in inflammatory and malignant lung diseases by capillary electrophoresis. Electrophoresis 2013, 34, 2287–2294. [Google Scholar] [CrossRef]
- Kobayashi, K.; Suzuki, T.; Iwata, E.; Nakamichi, N.; Suzuki, T.; Chen, P.; Ohtani, M.; Ishida, T.; Hosoya, H.; Müller, S.; et al. Transcriptional repression by MYB 3R proteins regulates plant organ growth. EMBO J. 2015, 34, 1992–2007. [Google Scholar] [CrossRef]
- Hubner, N.C.; Bird, A.W.; Cox, J.; Splettstoesser, B.; Bandilla, P.; Poser, I.; Hyman, A.; Mann, M. Quantitative proteomics combined with BAC TransgeneOmics reveals in vivo protein interactions. J. Cell Biol. 2010, 189, 739–754. [Google Scholar] [CrossRef]
- Jankovics, F.; Bence, M.; Sinka, R.; Faragó, A.; Bodai, L.; Pettkó-Szandtner, A.; Ibrahim, K.; Takács, Z.; Szarka-Kovács, A.B.; Erdélyi, M. Drosophila small ovary gene is required for transposon silencing and heterochromatin organization, and ensures germline stem cell maintenance and differentiation. Development 2018, 145, dev170639. [Google Scholar] [CrossRef]


| Sample ID | Position 415 gly C9 Normalized Intensity to the Most Intense Unmodified C9 Peptide | Position 415 gly C9 Ctrl/LC Ratio |
|---|---|---|
| BSI0449 Ctrl | 0.67 | 1.25 |
| BSI0449 LC | 0.54 | |
| BSI0581 Ctrl | 1.02 | 4.88 |
| BSI0581 LC | 0.21 | |
| BSI0639 Ctrl | 1.00 | 5.83 |
| BSI0639 LC | 0.17 |
| Samples ID | C9 | C4A | HRNR | HSP90AB1 | HSPA8 | |||||||||
|---|---|---|---|---|---|---|---|---|---|---|---|---|---|---|
| Num Unique | Peptide Count | Num Unique | Peptide Count | Coverage % | Num Unique | Peptide Count | Coverage % | Num Unique | Peptide Count | Coverage % | Num Unique | Peptide Count | Coverage % | |
| BSI0449 Ctrl | 21 | 312 | 12 | 48 | 10.7 | 1 | 2 | 0.8 | 0 | 0 | 0 | 0 | 0 | 0 |
| BSI0449 LC | 22 | 509 | 13 | 64 | 13 | 1 | 4 | 0.8 | 0 | 0 | 0 | 0 | 0 | 0 |
| BSI0581 Ctrl | 24 | 491 | 3 | 1 | 1.3 | 2 | 7 | 1.7 | 1 | 4 | 1.9 | 0 | 0 | 0 |
| BSI0581 LC | 21 | 332 | 3 | 1 | 1.3 | 0 | 0 | 0 | 1 | 4 | 1.9 | 0 | 0 | 0 |
| BSI0639 Ctrl | 16 | 139 | 6 | 3 | 4.4 | 1 | 1 | 0.8 | 4 | 14 | 7.7 | 2 | 7 | 3.4 |
| BSI0639 LC | 14 | 135 | 0 | 0 | 0 | 0 | 0 | 0 | 5 | 14 | 9.8 | 1 | 2 | 1.9 |
| Epitope/mAb | C4A Association | C4A LC vs. Ctrl | HSP90AB1 Association | HSP90AB1 LC vs. Ctrl | 415 gly | 415 gly LC vs. Ctrl | |
|---|---|---|---|---|---|---|---|
| Proteoform 1 | BSI 449+ | yes | no difference “high” | not detected | not relevant | no difference | LC neutral |
| Proteoform 2a | BSI 581+ | yes | no difference “low” | no difference | no difference | different “high in Ctrl” | LC associated |
| Proteoform 2b | BSI 581+ | yes | no difference “low” | no difference | no difference | different “low in LC” | LC associated |
| Proteoform 3a | BSI 639+ | yes | no difference present in Ctrl only | no difference | no difference | different “high in Ctrl” | LC associated |
| Proteoform 3b | BSI 639+ | no | not relevant | no difference | no difference | different “low in LC” | LC associated |
Disclaimer/Publisher’s Note: The statements, opinions and data contained in all publications are solely those of the individual author(s) and contributor(s) and not of MDPI and/or the editor(s). MDPI and/or the editor(s) disclaim responsibility for any injury to people or property resulting from any ideas, methods, instructions or products referred to in the content. |
© 2023 by the authors. Licensee MDPI, Basel, Switzerland. This article is an open access article distributed under the terms and conditions of the Creative Commons Attribution (CC BY) license (https://creativecommons.org/licenses/by/4.0/).
Share and Cite
Tornyi, I.; Lazar, J.; Pettko-Szandtner, A.; Hunyadi-Gulyas, E.; Takacs, L. Epitomics: Analysis of Plasma C9 Epitope Heterogeneity in the Plasma of Lung Cancer Patients and Control Subjects. Int. J. Mol. Sci. 2023, 24, 14359. https://doi.org/10.3390/ijms241814359
Tornyi I, Lazar J, Pettko-Szandtner A, Hunyadi-Gulyas E, Takacs L. Epitomics: Analysis of Plasma C9 Epitope Heterogeneity in the Plasma of Lung Cancer Patients and Control Subjects. International Journal of Molecular Sciences. 2023; 24(18):14359. https://doi.org/10.3390/ijms241814359
Chicago/Turabian StyleTornyi, Ilona, Jozsef Lazar, Aladar Pettko-Szandtner, Eva Hunyadi-Gulyas, and Laszlo Takacs. 2023. "Epitomics: Analysis of Plasma C9 Epitope Heterogeneity in the Plasma of Lung Cancer Patients and Control Subjects" International Journal of Molecular Sciences 24, no. 18: 14359. https://doi.org/10.3390/ijms241814359
APA StyleTornyi, I., Lazar, J., Pettko-Szandtner, A., Hunyadi-Gulyas, E., & Takacs, L. (2023). Epitomics: Analysis of Plasma C9 Epitope Heterogeneity in the Plasma of Lung Cancer Patients and Control Subjects. International Journal of Molecular Sciences, 24(18), 14359. https://doi.org/10.3390/ijms241814359