
Thermodynamic and Dynamic Transitions and Interaction Aspects in Reorientation Dynamics of Molecular Probe in Organic Compounds: A Series of 1-alkanols with TEMPO


Abstract
1. Introduction
2. Results and Discussion
2.1. Thermodynamic and Crossover Transition Behaviors in 1−alkanols
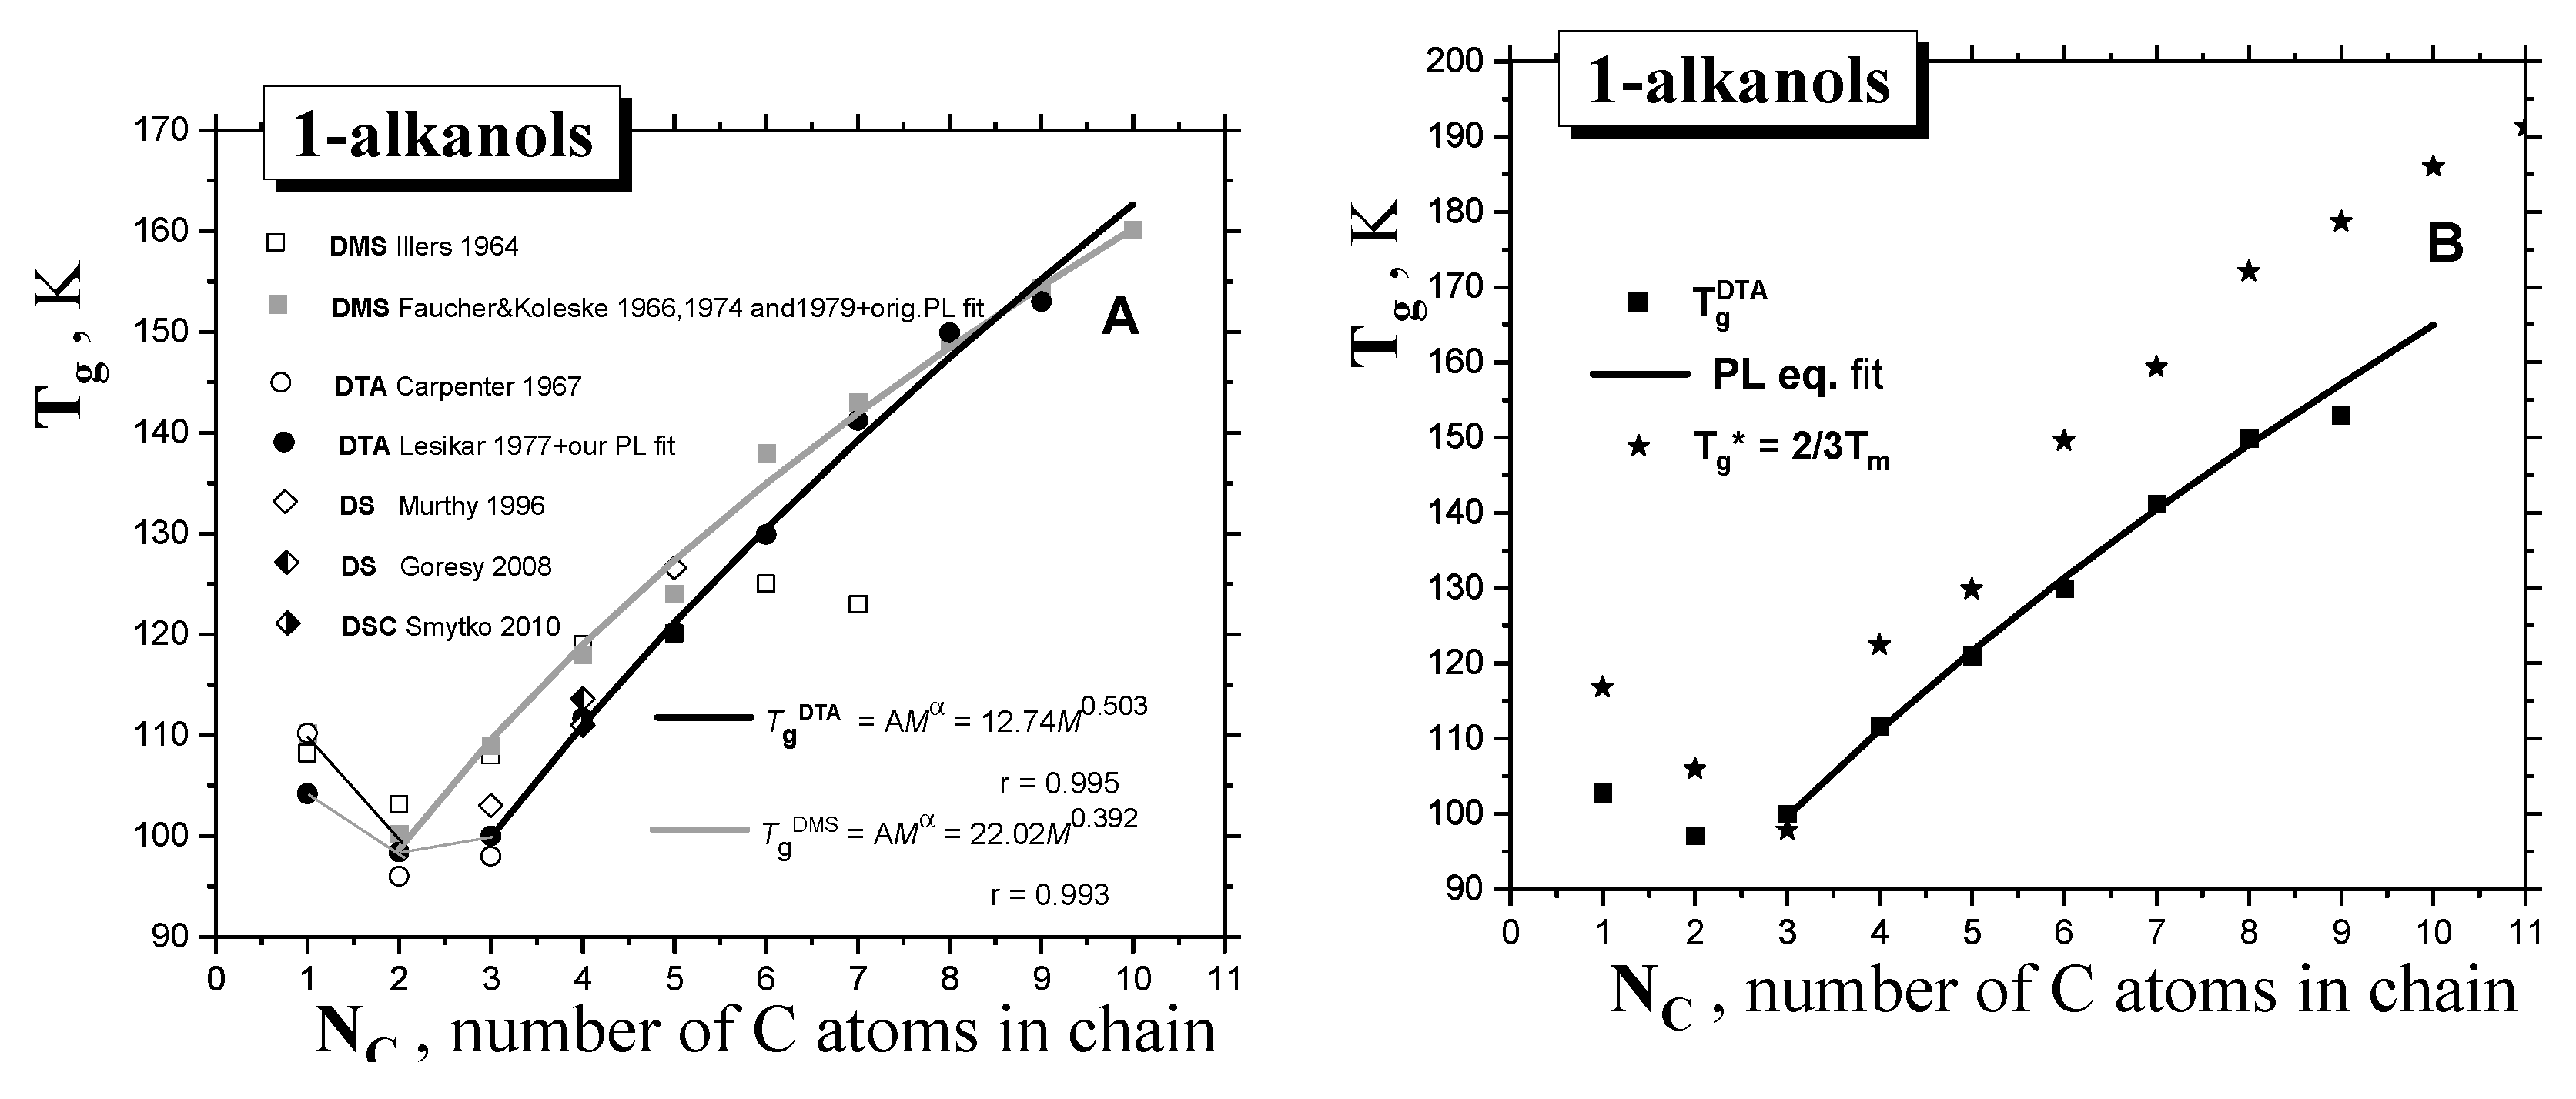
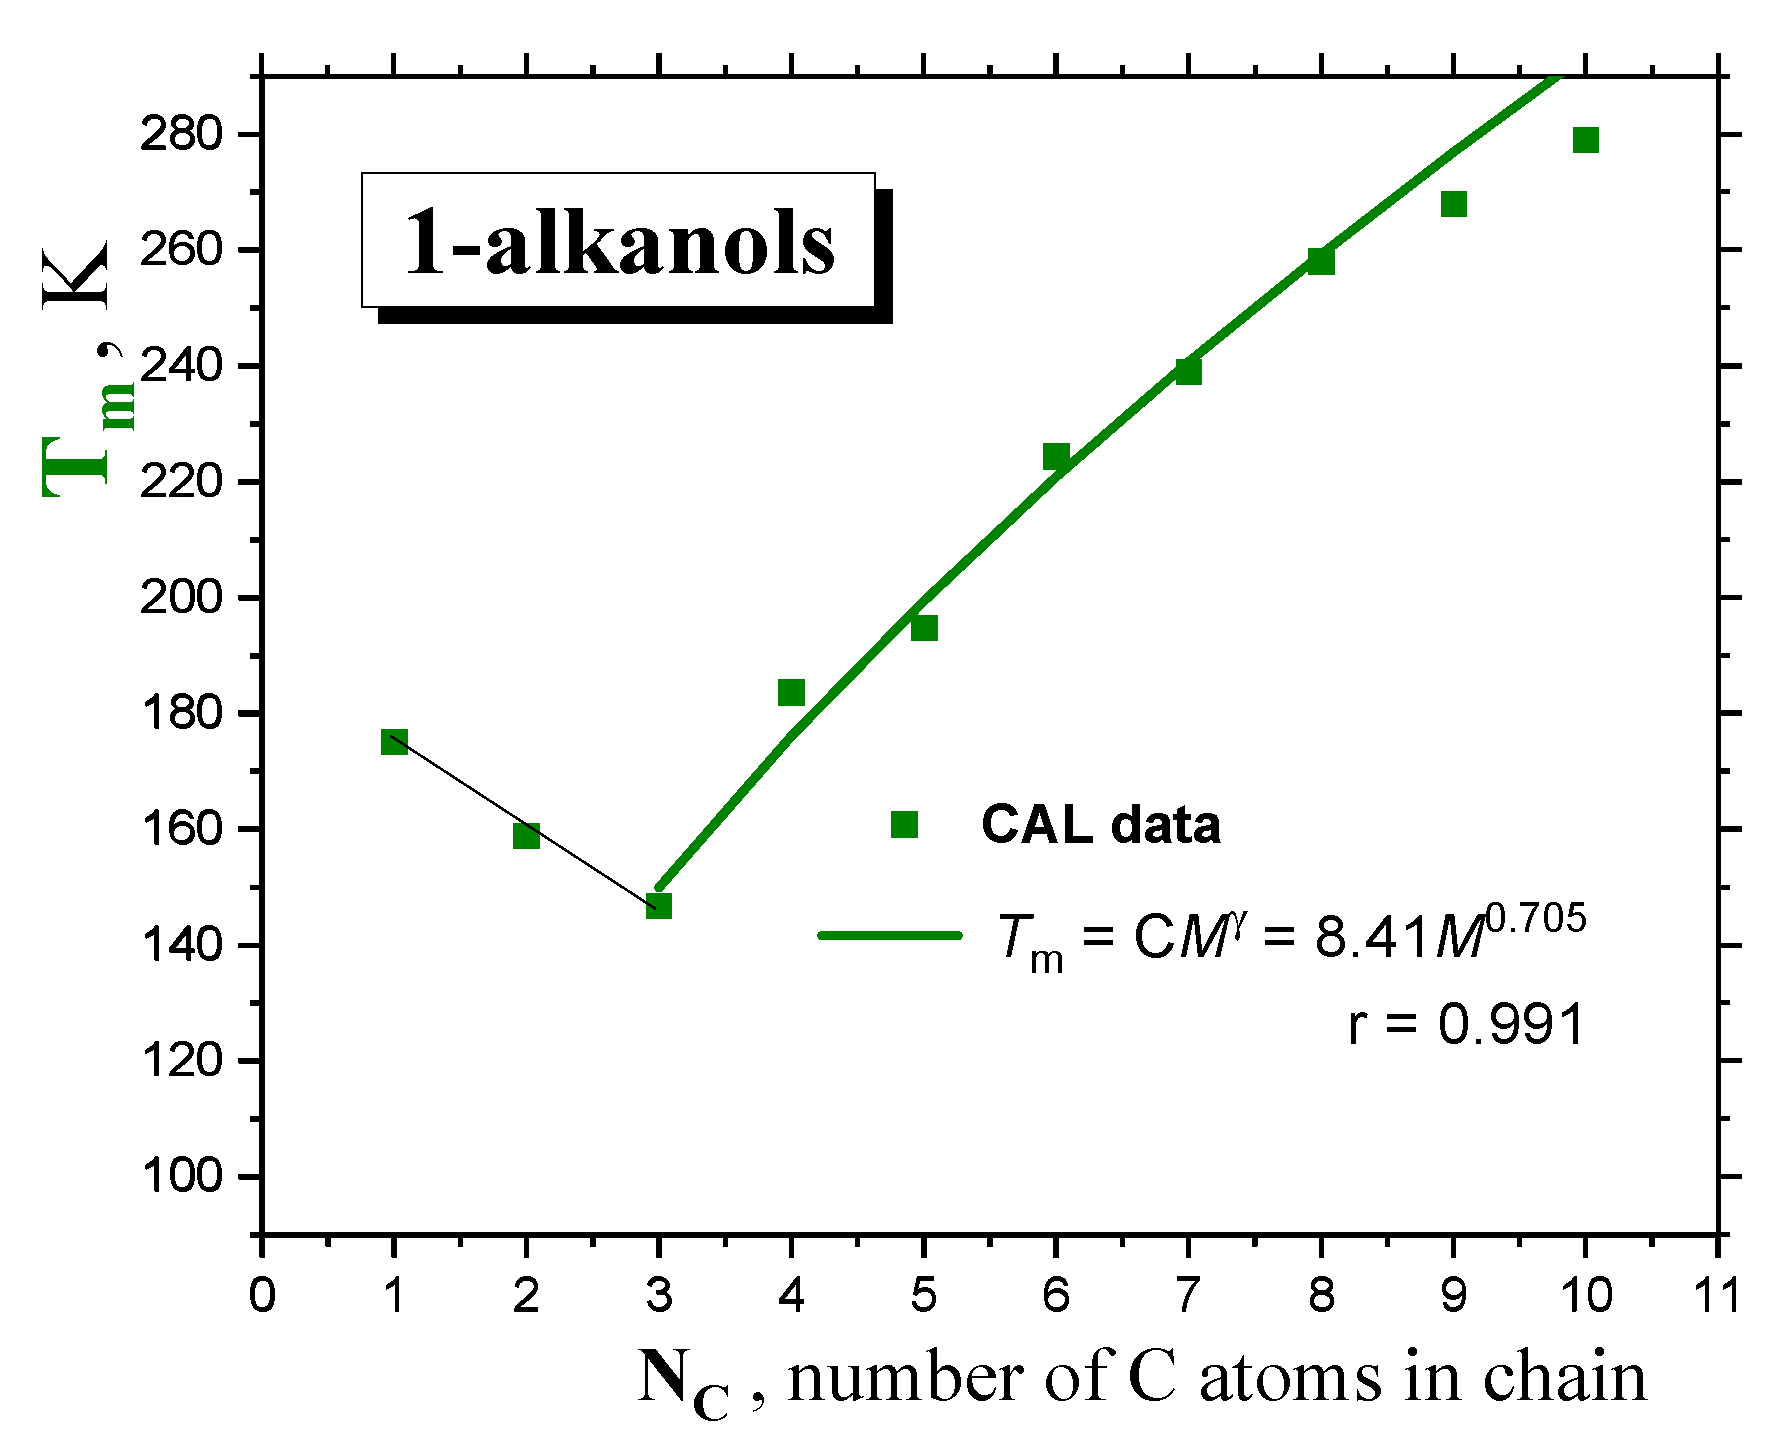
2.1.1. Thermodynamic Transitions in 1−alkanols
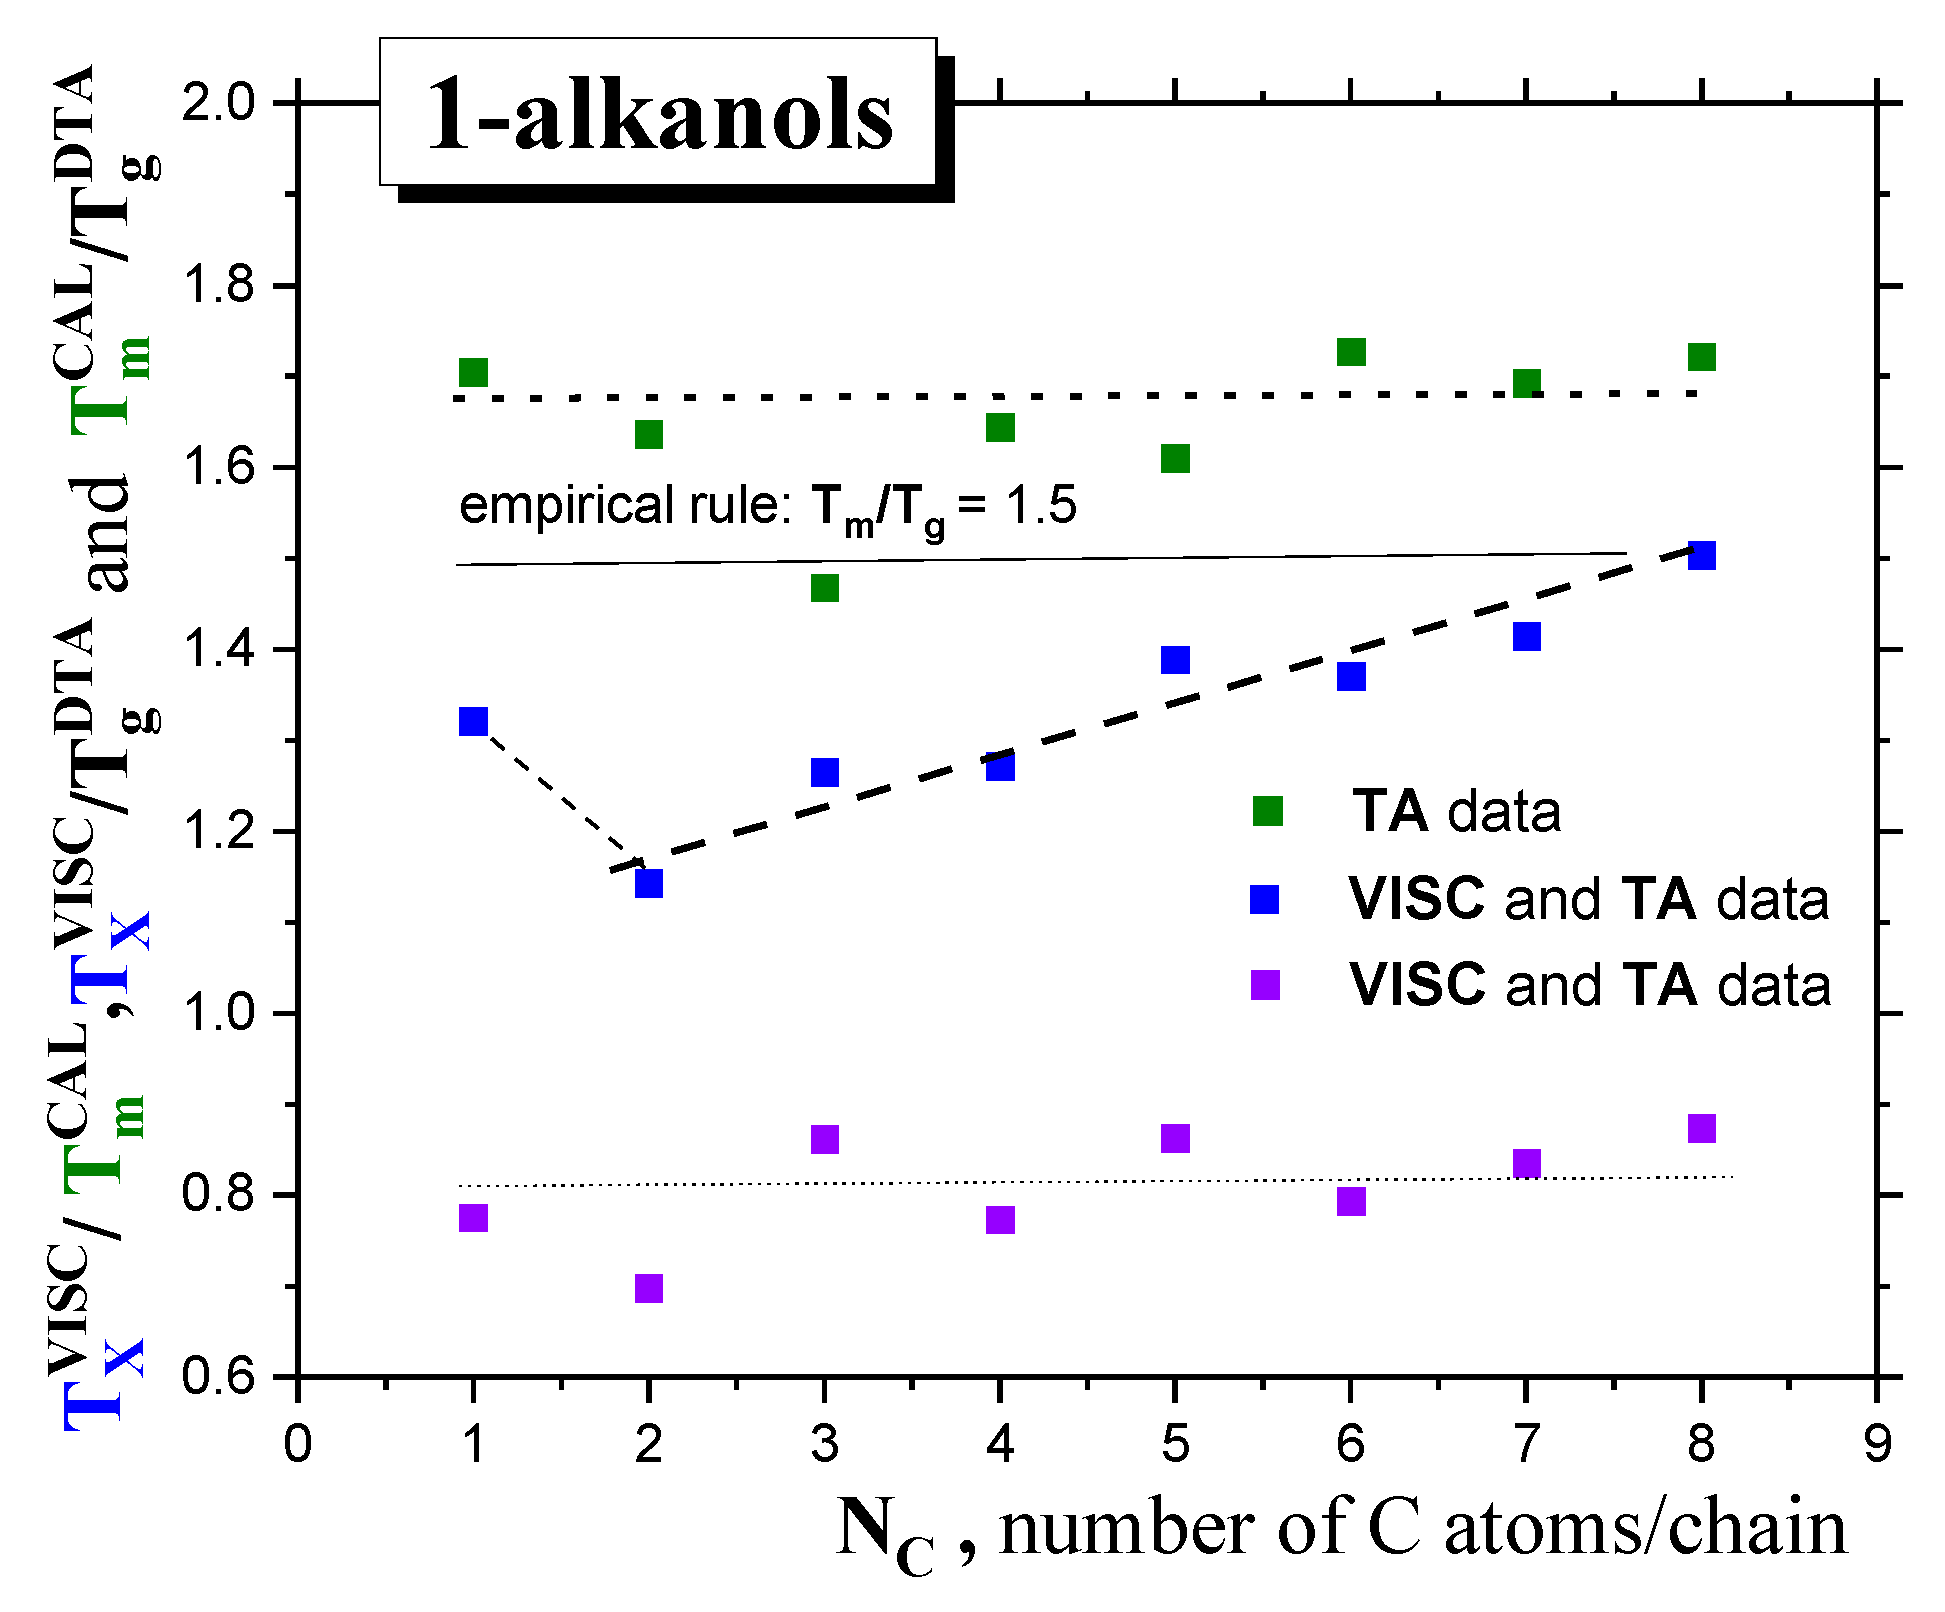
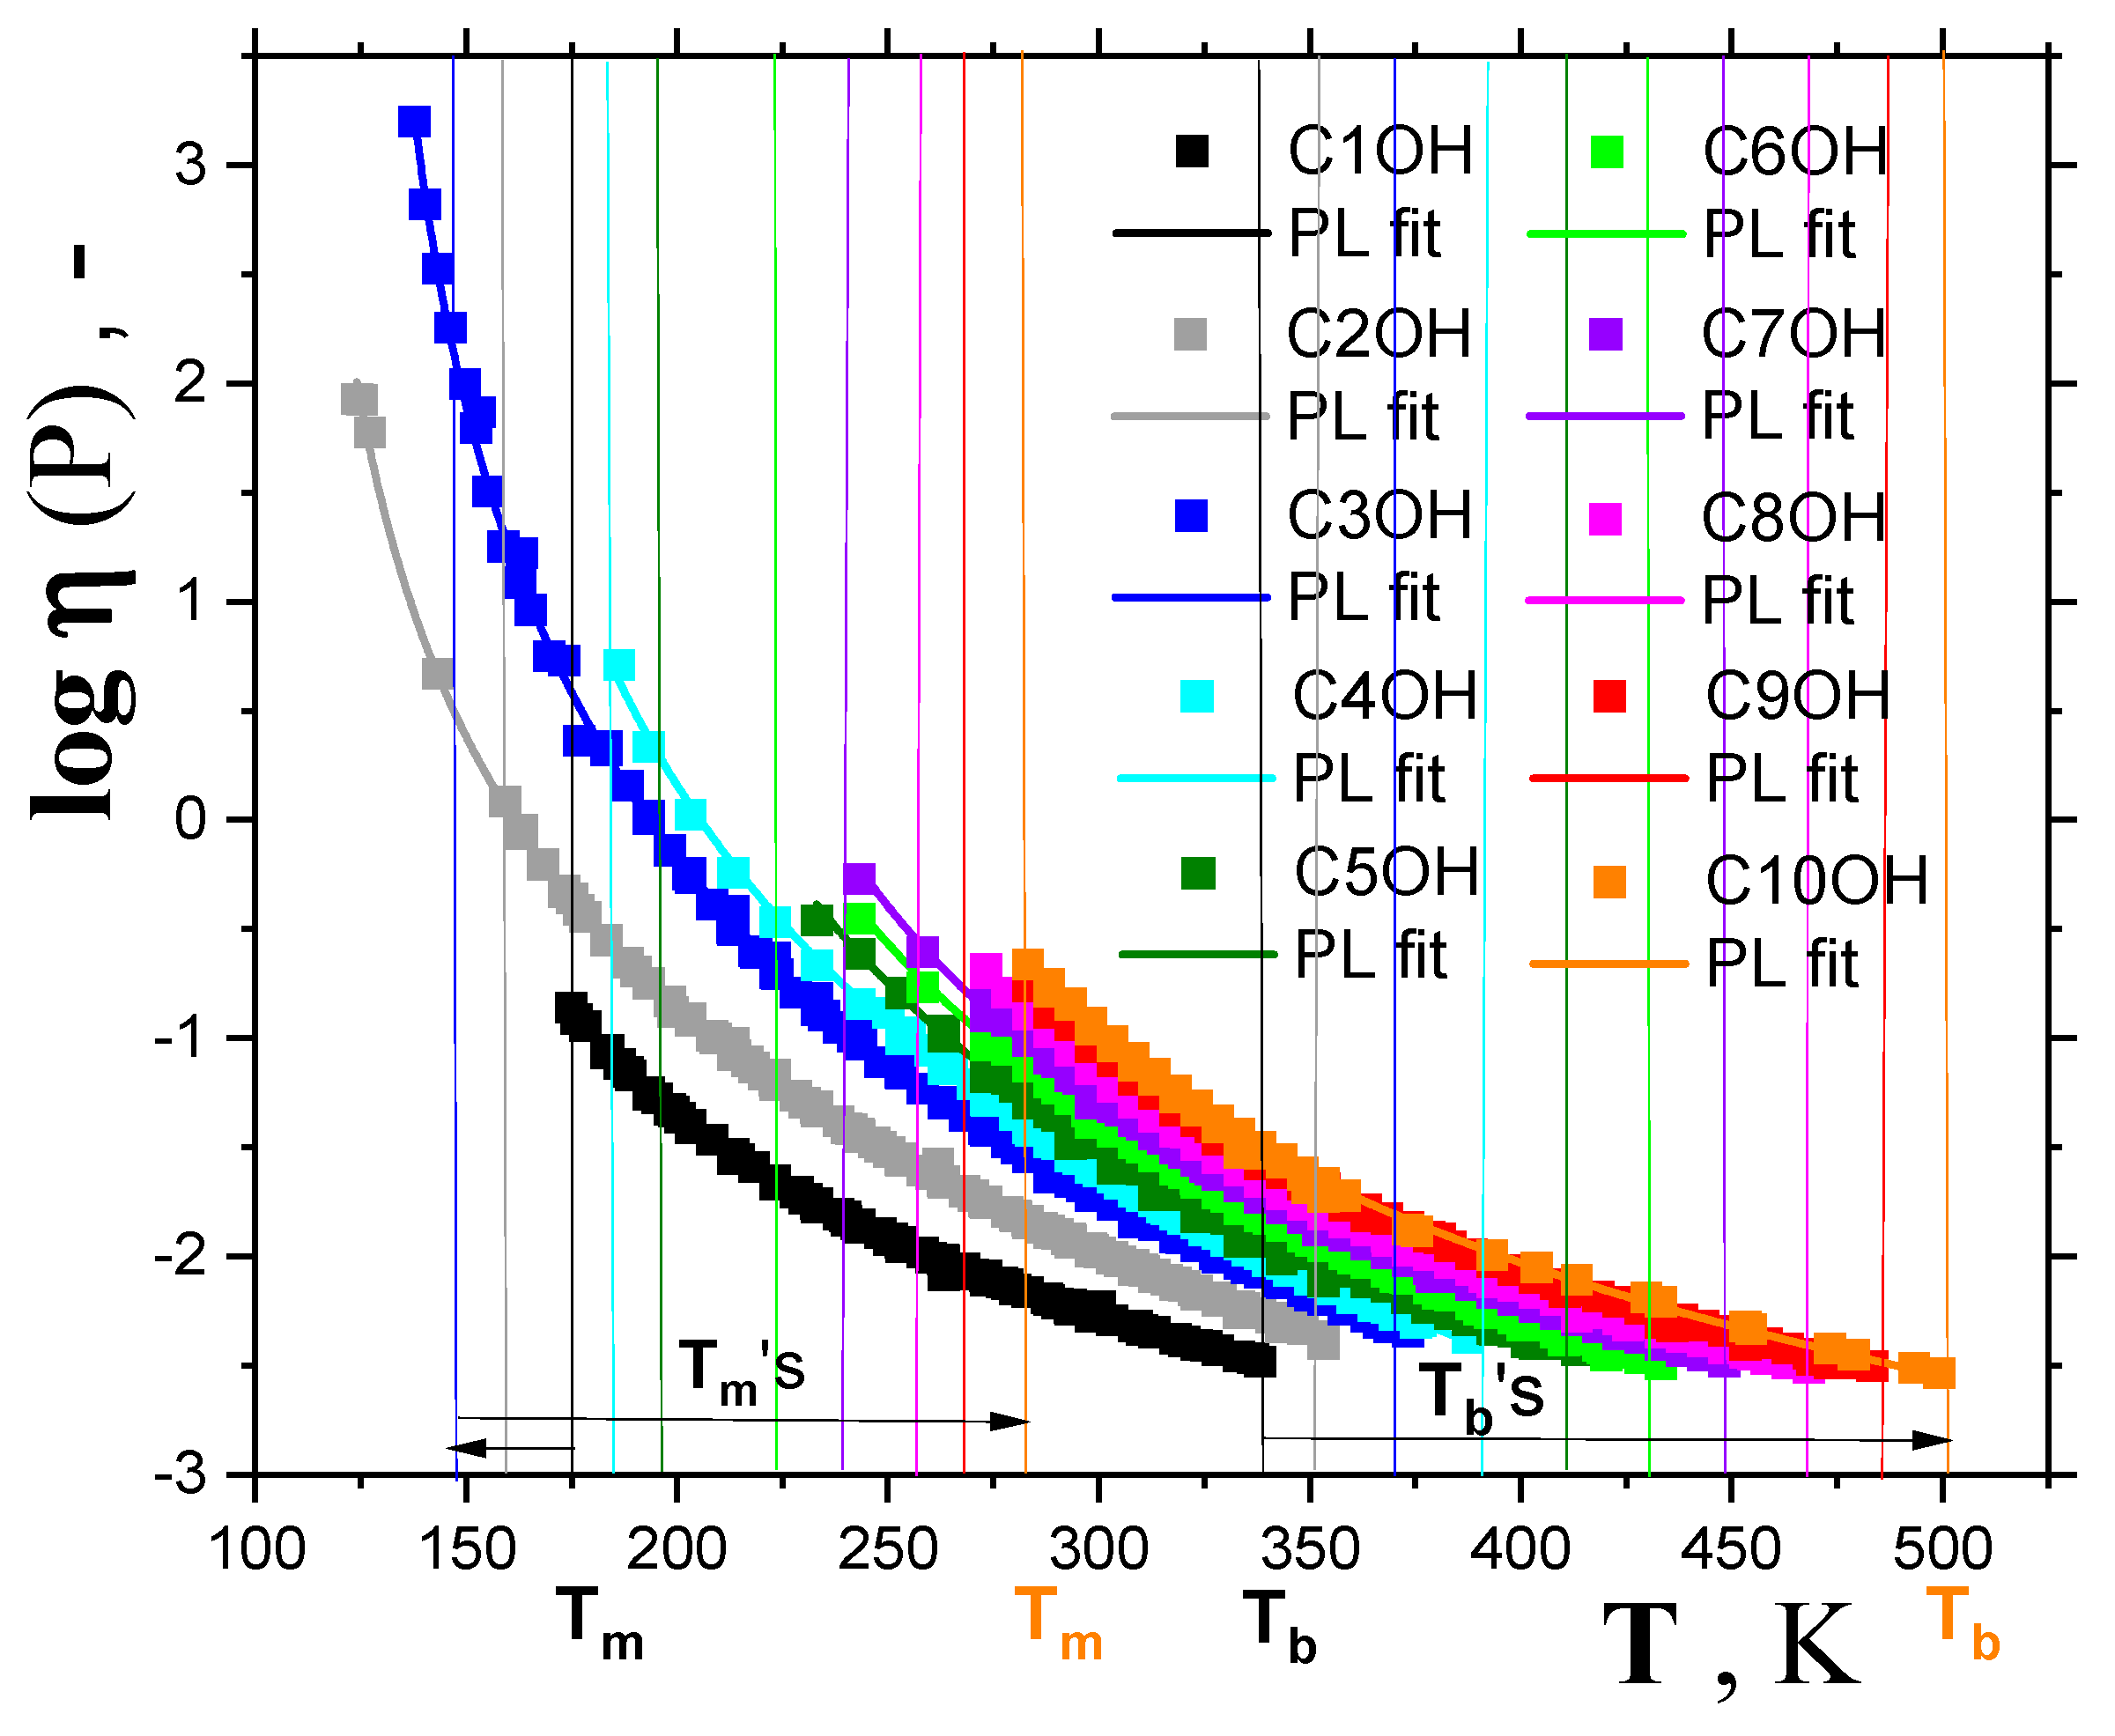
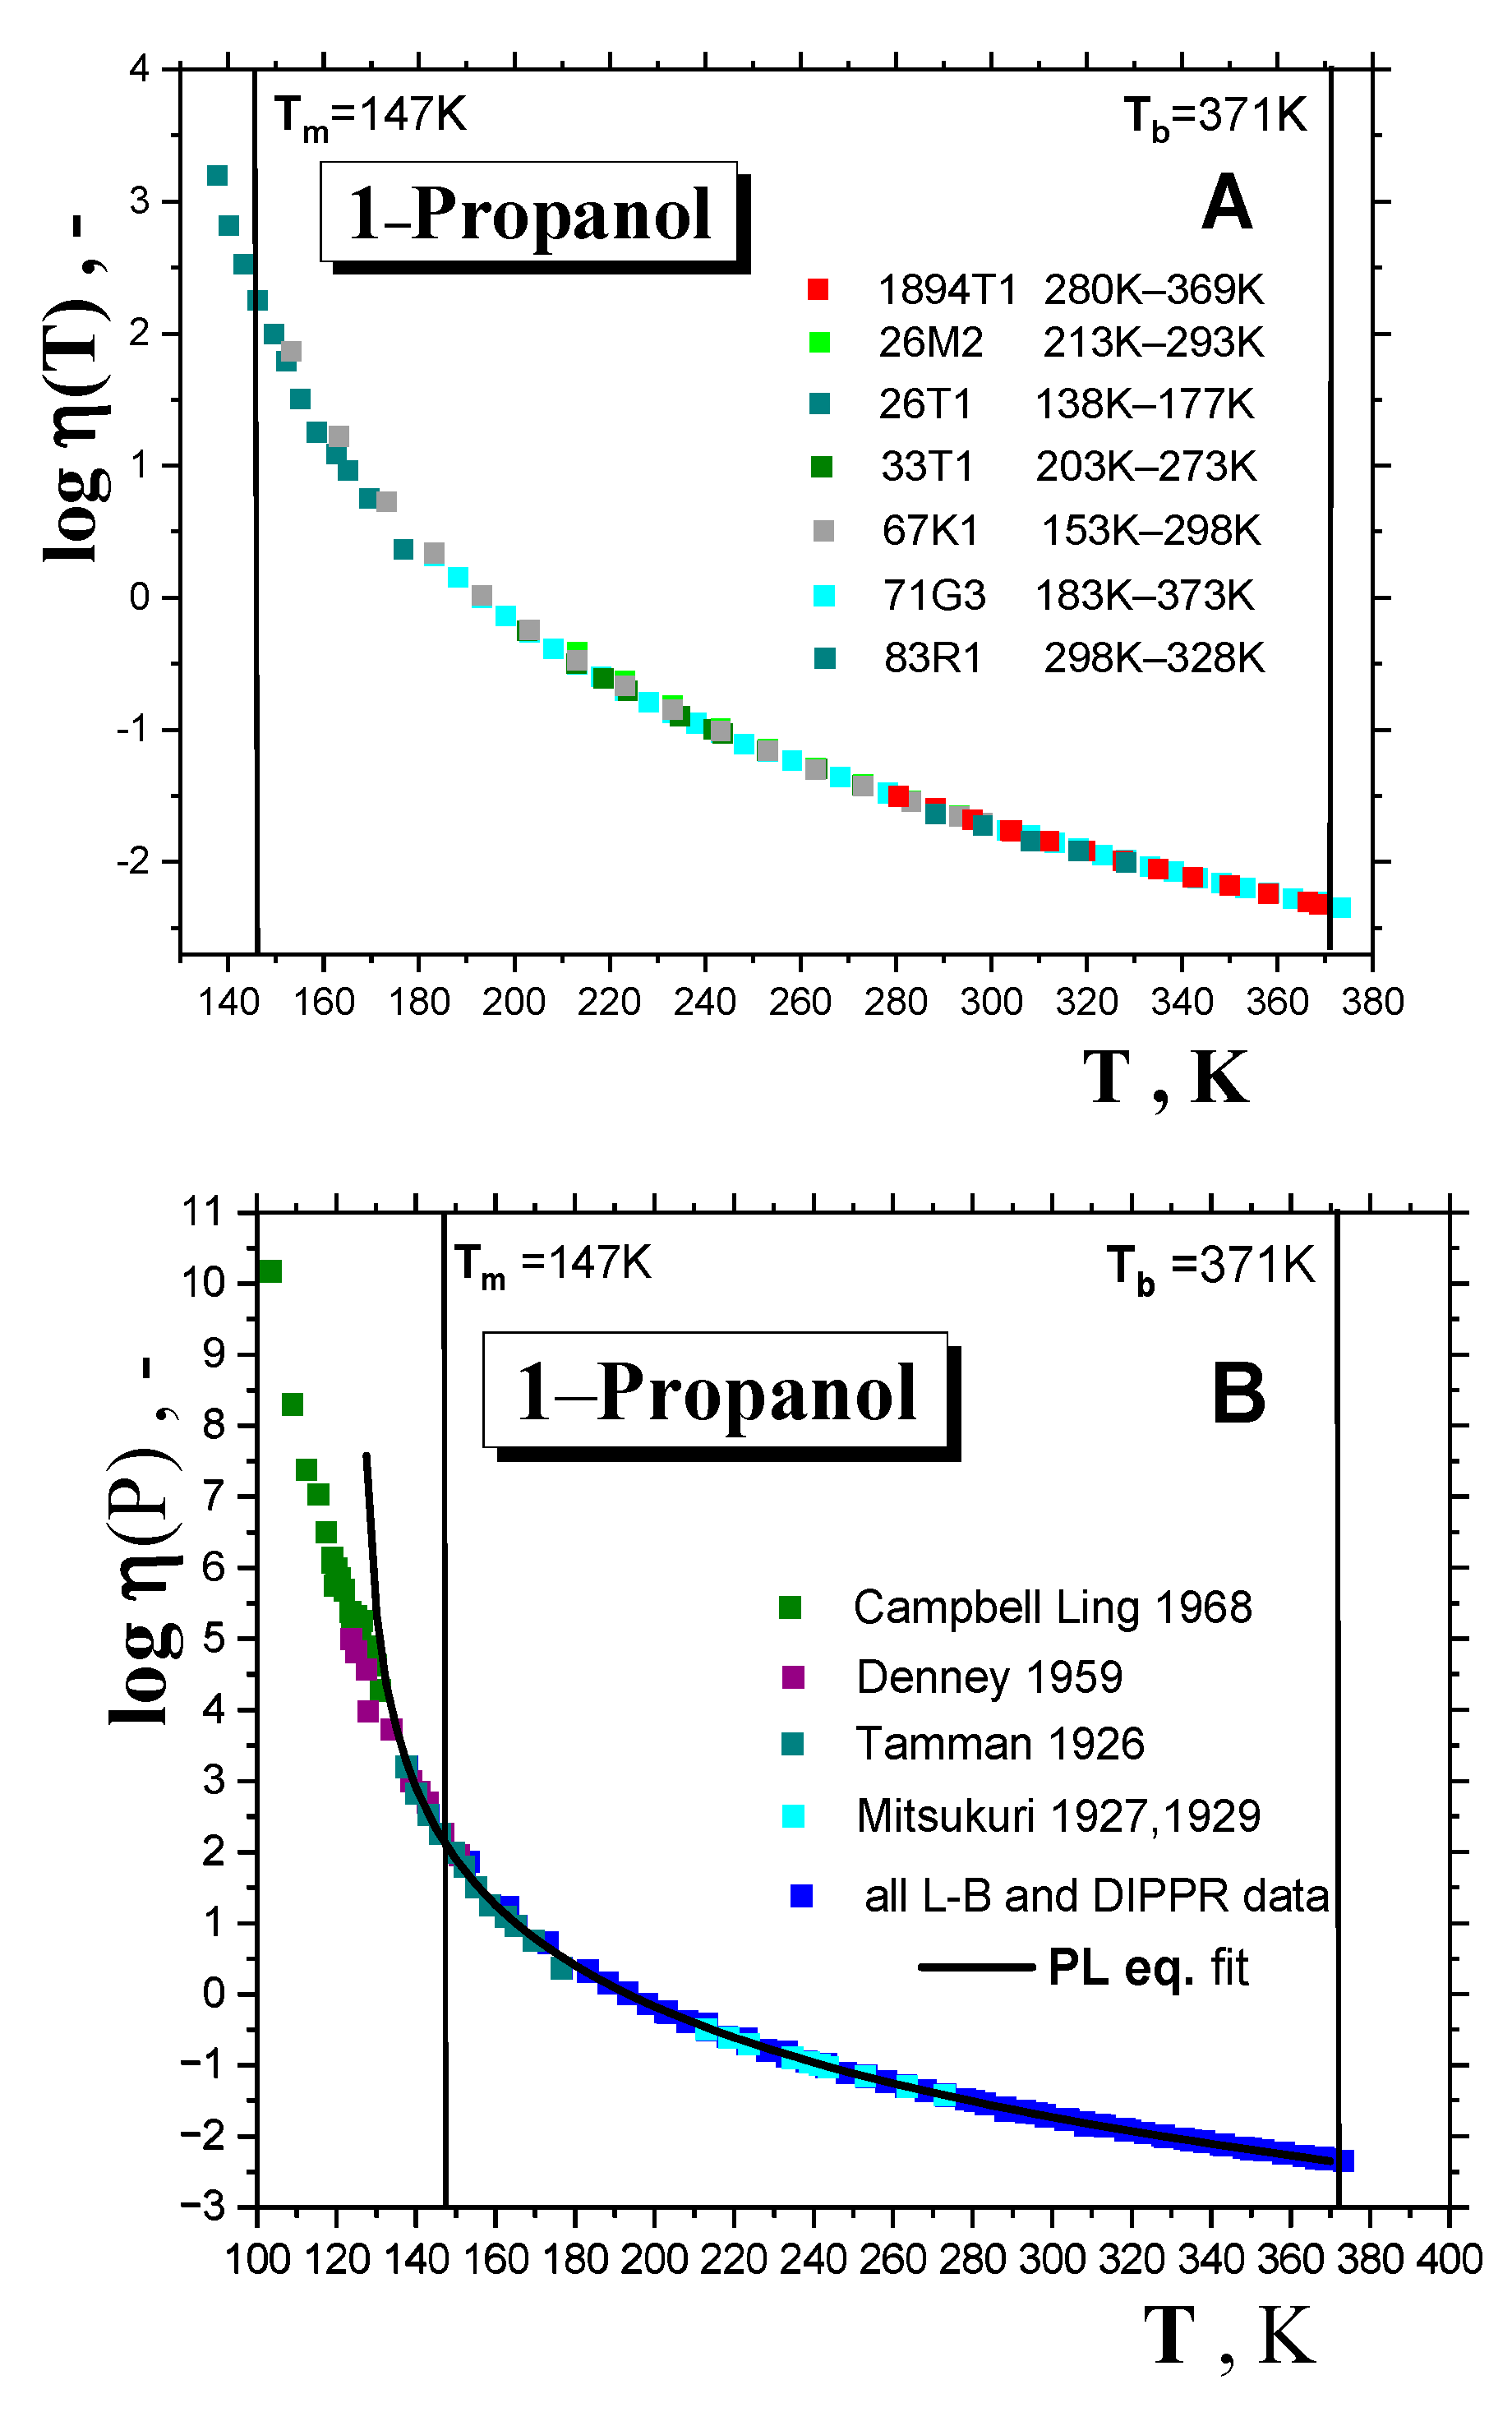
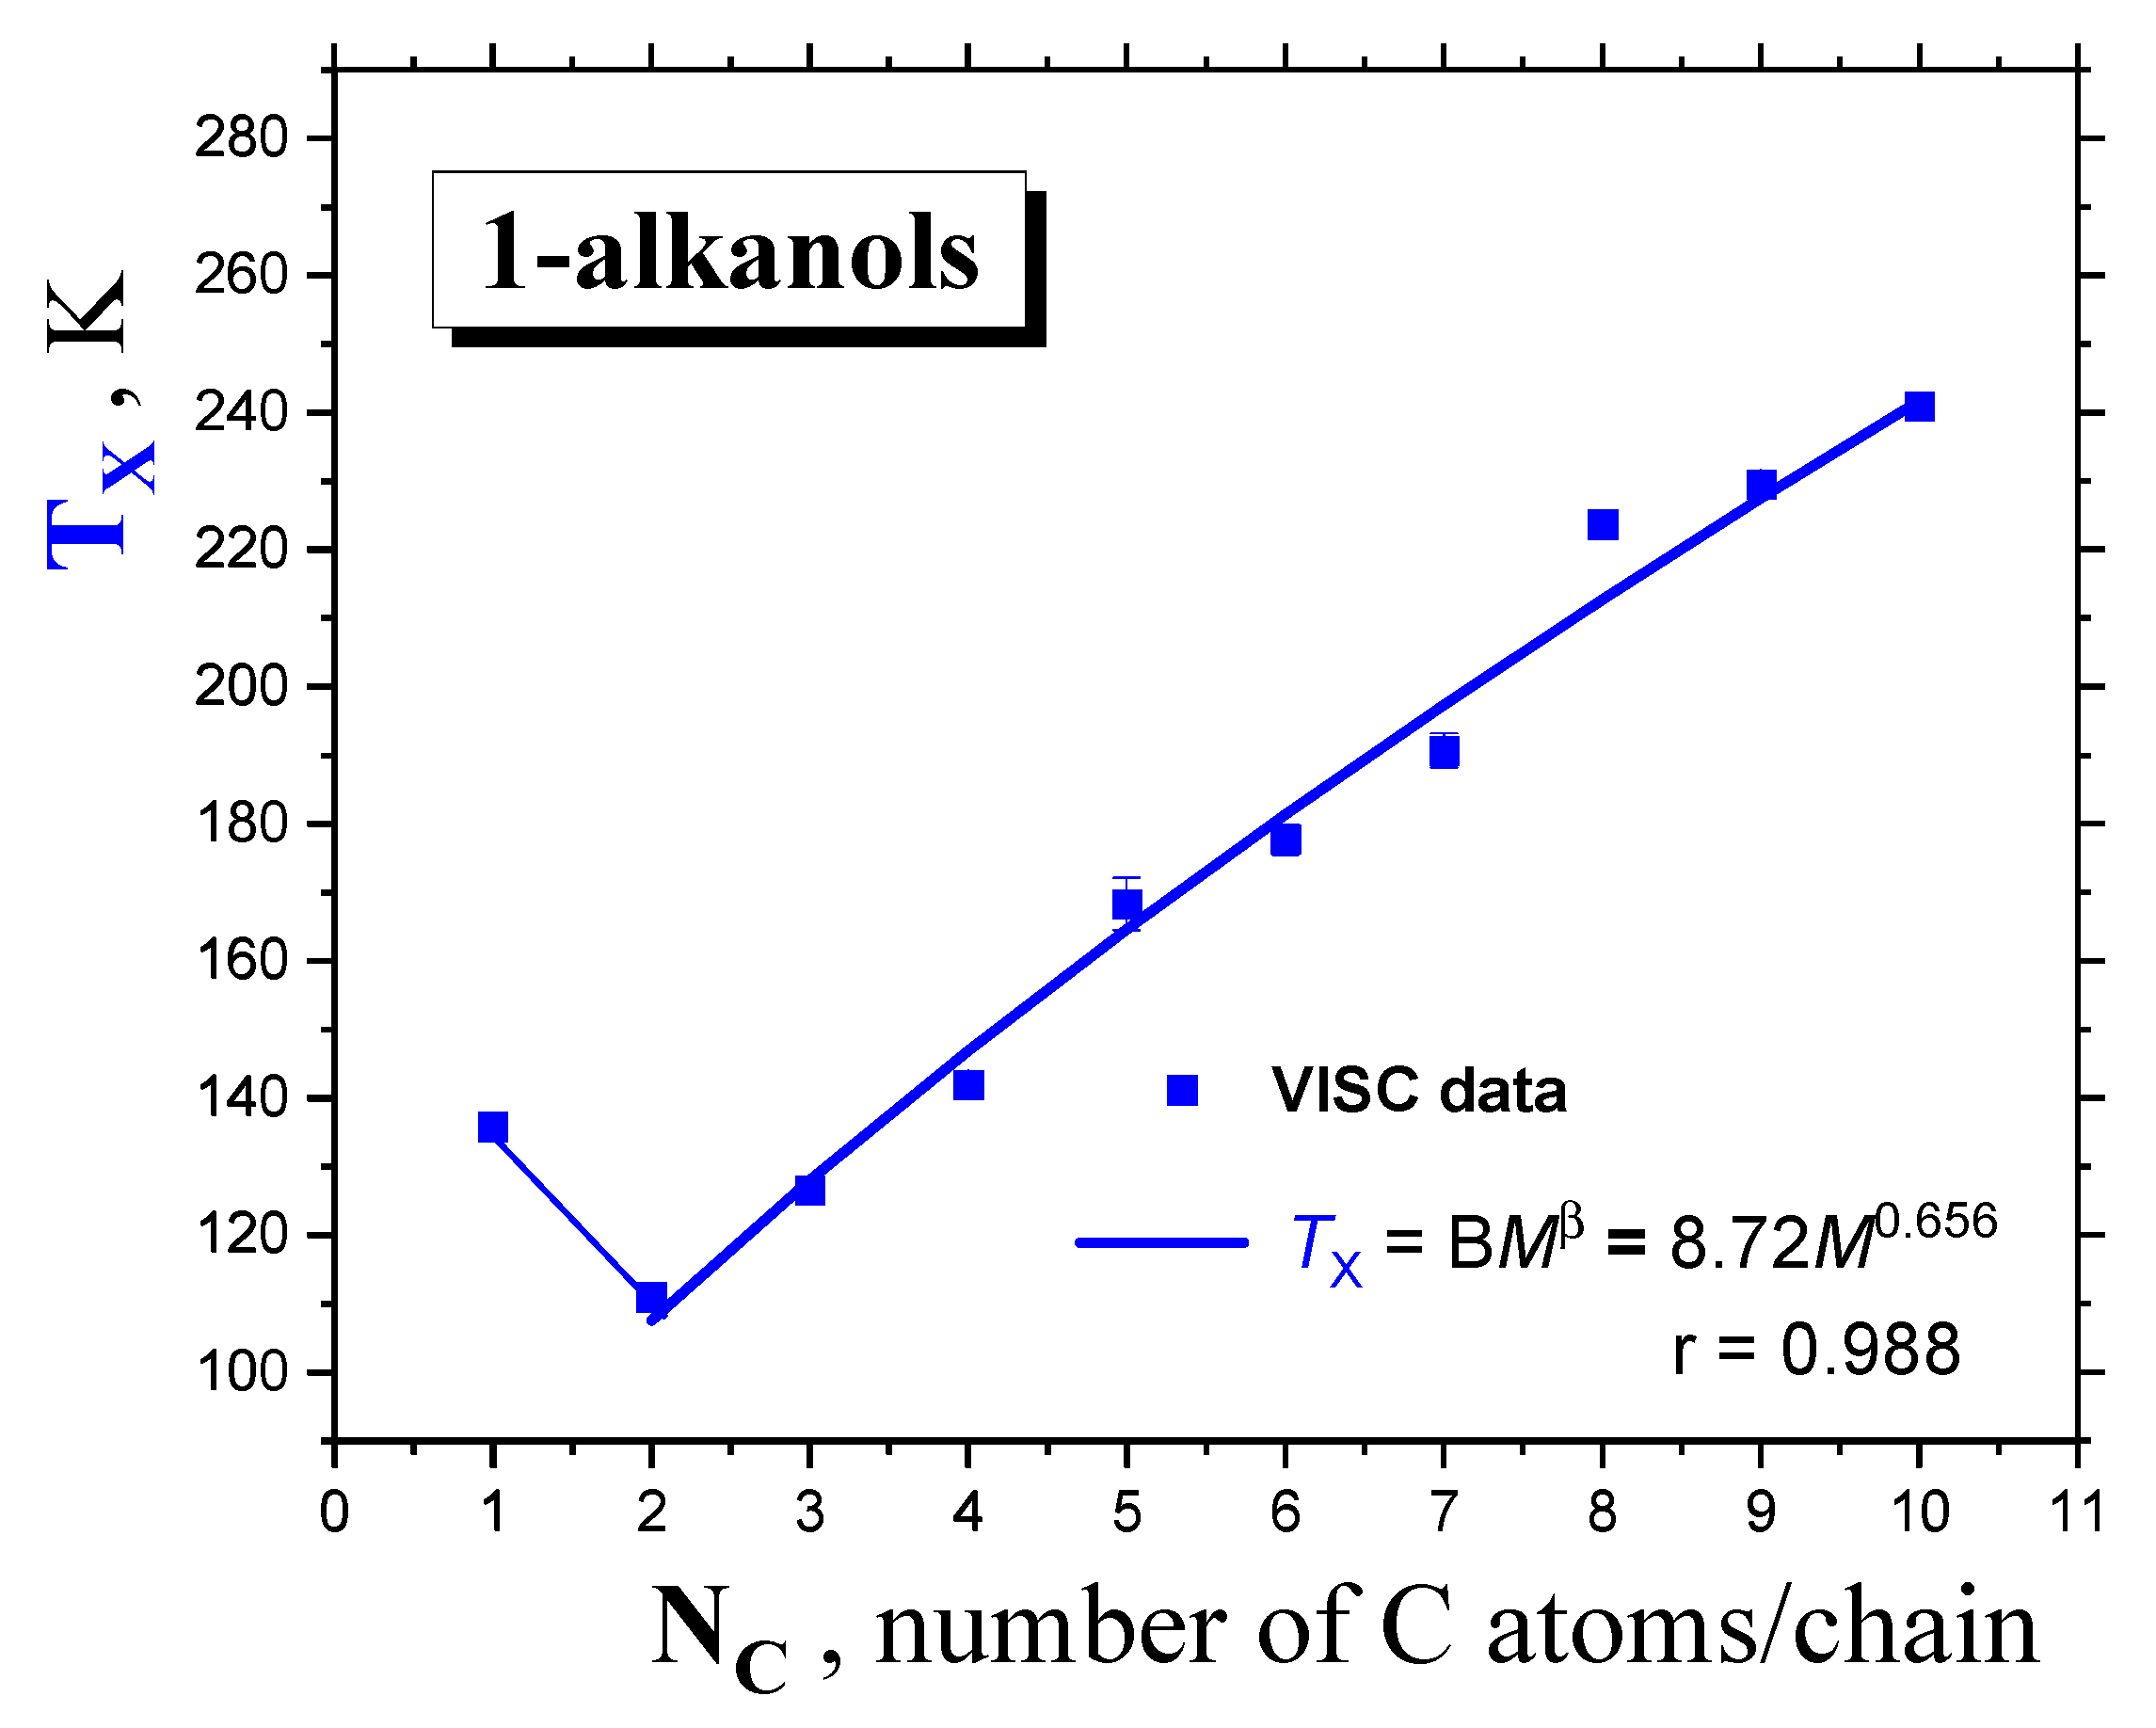
2.1.2. Dynamic Crossovers in 1-alkanols

| 1-alkanol | M g/mol | Tg K | TX K | Tma K | Tba K | Azz’ (100K) b G | Aiso (RT) c G | μgd D | μle D | εrd - |
|---|---|---|---|---|---|---|---|---|---|---|
| MeOH | 32.04 | 108.2 f 110.2 g 103 h 104.2 i | 135.8 1352 | 175.2 | 338 | 37.87 | 16.46 | 1.70 | 2.70 | 33 |
| EtOH | 46.07 | 103.2 f 100.2 g 98.4 i 96 j 97 k | 111 1115 | 158.9 | 351 | 36.81 | 16.30 | 1.69 | 2.81 | 25.3 |
| 1-PrOH | 60.10 | 108 f 98 j 109 g 100 i 103 l 110 m | 126.5 1399 | 146.8 | 371 | 36.15 | 16.23 | 1.68 | 2.87 | 20.8 |
| 1-BuOH | 74.12 | 119 f 111.7 i 113.6 n 111 o 119 m | 142 | 183.7 | 391 | 35.95 | 16.16 | 1.66 | 2.88 | 17.8 |
| 1-PentOH | 88.15 | 120.1 f 124 g 120 i 126.1 l 127.4 m | 168 | 194.8 | 411 | 35.9 | 16.05 | 1.70 | 2.97 | 15.1 |
| 1-HxOH | 102.18 | 125 f 138 g 129.9 i 135 m | 178 | 224.4 | 430 | 35.75 | 15.91 | 1.65 | 2.87 | 13.0 |
| 1-HptOH | 116.20 | 123 f 143 g 141.2 i 141.9 m | 199.7 | 239 | 449 | 35.60 | 15.88 | 1.71 | 2.99 | 11.75 |
| 1-OctOH | 130.23 | 149 g 149.9 i 148.3 m | 225.4 | 258.1 | 468 | 35.45 | 15.83 | 1.68 | 2.90 | 10.30 |
| 1-NonOH | 144.25 | 153 i 154.4 m | 236 | 268 | 487 | 35.25 | 15.75 | 1.60 | 2.73 | 8.83 |
| 1-DecOH | 158.28 | (160.1) m | 239 | 279 | 501 | 35.15 | 15.70 | 1.60 | 2.70 | 7.93 |
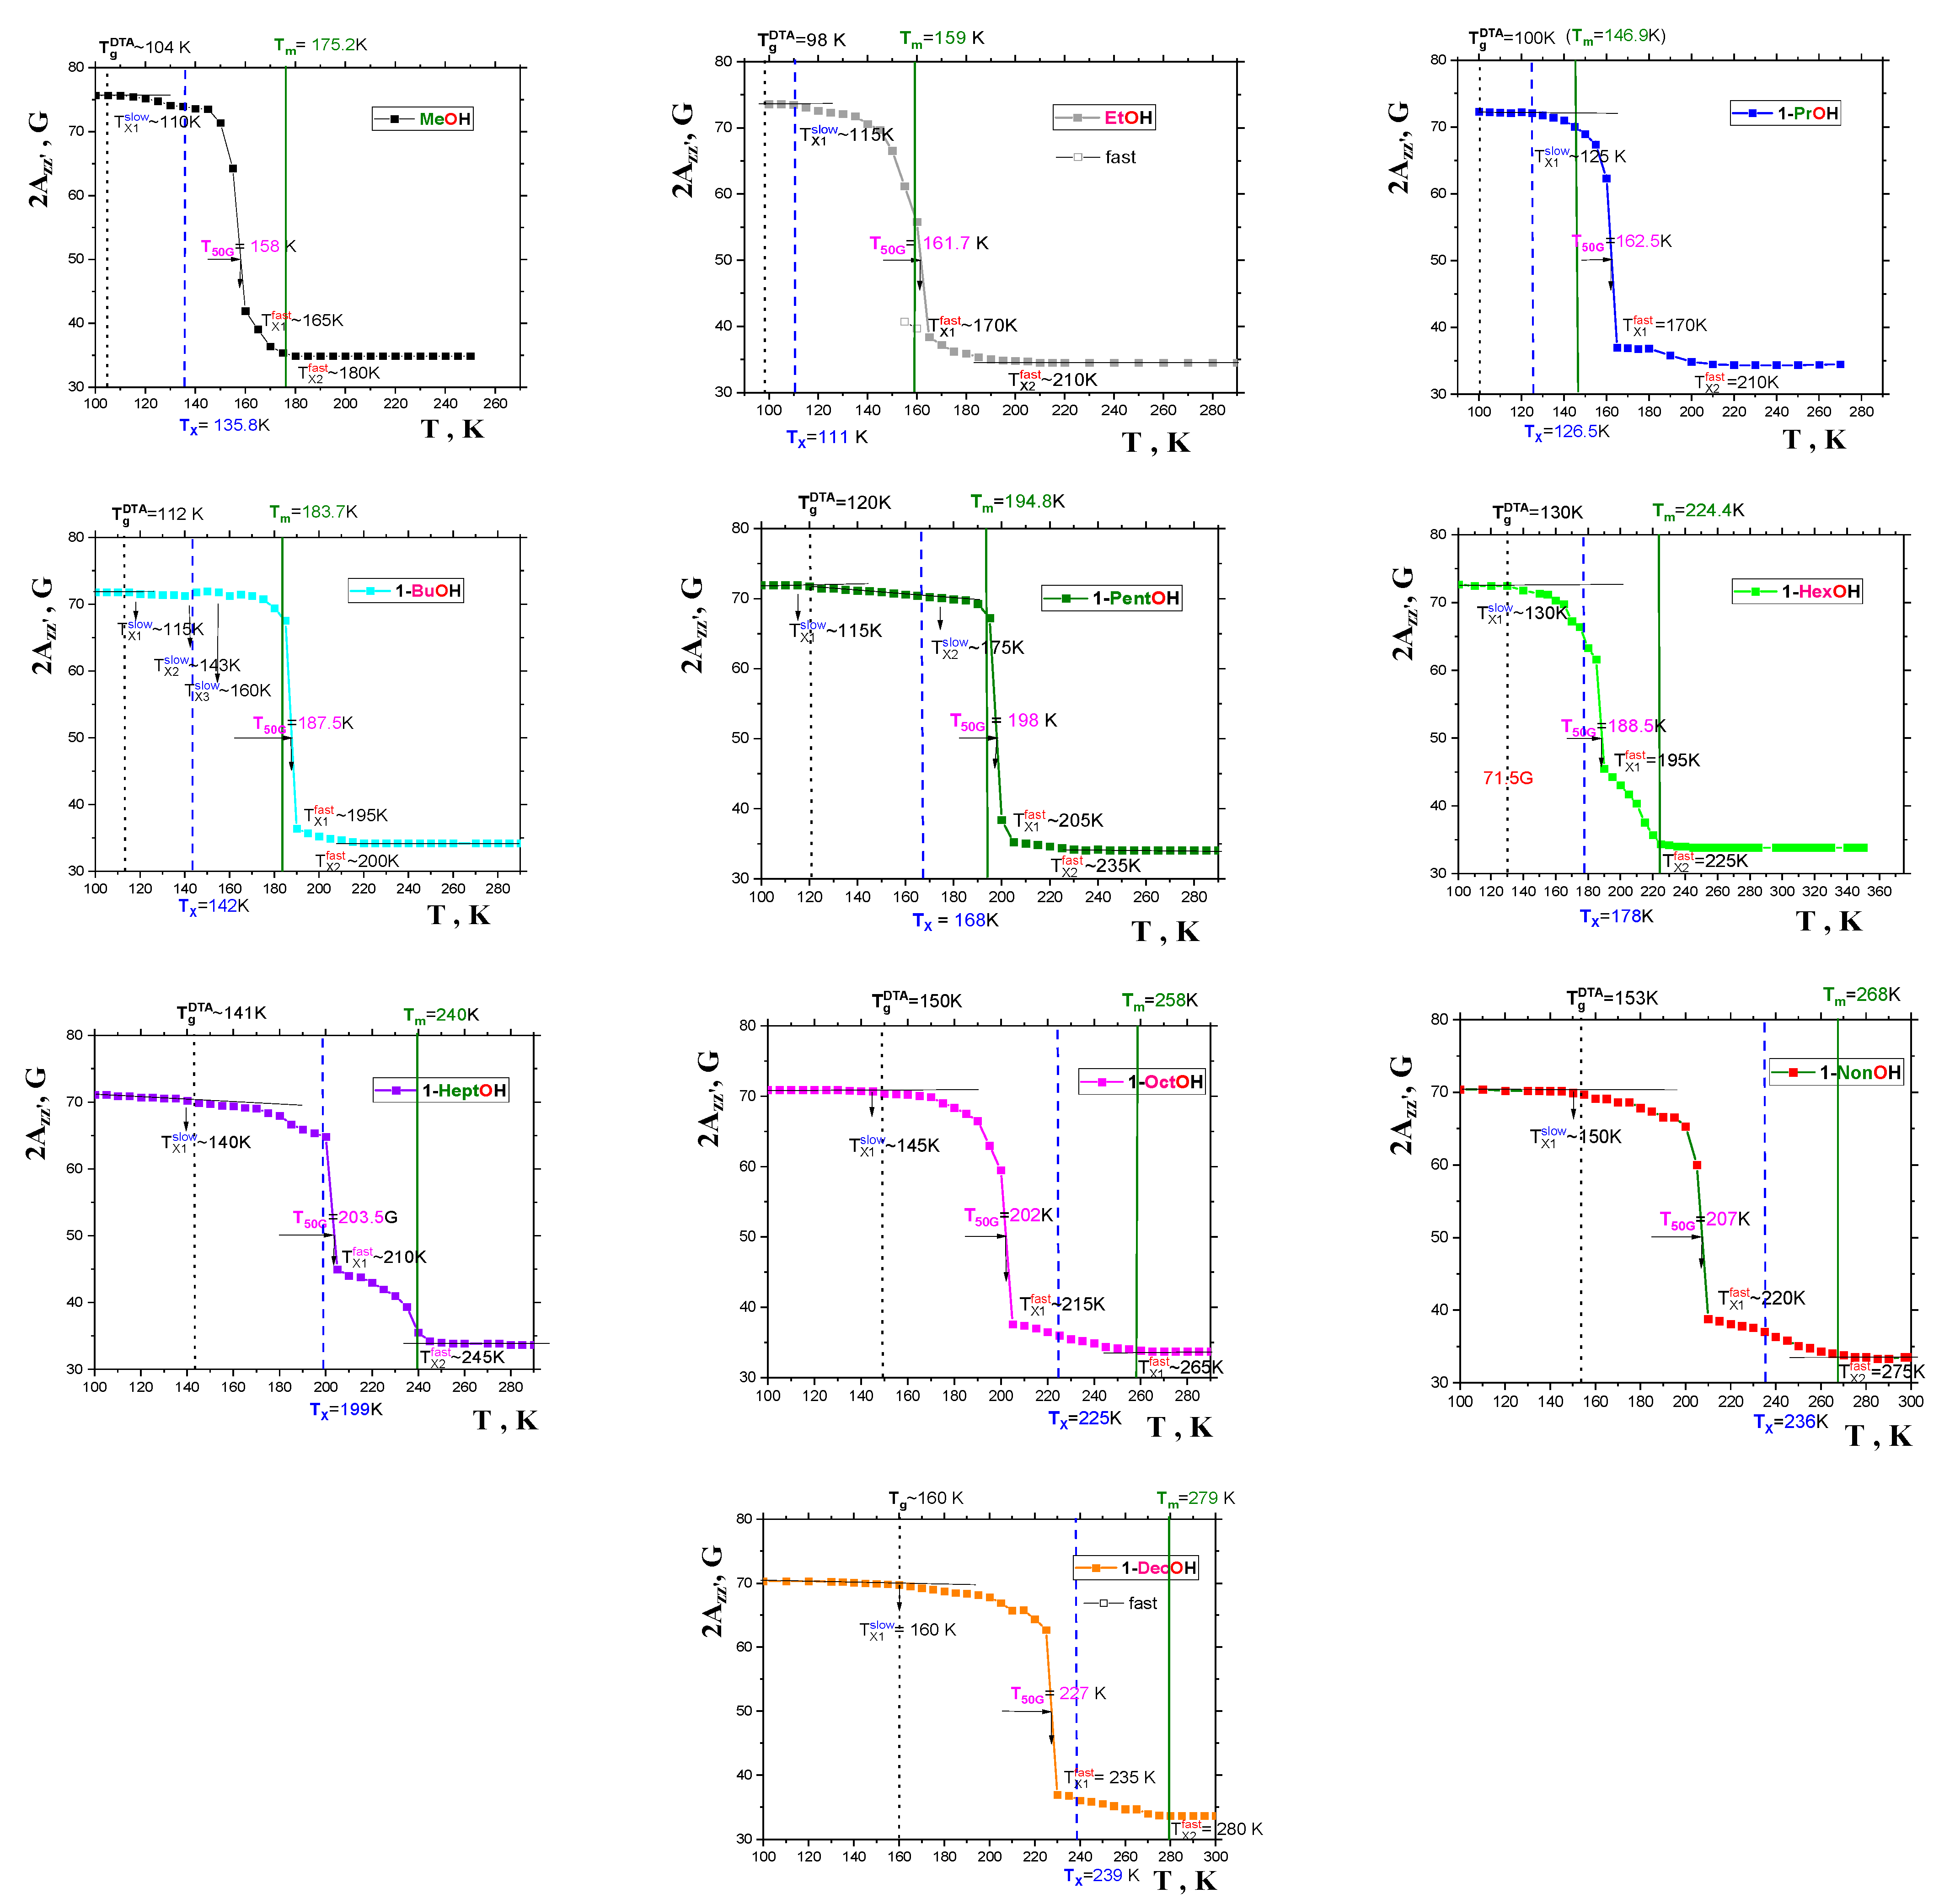
2.2. ESR Data
2.2.1. General Spectral and Dynamic Features
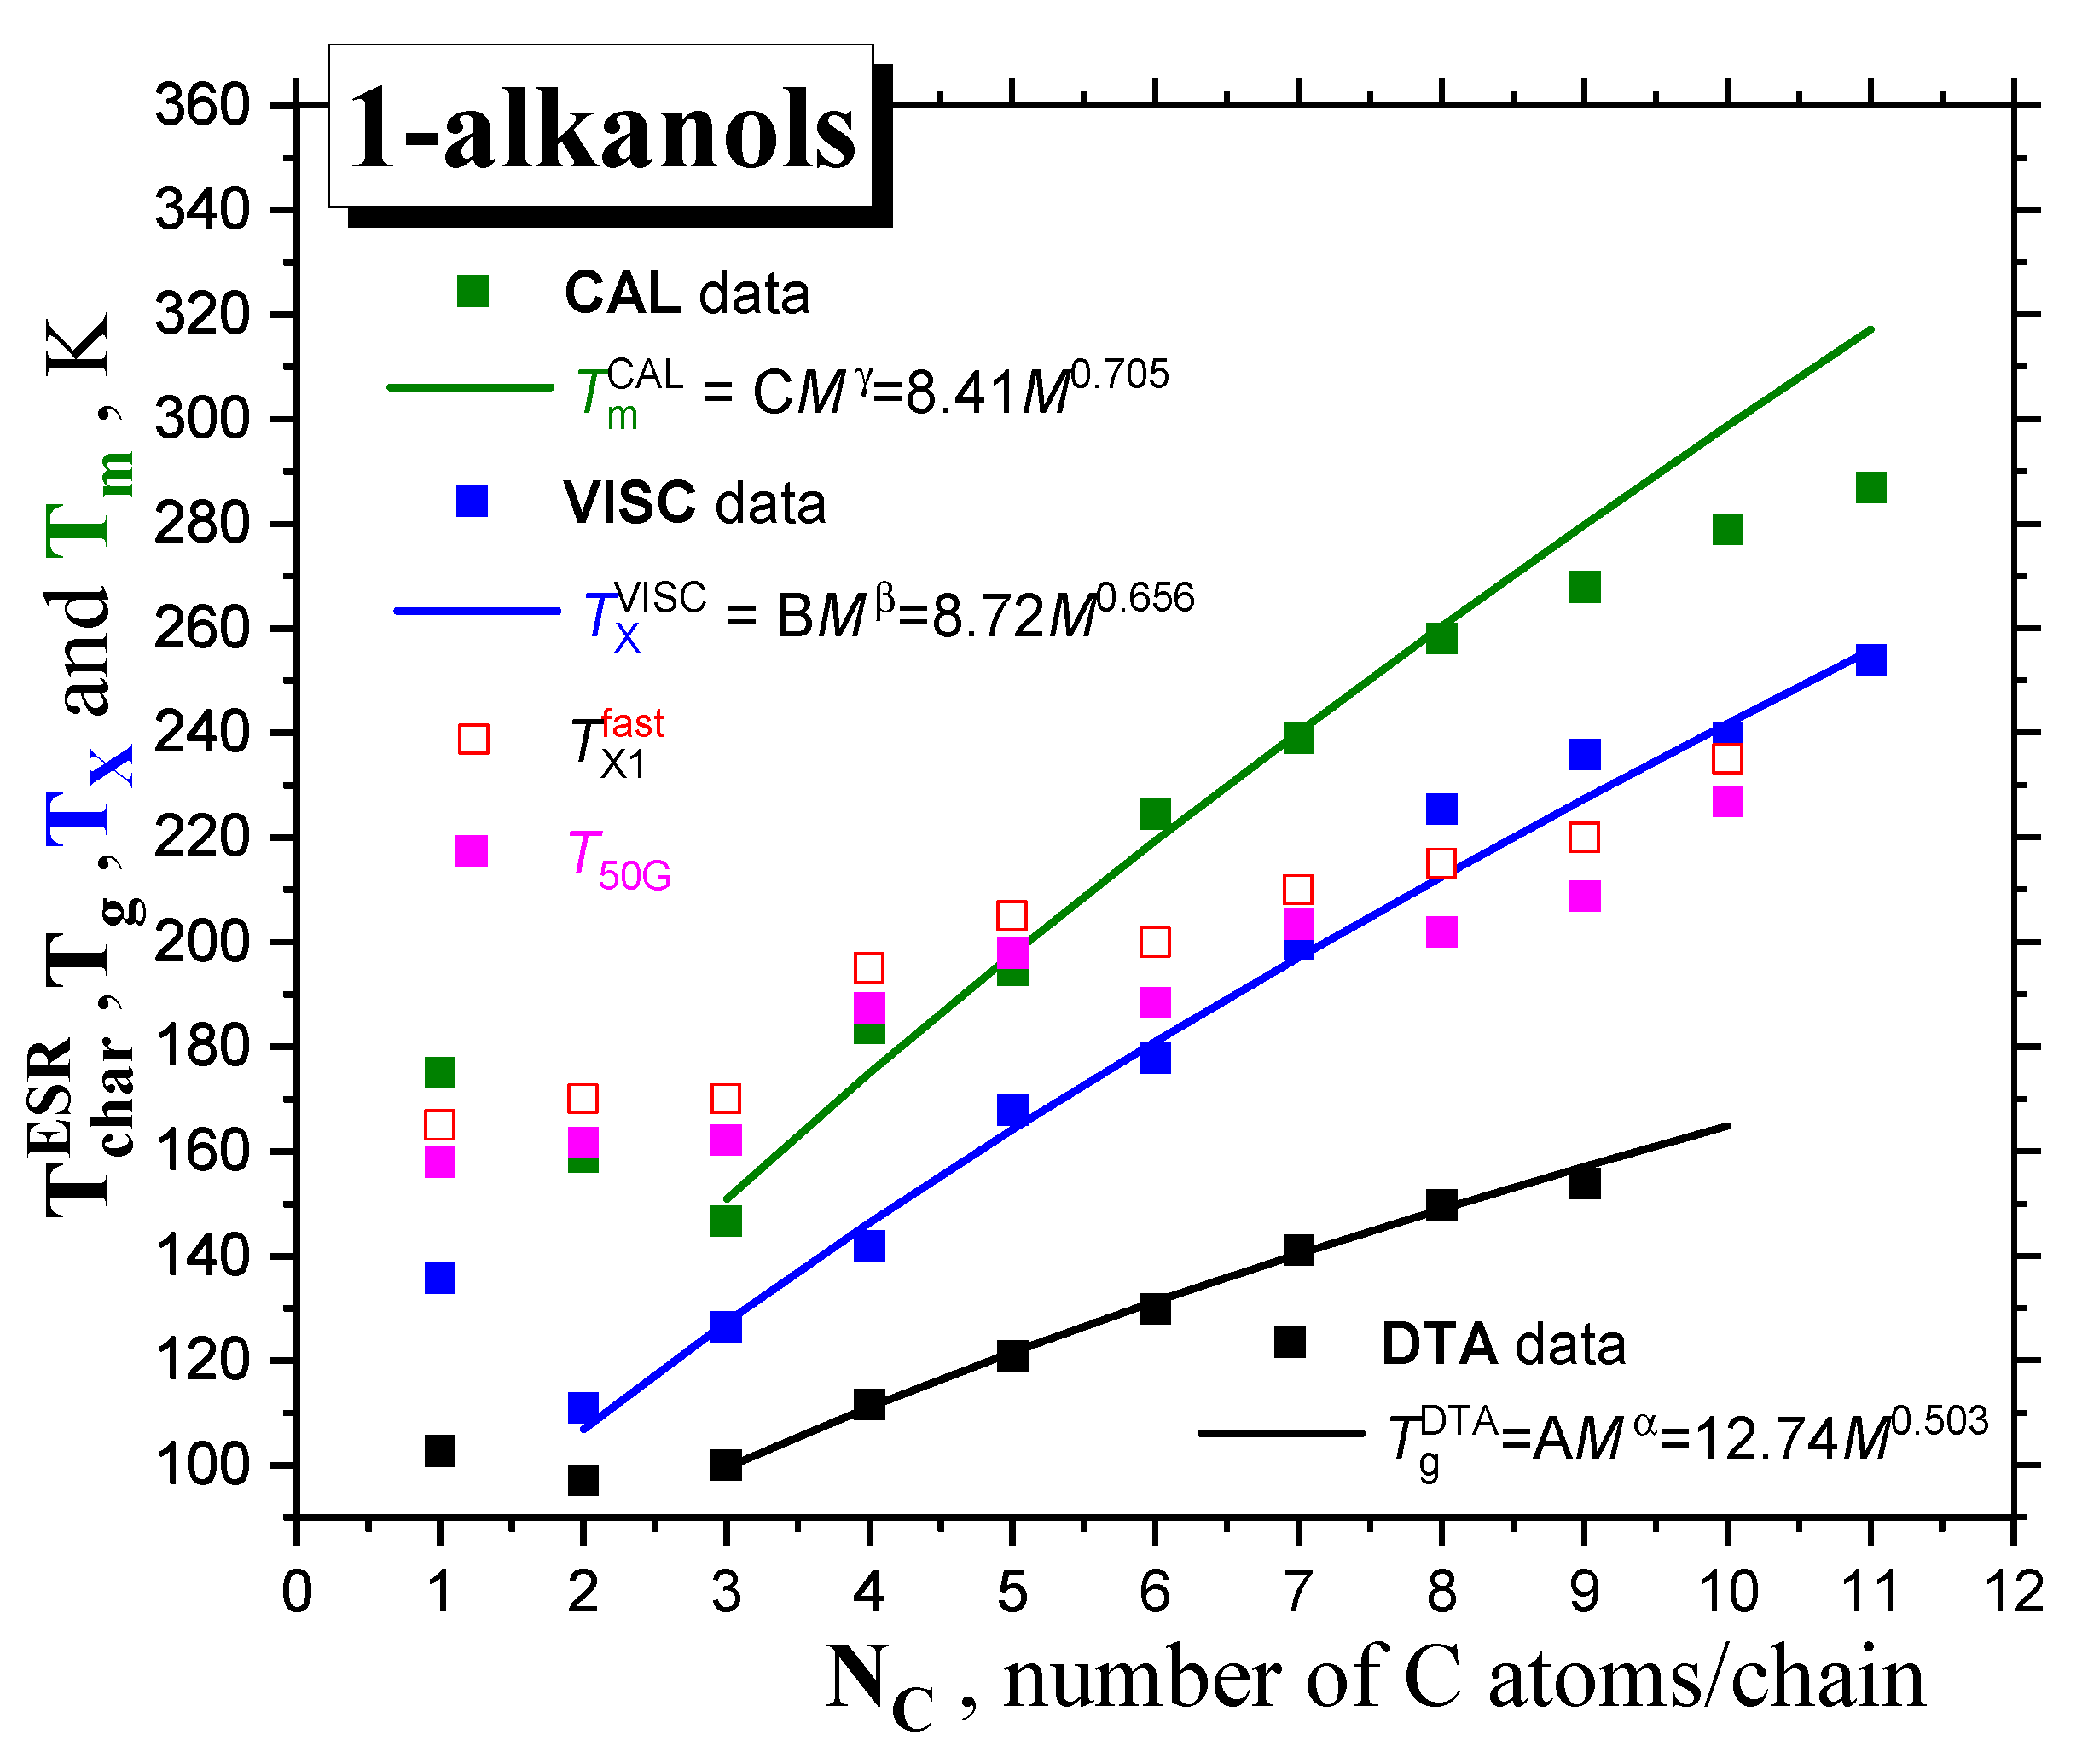
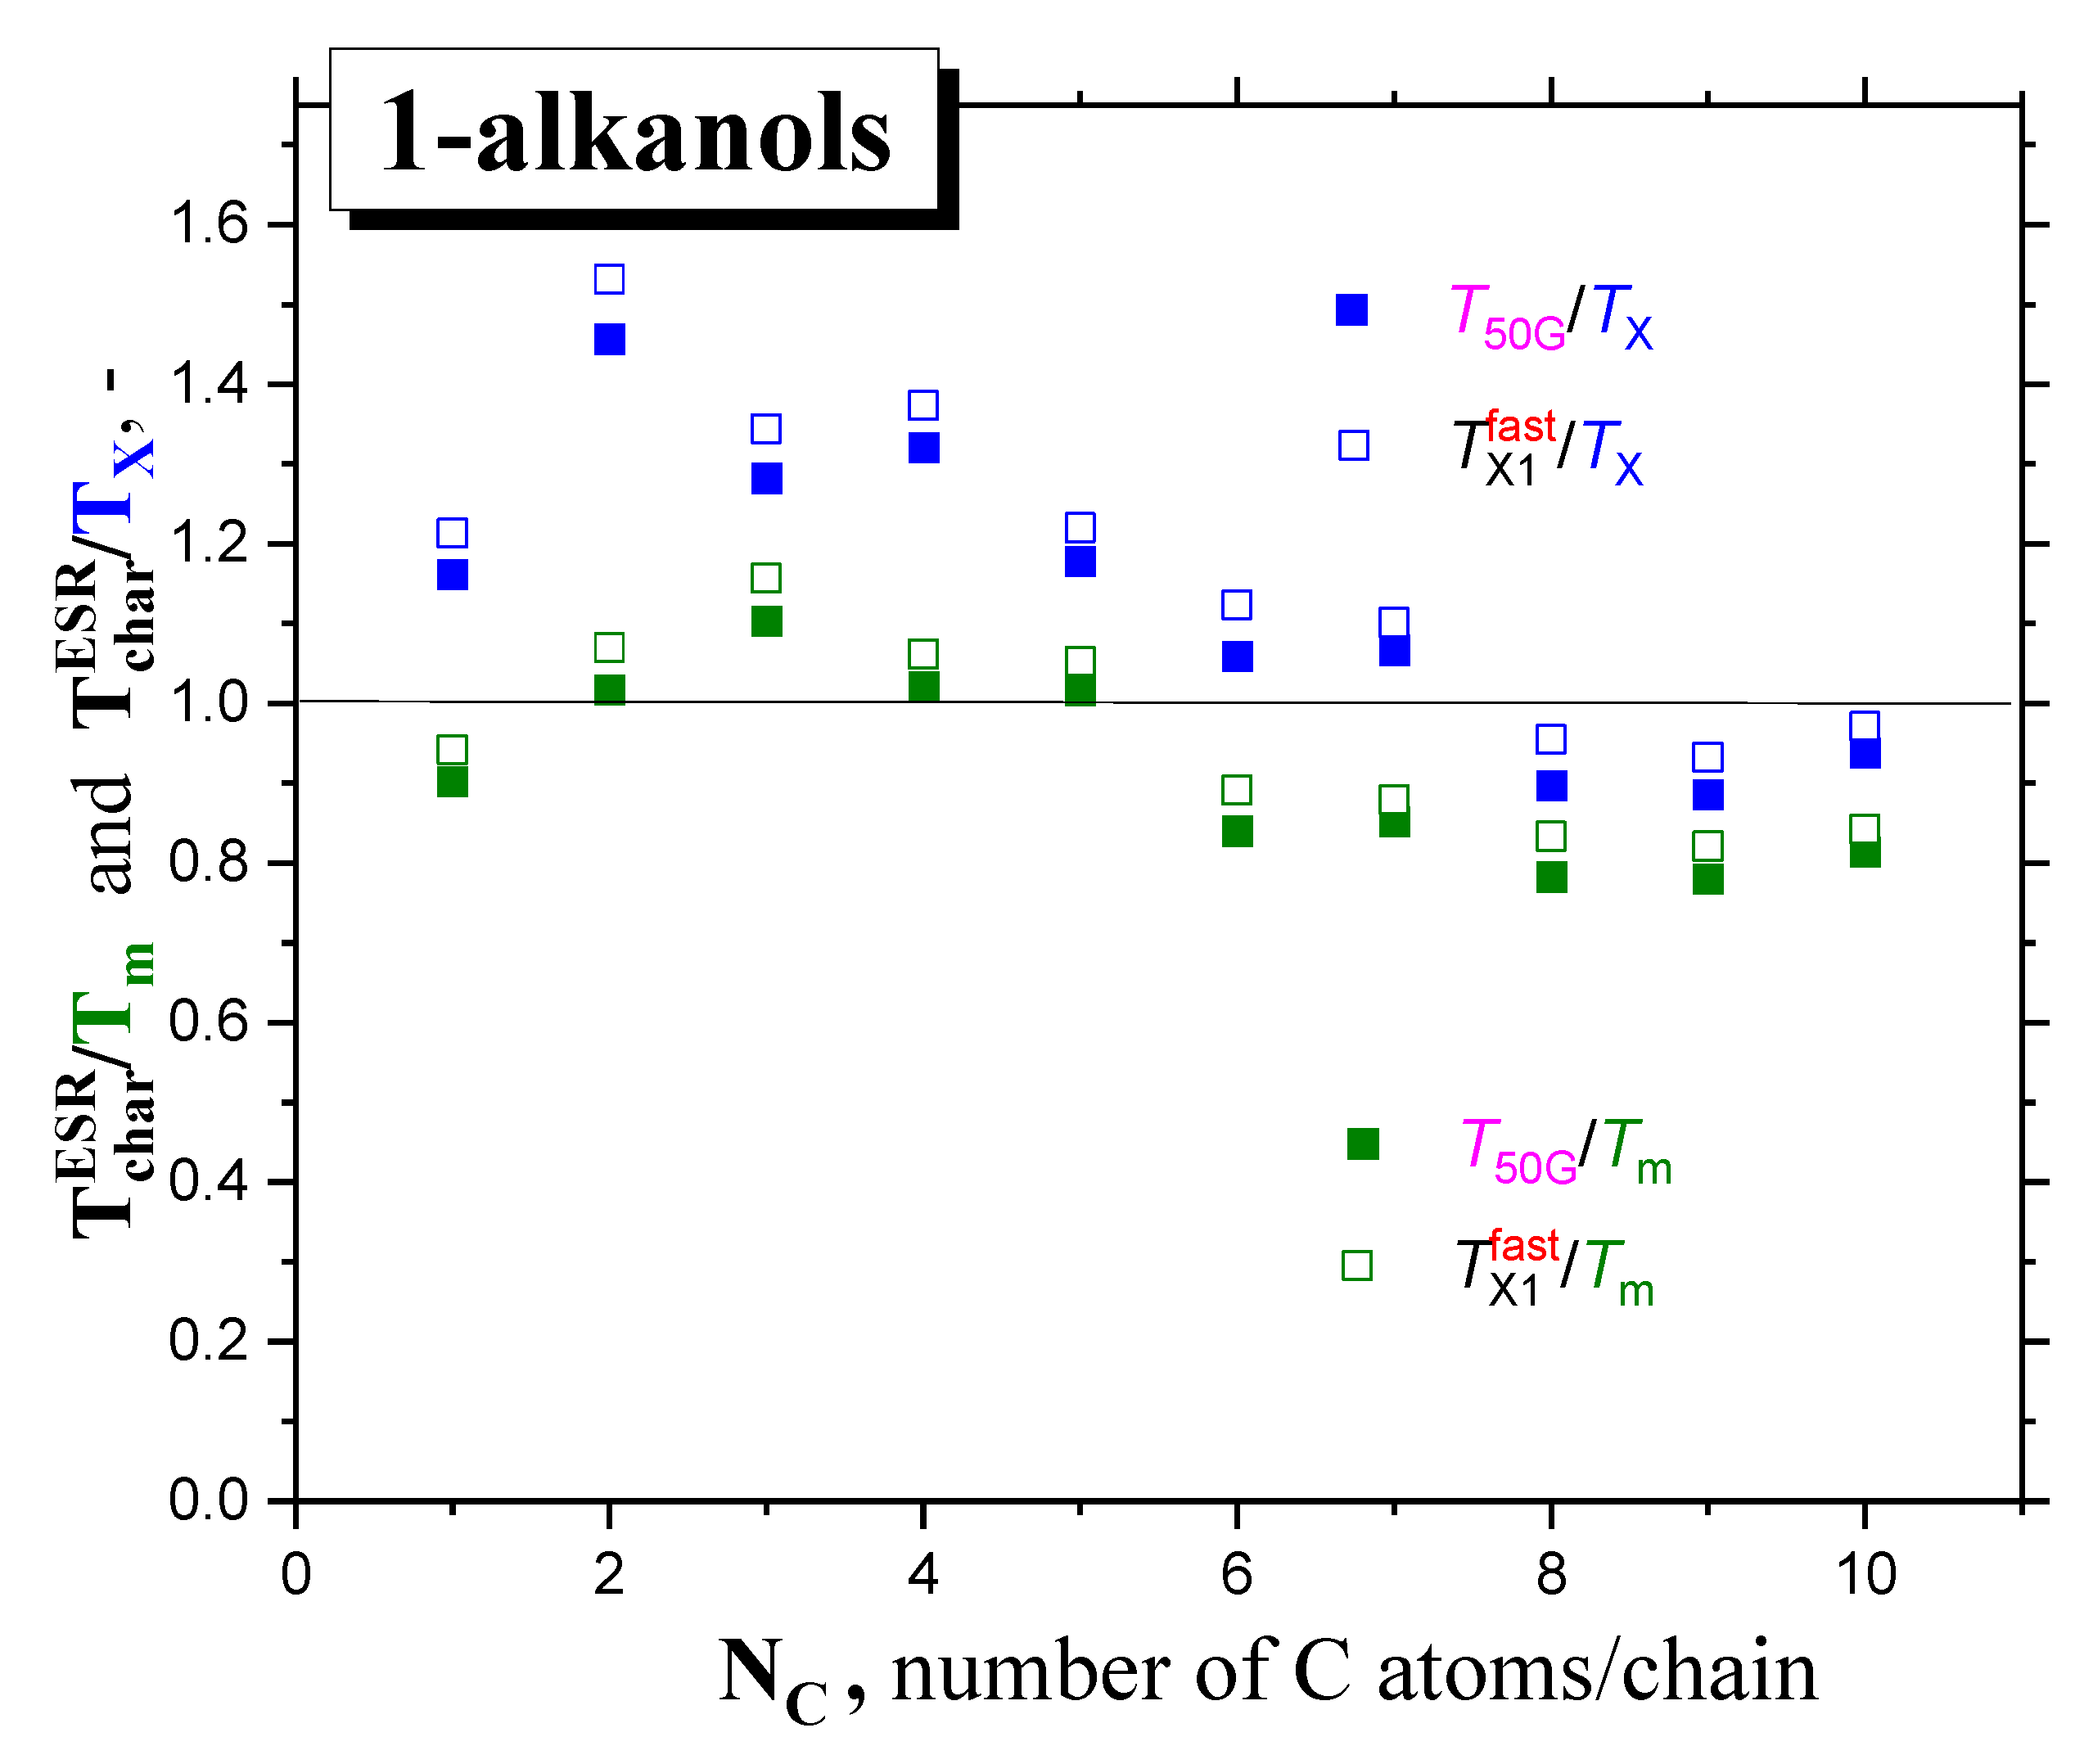
2.2.2. The Mutual Relationships of T50G and TX1fast with Thermodynamic and Dynamic Transitions
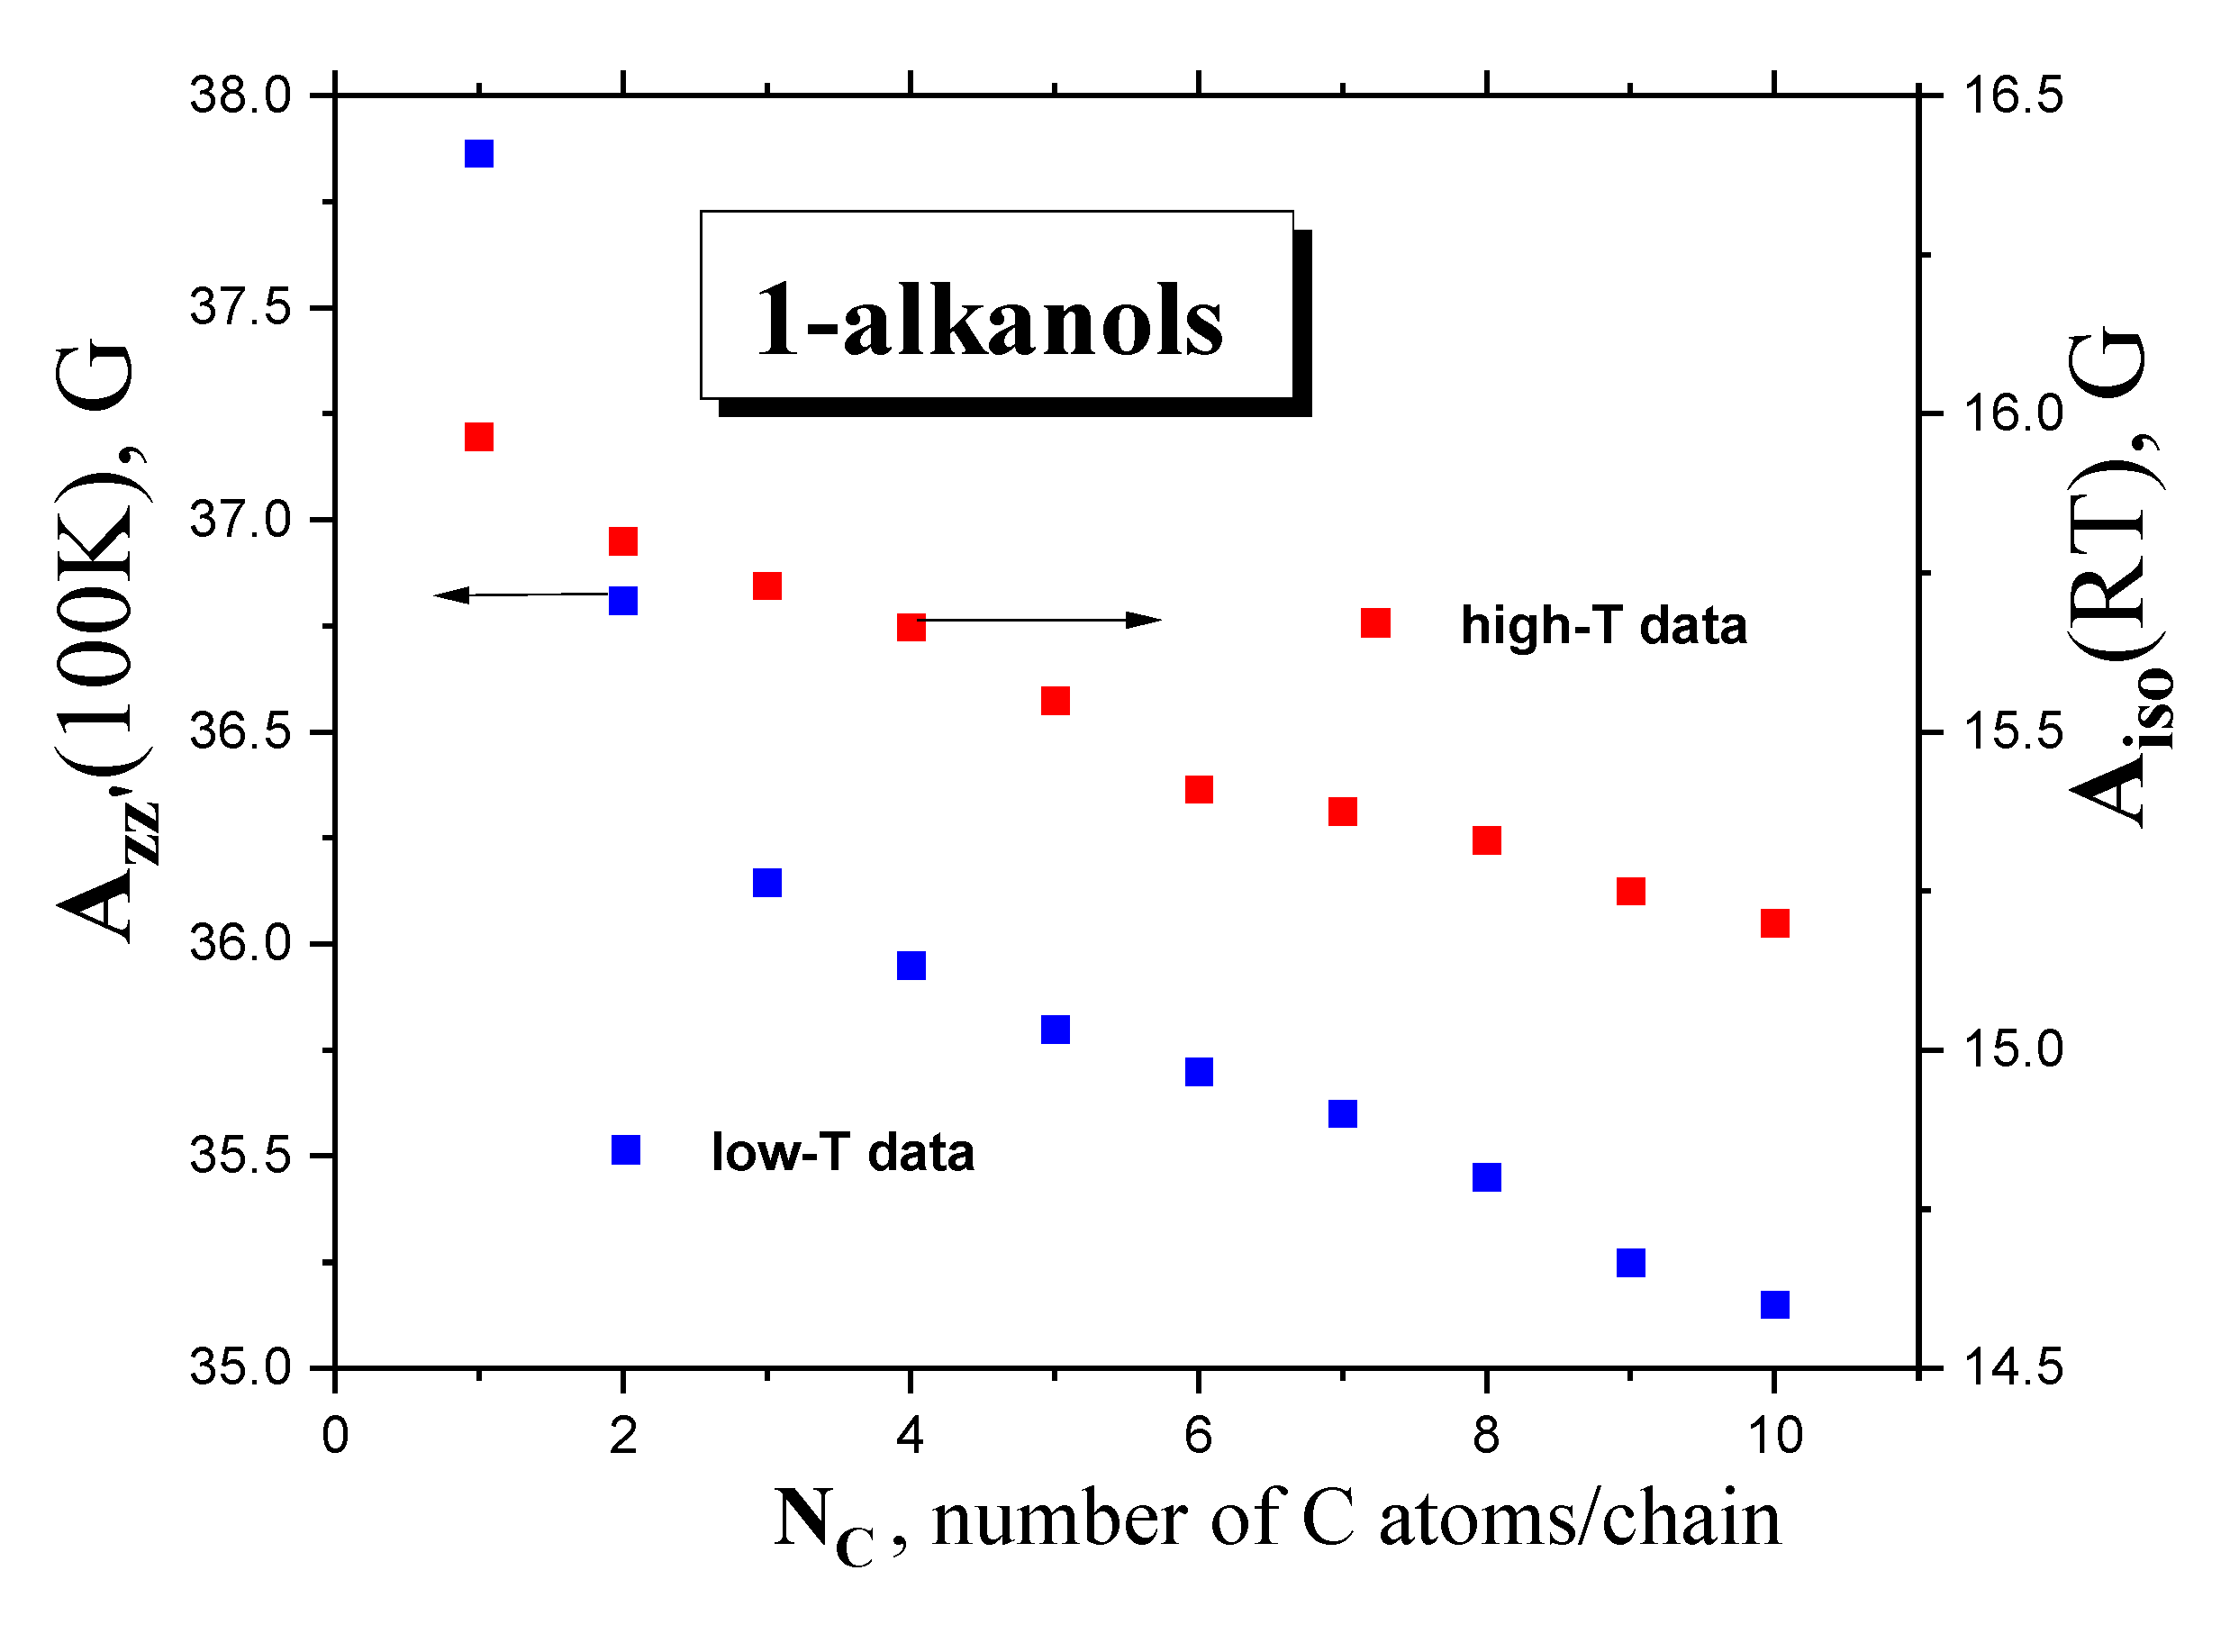
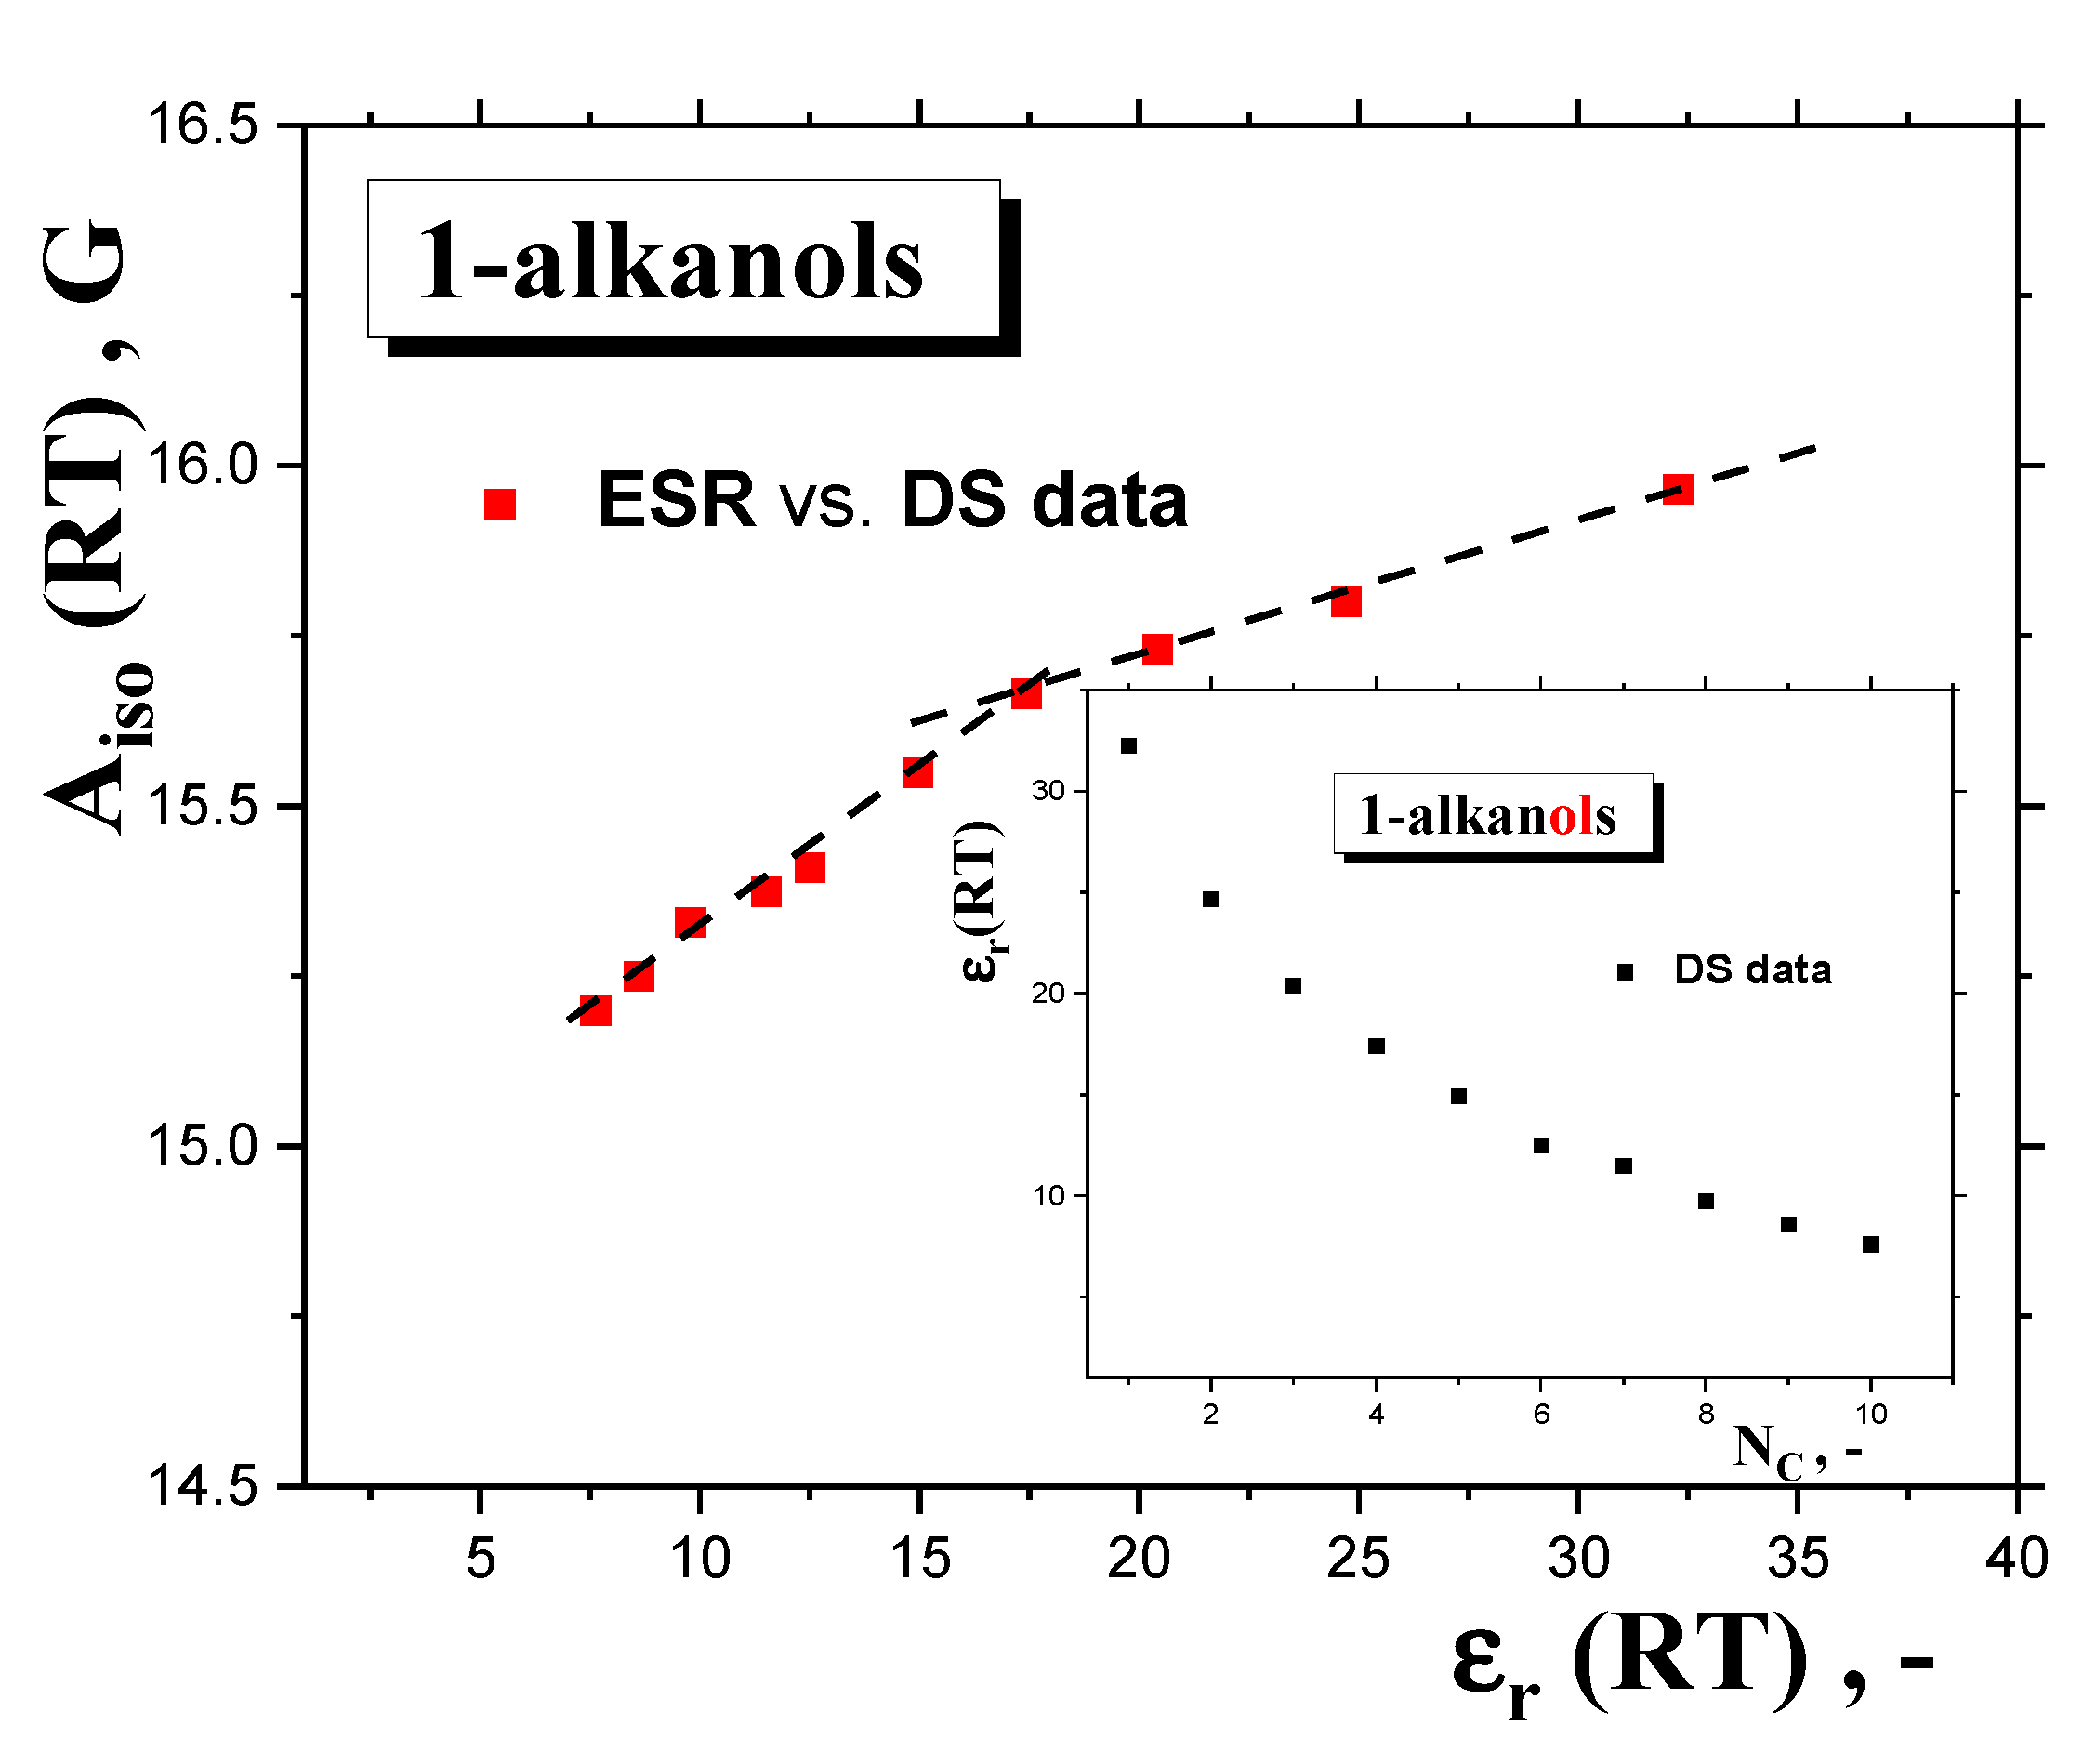
2.2.3. Isotropic and Anisotropic Hyperfine Constants Aiso (RT) and Azz’ (100 K) as a Function of the NC, Polarity and Proticity of 1−alkanols
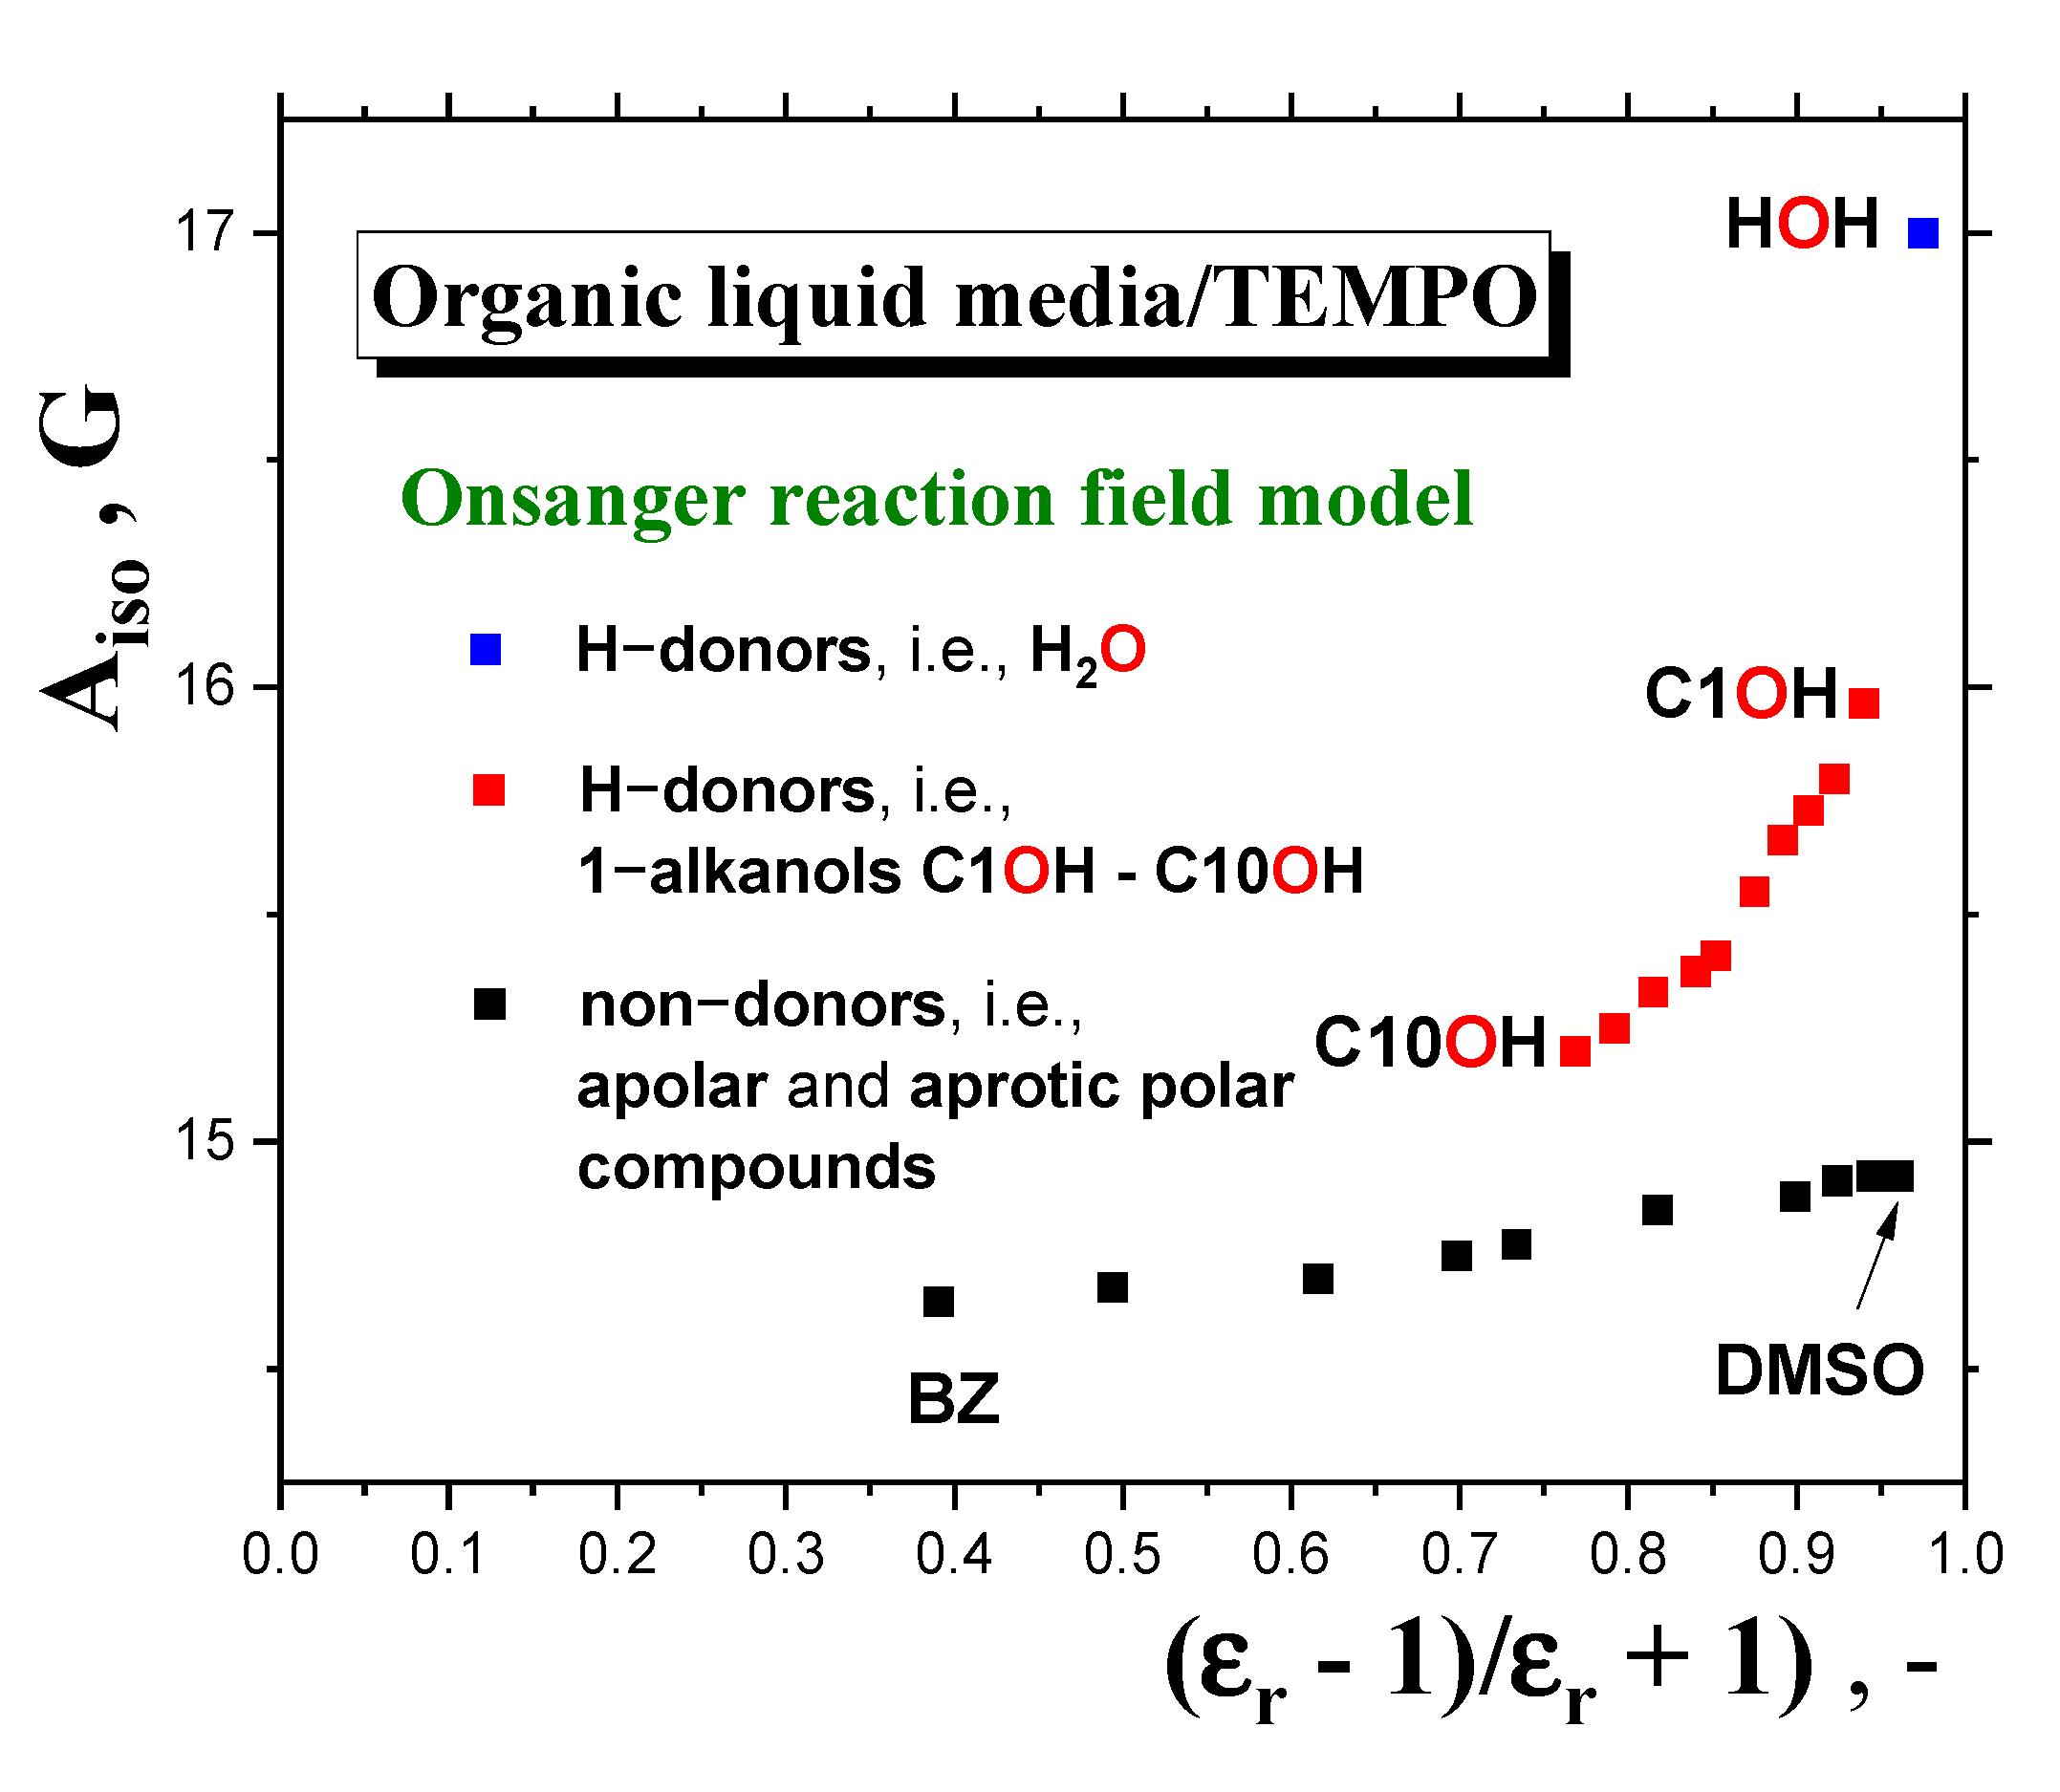
2.2.4. Connection of the Main Slow-to-Fast Motion Transition of the Spin Probe TEMPO with the Polarity, Proticity and Thermodynamic and Dynamic Transition Behaviors of 1−alkanols
3. Experimental
3.1. Materials and Methods
3.2. ESR
4. Conclusions
Author Contributions
Funding
Institutional Review Board Statement
Informed Consent Statement
Data Availability Statement
Acknowledgments
Conflicts of Interest
References
- Barlow, A.J.; Lamb, J.; Matheson, A.J. Viscous behavior of supercooled liquids. Proc. Roy. Soc. London Ser. A 1966, 292, 322–342. [Google Scholar]
- Taborek, P.; Kleinman, R.N.; Bishop, D.J. Power law behavior in the viscosity of supercooled liquids. Phys. Rev. B 1986, 34, 1835–1840. [Google Scholar] [CrossRef] [PubMed]
- Stickel, F.; Fischer, E.W.; Richert, R. Dynamics of glass-forming liquids. I. Temperature-derivative analysis of dielectric relaxation data. J. Chem. Phys. 1995, 102, 6251–6257. [Google Scholar] [CrossRef]
- Stickel, F.; Fischer, E.W.; Richert, R. Dynamics of glass-forming liquids. II. Detailed comparison of dielectric relaxation, dc-conductivity and viscosity data. J. Chem. Phys. 1996, 104, 2043–2055. [Google Scholar] [CrossRef]
- Martinez-Garcia, J.C.; Martinez-Garcia, J.; Rzoska, S.; Huellinger, J. The new insight into dynamic crossover in glass forming liquids from the apparent enthalpy analysis. J. Chem. Phys. 2012, 137, 064501-8. [Google Scholar] [CrossRef] [PubMed]
- Leon, L.; Ngai, K.L. Rapidity of the Change of the Kohlrausch Exponent of the α-Relaxation of Glass-Forming Liquids at TB or Tβ and Consequence. J. Phys. Chem. B 1999, 103, 4045–4051. [Google Scholar] [CrossRef]
- Schönhals, A. Evidence for a universal crossover behavior of the dynamic glass transition. Europhys. Lett. 2001, 56, 815. [Google Scholar] [CrossRef]
- Johari, G.P.; Goldstein, M. Viscous Liquids and the Glass Transition. II. Secondary Relaxations in Glasses of Rigid Molecules. J. Chem. Phys. 1970, 53, 2372–2388. [Google Scholar] [CrossRef]
- Mallamace, F.; Branca, C.; Corsaro, C.; Leone, N.; Spooren, J.; Chen, S.H.; Stanley, H.E. Transport properties of glass-forming liquids suggest that dynamic crossover temperature is as important as the glass transition temperature. Proc. Natl. Acad. Sci. USA 2010, 107, 22457–22462. [Google Scholar] [CrossRef]
- Roland, C.M. Characteristic relaxation times and their invariance to thermodynamic conditions. Soft Matter 2008, 4, 2316–2322. [Google Scholar] [CrossRef]
- Götze, W.; Sjögren, L. Relaxation processes in supercooled liquids. Rep. Progr. Phys. 1992, 55, 241–376. [Google Scholar] [CrossRef]
- Novikov, V.N.; Sokolov, A.P. Universality of the dynamic crossover in glass-forming liquids: A “magic” relaxation time. Phys. Rev. E 2003, 67, 031507. [Google Scholar] [CrossRef] [PubMed]
- Hyde, P.D.; Evert, T.E.; Cicerone, M.T.; Ediger, M.D. Rotational motion of molecular probes in orto-terphenyl and cis-poly-isoprene. J. Non-Cryst. Solids 1991, 131–133, 42–47. [Google Scholar] [CrossRef]
- Andreozzi, L.; Schinoy, A.D.; Giordano, M.; Leporini, D. A study of the Debye–Stokes–Einstein law in supercooled fluids. J. Phys.-Cond. Matter 1996, 8, 9605–9608. [Google Scholar] [CrossRef]
- Bartoš, J.; Šauša, O.; Bandžuch, P.; Zrubcová, J.; Krištiak, J. Free volume factor in supercooled liquid dynamics. J. Non-Cryst. Solids 2002, 307–310, 417–425. [Google Scholar] [CrossRef]
- Bartoš, J.; Corsaro, C.; Mallamace, D.; Švajdlenková, H.; Lukešová, M. ESR evidence of the dynamic crossover in the supercooled liquid states of a series of solid n-alkanes. Phys. Chem. Chem. Phys. 2018, 20, 11145–11151. [Google Scholar] [CrossRef] [PubMed]
- Ramos, M.A.; Talon, C.; Jimenez-Riobóo, R.J.; Vieira, S. Low-temperature specific heat of structural and orientational glasses of simple alcohols. J. Phys.-Cond. Matter 2003, 15, S1007. [Google Scholar] [CrossRef]
- NIST Chemistry WebBook, NIST Standard Reference3 Database Number 69. Last Update to Data: 2023. Available online: http://webbooknistgov/chemistry/ (accessed on 7 September 2023).
- Illers, K.H. Innere Rotationen in Festkörpern aus hoch- und niedrigmolekularen organischen Molekülen. Rheol. Acta 1964, 3, 183–193. [Google Scholar] [CrossRef]
- Faucher, J.A.; Koleske, J.V. Glass Transitions of Organic Compounds. 1. Lower Aliphatic Alcohols. Phys. Chem. Glasses 1966, 7, 202–208. [Google Scholar]
- Sugisaki, H.; Suga, H.; Seki, S. Calorimetric Study of the Glassy state. III. Novel Type Calorimeter for Study of Glassy State and heat Capacity of Glassy Methanol. Bull. Chem. Soc. Jpn. 1968, 41, 2586–2591. [Google Scholar] [CrossRef]
- Lesikar, A.V. On the self-association of the normal alcohols and the glass transition in alcohol-alcohol solutions. J. Solut. Chem. 1977, 6, 81–93. [Google Scholar] [CrossRef]
- Carpenter, M.R.; Davis, D.B.; Matheson, A.J. Measurement of the Glass Transition Temperature of Simple Liquids. J. Chem. Phys. 1967, 48, 2451–2454. [Google Scholar] [CrossRef]
- Haida, O.; Suga, H.; Seki, S. Calorimetric study of the glassy state XII. Plural glass transition phenomena of ethanol. J. Chem. Thermodyn. 1977, 9, 1133–1148. [Google Scholar] [CrossRef]
- Murthy, S.S.N. Experimental study of dielectric relaxation in supercooled alcohols and polyols. Mol. Phys. 1996, 97, 691–709. [Google Scholar] [CrossRef]
- Koleske, J.V.; Faucher, J.A. Glass Transitions of Organic Compounds. III. Cellulose Substrate Technique and Aliphatic Alcohols. Polym. Eng. Sci. 1979, 19, 716–721. [Google Scholar]
- El Goresy, T.; Böhmer, B. Diluting the hydrogen bonds in viscous solutions of n-butanol with n-bromobutane: A dielectric study. J. Chem. Phys. 2008, 28, 154520. [Google Scholar] [CrossRef] [PubMed]
- Hassaine, M.; Jimenez-Rioboo, R.J.; Ramos, M.A.; Sharapova, I.V.; Koroyluk, O.A.; Krivchikov, A.I. Thermal properties and Brillouin scattering study of glass, crystal and “glacial” state in n-butanol. J. Chem. Phys. 2009, 131, 174508. [Google Scholar] [CrossRef] [PubMed]
- Novikov, V.N.; Rössler, E.A. Correlation between glass transition temperature and molecular mass in non-polymeric and polymer glass formers. Polymer 2013, 54, 6987–6991. [Google Scholar] [CrossRef]
- Kauzmann, W. The nature of the glassy state and the behavior of liquids at low temperature. Chem. Rev. 1948, 43, 219–256. [Google Scholar] [CrossRef]
- Boyer, R. The relation of transition temperatures to chemical structure in high polymers. Rubber Chem. Technol. 1963, 36, 1303–1421. [Google Scholar] [CrossRef]
- Sakka, S.; McKenzie, J.D. Relation between apparent glass transition temperature and liquidus temperature for inorganic glasses. J. Non-Cryst. Solids 1971, 6, 145–162. [Google Scholar] [CrossRef]
- Landolt-Börnstein—Group IV Physical Chemistry. Pure Organic Liquids, Subvolume B ‘Pure Organic Liquids’ of Volume 18. In Viscosity of Pure Organic Liquids and Binary Liquid Mixtures; Landolt-Börnstein—Group IV Physical Chemistry, Springer: Berlin-Heidelberg, Germany, 2002. [Google Scholar]
- Rowley, R. DIPPR Data Compilation of Pure Chemical Properties; Ref Type: Electronic Citation; Design Institute for Physical Properties: AIChE: New York, NY, USA, 2010. [Google Scholar]
- Tamman, G.; Hesse, W.Z. Die Abhängigkeit der Viskosität von der Temperatur die unterkühlten Flüssigkeiten. Zeitsch. Anorg. Allgem. Chem. 1926, 156, 245–257. [Google Scholar] [CrossRef]
- Denney, D.J. Viscosities of some undercooled liquid alkylhalides. J. Chem. Phys. 1959, 30, 159–162. [Google Scholar] [CrossRef]
- Campbell Ling, A.A.C.; Willard, J.E. Viscosities of some organic glasses used as trapping matrixes. J. Phys. Chem. 1968, 72, 1918–1923. [Google Scholar] [CrossRef]
- Mitsukuri, S.; Tonomura, T. Viscosities of liquids at constant volume. Proc. Imper. Acad. Jpn. 1927, 3, 155, and 1929, 5, 23. [Google Scholar] [CrossRef][Green Version]
- Barrera, M.C.; Jorge, M. A Polarization-Consistent Model for Alcohols to Predict Solvation Free Energies. J. Chem. Info Model. 2020, 60, 1352–1367. [Google Scholar] [CrossRef] [PubMed]
- Krakoviack, V.; Alba-Simionesco, C.; Krauzman, M. Study of the depolarized light scattering spectra of supercooled liquids by a simple mode-coupling model. J. Chem. Phys. 1997, 107, 3417–3427. [Google Scholar] [CrossRef]
- Bartoš, J.; Švajdlenková, H.; Šauša, O.; Lukešová, M.; Ehlers, D.; Michl, M.; Lunkenheimer, P.; Loidl, A. Molecular probe dy-namics and free volume in organic glass-formers and their relationships to structural relaxation: 1-propanol. J. Phys.-Cond. Matt. 2016, 28, 015101. [Google Scholar] [CrossRef]
- Dodd, G.H.; Barratt, M.D.; Rayner, L. Spin probes for binding site polarity. FEBS 1970, 8, 286–288. [Google Scholar] [CrossRef]
- Jolicoeur, C.; Friedman, H.L. Hydrophobic nitroxide radicals as probes to investigate the hydrophobic interaction. J. Sol. Chem. 1974, 3, 15–43. [Google Scholar] [CrossRef]
- Al-Bala, R.D.; Bates, R.D., Jr. Medium Effects on ESR Spectra in Studies of Hydrogen-Bonded Transient Solvent-Solute Complexes. J. Magn. Reson. 1987, 73, 78–89. [Google Scholar] [CrossRef]
- Laleveé, J.; Allonas, X.; Jacques, P. Electronic distribution and solvatochromism of investigation a model radical 2,2,6,6-tetramethyl piperidine N—Oxyl: TEMPO through TD-DFT calculation including PCM solvation. J. Mol. Struct. Theochem. 2006, 767, 143–147. [Google Scholar] [CrossRef]
- Kawamura, T.; Matsunami, S.; Yonezawa, T. Solvent Effects on the g-value of Di-t-butyl Nitric oxide. Bull. Chem. Soc. Jpn. 1967, 40, 1111–1115. [Google Scholar] [CrossRef]
- Griffith, O.H.; Dehlinger, P.J.; Van, S.P. Shape of the Hydrophobic Barrier of Phospholipid Bilayers (Evidence for Water Penetration in Biological Membranes). J. Membrane Biol. 1974, 15, 159–192. [Google Scholar] [CrossRef] [PubMed]
- Krinichnyi, V.I.; Grinberg, O.Y.; Bogatyrenko, V.R.; Likhtenshtein, G.I.; Lebedev, Y.S. Study of the influence of the microsurroundings on magneto-resonance parameters of spin labelled human serum albumin in the 2 mm e.s.r. range. Biophysics 1985, 30, 233–237. [Google Scholar]
- Ondar, M.A.; Grinberg, O.Y.; Dubinskii, A.A.; Lebedev, Y.S. Study of the effect of the medium on the magnetic-resonance parameters of nitroxyl radicals by high-resolution EPR spectroscopy. Sov. J. Chem. Phys. 1985, 3, 781–792. [Google Scholar]
- Owenius, R.; Engström, M.R.; Lindgren, M. Influence of Solvent Polarity and Hydrogen Bonding on the EPR parameters of a Nitroxide Spin label Studied by 9-GHZ and 95-GHz EPR Spectroscopy and DFT calculations. J. Phys. Chem. 2001, 105, 10967–10977. [Google Scholar] [CrossRef]
- Seelig, J.; Limacher, H.; Bader, P. Molecular Architecture of Liquid Crystalline Bilayer. J. Amer. Chem. Soc. 1972, 94, 6364–6371. [Google Scholar] [CrossRef]
- Onsanger, L. Electric Moments of Molecules in Liquids. J. Amer. Chem. Soc. 1936, 58, 1486–1493. [Google Scholar] [CrossRef]
- Böttcher, C.J.F. Theory of Electric Polarisation; Elsevier: New York, NY, USA; Amsterdam, The Netherlands, 1952; p. 70. [Google Scholar]
- Rabold, G.P. Spin-Probe Studies. II. Applications to Polymer Characterization. J. Polym. Sci. A 1969, 7, 1203–1223. [Google Scholar] [CrossRef]
- Bartoš, J.; Švajdlenková, H.; Zaleski, R.; Edelmann, M.; Lukešová, M. Spin probe dynamics in relation to free volume in crystalline organics by means of ESR and PALS: N-Hexadecane. Phys. B Cond. Mat. 2013, 430, 99–105. [Google Scholar] [CrossRef]
- Švajdlenková, H.; Iskrová, M.; Šauša, O.; Dlubek, G.; Krištiak, J.; Bartoš, J. The Spin probe Dynamics and the Free Volume in a series of Amorphous Polymer Glass-Formers. Macromol. Symp. 2011, 305, 108–115. [Google Scholar] [CrossRef]
- Švajdlenková, H.; Arrese-Igor, S.; Nógellová, Z.; Alegría, A.; Bartoš, J. Molecular dynamic heterogeneity in relation to free volume and relaxation dynamics in organic glass-formers: Oligomeric cis-1,4-poly(isoprene). Phys. Chem. Chem. Phys. 2017, 19, 15215–15226. [Google Scholar] [CrossRef]


Disclaimer/Publisher’s Note: The statements, opinions and data contained in all publications are solely those of the individual author(s) and contributor(s) and not of MDPI and/or the editor(s). MDPI and/or the editor(s) disclaim responsibility for any injury to people or property resulting from any ideas, methods, instructions or products referred to in the content. |
© 2023 by the authors. Licensee MDPI, Basel, Switzerland. This article is an open access article distributed under the terms and conditions of the Creative Commons Attribution (CC BY) license (https://creativecommons.org/licenses/by/4.0/).
Share and Cite
Bartoš, J.; Švajdlenková, H. Thermodynamic and Dynamic Transitions and Interaction Aspects in Reorientation Dynamics of Molecular Probe in Organic Compounds: A Series of 1-alkanols with TEMPO. Int. J. Mol. Sci. 2023, 24, 14252. https://doi.org/10.3390/ijms241814252
Bartoš J, Švajdlenková H. Thermodynamic and Dynamic Transitions and Interaction Aspects in Reorientation Dynamics of Molecular Probe in Organic Compounds: A Series of 1-alkanols with TEMPO. International Journal of Molecular Sciences. 2023; 24(18):14252. https://doi.org/10.3390/ijms241814252
Chicago/Turabian StyleBartoš, Josef, and Helena Švajdlenková. 2023. "Thermodynamic and Dynamic Transitions and Interaction Aspects in Reorientation Dynamics of Molecular Probe in Organic Compounds: A Series of 1-alkanols with TEMPO" International Journal of Molecular Sciences 24, no. 18: 14252. https://doi.org/10.3390/ijms241814252
APA StyleBartoš, J., & Švajdlenková, H. (2023). Thermodynamic and Dynamic Transitions and Interaction Aspects in Reorientation Dynamics of Molecular Probe in Organic Compounds: A Series of 1-alkanols with TEMPO. International Journal of Molecular Sciences, 24(18), 14252. https://doi.org/10.3390/ijms241814252