

Amyloid-Beta Co-Pathology Is a Major Determinant of the Elevated Plasma GFAP Values in Amyotrophic Lateral Sclerosis
 , , and
Abstract
:1. Introduction
2. Results
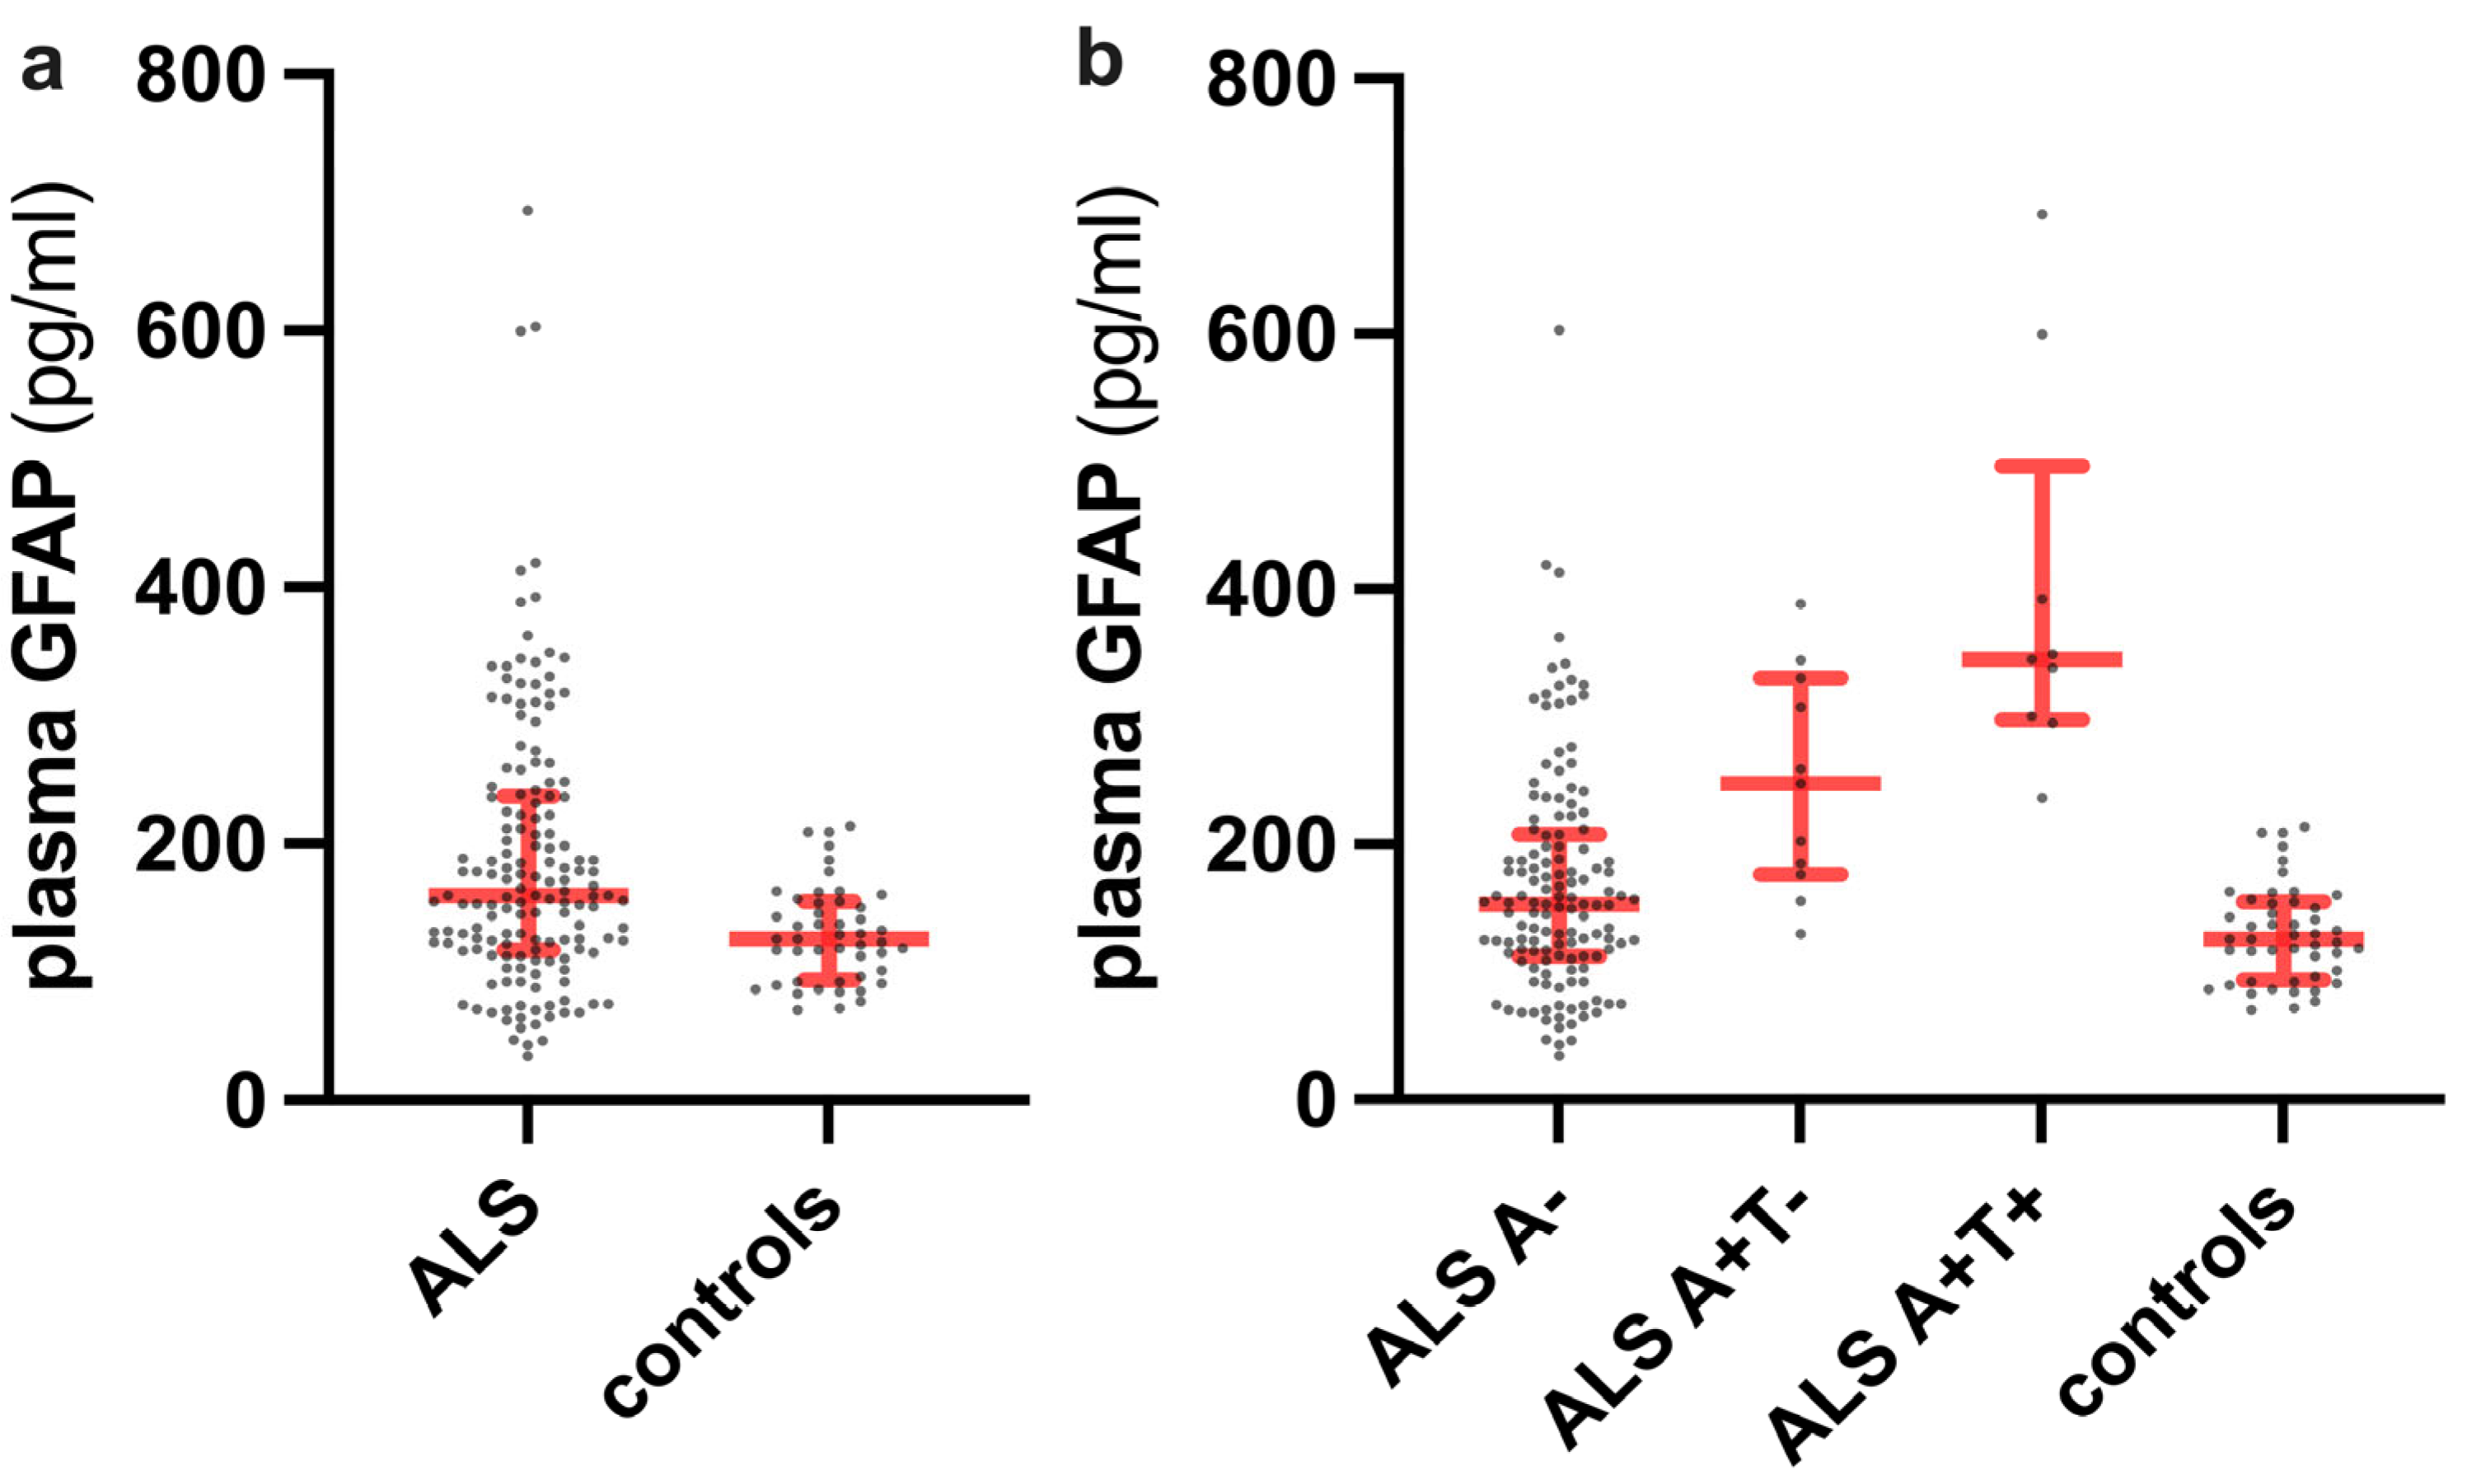
2.1. Distribution of Plasma GFAP Level Values across the Diagnostic Categories and Clinical Correlates of Plasma GFAP in ALS Patients
2.2. Association of Plasma GFAP with Measures of Cognitive Impairment in ALS Patients
2.3. Association of Plasma GFAP with Other Plasma and CSF Biomarkers in ALS Patients
2.4. Plasma GFAP Levels and Clinical Variables According to A and T Status in ALS Patients
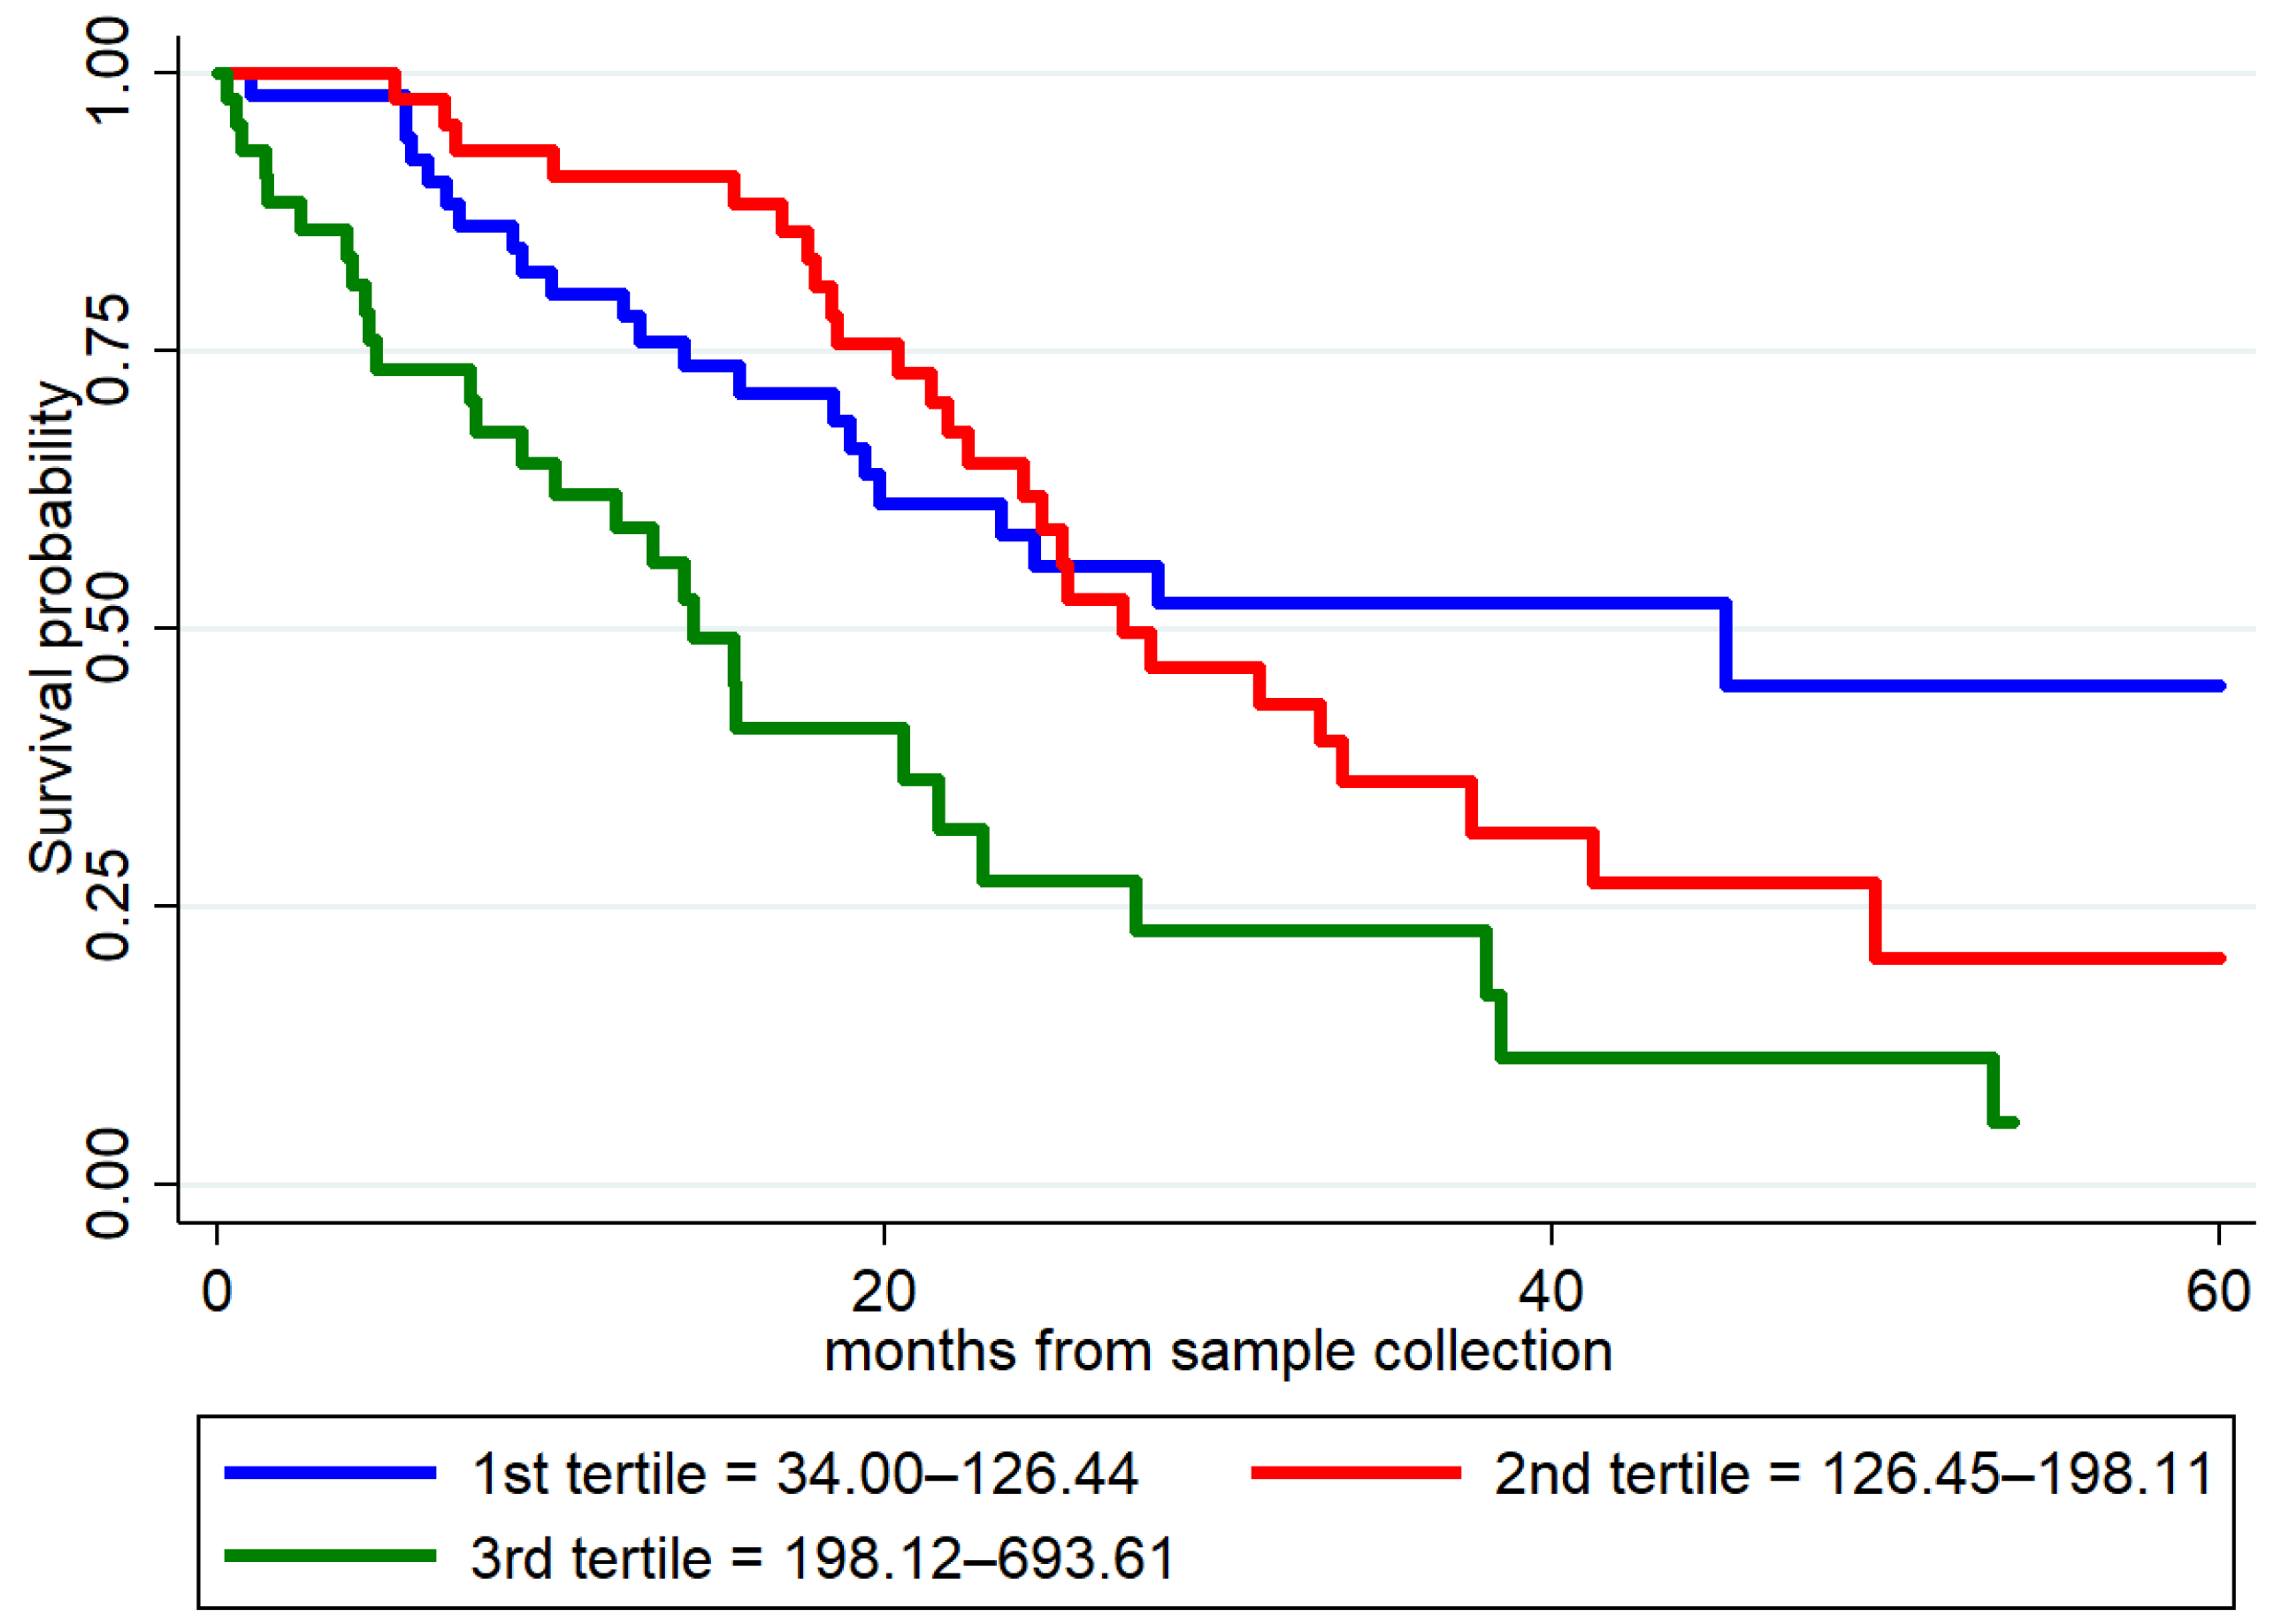
2.5. Prognostic Value of Plasma GFAP in ALS Patients
3. Discussion
4. Materials and Methods
4.1. Inclusion Criteria and Clinical Assessment
4.2. CSF and Plasma Analyses
4.3. Statistical Analysis
5. Conclusions
Supplementary Materials
Author Contributions
Funding
Institutional Review Board Statement
Informed Consent Statement
Data Availability Statement
Acknowledgments
Conflicts of Interest
References
- Chiò, A.; Moglia, C.; Canosa, A.; Manera, U.; Vasta, R.; Brunetti, M.; Barberis, M.; Corrado, L.; D’Alfonso, S.; Bersano, E.; et al. Cognitive impairment across ALS clinical stages in a population-based cohort. Neurology 2019, 93, e984–e994. [Google Scholar] [CrossRef] [PubMed]
- Behrouzi, R.; Liu, X.; Wu, D.; Robinson, A.C.; Tanaguchi-Watanabe, S.; Rollinson, S.; Shi, J.; Tian, J.; Hamdalla, H.H.M.; Ealing, J.; et al. Pathological tau deposition in Motor Neurone Disease and frontotemporal lobar degeneration associated with TDP-43 proteinopathy. Acta Neuropathol. Commun. 2016, 4, 33. [Google Scholar] [CrossRef] [PubMed]
- Hamilton, R.L.; Bowser, R. Alzheimer disease pathology in amyotrophic lateral sclerosis. Acta Neuropathol. 2004, 107, 515–522. [Google Scholar] [CrossRef]
- Benatar, M.; Zhang, L.; Wang, L.; Granit, V.; Statland, J.; Barohn, R.; Swenson, A.; Ravits, J.; Jackson, C.; Burns, T.M.; et al. Validation of serum neurofilaments as prognostic and potential pharmacodynamic biomarkers for ALS. Neurology 2020, 95, e59–e69. [Google Scholar] [CrossRef]
- Vacchiano, V.; Mastrangelo, A.; Zenesini, C.; Masullo, M.; Quadalti, C.; Avoni, P.; Polischi, B.; Cherici, A.; Capellari, S.; Salvi, F.; et al. Plasma and CSF Neurofilament Light Chain in Amyotrophic Lateral Sclerosis: A Cross-Sectional and Longitudinal Study. Front. Aging Neurosci. 2021, 13, 753242. [Google Scholar] [CrossRef] [PubMed]
- Steinacker, P.; Feneberg, E.; Weishaupt, J.; Brettschneider, J.; Tumani, H.; Andersen, P.M.; Von Arnim, C.A.F.; Böhm, S.; Kassubek, J.; Kubisch, C.; et al. Neurofilaments in the diagnosis of motoneuron diseases: A prospective study on 455 patients. J. Neurol. Neurosurg. Psychiatry 2016, 87, 12–20. [Google Scholar] [CrossRef]
- Meyer, T.; Schumann, P.; Weydt, P.; Petri, S.; Koc, Y.; Spittel, S.; Bernsen, S.; Günther, R.; Weishaupt, J.H.; Dreger, M.; et al. Neurofilament light-chain response during therapy with antisense oligonucleotide tofersen in SOD1-related ALS: Treatment experience in clinical practice. Muscle Nerve 2023, 67, 515–521. [Google Scholar] [CrossRef]
- Lee, H.G.; Wheeler, M.A.; Quintana, F.J. Function and therapeutic value of astrocytes in neurological diseases. Nat. Rev. Drug Discov. 2022, 21, 339–358. [Google Scholar] [CrossRef]
- Qian, K.; Jiang, X.; Liu, Z.-Q.; Zhang, J.; Fu, P.; Su, Y.; Brazhe, N.A.; Liu, D.; Zhu, L.-Q. Revisiting the critical roles of reactive astrocytes in neurodegeneration. Mol. Psychiatry 2023. online ahead of print. [Google Scholar] [CrossRef]
- Abdelhak, A.; Foschi, M.; Abu-Rumeileh, S.; Yue, J.K.; D’Anna, L.; Huss, A.; Oeckl, P.; Ludolph, A.C.; Kuhle, J.; Petzold, A.; et al. Blood GFAP as an emerging biomarker in brain and spinal cord disorders. Nat. Rev. Neurol. 2022, 18, 158–172. [Google Scholar] [CrossRef]
- Yang, Z.; Wang, K.K.W. Glial fibrillary acidic protein: From intermediate filament assembly and gliosis to neurobiomarker. Trends Neurosci. 2015, 38, 364–374. [Google Scholar] [CrossRef] [PubMed]
- Pereira, J.B.; Janelidze, S.; Smith, R.; Mattsson-Carlgren, N.; Palmqvist, S.; Teunissen, C.E.; Zetterberg, H.; Stomrud, E.; Ashton, N.J.; Blennow, K.; et al. Plasma GFAP is an early marker of amyloid-β but not tau pathology in Alzheimer’s disease. Brain 2021, 144, 3505–3516. [Google Scholar] [CrossRef] [PubMed]
- Benedet, A.L.; Milà-Alomà, M.; Vrillon, A.; Ashton, N.J.; Pascoal, T.A.; Lussier, F.; Karikari, T.K.; Hourregue, C.; Cognat, E.; Dumurgier, J.; et al. Differences between plasma and cerebrospinal fluid glial fibrillary acidic protein levels across the Alzheimer disease continuum. JAMA Neurol. 2021, 78, 1471–1483. [Google Scholar] [CrossRef] [PubMed]
- Baiardi, S.; Quadalti, C.; Mammana, A.; Dellavalle, S.; Zenesini, C.; Sambati, L.; Pantieri, R.; Polischi, B.; Romano, L.; Suffritti, M.; et al. Diagnostic value of plasma p-tau181, NfL and GFAP in a clinical setting cohort of prevalent neurodegenerative dementias. Alzheimer’s Res. Ther. 2022, 14, 153. [Google Scholar] [CrossRef]
- Bellaver, B.; Povala, G.; Ferreira, P.C.L.; Ferrari-Souza, J.P.; Leffa, D.T.; Lussier, F.Z.; Benedet, A.L.; Ashton, N.J.; Triana-Baltzer, G.; Kolb, H.C.; et al. Astrocyte reactivity influences amyloid-β effects on tau pathology in preclinical Alzheimer’s disease. Nat. Med. 2023, 29, 1775–1781. [Google Scholar] [CrossRef]
- Benninger, F.; Glat, M.J.; Offen, D.; Steiner, I. Glial fibrillary acidic protein as a marker of astrocytic activation in the cerebrospinal fluid of patients with amyotrophic lateral sclerosis. J. Clin. Neurosci. 2016, 26, 75–78. [Google Scholar] [CrossRef]
- Oeckl, P.; Weydt, P.; Steinacker, P.; Anderl-Straub, S.; Nordin, F.; Volk, A.E.; Diehl-Schmid, J.; Andersen, P.M.; Kornhuber, J.; Danek, A.; et al. Different neuroinflammatory profile in amyotrophic lateral sclerosis and frontotemporal dementia is linked to the clinical phase. J. Neurol. Neurosurg. Psychiatry 2019, 90, 4–10. [Google Scholar] [CrossRef]
- Falzone, Y.M.; Domi, T.; Mandelli, A.; Pozzi, L.; Schito, P.; Russo, T.; Barbieri, A.; Fazio, R.; Volontè, M.A.; Magnani, G.; et al. Integrated evaluation of a panel of neurochemical biomarkers to optimize diagnosis and prognosis in amyotrophic lateral sclerosis. Eur. J. Neurol. 2022, 29, 1930–1939. [Google Scholar] [CrossRef]
- Verde, F.; Milone, I.; Maranzano, A.; Colombo, E.; Torre, S.; Solca, F.; Doretti, A.; Gentile, F.; Manini, A.; Bonetti, R.; et al. Serum levels of glial fibrillary acidic protein in patients with amyotrophic lateral sclerosis. Ann. Clin. Transl. Neurol. 2023, 10, 118–129. [Google Scholar] [CrossRef]
- Schiffer, D.; Fiano, V. Astrogliosis in ALS: Possible interpretations according to pathogenetic hypotheses. Amyotroph. Lateral Scler. 2004, 5, 22–25. [Google Scholar] [CrossRef]
- Yang, W.; Strong, M.J. Widespread neuronal and glial hyperphosphorylated tau deposition in ALS with cognitive impairment. Amyotroph. Lateral Scler. 2012, 13, 178–193. [Google Scholar] [CrossRef]
- Vacchiano, V.; Mastrangelo, A.; Zenesini, C.; Baiardi, S.; Avoni, P.; Polischi, B.; Capellari, S.; Salvi, F.; Liguori, R.; Parchi, P. Elevated plasma p-tau181 levels unrelated to Alzheimer’s disease pathology in amyotrophic lateral sclerosis. J. Neurol. Neurosurg. Psychiatry 2023, 94, 428–435. [Google Scholar] [CrossRef]
- Cousins, K.A.Q.; Irwin, D.J.; Chen-Plotkin, A.; Shaw, L.M.; Arezoumandan, S.; Lee, E.B.; Wolk, D.A.; Weintraub, D.; Spindler, M.; Deik, A.; et al. Plasma GFAP associates with secondary Alzheimer’s pathology in Lewy body disease. Ann. Clin. Transl. Neurol. 2023, 10, 802–813. [Google Scholar] [CrossRef]
- Medeiros, R.; LaFerla, F.M. Astrocytes: Conductors of the Alzheimer disease neuroinflammatory symphony. Exp. Neurol. 2013, 239, 133–138. [Google Scholar] [CrossRef] [PubMed]
- Cousins, K.A.Q.; Shaw, L.M.; Shellikeri, S.; Dratch, L.; Rosario, L.; Elman, L.B.; Quinn, C.; Amado, D.A.; Wolk, D.A.; Tropea, T.F.; et al. Elevated Plasma Phosphorylated Tau 181 in Amyotrophic Lateral Sclerosis. Ann. Neurol. 2022, 92, 807–818. [Google Scholar] [CrossRef]
- Johansson, C.; Thordardottir, S.; Laffita-Mesa, J.; Rodriguez-Vieitez, E.; Zetterberg, H.; Blennow, K.; Graff, C. Plasma biomarker profiles in autosomal dominant Alzheimer’s disease. Brain 2023, 146, 1132–1140. [Google Scholar] [CrossRef]
- Jansen, W.J.; Janssen, O.; Tijms, B.M.; Vos, S.J.B.; Ossenkoppele, R.; Visser, P.J.; Aarsland, D.; Alcolea, D.; Altomare, D.; von Arnim, C.; et al. Prevalence Estimates of Amyloid Abnormality Across the Alzheimer Disease Clinical Spectrum. JAMA Neurol. 2022, 79, 228–243. [Google Scholar] [CrossRef] [PubMed]
- Seo, E.H.; Lim, H.J.; Yoon, H.-J.; Choi, K.Y.; Lee, J.J.; Park, J.Y.; Choi, S.H.; Kim, H.; Kim, B.C.; Lee, K.H. Visuospatial memory impairment as a potential neurocognitive marker to predict tau pathology in Alzheimer’s continuum. Alzheimer’s Res. Ther. 2021, 13, 167. [Google Scholar] [CrossRef]
- Binette, A.P.; Janelidze, S.; Cullen, N.; Dage, J.L.; Bateman, R.J.; Zetterberg, H.; Blennow, K.; Stomrud, E.; Mattsson-Carlgren, N.; Hansson, O. Confounding factors of Alzheimer’s disease plasma biomarkers and their impact on clinical performance. Alzheimer’s Dement. 2023, 19, 1403–1414. [Google Scholar] [CrossRef]
- Brooks, B.R.; Miller, R.G.; Swash, M.; Munsat, T.L. El Escorial revisited: Revised criteria for the diagnosis of amyotrophic lateral sclerosis. Amyotroph. Lateral Scler. 2000, 1, 293–299. [Google Scholar] [CrossRef] [PubMed]
- Rascovsky, K.; Hodges, J.R.; Knopman, D.; Mendez, M.F.; Kramer, J.H.; Neuhaus, J.; van Swieten, J.C.; Seelaar, H.; Dopper, E.G.; Onyike, C.U.; et al. Sensitivity of revised diagnostic criteria for the behavioural variant of frontotemporal dementia. Brain 2011, 134 Pt 9, 2456–2477. [Google Scholar] [CrossRef]
- Gorno-Tempini, M.L.; Hillis, A.E.; Weintraub, S.; Kertesz, A.; Mendez, M.; Cappa, S.F.; Ogar, J.M.; Rohrer, J.D.; Black, S.; Boeve, B.F.; et al. Classification of primary progressive aphasia and its variants. Neurology 2011, 76, 1006–1014. [Google Scholar] [CrossRef]
- Chiò, A.; Calvo, A.; Moglia, C.; Mazzini, L.; Mora, G.; PARALS Study Group. Phenotypic heterogeneity of amyotrophic lateral sclerosis: A population based study. J. Neurol. Neurosurg. Psychiatry 2011, 82, 740–746. [Google Scholar] [CrossRef] [PubMed]
- Bartoletti-Stella, A.; Vacchiano, V.; De Pasqua, S.; Mengozzi, G.; De Biase, D.; Bartolomei, I.; Avoni, P.; Rizzo, G.; Parchi, P.; Donadio, V.; et al. Targeted sequencing panels in Italian ALS patients support different etiologies in the ALS/FTD continuum. J. Neurol. 2021, 268, 3766–3776. [Google Scholar] [CrossRef]
- Dubois, B.; Slachevsky, A.; Litvan, I.; Pillon, B. The FAB: A frontal assessment battery at bedside. Neurology 2000, 55, 1621–1626. [Google Scholar] [CrossRef] [PubMed]
- Gallassi, R.; Lenzi, P.; Stracciari, A.; Lorusso, S.; Ciardulli, C.; Morreale, A.; Mussuto, V. Neuropsychological assessment of mental deterioration: Purpose of a brief battery and a probabilistic definition of “normality” and “non-normality”. Acta Psychiatr. Scand. 1986, 74, 62–67. [Google Scholar] [CrossRef] [PubMed]
- Poletti, B.; Solca, F.; Carelli, L.; Madotto, F.; Lafronza, A.; Faini, A.; Monti, A.; Zago, S.; Calini, D.; Tiloca, C.; et al. The validation of the Italian Edimburgh Cognitive and Behavioural ALS Screen (ECAS). Amyotroph. Lateral Scler. Front. Degener. 2016, 17, 489–498. [Google Scholar] [CrossRef]
- Siciliano, M.; Trojano, L.; Trojsi, F.; Greco, R.; Santoro, M.; Basile, G.; Piscopo, F.; D’Iorio, A.; Patrone, M.; Femiano, C.; et al. Edinburgh Cognitive and Behavioural ALS Screen (ECAS)-Italian version: Regression based norms and equivalent scores. Neurol. Sci. 2017, 38, 1059–1068. [Google Scholar] [CrossRef]
- Strong, M.J.; Abrahams, S.; Goldstein, L.H.; Woolley, S.; Mclaughlin, P.; Snowden, J.; Mioshi, E.; Roberts-South, A.; Benatar, M.; Hortobágyi, T.; et al. Amyotrophic lateral sclerosis-frontotemporal spectrum disorder (ALS-FTSD): Revised diagnostic criteria. Amyotroph. Lateral Scler. Front. Degener. 2017, 18, 153–174. [Google Scholar] [CrossRef]
- de Carvalho, M.; Dengler, R.; Eisen, A.; England, J.D.; Kaji, R.; Kimura, J.; Mills, K.; Mitsumoto, H.; Nodera, H.; Shefner, J.; et al. Electrodiagnostic criteria for diagnosis of ALS. Clin. Neurophysiol. 2008, 119, 497–503. [Google Scholar] [CrossRef]
- Wang, X.; Cohen, L.; Wang, J.; Walt, D.R. Competitive immunoassays for the detection of small molecules using Single Molecule Arrays. J. Am. Chem. Soc. 2018, 140, 18132–18139. [Google Scholar] [CrossRef] [PubMed]
- Baiardi, S.; Abu-Rumeileh, S.; Rossi, M.; Zenesini, C.; Bartoletti-Stella, A.; Polischi, B.; Capellari, S.; Parchi, P. Antemortem CSF Aβ42/Aβ40 ratio predicts Alzheimer’s disease pathology better than Aβ42 in rapidly progressive dementias. Ann. Clin. Transl. Neurol. 2018, 6, 263–273. [Google Scholar] [CrossRef] [PubMed]
- Jack, C.R., Jr.; Bennett, D.A.; Blennow, K.; Carrillo, M.C.; Feldman, H.H.; Frisoni, G.B.; Hampel, H.; Jagust, W.J.; Johnson, K.A.; Knopman, D.S.; et al. A/T/N: An unbiased descriptive classification scheme for Alzheimer disease biomarkers. Neurology 2016, 87, 539–547. [Google Scholar] [CrossRef] [PubMed]


| ALS Patients (n = 156) | Controls (n = 48) | p Values | |
|---|---|---|---|
| Age at sampling, years * | 66.0 (56.0–72.0) | 61.0 (60.0–64.0) | 0.07 † |
| Female, n (%) | 58 (37.2) | 16 (33.3) | 0.73 § |
| Plasma GFAP, pg/mL * | 159.70 (117.30–236.70) | 125.9 (93.52–154.70) | 0.0004 † |
| Plasma NfL, pg/mL * | 70.50 (41.25–113.70) | 10.76 (9.41–15.71) | <0.0001 † |
| Plasma p-tau181, pg/mL * | 2.71 (1.74–4.96) | 0.99 (0.76–1.36) | <0.0001 † |
| ALS Patients (n = 156) | |
|---|---|
| N (%) | |
| Type of onset | |
| Bulbar | 34 (21.8) |
| Spinal | 105 (67.3) |
| Pseudopolyneuritic | 12 (7.7) |
| Pyramidal | 5 (3.2) |
| Clinical phenotype | |
| Classic | 92 (58.9) |
| Bulbar | 22 (14.1) |
| Respiratory | 1 (0.6) |
| PUMN | 11 (7.0) |
| PLS | 3 (1.9) |
| Flail arm syndrome | 10 (6.4) |
| Flail leg syndrome | 7 (4.5) |
| PMA | 10 (6.4) |
| Diagnostic categories | |
| Definite ALS | 27 (17.3) |
| Probable ALS | 58 (37.2) |
| Probable laboratory-supported ALS | 35 (22.4) |
| Possible ALS | 26 (16.7) |
| Unclassified (PMA) | 10 (6.4) |
| King’s staging | |
| 1 | 8 (5.1) |
| 2 | 53 (34.0) |
| 3 | 83 (53.2) |
| 4 | 12 (7.7) |
| Strong’s categories (n = 128) | |
| ALS-CN | 77 (60.1) |
| ALSbi | 21 (16.4) |
| ALSci | 7 (5.5) |
| ALScbi | 9 (7.0) |
| ALS-FTD | 14 (10.9) |
| Genetic status (n = 153) | |
| C9Orf72 RE carriers | 15 (9.8) |
| SOD1 mutation carriers | 3 (2.0) |
| TARDBP mutation carriers | 1 (0.6) |
| Wild-type | 134 (87.6) |
| Deceased/with tracheostomy | 77 (49.3) |
| Median (IQR) | |
| Disease duration (months) | 13 (8–24) |
| ALSFRS-R scale (n = 154) | 41 (38.0–44.0) |
| MRC score (n = 155) | 4.6 (4.25–4.8) |
| FVC * (n = 140) | 90.0 (74.5–106.0) |
| BMI (n = 146) | 24.6 (22.1–27.7) |
| Creatinine | 0.74 (0.65–0.85) |
| CPK (n = 155) | 197 (120–379) |
| Blood-brain barrier index (n = 153) | 7.0 (5.5–10.6) |
| ALS, A+T+ (n = 9) | ALS, A+T− (n = 11) | ALS, A− (n = 136) | p Values | |
|---|---|---|---|---|
| Plasma GFAP, pg/mL * | 345.0 (297.4–496.2) | 247.4 (176.2–330.0) | 153.0 (112.2–207.6) | <0.0001 † |
| Plasma NfL, pg/mL * | 66.21 (52.95–172.10) | 55.20 (31.30–103.0) | 73.50 (41.25–115.0) | 0.57 † |
| Plasma p-tau181, pg/mL * | 4.72 (2.87–5.66) | 3.79 (2.81–6.46) | 2.55 (1.56–4.63) | 0.01 † |
| CSF p-tau181, pg/mL * | 82.00 (73.25–96.55) | 45.90 (41.30–52.60) | 32.65 (26.70–42.13) | <0.0001 † |
| CSF t-tau, pg/mL * | 585.0 (455.5–635.0) | 286.0 (265.0–358.0) | 255.5 (204.8–357.0) | <0.0001 † |
| CSF NfL, pg/mL * | 6135 (3737–10,570) | 2618 (1731–6390) | 6102 (3165–10,844) | 0.21 † |
| APOE ε4 carriers, positive (%) | 3 (33.3) | 4 (36.4) | 15 (11.0) | 0.01 § |
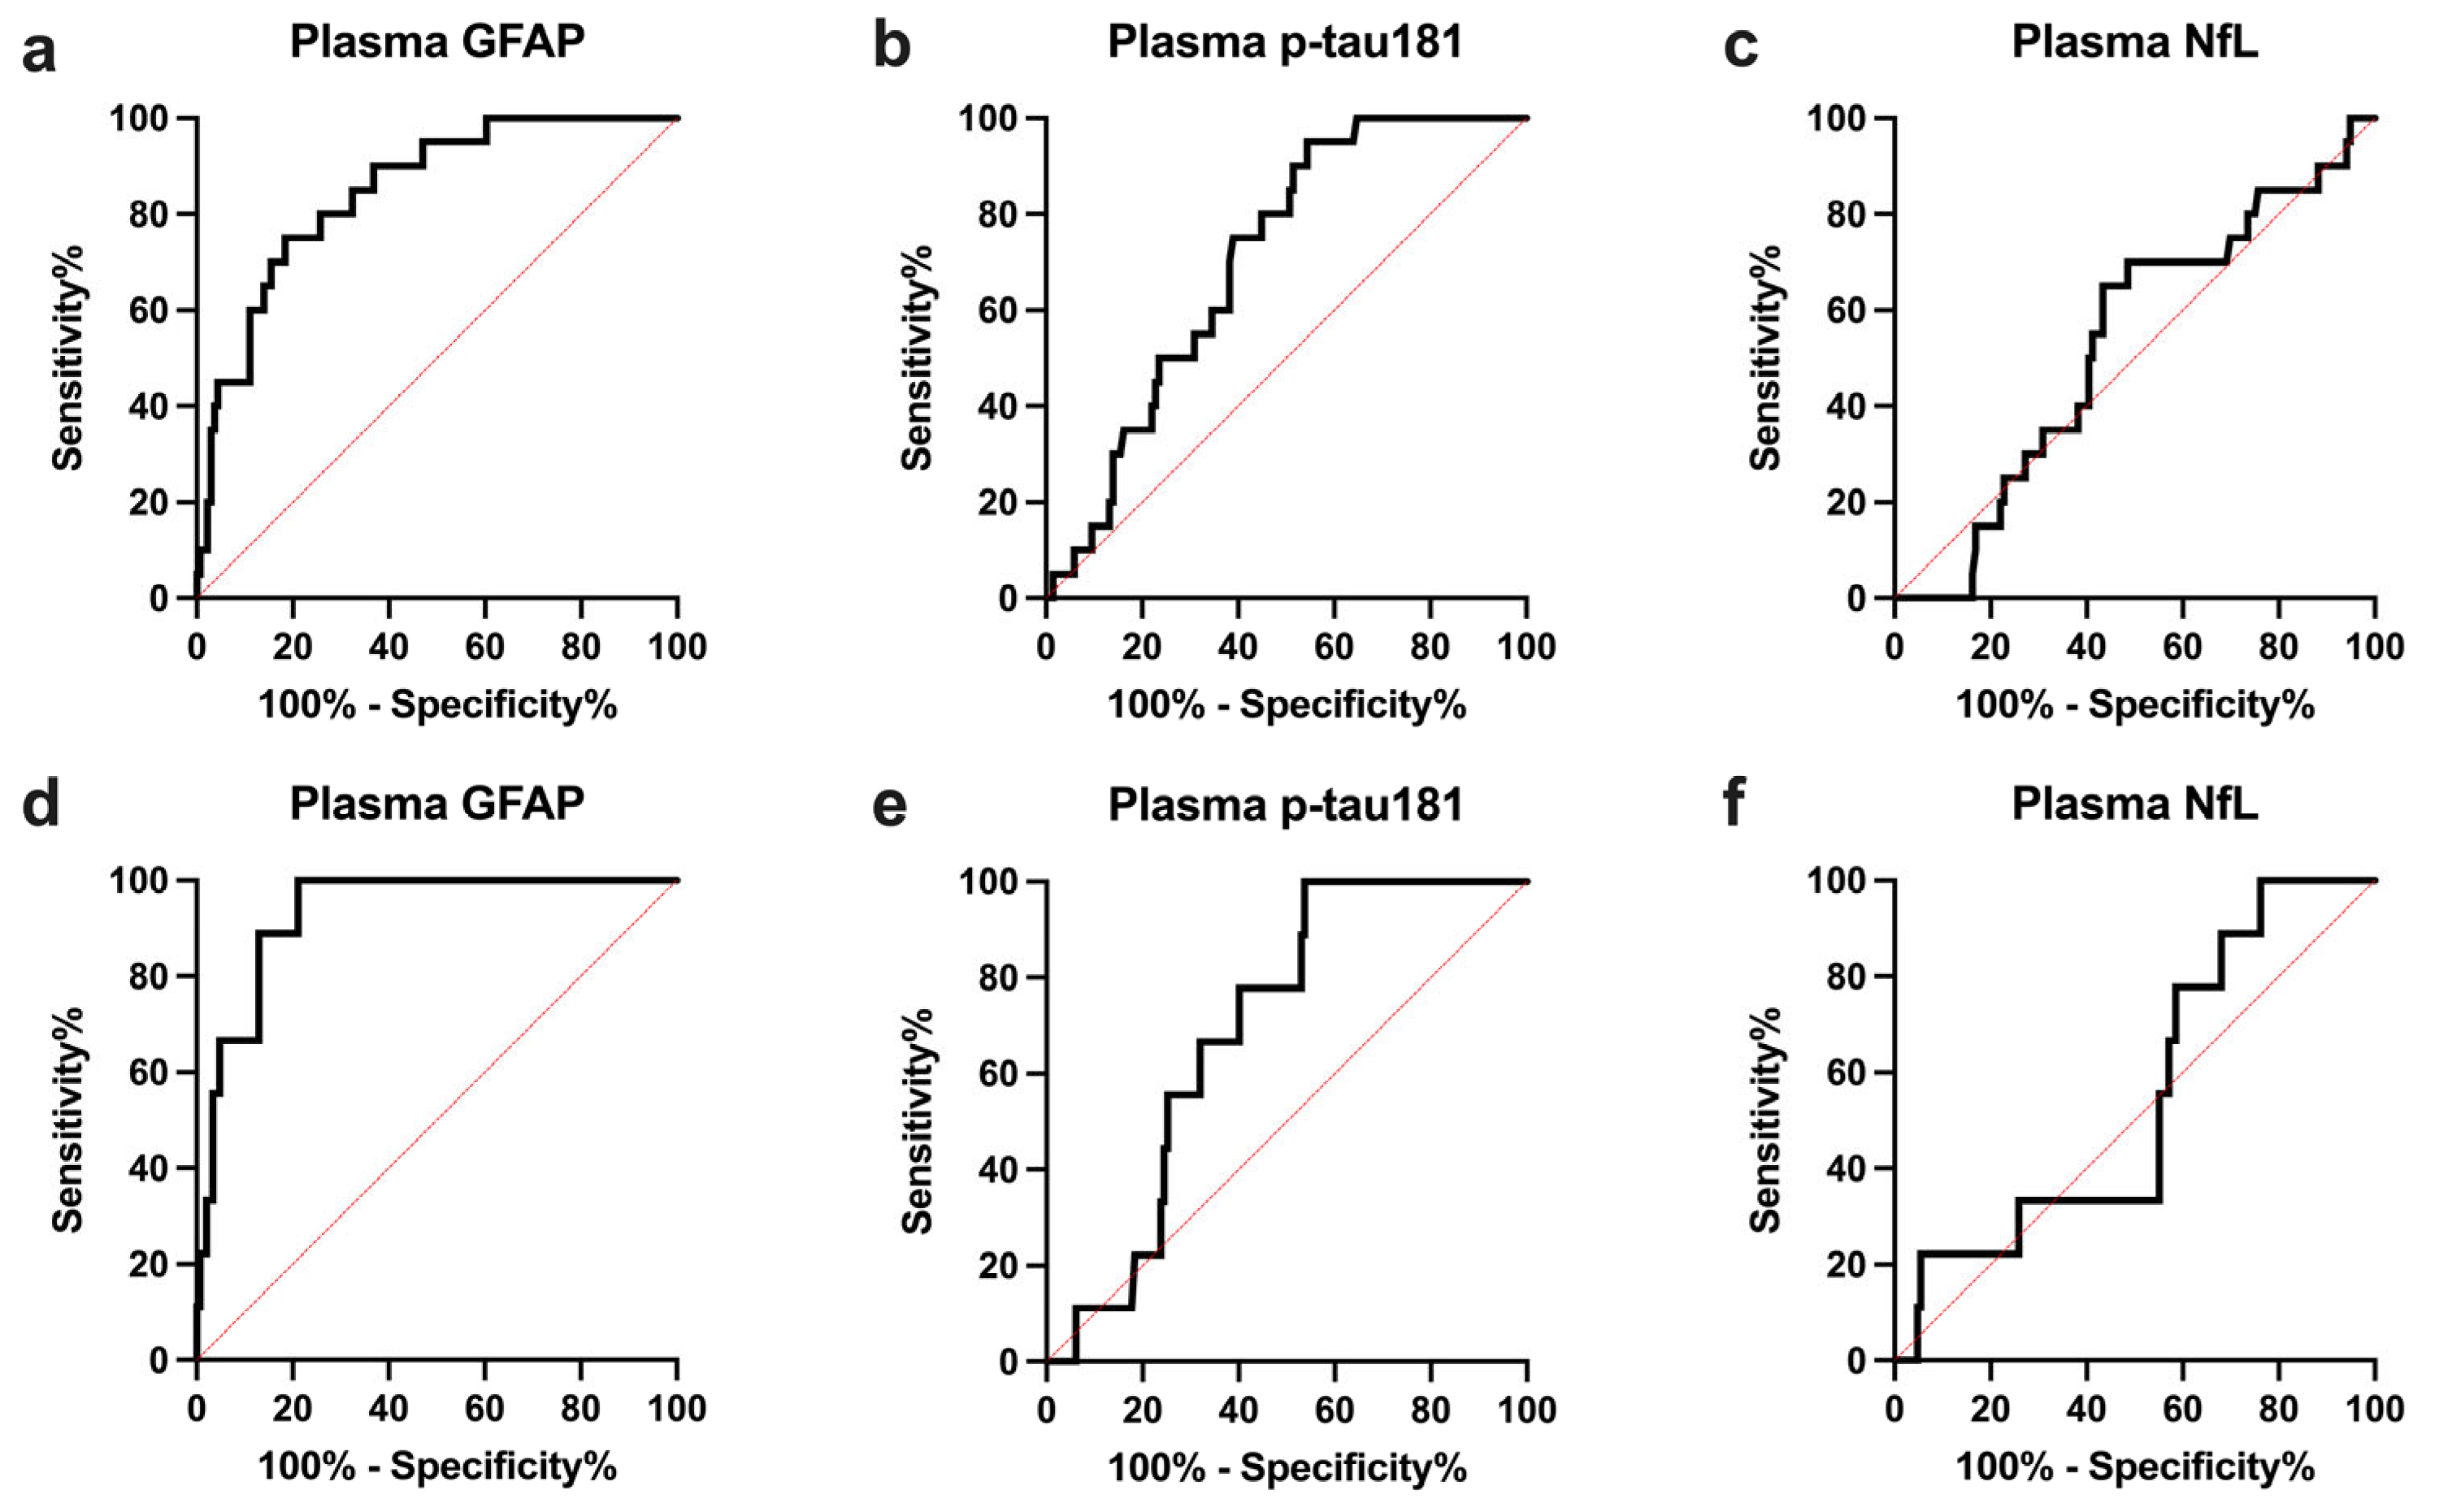
| ALS A+ vs. ALS A− | |||||
|---|---|---|---|---|---|
| AUC (95% CI) | p-Value * | Sensitivity, % (95% CI) | Specificity, % (95% CI) | Optimal Cutoff Value † | |
| Plasma GFAP | 0.847 (0.766–0.929) | - | 75.0 (53.1–88.8) | 81.6 (74.3–87.2) | >236.3 |
| Plasma p-tau181 | 0.706 (0.611–0.800) | 0.0008 | 95.0 (76.4–99.7) | 45.6 (37.4–54.0) | >2.22 |
| Plasma NfL | 0.528 (0.403–0.653) | 0.0003 | 65.0 (43.3–81.9) | 56.6 (48.2–64.5) | <67.0 |
| CSF p-tau181 | 0.875 (0.801–0.949) | 0.52 | 90.0 (69.9–98.2) | 75 (67.1–81.5) | >41.15 |
| AD/ALS vs. not-AD/ALS | |||||
| AUC (95% CI) | p-Value * | Sensitivity, % (95% CI) | Specificity, % (95% CI) | Optimal Cutoff Value † | |
| Plasma GFAP | 0.932 (0.879–0.985) | - | 100 (70.1–100) | 78.9 (71.6–84.7) | >236.3 |
| Plasma p-tau181 | 0.692 (0.578–0.807) | 0.0008 | 100 (70.1–100) | 46.2 (38.4–54.3) | >2.47 |
| Plasma NfL | 0.548 (0.376–0.721) | <0.0001 | 100 (70.1–100) | 23.8 (17.6–31.3) | >38.1 |
| AD-ALS (n = 9) | Not-AD/ALS (n = 147) | p Values | |
|---|---|---|---|
| MMSE scores *, n | 28.0 (22.5–29.0), 5 | 29.0 (28.0–30.0) | 0.03 † |
| MMSE scores (age- and education-adjusted) *, n | 25.70 (22.90–29.36), 5 | 28.16 (26.70–28.99), 108 | 0.35 † |
| ECAS total scores (age- and education-adjusted) *, n | 89.19 (79.91–112.0), 4 | 108.4 (96.81–116.80), 84 | 0.16 † |
| ECAS total scores (equivalent scores) *, n | 2.0 (1.25–3.5), 4 | 4.0 (3.0–4.0), 84 | 0.04 † |
| ECAS ALS-specific scores (age- and education-adjusted) *, n | 64.44 (61.25–84.42), 4 | 79.87 (72.56–86.08), 84 | 0.21 † |
| ECAS ALS-specific scores (equivalent scores) *, n | 2.0 (2.0–3.5), 4 | 4.0 (3.0–4.0), 84 | 0.057 † |
| ECAS ALS-nonspecific scores (age- and education-adjusted) *, n | 24.77 (18.42–27.82), 4 | 27.34 (24.10–30.65), 84 | 0.20 † |
| ECAS ALS-nonspecific scores (equivalent scores) *, n | 3.0 (1.25–4.0), 4 | 4.0 (2.0–4.0), 84 | 0.63 † |
| Visual short-memory test (age- and education-adjusted) *, n | 15.80 (14.18–17.97), 5 | 19.70 (17.43–20.90), 109 | 0.01 † |
| Visual short-memory test (equivalent scores) *, n | 1.0 (1.0–2.5), 5 | 3.0 (2.0–4.0), 109 | 0.04 † |
| ALS-CN § (%) | 4/6 (66.7) | 73/122 (59.8) | >0.99 ¶ |
| ALSci § (%) | 0/6 (0) | 7/122 (5.7) | >0.99 ¶ |
| ALSbi § (%) | 0/6 (0) | 21/122 (17.2) | 0.58 ¶ |
| ALScbi § (%) | 1/6 (16.7) | 8/122 (6.5) | 0.36 ¶ |
| ALS-FTD § (%) | 1/6 (16.7) | 13/122 (10.6) | 0.50 ¶ |
| Variable | HR (95% CI) | p-Value |
|---|---|---|
| Plasma GFAP | 1.73 (1.05–2.87) | 0.032 |
| Plasma p-tau181 | 1.09 (1.00–1.19) | 0.042 |
| Plasma NfL | 1.01 (1.00–1.01) | <0.001 |
Disclaimer/Publisher’s Note: The statements, opinions and data contained in all publications are solely those of the individual author(s) and contributor(s) and not of MDPI and/or the editor(s). MDPI and/or the editor(s) disclaim responsibility for any injury to people or property resulting from any ideas, methods, instructions or products referred to in the content. |
© 2023 by the authors. Licensee MDPI, Basel, Switzerland. This article is an open access article distributed under the terms and conditions of the Creative Commons Attribution (CC BY) license (https://creativecommons.org/licenses/by/4.0/).
Share and Cite
Mastrangelo, A.; Vacchiano, V.; Zenesini, C.; Ruggeri, E.; Baiardi, S.; Cherici, A.; Avoni, P.; Polischi, B.; Santoro, F.; Capellari, S.; et al. Amyloid-Beta Co-Pathology Is a Major Determinant of the Elevated Plasma GFAP Values in Amyotrophic Lateral Sclerosis. Int. J. Mol. Sci. 2023, 24, 13976. https://doi.org/10.3390/ijms241813976
Mastrangelo A, Vacchiano V, Zenesini C, Ruggeri E, Baiardi S, Cherici A, Avoni P, Polischi B, Santoro F, Capellari S, et al. Amyloid-Beta Co-Pathology Is a Major Determinant of the Elevated Plasma GFAP Values in Amyotrophic Lateral Sclerosis. International Journal of Molecular Sciences. 2023; 24(18):13976. https://doi.org/10.3390/ijms241813976
Chicago/Turabian StyleMastrangelo, Andrea, Veria Vacchiano, Corrado Zenesini, Edoardo Ruggeri, Simone Baiardi, Arianna Cherici, Patrizia Avoni, Barbara Polischi, Francesca Santoro, Sabina Capellari, and et al. 2023. "Amyloid-Beta Co-Pathology Is a Major Determinant of the Elevated Plasma GFAP Values in Amyotrophic Lateral Sclerosis" International Journal of Molecular Sciences 24, no. 18: 13976. https://doi.org/10.3390/ijms241813976
APA StyleMastrangelo, A., Vacchiano, V., Zenesini, C., Ruggeri, E., Baiardi, S., Cherici, A., Avoni, P., Polischi, B., Santoro, F., Capellari, S., Liguori, R., & Parchi, P. (2023). Amyloid-Beta Co-Pathology Is a Major Determinant of the Elevated Plasma GFAP Values in Amyotrophic Lateral Sclerosis. International Journal of Molecular Sciences, 24(18), 13976. https://doi.org/10.3390/ijms241813976