Review

Multi-Level Biomarkers for Early Diagnosis of Ischaemic Stroke: A Systematic Review and Meta-Analysis

1
Department of Emergency Medicine, University of Hong Kong, Hong Kong, China
2
School of Biomedical Sciences, University of Hong Kong, Hong Kong, China
*
Author to whom correspondence should be addressed.
Int. J. Mol. Sci. 2023, 24(18), 13821; https://doi.org/10.3390/ijms241813821
Submission received: 8 August 2023 / Revised: 25 August 2023 / Accepted: 4 September 2023 / Published: 7 September 2023
(This article belongs to the Special Issue Molecular Researches on Ischemic Stroke)

Abstract

:
Blood biomarkers hold potential for the early diagnosis of ischaemic stroke (IS). We aimed to evaluate the current weight of evidence and identify potential biomarkers and biological pathways for further investigation. We searched PubMed, EMBASE, the Cochrane Library and Web of Science, used R package meta4diag for diagnostic meta-analysis and applied Gene Ontology (GO) analysis to identify vital biological processes (BPs). Among 8544 studies, we included 182 articles with a total of 30,446 participants: 15675 IS, 2317 haemorrhagic stroke (HS), 1798 stroke mimics, 846 transient ischaemic attack and 9810 control subjects. There were 518 pooled biomarkers including 203 proteins, 114 genes, 108 metabolites and 88 transcripts. Our study generated two shortlists of biomarkers for future research: one with optimal diagnostic performance and another with low selection bias. Glial fibrillary acidic protein was eligible for diagnostic meta-analysis, with summary sensitivities and specificities for differentiating HS from IS between 3 h and 24 h after stroke onset ranging from 73% to 80% and 77% to 97%, respectively. GO analysis revealed the top five BPs associated with IS. This study provides a holistic view of early diagnostic biomarkers in IS. Two shortlists of biomarkers and five BPs warrant future investigation.

1. Introduction

Stroke is a major cause of death and disability worldwide, with a profound impact on quality of life and a significant burden on families and society [1,2]. It results in 5.5 million deaths globally each year, with an estimated one in four adults experiencing a stroke in their lifetime [1,2]. Stroke can be classified into two main types: ischaemic stroke (IS) and haemorrhagic stroke (HS), with IS accounting for the majority of cases (71%) [2]. IS results from cerebral blood flow obstruction, and prompt reperfusion can significantly reduce mortality and disability [1]. Current reperfusion therapies include intravenous thrombolysis within 4.5 h (h) and endovascular thrombectomy within 6 h of symptom onset, which are time-critical [3]. Patients with evidence of salvageable brain tissue on imaging can also receive these therapies within 9 h for thrombolysis and 24 h for thrombectomy [3]. Whether patients within the time window can access either of these two therapies depends on the speed of differentiation of IS from HS and stroke mimics (SM). Currently, differentiation relies on clinical assessment and neuroimaging (brain CT/MRI). Non-contrast CT is used to exclude HS from thrombolysis treatment [4], but it is generally unavailable in prehospital settings and primary care hospitals. MRI is more sensitive for detecting IS, but fast access to it is restricted, and some patients with contraindications cannot undergo MRI scans [1]. Therefore, it is necessary to seek other approaches to compensate for the limitations of neuroimaging.
In recent years, with the advancement of point-of-care testing (POCT) technology, rapid testing has gradually become a reality for molecules ranging from DNA, RNA, proteins to metabolites, which could provide results within 5–20 min from blood sampling [5,6,7]. POCT devices are usually portable and user-friendly, leading to rapid expansion in applications across emergency departments, intensive care units, hospital wards, outpatient departments, and primary healthcare institutions [8,9,10]. If excellent diagnostic biomarkers of IS can be found, applying existing POCT technology would enable a rapid diagnosis of IS, benefiting both developing and developed regions. Therefore, a blood biomarker test has the potential to be a complement to neuroimaging and enhance the early management of IS.
A growing number of studies have investigated potential diagnostic biomarkers of IS. Previous systematic reviews of these studies have either evaluated single biomarkers [11] or single levels of biomarkers, such as proteins [12], RNAs [13], metabolites [14], and biomarker panels [15], separately. A comprehensive overview of multi-level biomarkers is necessary for a better assessment of the current evidence. High-throughput techniques have made it possible to evaluate vast quantities of molecules as biomarkers [16]. However, these omics studies have not yet been systematically analysed. Circulating biomarkers can also provide insights into pathophysiological changes related to brain injury [17]. Therefore, the aim of this study is: firstly, to identify all levels of early circulating diagnostic biomarkers of IS reported by published studies; secondly, to conduct a diagnostic meta-analysis to evaluate their pooled diagnostic performance if available; thirdly, to summarise all high-throughput omics studies on early diagnostic biomarkers of IS; fourthly, to apply bioinformatics to reveal pivotal biological processes (BPs) of IS.
We conducted a systematic search and analysis of studies on circulating biomarkers that distinguish IS from HS, SM, transient ischaemic attack (TIA), and controls within 24 h of symptom onset. We selected the 24 h window because diagnostic biomarkers during this early stage have the potential to expedite diagnosis and reperfusion treatment.

2. Methods

2.1. Design

We performed this systematic review and meta-analysis in compliance with the Preferred Reporting Items for Systematic Reviews and Meta-analyses (PRISMA) reporting guideline [18] and the Diagnostic Test Accuracy (DTA) extension [19]. The protocol was prospectively registered on PROSPERO (ID: CRD42022303870). Two reviewers independently performed screening, data extraction, and quality assessment. Disagreements were resolved by discussion between two reviewers (QL and one of YJ, CT, or LZ). We resorted to a third reviewer for unresolved conflicts.

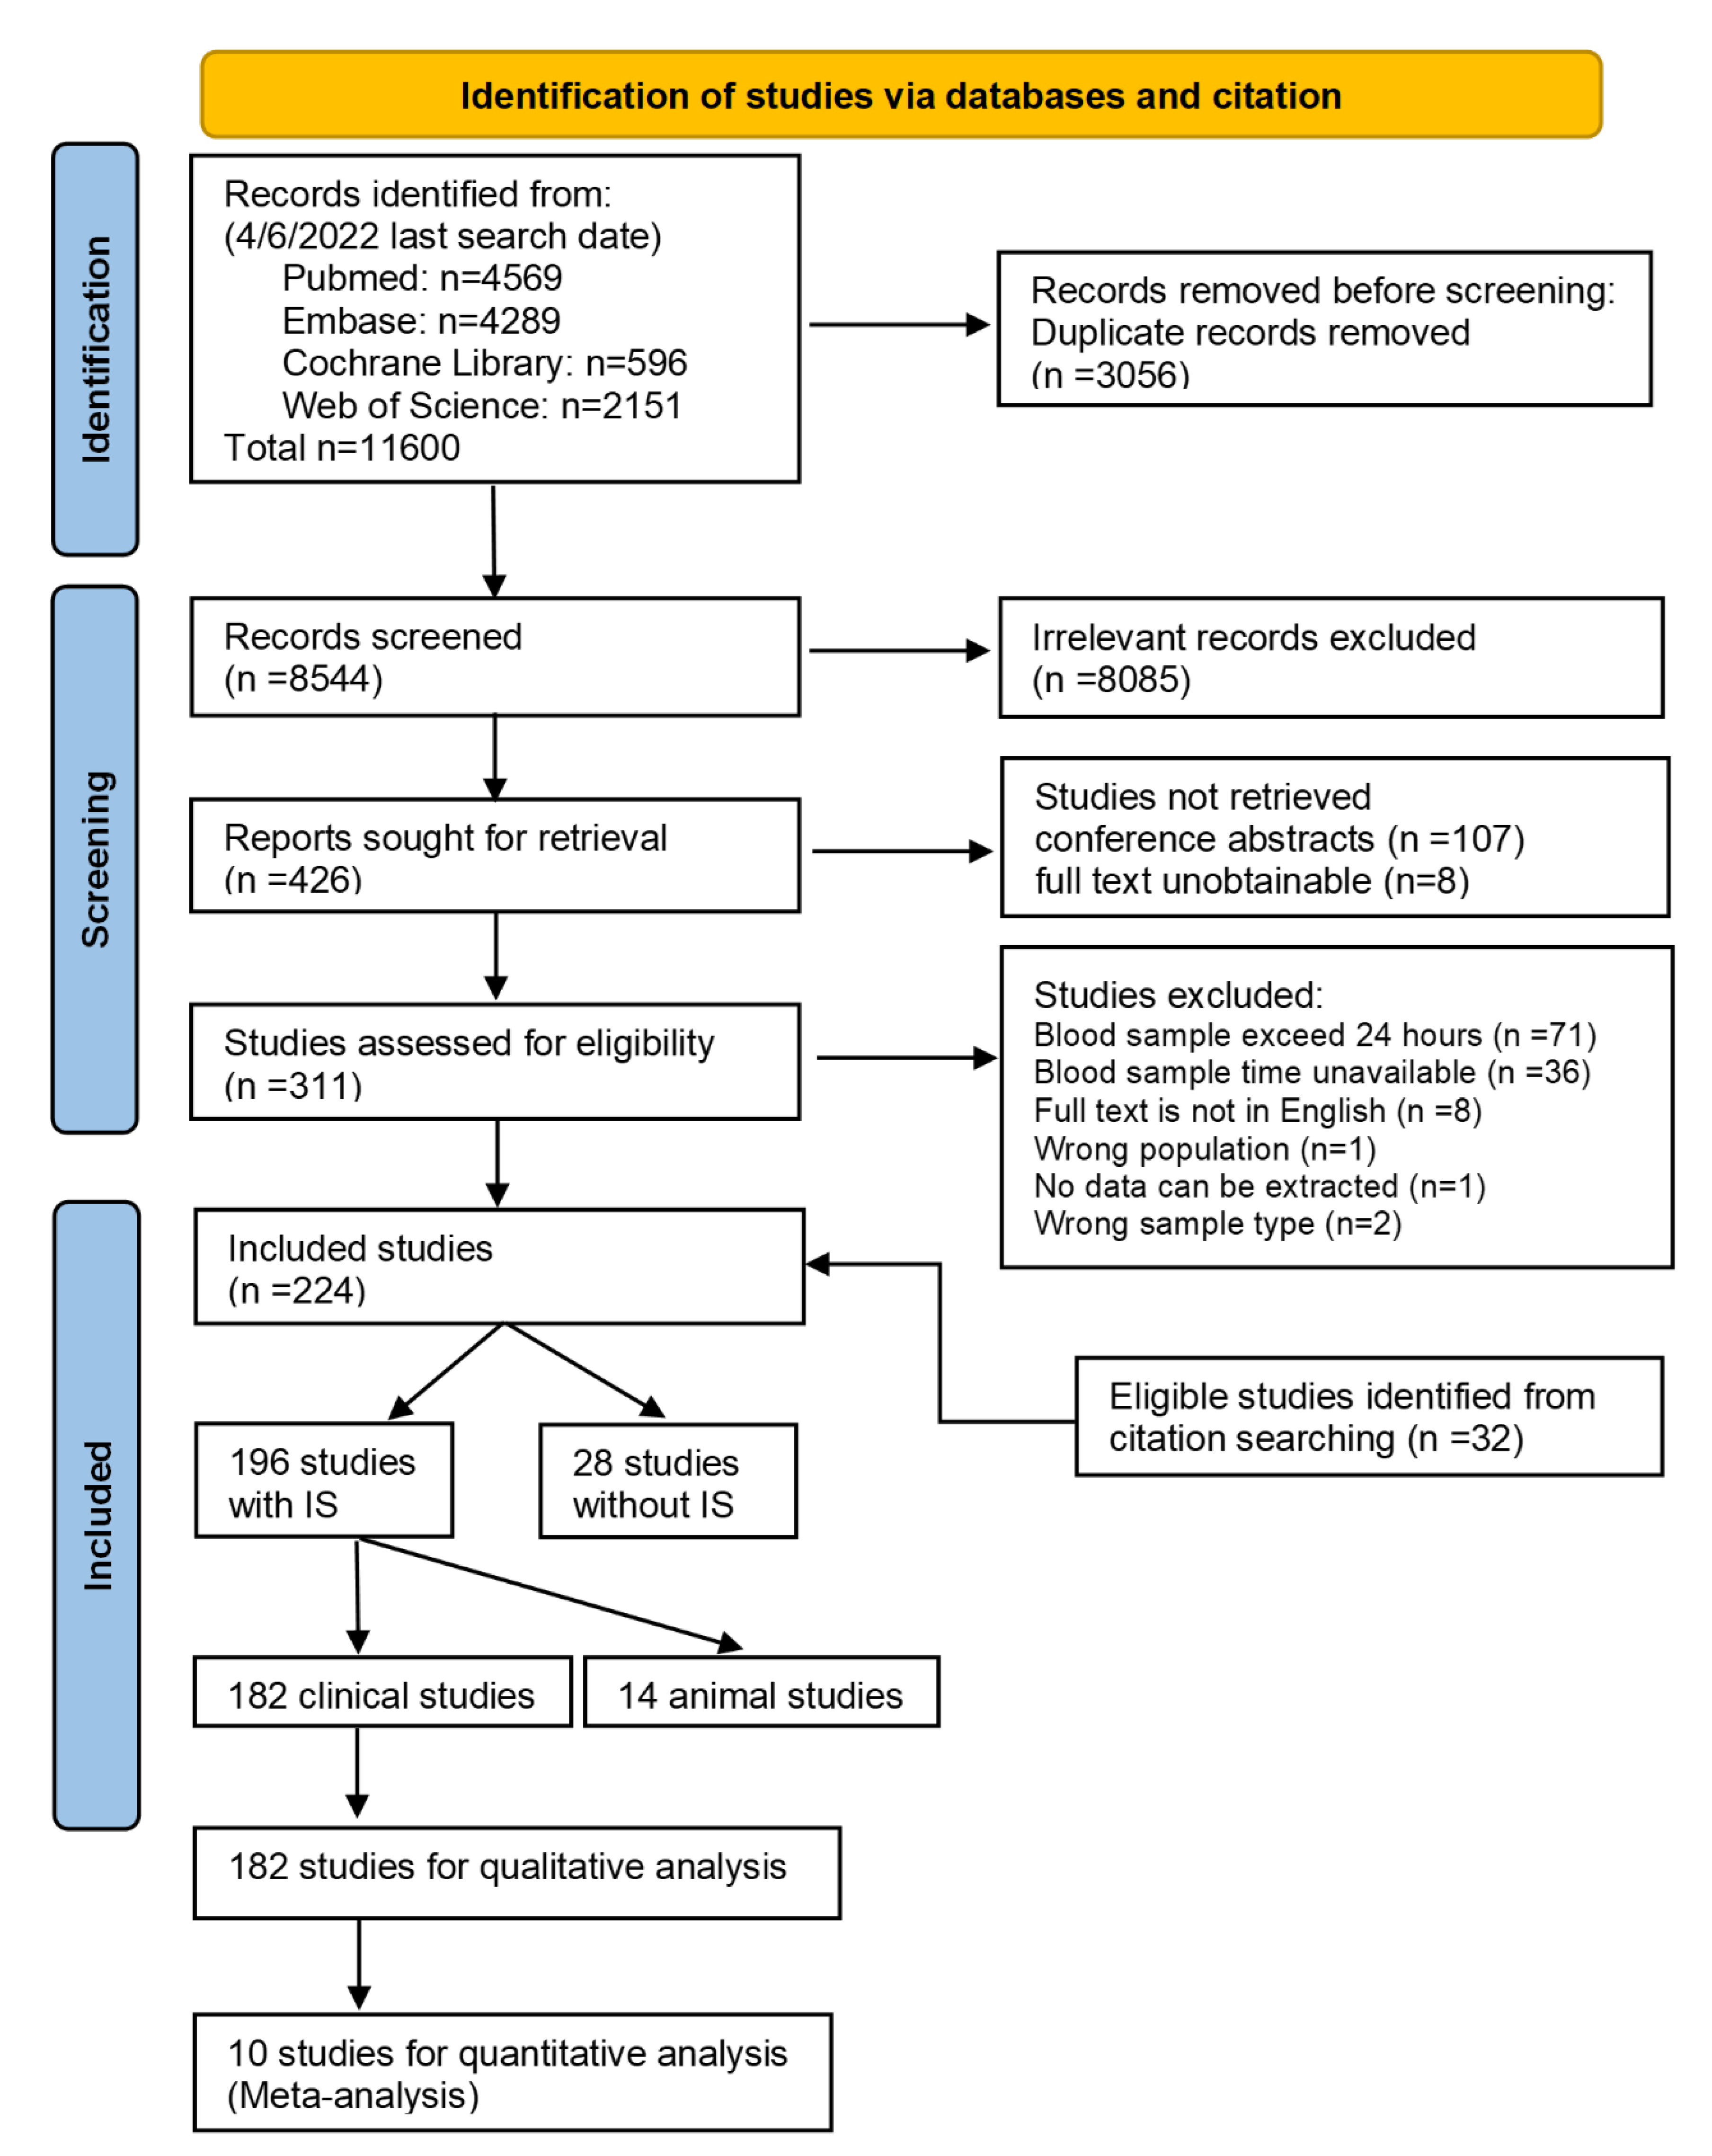
2.2. Search Strategy and Selection Criteria

A literature search was conducted in PubMed (1971-), EMBASE (1974-), the Cochrane Library (1993-), and Web of Science (1900-). Our search included the following terms: “blood”, “plasma”, “serum”, “biomarkers”, “diagnosis”, “differentiation”, “stroke”, “ischaemic stroke”, “hemorrhagic stroke” and their corresponding synonyms. The detailed search strategies are presented in Supplementary Table S1. Searches were conducted on 4 June 2022. We imported all records from the literature search into Covidence systematic review software (Veritas Health Innovation, Melbourne, Australia, www.covidence.org, accessed on 29 September 2021), where screening, data extraction, and quality assessment were performed. The reference list from all the included studies and related reviews obtained from the screening process were also checked for any additional eligible articles.
Our inclusion criteria required all of five items: (1) studies that included at least two groups of the following: IS, HS, TIA, SM, and controls; (2) blood samples collected within 24 h from symptom onset; (3) any biomarkers or panel of biomarkers which included genes, RNAs, proteins, or metabolites; (4) patients aged ≥18 years; and (5) full-text articles available in English. Some studies reported data both within and exceeding 24 h, but we only extracted data that were within 24 h. We included diagnostic test studies, case control studies, and cohort studies. There were no restrictions on publication date. We excluded review articles, editorials, comments, and conference abstracts; articles reporting first blood samples collected longer than 24 h from symptom onset; biomarker levels tested in cerebrospinal fluid, urine, saliva, or breath; non-blood markers such as neuroimaging and clinical scores; and patients aged <18 years.

2.3. Data Extraction

We extracted general information (first author, publication year, title, country), characteristics of the study (study design, included groups, sample size, validation cohort, comparison, setting, reference standard, age, gender, specimen, sampling time, assay), biomarkers (omics name, panel or not, biomarker name, number of biomarkers, biological process), and outcomes (sensitivity, specificity, area under the curve (AUC), cut-off value, biomarker concentration, fold change). We also extracted true-positive (TP), false-positive (FP), false-negative (FN) and true-negative (TN) if data synthesis required. The extracted data were finally exported from Covidence into a csv spreadsheet.

2.4. Risk of Bias Assessment

We used Quality Assessment of Diagnostic Accuracy Studies (QUADAS-2) tool [20] to assess risk of bias and modified it for our study.

2.5. Statistical Analysis

We used R software (R 4.2.1, R core team) for qualitative and quantitative analysis. To exhibit the synthesised temporal change of biomarker concentration, we used a linear mixed model to acquire the combined median and 95% CI from multiple studies and then plotted them. To synthesise summary sensitivity and specificity, we used R package meta4diag, which implemented Bayesian bivariate meta-analysis of diagnostic test studies [21]. Compared to classical statistics, Bayesian statistics are more flexible and can better handle small sample sizes and unconventional data [22]. Bayesian bivariate meta-analysis considers the heterogeneity and correlation among different studies, as well as incorporating prior knowledge and uncertainty into the analysis, and providing more accurate estimation results and confidence intervals [22]. Furthermore, the meta4diag package utilises the newly proposed penalised complexity (PC) prior framework to enable users to specify prior distributions for the hyperparameters in an intuitive manner [21]. We used the default setting of meta4diag, which analysed a general diagnostic meta-analysis without detailed covariate information (e.g., study design and quality, patient characteristics, setting, person who performed the test, etc.) [21].
We performed the diagnostic meta-analysis when TP, FP, FN, or TN was available or could be calculated from a given sample size, sensitivity, and specificity in at least two studies on the same biomarker and at the same time point. Forest plots of summary sensitivity and specificity and summary receiver operating characteristic (SROC) curves were plotted. As a statistical inconsistency (e.g., I2) measurement was not typically applicable in meta-analysis of diagnostic test accuracy (DTA) studies, we replaced it in compliance with PRISMA-DTA by describing the term variability [19], which was the assessment of the similarity of assay methods, specimens, and cut-off values in this study. Meta-regression and sensitivity analysis were considered after variability assessment. A funnel plot was planned to evaluate publication bias. The GRADE (Grading of Recommendations Assessment, Development, and Evaluation) [23] system was considered for certainty assessment.

2.6. Bioinformatic Analysis

Gene Ontology (GO) enrichment analysis is a statistical method used to identify overrepresented BP, molecular functions, and cellular components within a set of genes or proteins [24,25]. The method is based on the GO, which is a standardised system of functional annotations for genes and proteins. GO enrichment analysis involves comparing a set of genes or proteins of interest to a background or reference set, such as all genes or proteins in a particular organism or cell type. The goal is to identify functional categories that are significantly overrepresented in the set of interest compared to the background set.
The diagnostic biomarkers of IS are typically identified by comparing the levels of specific molecules in patients with IS to those in other groups (HS/SM/TIA/controls). These biomarker molecules identified are likely to play a role in the BPs that occur after IS onset. By pooling all the protein and gene expression biomarkers from high-throughput omics studies, we performed GO enrichment analysis to determine which BPs are most likely to be implicated by these biomarkers. g:Profiler is a widely used web-based tool that is designed for performing GO analysis [26]. We input gene and protein lists in g:Profiler (accessed on 16 February 2023) which output the most significant BPs associated with the input biomarkers.

3. Results

3.1. Qualitative Synthesis

We screened 8544 records and assessed 426 full texts for eligibility. Finally, 182 studies were included (Figure 1), comprising IS (n = 15,675), HS (n = 2317), SM (n = 1798), TIA (n = 846), and controls (n = 9810), a total of 30,446 participants from 38 countries. The characteristics of the 182 included studies are presented in Supplementary Table S2. There were 89 prospective, 85 case control, 3 retrospective, and 5 cross-sectional studies. Most studies compared IS with controls (IS-control, n = 139), followed by IS-HS (n = 46), IS-SM (n = 17), and IS-TIA (n = 8). No study compared IS with all other four groups (HS, TIA, SM, and control) simultaneously. Half of the studies had a sample size less than 100 participants (n = 91), then 100 to 400 participants (n = 78), and more than 400 participants (n = 13). The majority of studies evaluated protein biomarkers (n = 127), followed by RNAs (n = 41), metabolites (n = 11), and gene expression (n = 9), whilst nine studies reported several levels of biomarkers simultaneously. A total of 19 (10%) studies had validation or replication cohorts to verify diagnostic performance of biomarkers in their study design.
A total of 518 biomarkers were pooled, including 203 proteins, 114 genes, 108 metabolites, and 88 transcripts. Transcript biomarkers consisted of 70 microRNAs, 7 circular-RNAs, 6 long-non-coding RNAs, 3 mRNAs, and 3 tRNAs. Of all pooled biomarkers, 427 biomarkers were from IS-controls, 135 from IS-HS, 36 from IS-SM, and 15 from IS-TIA comparisons (Figure 2A). The two overlapped biomarkers in this Venn diagram of IS versus all other conditions (HS/TIA/SM/control) were calcium-binding protein B (S100B) and Matrix metalloproteinase-9 (MMP-9), which means that they were reported to differentiate IS from all other conditions. Only a single assessment was conducted for 89% (444) of the biomarkers. Biomarkers that were evaluated four or more times are presented in Figure 2B, and they were the most frequently studied biomarkers. Brain-specific or brain-enriched biomarkers are listed in Supplementary Table S3.
We identified 72 studies (39.6%) that reported both sensitivity and specificity and acquired a list of biomarkers with the highest sensitivity and specificity (both over 90%) from these studies, which are presented in Table 1. The table also showed that these biomarkers have either not been validated or have only been validated in a few independent cohorts. Furthermore, we summarised 12 proteomics, 12 transcriptomics, 7 metabolomics, and 7 genomics high-throughput studies which are shown in Supplementary Table S4, and pooled 103 genomic, 79 proteomic, 41 transcriptomic, and 97 metabolomic shortlisted omics biomarkers with low selection bias, which are presented in Supplementary List S5. The shortlists from Table 1 and Supplementary List S5 are summarised for future validation.

3.2. Quality Assessment

Supplementary Table S6 provides detailed results of our quality assessment using QUADAS-2. Of the 182 studies included in our analysis, 92 (51%) had a low risk of bias in patient selection, 180 (99%) had a low risk of index test, 145 (80%) had a low risk of bias in their reference standard, 146 (80%) had low risk in flow and timing, and 166 (91%) had low concern about patient not matching with the review question regarding prior testing, presentation, and setting. In addition, all included studies were found to have low concern that the biomarker test, its conduct, or interpretation differed from the review question. In total, 146 (80%) studies had low concern that the definition of stroke in the reference standard did not match the review question.

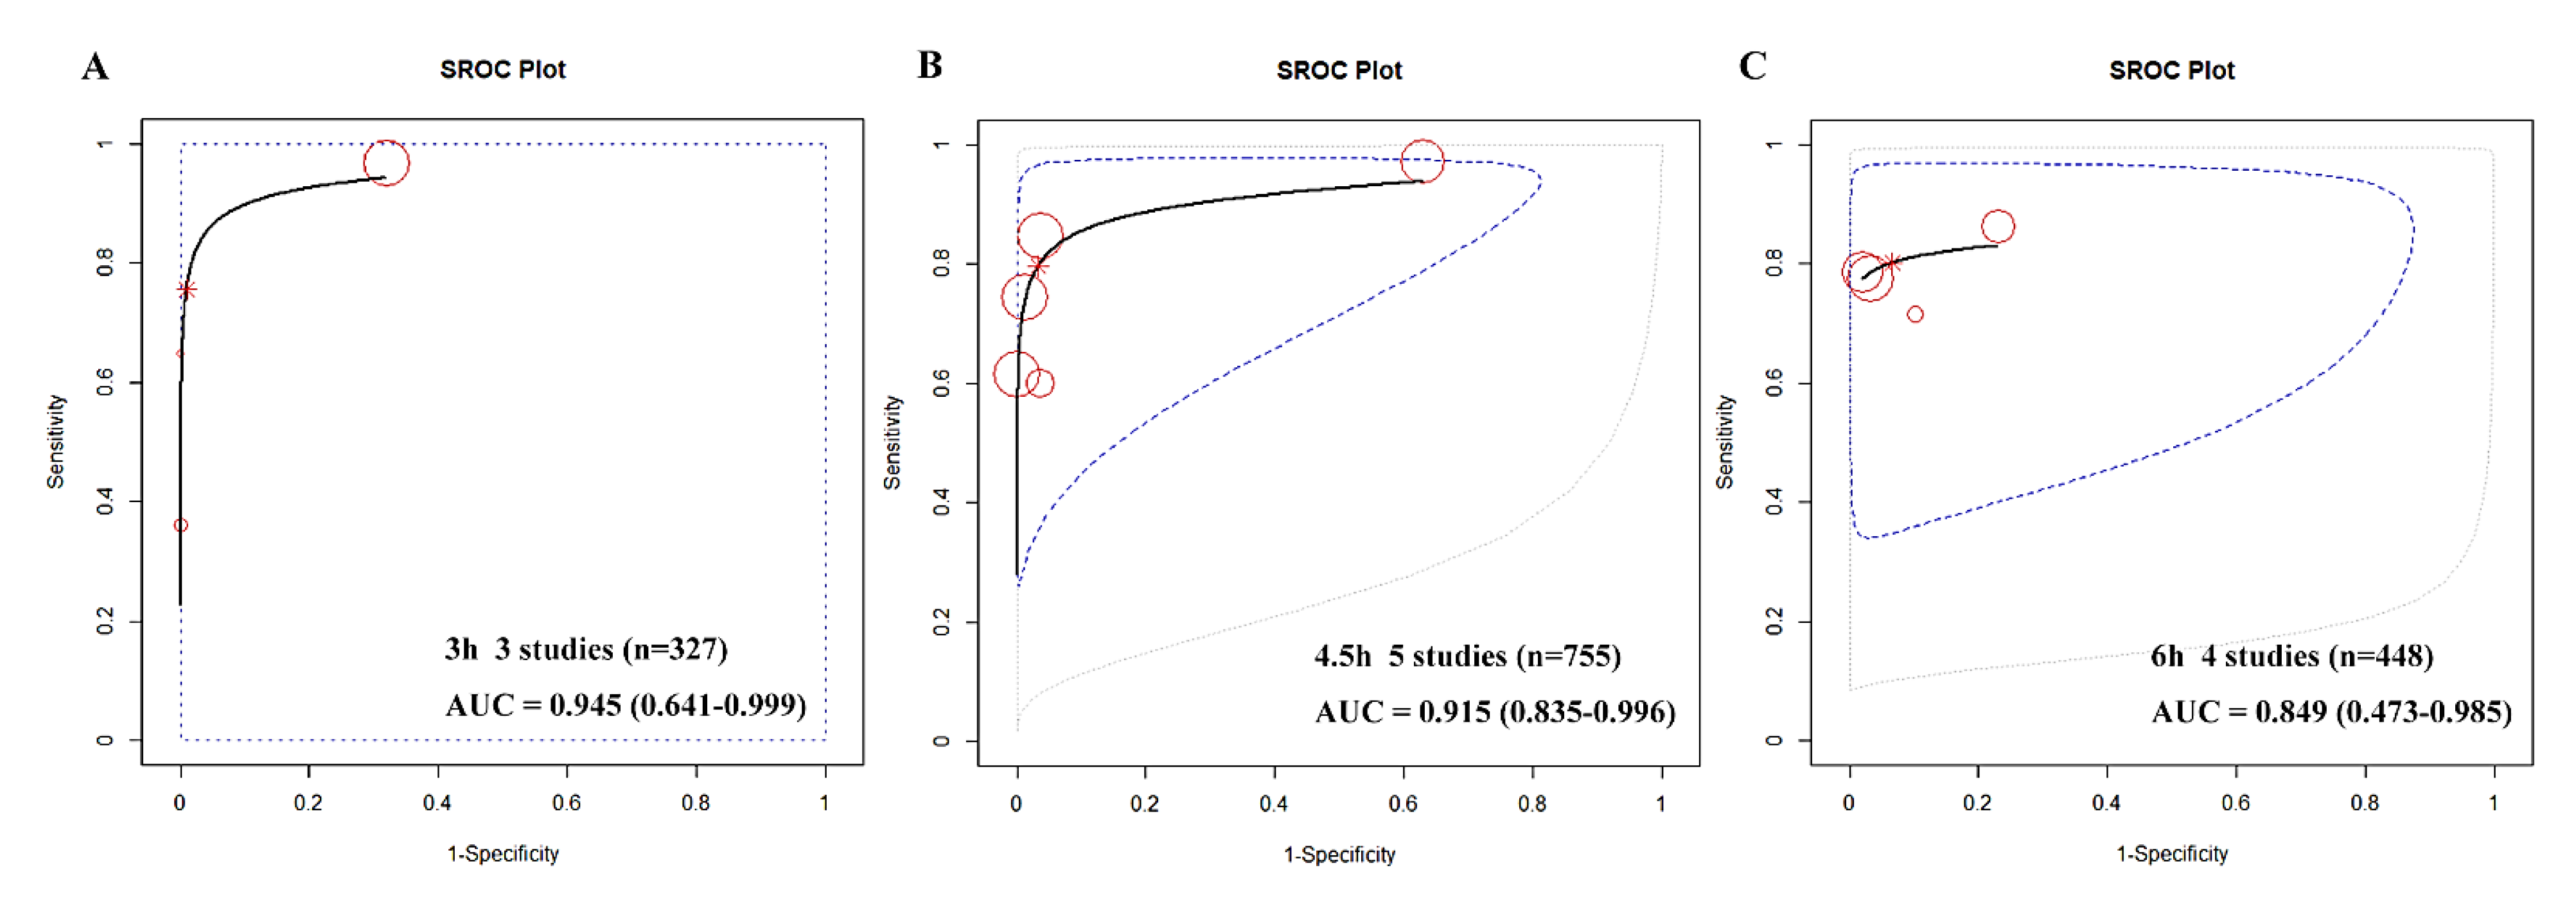
3.3. Quantitative Analysis and Meta-Analysis

Ten studies reported Glial Fibrillary Acidic Protein (GFAP) was eligible for performance of diagnostic meta-analysis (Supplementary Table S7). To investigate the temporal change in GFAP concentration, we additionally included two studies [47,48] for the calculation of a combined median with 95% CI. Our preliminary analysis indicated that patients with HS had higher circulating GFAP levels than those with IS at 3 h, 4.5 h, 6 h, and 24 h, reaching a peak at 4.5 h before gradually declining. The temporal trend is displayed in Figure 3.
Due to the limited number of available studies at each time point, with a maximum of six and a minimum of two, it was challenging to conduct a diagnostic meta-analysis. However, the R package meta4diag managed to mitigate these imperfections. As shown in the forest plot, the summary sensitivities and specificities of GFAP for detecting HS from IS were as follows: at 3 h, 73% (95%CI, 37–94%) and 97% (82–100%); at 4.5 h, 79% (62–91%) and 95% (83–100%); at 6 h, 80% (70–87%) and 92% (81–98%); and at 24 h, 71% (46–90%) and 77% (40–97%), respectively (see Figure 4). We also used SROC curves to evaluate the classification performance of GFAP for differentiating HS and IS at 3 h, 4.5 h, and 6 h (see Figure 5). The summary AUCs were 0.945 (95CI%, 0.641–0.999), 0.915 (0.835–0.996), and 0.849 (0.473–0.985) at 3 h, 4.5 h, and 6 h, respectively. However, we could not plot the SROC curve at 24 h due to the limited number of eligible studies (only two).
The level of variability (heterogeneity) among the synthesised studies at each time point was high, mainly due to differences in cut-off values, specimens, and assay methods. We were unable to perform a meta-regression to statistically confirm the cause of heterogeneity because there were too few studies available at each time point. Similarly, sensitivity analysis was not applicable since there were not enough synthesised studies after exclusion of the outlier studies. A funnel plot was also not applicable because of the small number of studies. Lastly, we could not apply GRADE due to the inapplicability of publication bias.

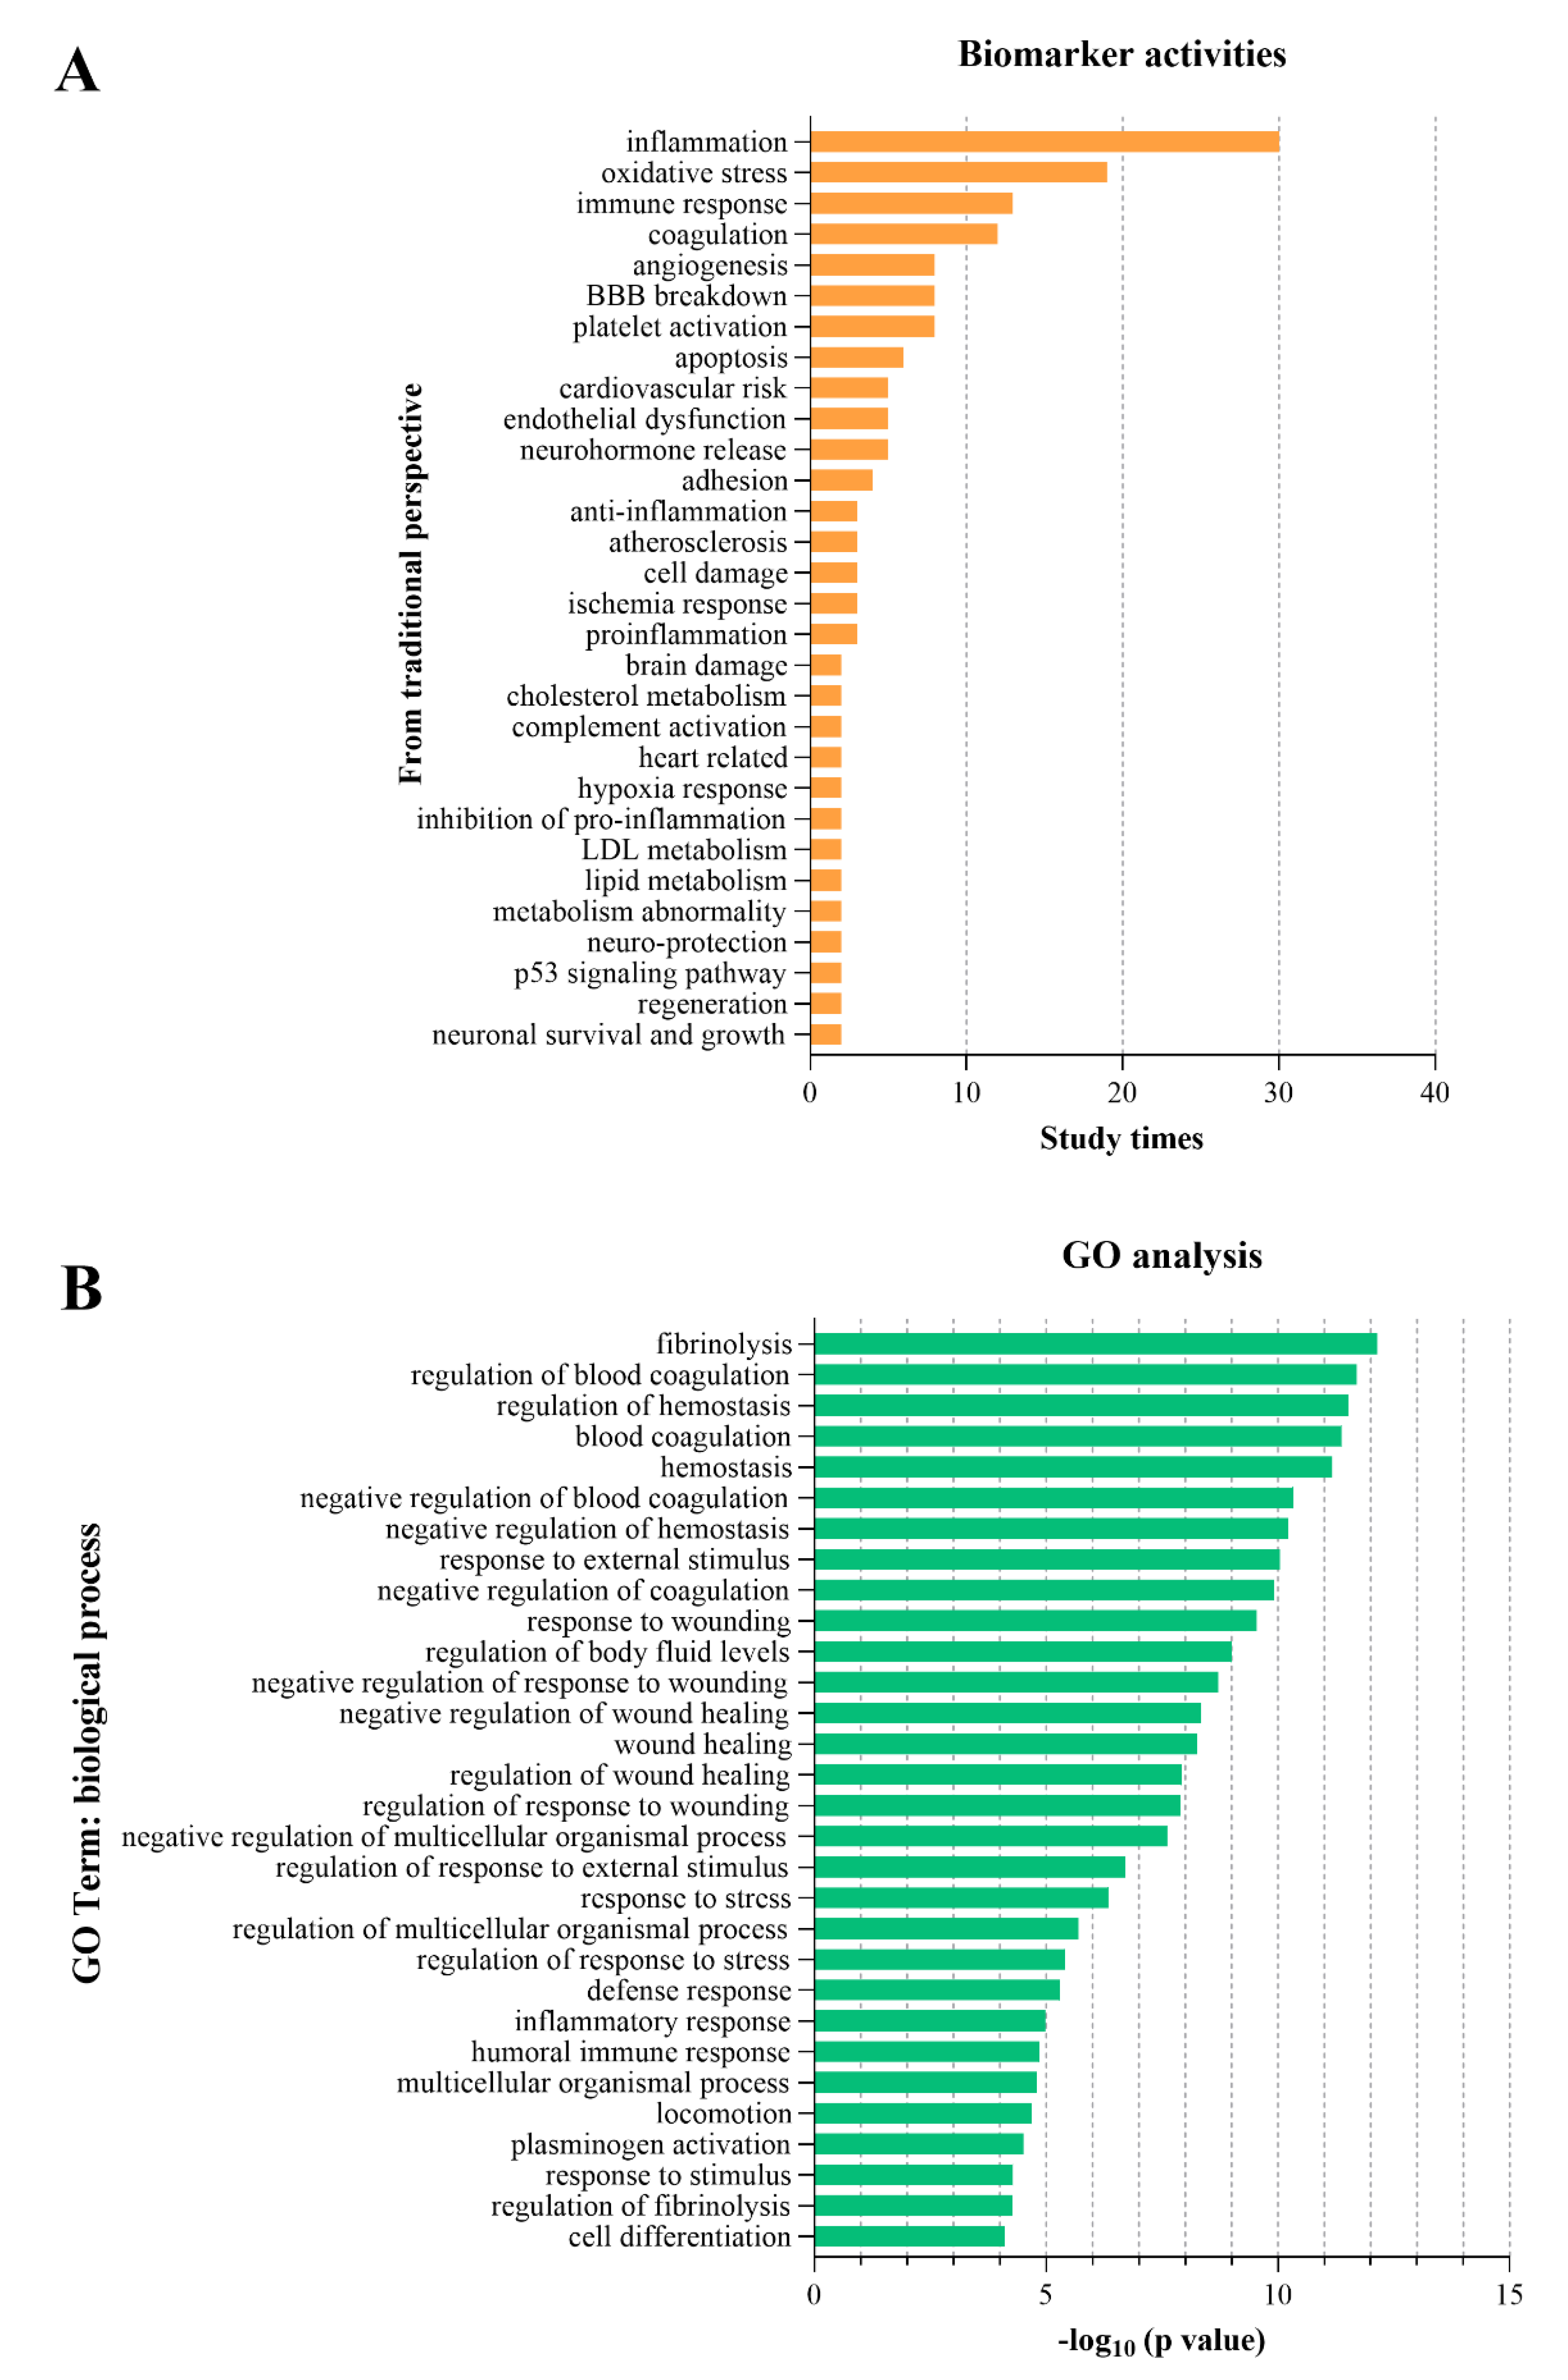
3.4. Biological Processes and GO Analysis

We extracted the BPs of proposed biomarkers reported in conventional non-high-throughput studies. The top five BPs were inflammation, oxidative stress, immune response, coagulation, and angiogenesis (see Figure 6A). We used GO analysis on gene and protein biomarkers from high-throughput omics studies and identified the top five BPs associated with IS, which were fibrinolysis, regulation of blood coagulation, regulation of haemostasis, blood coagulation, and haemostasis (see Figure 6B). The BPs acquired from conventional non-high-throughput studies and high-throughput studies were inconsistent.

4. Discussion

Our study presents a holistic view of early diagnostic circulating biomarkers in IS and summarises all high-throughput omics studies in this field for the first time. We analysed a total of 182 studies and pooled 518 multi-level biomarkers, which included genes, transcripts, proteins, and metabolites. We identified a shortlist of biomarkers with highest sensitivity and specificity, as well as a shortlist of high-throughput multilevel omics biomarkers with low selection bias for further validation. Moreover, we identified the top five vital BPs after IS onset. We also made a preliminary synthesis of the temporal change of GFAP within 24 h after stroke onset for the first time and synthesised summary sensitivity, specificity, and AUCs of GFAP in differentiating HS and IS according to different time points.

4.1. The Shortlist of Biomarkers with Optimal Diagnostic Performance

The shortlist of biomarkers with highest diagnostic performance is identified for further validation (Table 1). Biomarker research for IS remains wide-ranging and lacks depth, with the majority of biomarkers lacking sufficient independent validation cohorts. Although research teams frequently identify new potential biomarkers, the lack of adequate validation hinders their implementation in clinical settings. We list these biomarkers to encourage research teams to participate in their validation, improving their dependability and reproducibility. For example, as listed in Table 1, only three studies have investigated the circulating level of glycogen phosphorylase isoenzyme BB (GPBB) in the early stages of IS and two studies did not provide sensitivity and specificity. Therefore, rigorous validation is needed to evaluate the true value of these biomarkers.

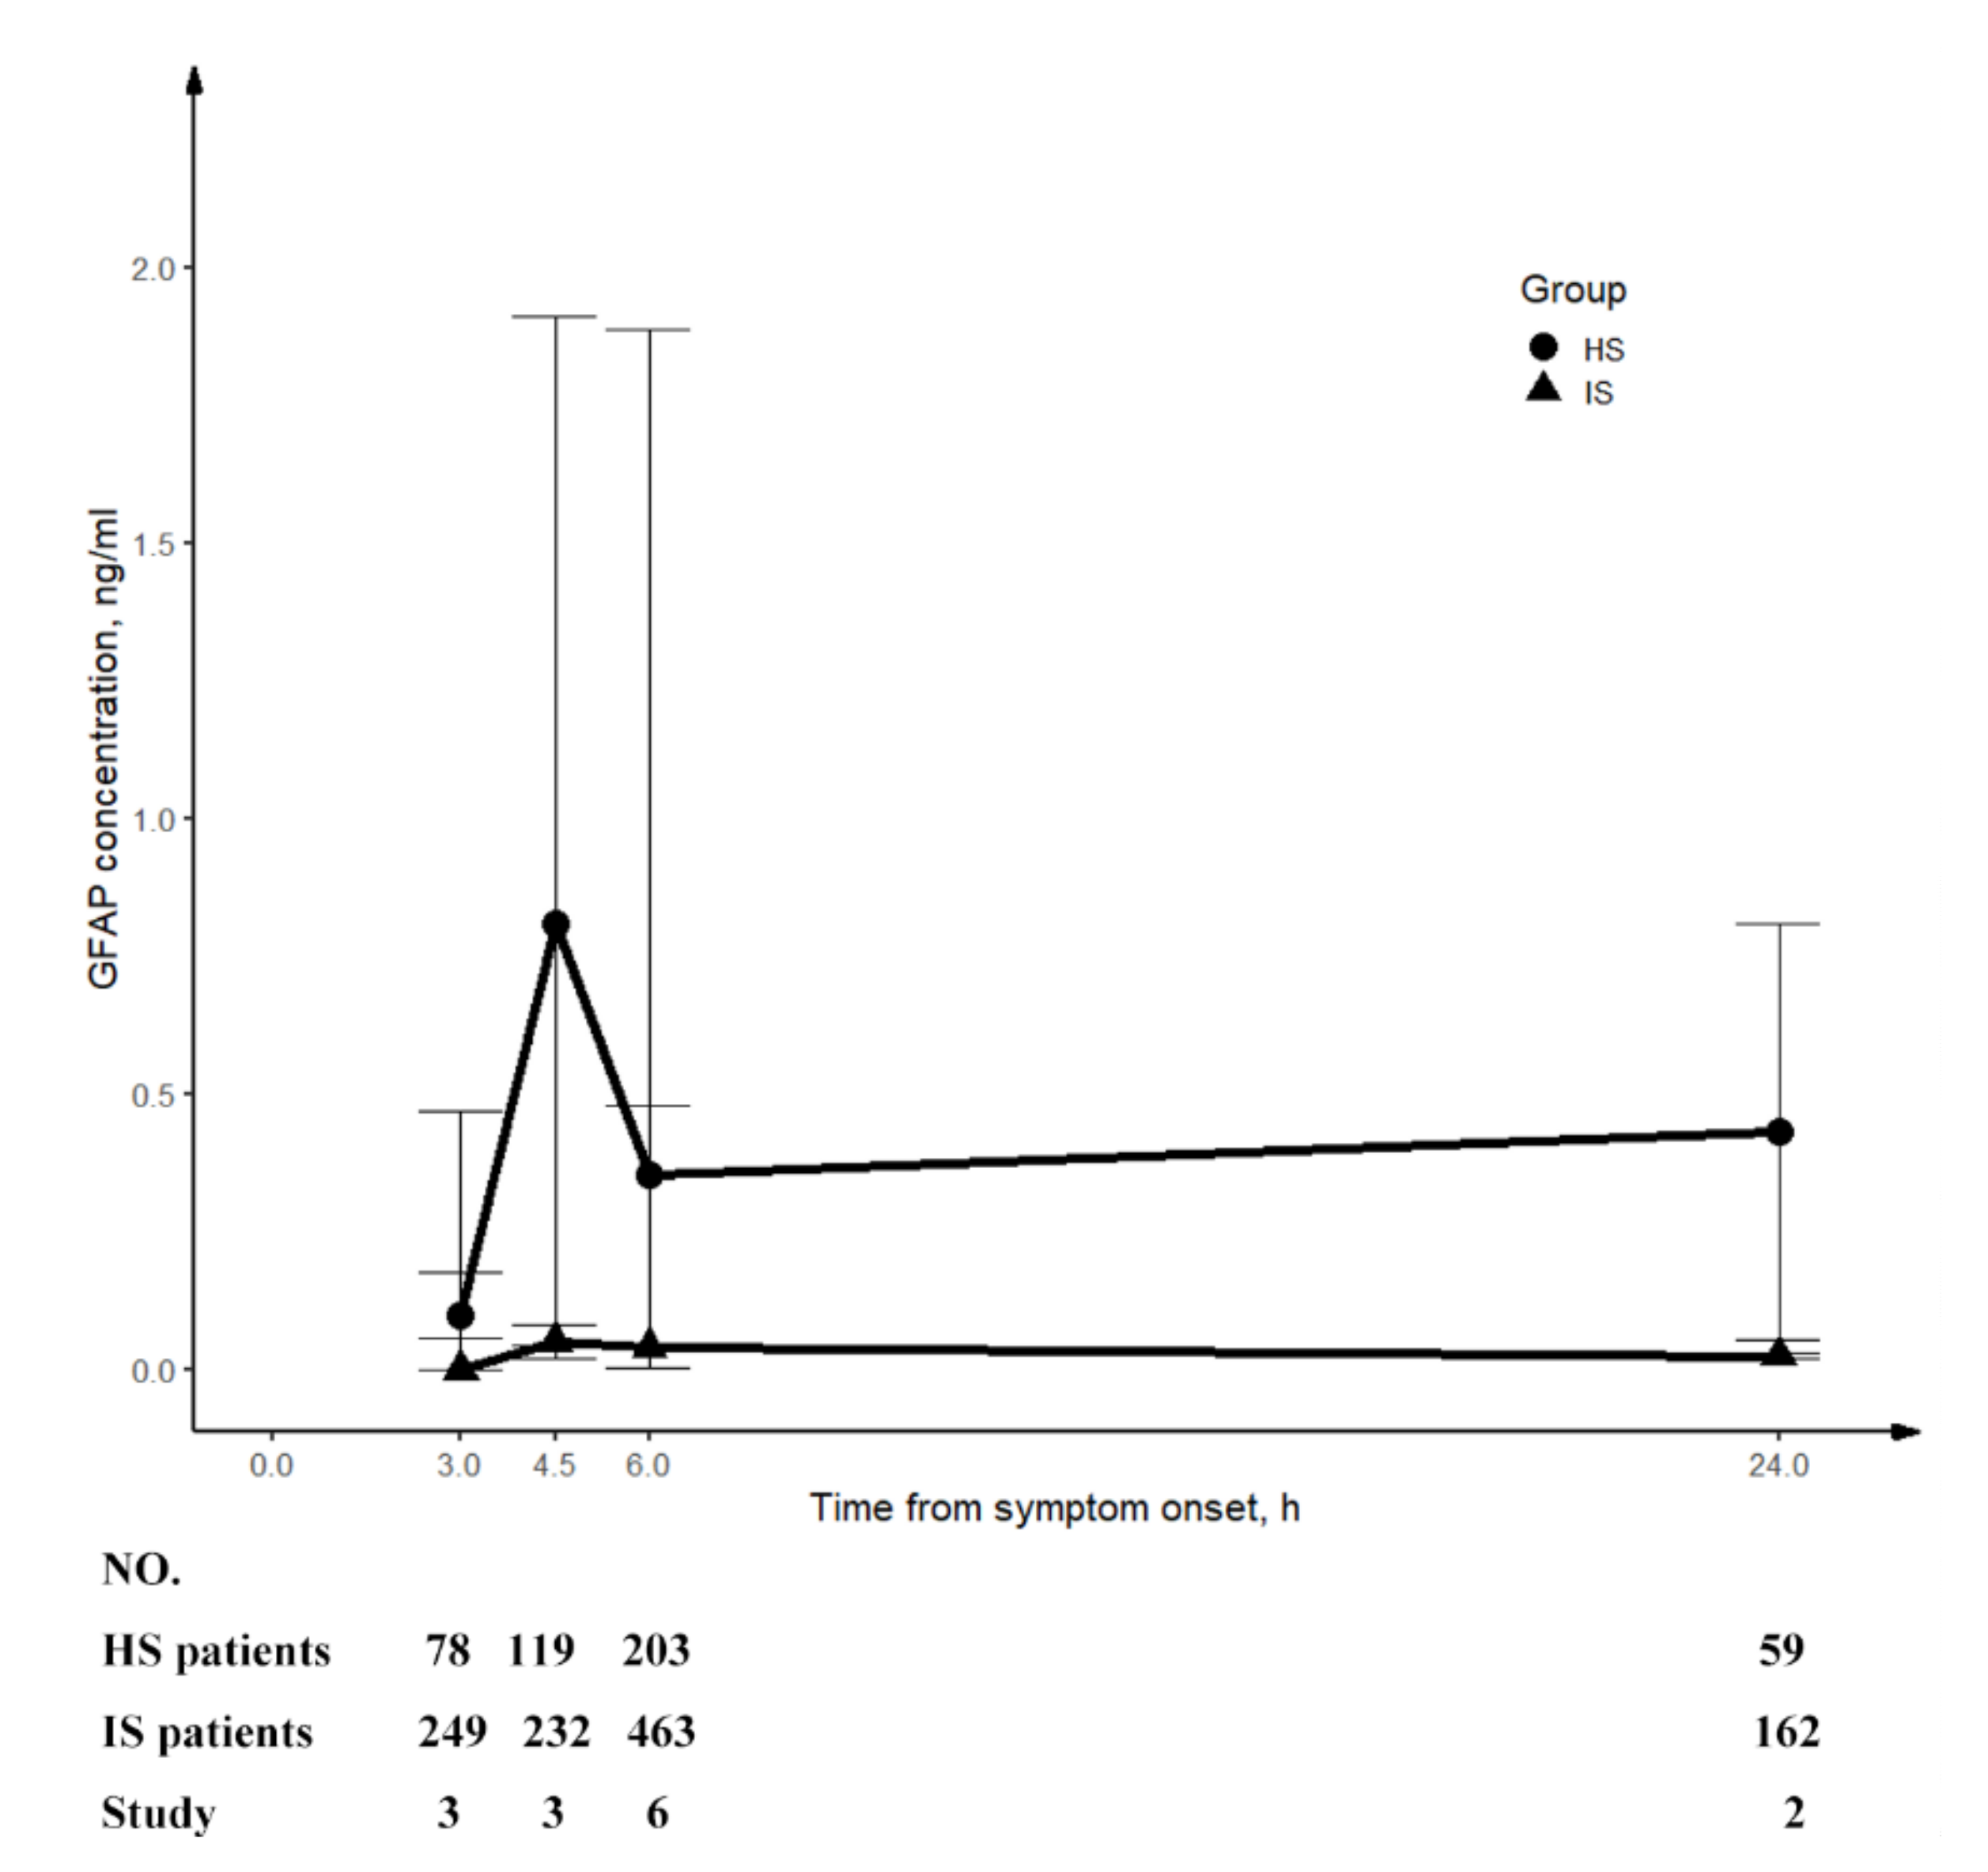
4.2. The Synthesis of GFAP

GFAP is an intracellular class-III intermediate filament that is mainly expressed in the soma and end-feet of astrocytes throughout the brain [49]. After stroke onset, the blood–brain barrier (BBB) is disrupted, leading to the release of GFAP into the bloodstream [49]. Our tentative synthesis of GFAP circulating levels reveals that patients with HS have significantly higher levels of GFAP than those with IS all through the first 24 h. This difference may be due to the earlier disruption of BBB in patients with HS compared to those with IS. Our diagnostic meta-analysis of GFAP indicates that its diagnostic ability within 4.5 h is the best. However, this evidence of GFAP is inadequate for immediate clinical application. Nevertheless, GFAP could serve as an independent or complementary test for excluding HS from intravenous thrombolysis treatment, especially when CT is not routinely available [50]. More evidence is required to evaluate GFAP’s performance in differentiating IS from SM within 4.5 h time window. GFAP could also be a promising panel member when combined with other biomarkers, such as autoantibodies to NR2A/2B subunit of N-methyl-D-aspartate receptor (Abs to NR2), which achieved a sensitivity and specificity of 94% and 91% for differentiating IS from HS [45]. Our finding also suggests that the diagnostic performance of GFAP varies among different time points, indicating the importance of time points in evaluating the diagnostic capability of biomarkers.

4.3. High-Throughput Omics Studies

High-throughput omics studies are a promising approach to identifying stroke biomarkers, generating substantial data and information at various molecule levels [16]. In this regard, we systematically pooled these studies and the results are presented in Supplementary Table S4. We established a workflow for reference, starting with high-throughput methods to test gene expression/RNAs, proteins, or metabolites in the discovery stage. Differential molecules were then identified, and advanced methods such as machine learning/deep learning were applied to reduce the data dimension to a small number of molecules [43,51]. In the validation stage, shortlisted molecules were replicated/validated in a second or third independent cohort. Biomarkers obtained in this way had low selection bias and were often unimaginable from a conventional point of view. The cost of these studies was generally high, but they could provide new opportunities for the diagnosis and management of IS patients. To maximise the use of these findings, we pooled 79 proteins, 103 genes, 97 metabolites, and 41 RNAs omics biomarkers, which are listed in Supplementary List S5. This list of biomarkers could serve as a platform for future targeted omics studies, contributing to a better understanding of IS pathophysiology.
The integration of multi-omics studies will uncover comprehensive interaction networks between multiple molecular levels and provide a deeper insight into stroke pathophysiology and biomarker discovery [16]. Among the included omics studies, there was one multi-omics study that combined transcriptomics and proteomics together [52]. Moreover, advanced AI algorithms for integration analysis of multi-omics data are increasingly maturing. For instance, Multi-Omics Graph cOnvolutional NETworks (MOGONET), which allowed the joint exploration of omics-specific learning by graph convolutional networks and cross-omics correlation learning by view correlation discovery network, could identify more significant biomarkers from multiple omics data types [53]. Bringing together, understandings of IS will be moved forwards through emerging high techniques.

4.4. Pivotal Biological Processes

A thorough understanding of the pathophysiology of IS is essential for its optimal management [16]. In acute IS, the sudden decrease in cerebral blood flow initiates a series of cascade reactions and processes [54], leading to the alteration in thousands of molecules. Some of these molecules may serve as useful diagnostic biomarkers of IS [16]. Conversely, the reported diagnostic biomarkers might reveal the underlying BPs of IS. To identify the possible BPs implicated by these biomarkers, we conducted a GO enrichment analysis. This is the first systematic review of stroke biomarkers using GO analysis. We identified the top five enriched BP, including fibrinolysis, regulation of blood coagulation, regulation of haemostasis, blood coagulation, and haemostasis. These processes are consistent with our basic understanding of stroke pathology, confirming that they are critical pathophysiological processes that should be given greater attention when investigating diagnostic biomarkers and therapeutic targets. For instance, the commonly used alteplase for intravenous thrombolysis is a recombinant form of tissue plasminogen activator (t-PA) that mimics the endogenous t-PA involved in the natural fibrinolysis process [1]. Therefore, we speculate that the key diagnostic molecules of IS might exist in these processes.

4.5. Compare with Previous Related Studies

Previous systematic reviews on circulating diagnostic biomarkers of IS just assessed single biomarkers or single levels of biomarkers [11,12,13,14,15]. By contrast, we gathered genes, RNAs, proteins, and metabolite biomarkers together. There was a very recent systematic review which performed a meta-analysis for 25 protein biomarkers of IS based on their concentration [12]. However, synthesised concentration could not reveal the diagnostic performance and provide recommendations on clinical translation. Similarly, we also acquired a list of frequently studied protein biomarkers (Figure 2B) with reported concentrations that could be synthesised for conventional meta-analysis. However, we paid more attention to compare or synthesise diagnostic accuracy to find potential candidates. There were two previous diagnostic meta-analyses of GFAP, which mixed synthesised sensitivity and specificity of all time points together [55,56]. The difference was that our study distinguished multiple time points, as the circulating level of GFAP underwent obvious perturbation following time after stroke onset, which affected diagnostic performance substantially.

4.6. The Current Status and Recommendations for Future Research

Decades of research on hundreds of biomarkers for the early assessment of IS have not led to any translation, which might be due to the following flaws. Firstly, regarding study design, only half of the studies recruited consecutive patients prospectively. The most commonly used comparative group was healthy controls, which did not accurately reflect the clinical context. Only 9.3% of studies used a SM group, which is the most meaningful and challenging comparative group, even when MRI was available. Moreover, there were inconsistencies in settings, reference standards, sampling time points, specimens, and assays. A second issue was the small sample sizes in many studies, with 50% enrolling fewer than 100 participants. These sample sizes were too small to draw any convincing conclusions about the utility of the biomarker. The third concern was the challenge of comparing the diagnostic performance of the proposed biomarkers. Almost half (46.7%) of the studies only reported the concentration of biomarkers but without reporting sensitivity, specificity, or AUC. Most proposed biomarkers (89%) were only reported once, making comparisons impossible. There were indeed a few biomarkers that were reported more than once, and with reporting sensitivity and specificity, but they were measured at different time points, resulting in unavailable synthesis. Consequently, only the studies of GFAP was found to be available for synthesis, surprisingly at four time points: 3 h, 4.5 h, 12 h, and 24 h.
In future research, we recommend using prospective study designs, enrolling SM groups, establishing validation cohorts, and paying attention to dynamic changes in circulating biomarkers, with reporting items consistent with the START statement [57]. When exploring new biomarkers, studies should simultaneously validate or compare them with previously reported optimal biomarkers, enabling data synthesis and comparison to identify highly useful candidates. Researchers should aim to increase sample size through multi-centre cooperation and identify biomarkers for IS versus HS, SM, TIA, and healthy and patient controls. If blood biomarkers are to be used in accelerating diagnosis for reperfusion therapies, sampling time focused within 6 h of symptom onset would be more applicable. Furthermore, it is preferable to select molecules as candidate biomarkers that exhibit significant changes within the time window and have sufficient blood concentration to be detected.

5. Limitations

Firstly, we did not exclude studies with subarachnoid haemorrhage, as these few studies had a minor impact on the overall analysis. Secondly, we grouped all types of controls into a single category, including healthy controls, vascular risk factor controls, non-neurological disease controls, and other neurological disease controls. Thirdly, most studies included were not standardised diagnostic test studies, but we included them to gain an overview of all the potential biomarkers reported. Fourthly, considering the small quantity and great variability in the studies included in our diagnostic meta-analysis, it appears premature to perform a meta-analysis of GFAP, and more research is necessary to establish its actual efficacy in the future. Fifthly, although we conducted a careful quality assessment of the article, it is still possible that it may be influenced by some potential errors present in the original studies. These factors are beyond our control and cannot be addressed in this research.

6. Conclusions

The findings of this study have established a summarised platform for the future development of diagnostic biomarkers for IS. This platform includes a list of biomarkers with highest reported diagnostic performance, a list of unbiased omics biomarkers, potential BPs in which diagnostic biomarkers would most likely to be found, as well as an exploration of the issues existed in previous studies and future research directions. GFAP would be a potential biomarker for intravenous thrombolysis in patients with IS within 4.5 h from symptom onset at pre-hospital settings. These findings provide a foundation for future research that could have a significant impact on the augmentation of IS management.

Supplementary Materials

The following supporting information can be downloaded at: https://www.mdpi.com/article/10.3390/ijms241813821/s1.

Author Contributions

T.H.R. provided overall guidance and the design and acted as the third reviewer; Q.L. participated in the design and performed the literature search, screening, inclusion, data extraction, quality assessment, data analysis, and manuscript drafting; as the number of included studies were large, three team members, L.Z., Y.J. and S.W.T., jointly acted as the second reviewer for screening, inclusion, data extraction and quality assessment; C.L.C. and Y.Z., as statisticians, assisted in data analysis; J.W.K.H. and X.Z. provided suggestions and checks on bioinformatic analysis. All authors have read and agreed to the published version of the manuscript.

Funding

This research received no external funding.

Acknowledgments

We thank Sherry Ng, our librarian, for her invaluable assistance and guidance in shaping the literature search strategy. Publication made possible in part by support from the HKU Libraries Open Access Author Fund sponsored by the HKU Libraries.

Conflicts of Interest

The authors declare no conflict of interest.

References

  1. Campbell, B.C.V.; De Silva, D.A.; Macleod, M.R.; Coutts, S.B.; Schwamm, L.H.; Davis, S.M.; Donnan, G.A. Ischaemic stroke. Nat. Rev. Dis. Primers 2019, 5, 70. [Google Scholar] [CrossRef] [PubMed]
  2. Collaborators, G.B.D.S. Global, regional, and national burden of stroke, 1990-2016: A systematic analysis for the Global Burden of Disease Study 2016. Lancet Neurol. 2019, 18, 439–458. [Google Scholar] [CrossRef]
  3. Powers, W.J.; Rabinstein, A.A.; Ackerson, T.; Adeoye, O.M.; Bambakidis, N.C.; Becker, K.; Biller, J.; Brown, M.; Demaerschalk, B.M.; Hoh, B.; et al. 2018 Guidelines for the Early Management of Patients With Acute Ischemic Stroke: A Guideline for Healthcare Professionals From the American Heart Association/American Stroke Association. Stroke 2018, 49, e46–e110. [Google Scholar] [CrossRef] [PubMed]
  4. Tong, E.; Hou, Q.; Fiebach, J.B.; Wintermark, M. The role of imaging in acute ischemic stroke. Neurosurg. Focus. 2014, 36, E3. [Google Scholar] [CrossRef] [PubMed]
  5. Asci Erkocyigit, B.; Ozufuklar, O.; Yardim, A.; Guler Celik, E.; Timur, S. Biomarker Detection in Early Diagnosis of Cancer: Recent Achievements in Point-of-Care Devices Based on Paper Microfluidics. Biosensors 2023, 13, 387. [Google Scholar] [CrossRef] [PubMed]
  6. Fang, L.; Yang, L.; Han, M.; Xu, H.; Ding, W.; Dong, X. CRISPR-cas technology: A key approach for SARS-CoV-2 detection. Front. Bioeng. Biotechnol. 2023, 11, 1158672. [Google Scholar] [CrossRef] [PubMed]
  7. Cheng, X.; Pu, X.; Jun, P.; Zhu, X.; Zhu, D.; Chen, M. Rapid and quantitative detection of C-reactive protein using quantum dots and immunochromatographic test strips. Int. J. Nanomed. 2014, 9, 5619–5626. [Google Scholar] [CrossRef]
  8. Park, H.D. Current Status of Clinical Application of Point-of-Care Testing. Arch. Pathol. Lab. Med. 2021, 145, 168–175. [Google Scholar] [CrossRef]
  9. Goyder, C.; Tan, P.S.; Verbakel, J.; Ananthakumar, T.; Lee, J.J.; Hayward, G.; Turner, P.J.; Van Den Bruel, A. Impact of point-of-care panel tests in ambulatory care: A systematic review and meta-analysis. BMJ Open 2020, 10, e032132. [Google Scholar] [CrossRef]
  10. Cooke, J.; Butler, C.; Hopstaken, R.; Dryden, M.S.; McNulty, C.; Hurding, S.; Moore, M.; Livermore, D.M. Narrative review of primary care point-of-care testing (POCT) and antibacterial use in respiratory tract infection (RTI). BMJ Open Respir. Res. 2015, 2, e000086. [Google Scholar] [CrossRef]
  11. Ramos-Fernandez, M.; Bellolio, M.F.; Stead, L.G. Matrix metalloproteinase-9 as a marker for acute ischemic stroke: A systematic review. J. Stroke Cerebrovasc. Dis. 2011, 20, 47–54. [Google Scholar] [CrossRef] [PubMed]
  12. Misra, S.; Montaner, J.; Ramiro, L.; Arora, R.; Talwar, P.; Nath, M.; Kumar, A.; Kumar, P.; Pandit, A.K.; Mohania, D.; et al. Blood biomarkers for the diagnosis and differentiation of stroke: A systematic review and meta-analysis. Int. J. Stroke 2020, 15, 704–721. [Google Scholar] [CrossRef] [PubMed]
  13. Zhao, J.; Wang, Q.; Zhu, R.; Yang, J. Circulating Non-coding RNAs as Potential Biomarkers for Ischemic Stroke: A Systematic Review. J. Mol. Neurosci. 2022, 72, 1572–1585. [Google Scholar] [CrossRef] [PubMed]
  14. Ke, C.; Pan, C.W.; Zhang, Y.; Zhu, X.; Zhang, Y. Metabolomics facilitates the discovery of metabolic biomarkers and pathways for ischemic stroke: A systematic review. Metabolomics 2019, 15, 152. [Google Scholar] [CrossRef] [PubMed]
  15. Baez, S.C.; Garcia Del Barco, D.; Hardy-Sosa, A.; Guillen Nieto, G.; Bringas-Vega, M.L.; Llibre-Guerra, J.J.; Valdes-Sosa, P. Scalable Bio Marker Combinations for Early Stroke Diagnosis: A Systematic Review. Front. Neurol. 2021, 12, 638693. [Google Scholar] [CrossRef] [PubMed]
  16. Montaner, J.; Ramiro, L.; Simats, A.; Tiedt, S.; Makris, K.; Jickling, G.C.; Debette, S.; Sanchez, J.C.; Bustamante, A. Multilevel omics for the discovery of biomarkers and therapeutic targets for stroke. Nat. Rev. Neurol. 2020, 16, 247–264. [Google Scholar] [CrossRef]
  17. Powers, W.J.; Rabinstein, A.A.; Ackerson, T.; Adeoye, O.M.; Bambakidis, N.C.; Becker, K.; Biller, J.; Brown, M.; Demaerschalk, B.M.; Hoh, B.; et al. Guidelines for the Early Management of Patients With Acute Ischemic Stroke: 2019 Update to the 2018 Guidelines for the Early Management of Acute Ischemic Stroke: A Guideline for Healthcare Professionals From the American Heart Association/American Stroke Association. Stroke 2019, 50, e344–e418. [Google Scholar] [CrossRef]
  18. Page, M.J.; Moher, D.; Bossuyt, P.M.; Boutron, I.; Hoffmann, T.C.; Mulrow, C.D.; Shamseer, L.; Tetzlaff, J.M.; Akl, E.A.; Brennan, S.E.; et al. PRISMA 2020 explanation and elaboration: Updated guidance and exemplars for reporting systematic reviews. BMJ 2021, 372, n160. [Google Scholar] [CrossRef]
  19. McInnes, M.D.F.; Moher, D.; Thombs, B.D.; McGrath, T.A.; Bossuyt, P.M.; Clifford, T.; Cohen, J.F.; Deeks, J.J.; Gatsonis, C.; the PRISMA-DTA Group; et al. Preferred Reporting Items for a Systematic Review and Meta-analysis of Diagnostic Test Accuracy Studies: The PRISMA-DTA Statement. JAMA 2018, 319, 388–396. [Google Scholar] [CrossRef]
  20. Whiting, P.F.; Rutjes, A.W.S.; Westwood, M.E.; Mallett, S.; Deeks, J.J.; Reitsma, J.B.; Leeflang, M.M.G.; Sterne, J.A.C.; Bossuyt, P.M.M. QUADAS-2 a revised tool for the quality assessment of diagnostic accuracy studies. Ann. Intern. Med. 2011, 155, 529–536. [Google Scholar] [CrossRef]
  21. Guo, J.; Riebler, A. meta4diag: Bayesian Bivariate Meta-Analysis of Diagnostic Test Studies for Routine Practice. arXiv 2018, arXiv:1512.06220. [Google Scholar] [CrossRef]
  22. Shin, J.J.; Zurakowski, D. Null Hypotheses, Interval Estimation, and Bayesian Analysis. Otolaryngol. Head. Neck Surg. 2017, 157, 919–920. [Google Scholar] [CrossRef] [PubMed]
  23. Granholm, A.; Alhazzani, W.; Moller, M.H. Use of the GRADE approach in systematic reviews and guidelines. Br. J. Anaesth. 2019, 123, 554–559. [Google Scholar] [CrossRef]
  24. Ashburner, M.; Ball, C.A.; Blake, J.A.; Botstein, D.; Butler, H.; Cherry, J.M.; Davis, A.P.; Dolinski, K.; Dwight, S.S.; Eppig, J.T.; et al. Gene ontology: Tool for the unification of biology. The Gene Ontology Consortium. Nat. Genet. 2000, 25, 25–29. [Google Scholar] [CrossRef] [PubMed]
  25. Gene Ontology, C.; Aleksander, S.A.; Balhoff, J.; Carbon, S.; Cherry, J.M.; Drabkin, H.J.; Ebert, D.; Feuermann, M.; Gaudet, P.; Harris, N.L.; et al. The Gene Ontology knowledgebase in 2023. Genetics 2023, 224, iyad031. [Google Scholar] [CrossRef]
  26. Raudvere, U.; Kolberg, L.; Kuzmin, I.; Arak, T.; Adler, P.; Peterson, H.; Vilo, J. g:Profiler: A web server for functional enrichment analysis and conversions of gene lists (2019 update). Nucleic Acids Res. 2019, 47, W191–W198. [Google Scholar] [CrossRef] [PubMed]
  27. Dambinova, S.A.; Khounteev, G.A.; Izykenova, G.A.; Zavolokov, I.G.; Ilyukhina, A.Y.; Skoromets, A.A. Blood test detecting autoantibodies to N-methyl-D-aspartate neuroreceptors for evaluation of patients with transient ischemic attack and stroke. Clin. Chem. 2003, 49, 1752–1762. [Google Scholar] [CrossRef] [PubMed]
  28. Algin, A.; Erdogan, M.O.; Aydin, I.; Poyraz, M.K.; Sirik, M. Clinical usefulness of brain-derived neurotrophic factor and visinin-like protein-1 in early diagnostic tests for acute stroke. Am. J. Emerg. Med. 2019, 37, 2051–2054. [Google Scholar] [CrossRef]
  29. Ahn, J.H.; Choi, S.C.; Lee, W.G.; Jung, Y.S. The usefulness of albumin-adjusted ischemia-modified albumin index as early detecting marker for ischemic stroke. Neurol. Sci. 2011, 32, 133–138. [Google Scholar] [CrossRef]
  30. Dambinova, S.A.; Bettermann, K.; Glynn, T.; Tews, M.; Olson, D.; Weissman, J.D.; Sowell, R.L. Diagnostic potential of the NMDA receptor peptide assay for acute ischemic stroke. PLoS ONE 2012, 7, e42362. [Google Scholar] [CrossRef]
  31. Park, K.Y.; Ay, I.; Avery, R.; Caceres, J.A.; Siket, M.S.; Pontes-Neto, O.M.; Zheng, H.; Rost, N.S.; Furie, K.L.; Sorensen, A.G.; et al. New biomarker for acute ischaemic stroke: Plasma glycogen phosphorylase isoenzyme BB. J. Neurol. Neurosurg. Psychiatry 2018, 89, 404–409. [Google Scholar] [CrossRef] [PubMed]
  32. AlGawwam, G.; Shake, M.E. Evaluation of glycogen phosphorylase bb (GPBB) level in serum as marker in diagnosis of acute ischemic stroke. Indian J. Forensic Med. Toxicol. 2021, 15, 1603–1608. [Google Scholar]
  33. Sharma, R.; Gowda, H.; Chavan, S.; Advani, J.; Kelkar, D.; Kumar, G.S.; Bhattacharjee, M.; Chaerkady, R.; Prasad, T.S.; Pandey, A.; et al. Proteomic Signature of Endothelial Dysfunction Identified in the Serum of Acute Ischemic Stroke Patients by the iTRAQ-Based LC-MS Approach. J. Proteome Res. 2015, 14, 2466–2479. [Google Scholar] [CrossRef] [PubMed]
  34. Stejskal, D.; Sporova, L.; Svestak, M.; Karpisek, M. Determination of serum visinin like protein-1 and its potential for the diagnosis of brain injury due to the stroke: A pilot study. Biomed. Pap. Med. Fac. Univ. Palacky. Olomouc Czech Repub. 2011, 155, 263–268. [Google Scholar] [CrossRef]
  35. Laterza, O.F.; Modur, V.R.; Crimmins, D.L.; Olander, J.V.; Landt, Y.; Lee, J.M.; Ladenson, J.H. Identification of novel brain biomarkers. Clin. Chem. 2006, 52, 1713–1721. [Google Scholar] [CrossRef] [PubMed]
  36. Yang, Z.B.; Li, T.B.; Zhang, Z.; Ren, K.D.; Zheng, Z.F.; Peng, J.; Luo, X.J. The Diagnostic Value of Circulating Brain-specific MicroRNAs for Ischemic Stroke. Intern. Med. 2016, 55, 1279–1286. [Google Scholar] [CrossRef] [PubMed]
  37. Zhou, X.; Qi, L. miR-124 Is Downregulated in Serum of Acute Cerebral Infarct Patients and Shows Diagnostic and Prognostic Value. Clin. Appl. Thromb. Hemost. 2021, 27, 10760296211035446. [Google Scholar] [CrossRef]
  38. Ji, Q.; Ji, Y.; Peng, J.; Zhou, X.; Chen, X.; Zhao, H.; Xu, T.; Chen, L.; Xu, Y. Increased Brain-Specific MiR-9 and MiR-124 in the Serum Exosomes of Acute Ischemic Stroke Patients. PLoS ONE 2016, 11, e0163645. [Google Scholar] [CrossRef]
  39. Liu, Y.; Zhang, J.; Han, R.; Liu, H.; Sun, D.; Liu, X. Downregulation of serum brain specific microRNA is associated with inflammation and infarct volume in acute ischemic stroke. J. Clin. Neurosci. 2015, 22, 291–295. [Google Scholar] [CrossRef]
  40. Zhao, X.; Yu, Y.; Xu, W.; Dong, L.; Wang, Y.; Gao, B.; Li, G.; Zhang, W. Apolipoprotein A1-Unique Peptide as a Diagnostic Biomarker for Acute Ischemic Stroke. Int. J. Mol. Sci. 2016, 17, 458. [Google Scholar] [CrossRef]
  41. Ewida, H.A.; Zayed, R.K.; Darwish, H.A.; Shaheen, A.A. Circulating lncRNAs HIF1A-AS2 and LINLK-A: Role and Relation to Hypoxia-Inducible Factor-1alpha in Cerebral Stroke Patients. Mol. Neurobiol. 2021, 58, 4564–4574. [Google Scholar] [CrossRef] [PubMed]
  42. O’Connell, G.C.; Chantler, P.D.; Barr, T.L. Stroke-associated pattern of gene expression previously identified by machine-learning is diagnostically robust in an independent patient population. Genom. Data 2017, 14, 47–52. [Google Scholar] [CrossRef] [PubMed]
  43. O’Connell, G.C.; Petrone, A.B.; Treadway, M.B.; Tennant, C.S.; Lucke-Wold, N.; Chantler, P.D.; Barr, T.L. Machine-learning approach identifies a pattern of gene expression in peripheral blood that can accurately detect ischaemic stroke. NPJ Genom. Med. 2016, 1, 16038. [Google Scholar] [CrossRef] [PubMed]
  44. Reynolds, M.A.; Kirchick, H.J.; Dahlen, J.R.; Anderberg, J.M.; McPherson, P.H.; Nakamura, K.K.; Laskowitz, D.T.; Valkirs, G.E.; Buechler, K.F. Early Biomarkers of Stroke. Clin. Chem. 2003, 49, 1733–1739. [Google Scholar] [CrossRef] [PubMed]
  45. Stanca, D.M.; Marginean, I.C.; Soritau, O.; Dragos, C.; Marginean, M.; Muresanu, D.F.; Vester, J.C.; Rafila, A. GFAP and antibodies against NMDA receptor subunit NR2 as biomarkers for acute cerebrovascular diseases. J. Cell Mol. Med. 2015, 19, 2253–2261. [Google Scholar] [CrossRef] [PubMed]
  46. O’Connell, G.C.; Stafford, P.; Walsh, K.B.; Adeoye, O.; Barr, T.L. High-Throughput Profiling of Circulating Antibody Signatures for Stroke Diagnosis Using Small Volumes of Whole Blood. Neurotherapeutics 2019, 16, 868–877. [Google Scholar] [CrossRef] [PubMed]
  47. Llombart, V.; Garcia-Berrocoso, T.; Bustamante, A.; Giralt, D.; Rodriguez-Luna, D.; Muchada, M.; Penalba, A.; Boada, C.; Hernandez-Guillamon, M.; Montaner, J. Plasmatic retinol-binding protein 4 and glial fibrillary acidic protein as biomarkers to differentiate ischemic stroke and intracerebral hemorrhage. J. Neurochem. 2016, 136, 416–424. [Google Scholar] [CrossRef]
  48. Luger, S.; Witsch, J.; Dietz, A.; Hamann, G.F.; Minnerup, J.; Schneider, H.; Sitzer, M.; Wartenberg, K.E.; Niessner, M.; Foerch, C.; et al. Glial Fibrillary Acidic Protein Serum Levels Distinguish between Intracerebral Hemorrhage and Cerebral Ischemia in the Early Phase of Stroke. Clin. Chem. 2017, 63, 377–385. [Google Scholar] [CrossRef]
  49. Abdelhak, A.; Foschi, M.; Abu-Rumeileh, S.; Yue, J.K.; D’Anna, L.; Huss, A.; Oeckl, P.; Ludolph, A.C.; Kuhle, J.; Petzold, A.; et al. Blood GFAP as an emerging biomarker in brain and spinal cord disorders. Nat. Rev. Neurol. 2022, 18, 158–172. [Google Scholar] [CrossRef]
  50. Jaeger, H.S.; Tranberg, D.; Larsen, K.; Valentin, J.B.; Blauenfeldt, R.A.; Luger, S.; Bache, K.G.; Gude, M.F. Diagnostic performance of Glial Fibrillary Acidic Protein and Prehospital Stroke Scale for identification of stroke and stroke subtypes in an unselected patient cohort with symptom onset < 4.5 h. Scand. J. Trauma. Resusc. Emerg. Med. 2023, 31, 1. [Google Scholar] [CrossRef]
  51. Tiedt, S.; Brandmaier, S.; Kollmeier, H.; Duering, M.; Artati, A.; Adamski, J.; Klein, M.; Liebig, T.; Holdt, L.M.; Teupser, D.; et al. Circulating Metabolites Differentiate Acute Ischemic Stroke from Stroke Mimics. Ann. Neurol. 2020, 88, 736–746. [Google Scholar] [CrossRef] [PubMed]
  52. Simats, A.; Ramiro, L.; Garcia-Berrocoso, T.; Brianso, F.; Gonzalo, R.; Martin, L.; Sabe, A.; Gill, N.; Penalba, A.; Colome, N.; et al. A Mouse Brain-based Multi-omics Integrative Approach Reveals Potential Blood Biomarkers for Ischemic Stroke. Mol. Cell Proteom. 2020, 19, 1921–1936. [Google Scholar] [CrossRef]
  53. Wang, T.X.; Shao, W.; Huang, Z.; Tang, H.X.; Zhang, J.; Ding, Z.M.; Huang, K. MOGONET integrates multi-omics data using graph convolutional networks allowing patient classification and biomarker identification. Nat. Commun. 2021, 12, 3445. [Google Scholar] [CrossRef] [PubMed]
  54. Dirnagl, U.; Iadecola, C.; Moskowitz, M.A. Pathobiology of ischaemic stroke: An integrated view. Trends Neurosci. 1999, 22, 391–397. [Google Scholar] [CrossRef]
  55. Perry, L.A.; Lucarelli, T.; Penny-Dimri, J.C.; McInnes, M.D.; Mondello, S.; Bustamante, A.; Montaner, J.; Foerch, C.; Kwan, P.; Davis, S.; et al. Glial fibrillary acidic protein for the early diagnosis of intracerebral hemorrhage: Systematic review and meta-analysis of diagnostic test accuracy. Int. J. Stroke 2019, 14, 390–399. [Google Scholar] [CrossRef] [PubMed]
  56. Kumar, A.; Misra, S.; Yadav, A.K.; Sagar, R.; Verma, B.; Grover, A.; Prasad, K. Role of glial fibrillary acidic protein as a biomarker in differentiating intracerebral haemorrhage from ischaemic stroke and stroke mimics: A meta-analysis. Biomarkers 2020, 25, 1–8. [Google Scholar] [CrossRef]
  57. Cohen, J.F.; Korevaar, D.A.; Altman, D.G.; Bruns, D.E.; Gatsonis, C.A.; Hooft, L.; Irwig, L.; Levine, D.; Reitsma, J.B.; de Vet, H.C.; et al. STARD 2015 guidelines for reporting diagnostic accuracy studies: Explanation and elaboration. BMJ Open 2016, 6, e012799. [Google Scholar] [CrossRef]
Figure 1. Flow diagram of search and selection process. IS, ischaemic stroke.
Ijms 24 13821 g001
Figure 2. Venn chart for overlapped common biomarkers of IS versus control, HS, SM, and TIA groups (A) and most frequently studied biomarkers (B). A total of 427 biomarkers were pooled from IS-controls, 135 from IS-HS, 36 from IS-SM, and 15 from IS-TIA comparisons (A). The overlapped 2 common biomarkers were calcium-binding protein B (S100B) and Matrix metalloproteinase-9 (MMP-9). Overall, 16 biomarkers were studied ≥ 4 times among all studies included (B). S100B (n = 18); GFAP, glial fibrillary acidic protein (n = 16); IMA, ischaemia-modified albumin (n = 11); IL-6, interleukin 6 (n = 8); MMP-9, matrix metalloproteinase-9 (n = 8); CRP, C-reactive protein (n = 8); hsCRP, high-sensitive C-reactive protein (n = 7); ICAM-1, intercellular adhesion molecule 1 (n = 5); BNP, natriuretic peptides B (n = 4); NfL, neurofilament light chain (n = 4); NSE, neuron-specific enolase (n = 4); NT-proBNP, NT-pro-natriuretic peptides B (n = 4); TNF-α, tumour necrosis factor α (n = 4); vWF: von Willebrand factor (n = 4). IS, ischaemic stroke; HS, haemorrhagic stroke; SM, stroke mimics; TIA, transient ischaemic attack.
Ijms 24 13821 g002
Figure 3. Temporal change in circulating level of GFAP. The concentration of GFAP (combined median with 95% CI) was plotted. This graph shows that GFAP increased rapidly from 3 h and peaked at 4.5 h from symptom onset and decreased continuously afterwards till 24 h in patients with HS. For patients with IS, GFAP had always been at a lower level than patients with HS. IS, ischaemic stroke; HS, haemorrhagic stroke; GFAP, glial fibrillary acidic protein.
Ijms 24 13821 g003
Figure 4. Summary sensitivity and specificity of GFAP at 3 h (A), 4.5 h (B), 6 h (C) and 24 h (D) in differentiating HS from IS. Summary sensitivity and specificity were 73% (95%CI, 37–94%) and 97% (82–100%) at 3 h; 79% (62–91%) and 95% (83–100%) at 4.5 h; 80% (70–87%) and 92% (81–98%) at 6 h; 71% (46–90%) and 77% (40–97%) at 24 h for differentiating HS from IS, respectively. IS, ischaemic stroke; HS, haemorrhagic stroke; GFAP, glial fibrillary acidic protein.
Ijms 24 13821 g004
Figure 5. SROC of GFAP in differentiating HS from IS at 3 h (A), 4.5 h (B) and 6 h (C). The summary AUCs were 0.945 (95% CI, 0.641–0.999), 0.915 (0.835–0.996), 0.849 (0.473–0.985) at 3 h, 4.5 h, 6 h, respectively. Each circle represents a study, with larger circles indicating larger sample sizes and higher weights. SROC, summary receiver operating characteristic; AUC, area under curve; GFAP, glial fibrillary acidic protein; IS, ischaemic stroke; HS, haemorrhagic stroke.
Ijms 24 13821 g005
Figure 6. Top 30 biological processes reported from a conventional perspective (A) and from perspective of GO analysis of omics biomarkers (B). The top five BPs from conventional perspective were inflammation, oxidative stress, immune response, coagulation, and angiogenesis (A). GO analysis showed the top 5 pivotal BPs of ischaemic stroke from other conditions which were fibrinolysis, regulation of blood coagulation, regulation of haemostasis, blood coagulation, and haemostasis (B). BP: biological processes.
Ijms 24 13821 g006
Table 1. Reported biomarkers with highest sensitivity and specificity for diagnosis of ischaemic stroke in early stage.
BiomarkersStudy IDLevelsSampling TimeSensitivitySpecificityAUCComparison
Groups
Sample SizeBiological
Process
Antibody to NR 2A/2BDambinova 2003 [27]Protein 3 h97%98%0.99IS 1HC 230 +
VC 25 +
ICH 18
304Immune response
BDNFAlgin 2019 [28]Protein4 h100%92%0.983IS 75HC 28103Neuronal survival and growth
IMA indexAhn 2011 [29]Protein6 h95.8%96.4%0.99IS 28SM 2452Ischemia response
NR2 peptideDambinova 2012 [30]Protein 12 h 92.1%96.5%0.92IS 50SM 91 +
VC 48 +
HC 52
241Brain cell damage
GPBBPark 2018 [31]Protein 12 h93%93%0.96IS 172NSC 133305Ischaemia response
Algawwam 2021 [32]Protein24 hN/AN/AN/AIS 40HC 4080
ADAMTS13Sharma 2015 [33]Proteomics 24 h90%98%0.96IS 50HC 3585Blood haemostasis and endothelial function regulation
S100A7Sharma 2015 [33]Proteomics24 h97%91%0.912IS 50HC 3585Blood haemostasis and endothelial function regulation
VILIP-1Stejskal 2011 [34]Protein 3 h100%100%1.0IS 16HC 1733Brain cell damage
Laterza 2006 [35]Protein24 hN/AN/AN/AIS 18HC N/A18
Algin 2019 [28]Protein4 hNo statistical significance IS 75HC 28103
miR-107Yang 2016 [36]Transcript 24 h93.8%92.2%0.97IS 114HC58172Cerebral ischaemic injury
miR-124Zhou 2021 [37]Transcript 24 h 91.67%93.52%0.9527IS 108HC 108216Anti-inflammation
Ji 2016 [38]Transcript 24 hN/AN/A0.69IS 65NSC 66131
Liu 2015 [39]Transcript 24 hN/AN/A0.76IS 31HC 1142
APOA1-UPZhao 2016 [40]Protein 24 h90.3%97.14%0.975IS 168HC 104272Cholesterol metabolism
lncRNAs LINK-AEwida 2021 [41]Transcript 24 h92%94%0.914IS 50HS 2575Angiogenesis
ANTXR2 + STK3 + PDK4 + CD163 + MAL + GRAP +
ID3 + KIF1B +
PLXDC2 + CTSZ
O’Connell 2017 [42]Gene 5 h, 24 h 95.7%95.7%0.997IS 23VC 2346Immune response
O’Connell 2017 [42]Gene 3 h91.3%95.7%0.991IS 23VC 2346
O’Connell 2016 [43]Genomics 5.3 h97.4%100%N/AIS 39NAC 2463
O’Connell 2016 [43]Genomics4.6 h 92.3%100%N/AIS 39NAC 2463
O’Connell 2016 [43]Genomics4.6 h97.4%90%N/AIS 39SM 20 59
S100B + BNGF +
vWF + MMP9 +
MCP-1
Reynolds 2003 [44]Protein 3 h98.1%91.7%N/AIS 82HS 103 +
HC 214 + TBI 38
437Brain cell damage, neuronal survive, coagulation, inflammation
Reynolds 2003 [44]Protein 6 h98.1%93.1%N/AIS 82HS 103 +
HC 214 + TBI 38
437
GFAP+ antibody against NR2Stanca 2015 [45]Protein 12 h 94%91%N/AIS 49HS 23
72Brain cell damage, immune response
17-peptide-panelO’Connell 2019 [46]Proteomics 12 h 93.3%90%0.95IS 19HS 1736Immune response
aAbs to NR2A/2B, autoantibodies (aAbs) to NR2A/2B subunit of N-methyl-D-aspartate receptor; BDNF, brain-derived neurotrophic factor; IMA index, ischaemia-modified albumin index; NR2 peptide, NR2 subunit peptide of N-methyl-D-aspartate receptor; GPBB, glycogen phosphorylase isoenzyme BB; ADAMTS13, von Willebrand factor-cleaving protease; S100A7, S100 calcium-binding protein A7; VILIP-1, visinin-like protein 1; APOA1-UP, apolipoprotein A1-unique peptide; HC: healthy control; VC: vascular risk control; NSC: non-stroke control; NAC: neurologically asymptomatic control; IS: ischaemic stroke; HS: haemorrhagic stroke; SM: stroke mimics; TIA: transient ischaemic attack; TBI: traumatic brain injury.
Disclaimer/Publisher’s Note: The statements, opinions and data contained in all publications are solely those of the individual author(s) and contributor(s) and not of MDPI and/or the editor(s). MDPI and/or the editor(s) disclaim responsibility for any injury to people or property resulting from any ideas, methods, instructions or products referred to in the content.

