_Kim.png)
Bioinformatic Analysis of the CXCR2 Ligands in Cancer Processes


Abstract
1. Introduction
2. Results
2.1. The Level of Expression of CXCR2 Ligands in the Tumor Compared to Healthy Tissue Depend on the Type of Cancer
2.2. Correlation of CXCR2 Ligand Expression with Prognosis
2.3. Only in 5 out of 20 Types of Cancers, Certain CXCR2 Ligands May Positively Correlate with Lymph Node Metastasis Status
2.4. The Expression of CXCL2 and PPBP Often Negatively Correlate with a Proliferation Marker
2.5. The Correlations between the Expression of CXCR2 Ligands and Three Epithelial-to-Mesenchymal Transition (EMT) Markers Indicate Their Distinct Roles and Relationships in Some Types of Tumors
2.6. In Most Cases, the Expression of CXCR2 Ligands Is Not Correlated with the Level of Infiltration of the Tumor Microenvironment by Treg Cells
2.7. The Expression of CXCR2 Ligands Always Positively Correlates with the Level of Neutrophil Infiltration
2.8. The Impact of CXCR2 Ligands on the Level of MDSC Recruitment Depends on the Type of Tumor
2.9. The Expression Level of CXCR2 Ligands Negatively Correlates with Tumor Infiltration by CD8+ T Cells in Most Cancers
2.10. In Most Types of Tumors, None of the CXCR2 Ligands Correlates with Tumor Infiltration by NK Cells
2.11. The Expression Level of CXCR2 Ligands Often Positively Correlates with the Count of Myeloid Dendritic Cells in the Tumor
2.12. In One-Third of Cancer Types, the Expression of CXCR2 Ligands Positively or Negatively Correlates with the Count of Plasmacytoid Dendritic Cells
2.13. In Some Tumors, the Expression of CXCR2 Ligands Negatively Correlates with the Count of Endothelial Cells
2.14. The Level of CXCR2 Ligand Expression Positively Correlates with the Count of Macrophages in Most Types of Tumors
2.15. In Most Types of Cancer, the Level of Expression of CXCR2 Ligands Positively Correlates with the Count of M1 Macrophages in the Tumor Microenvironment, and Negatively Correlated with the Count of M2 Macrophages
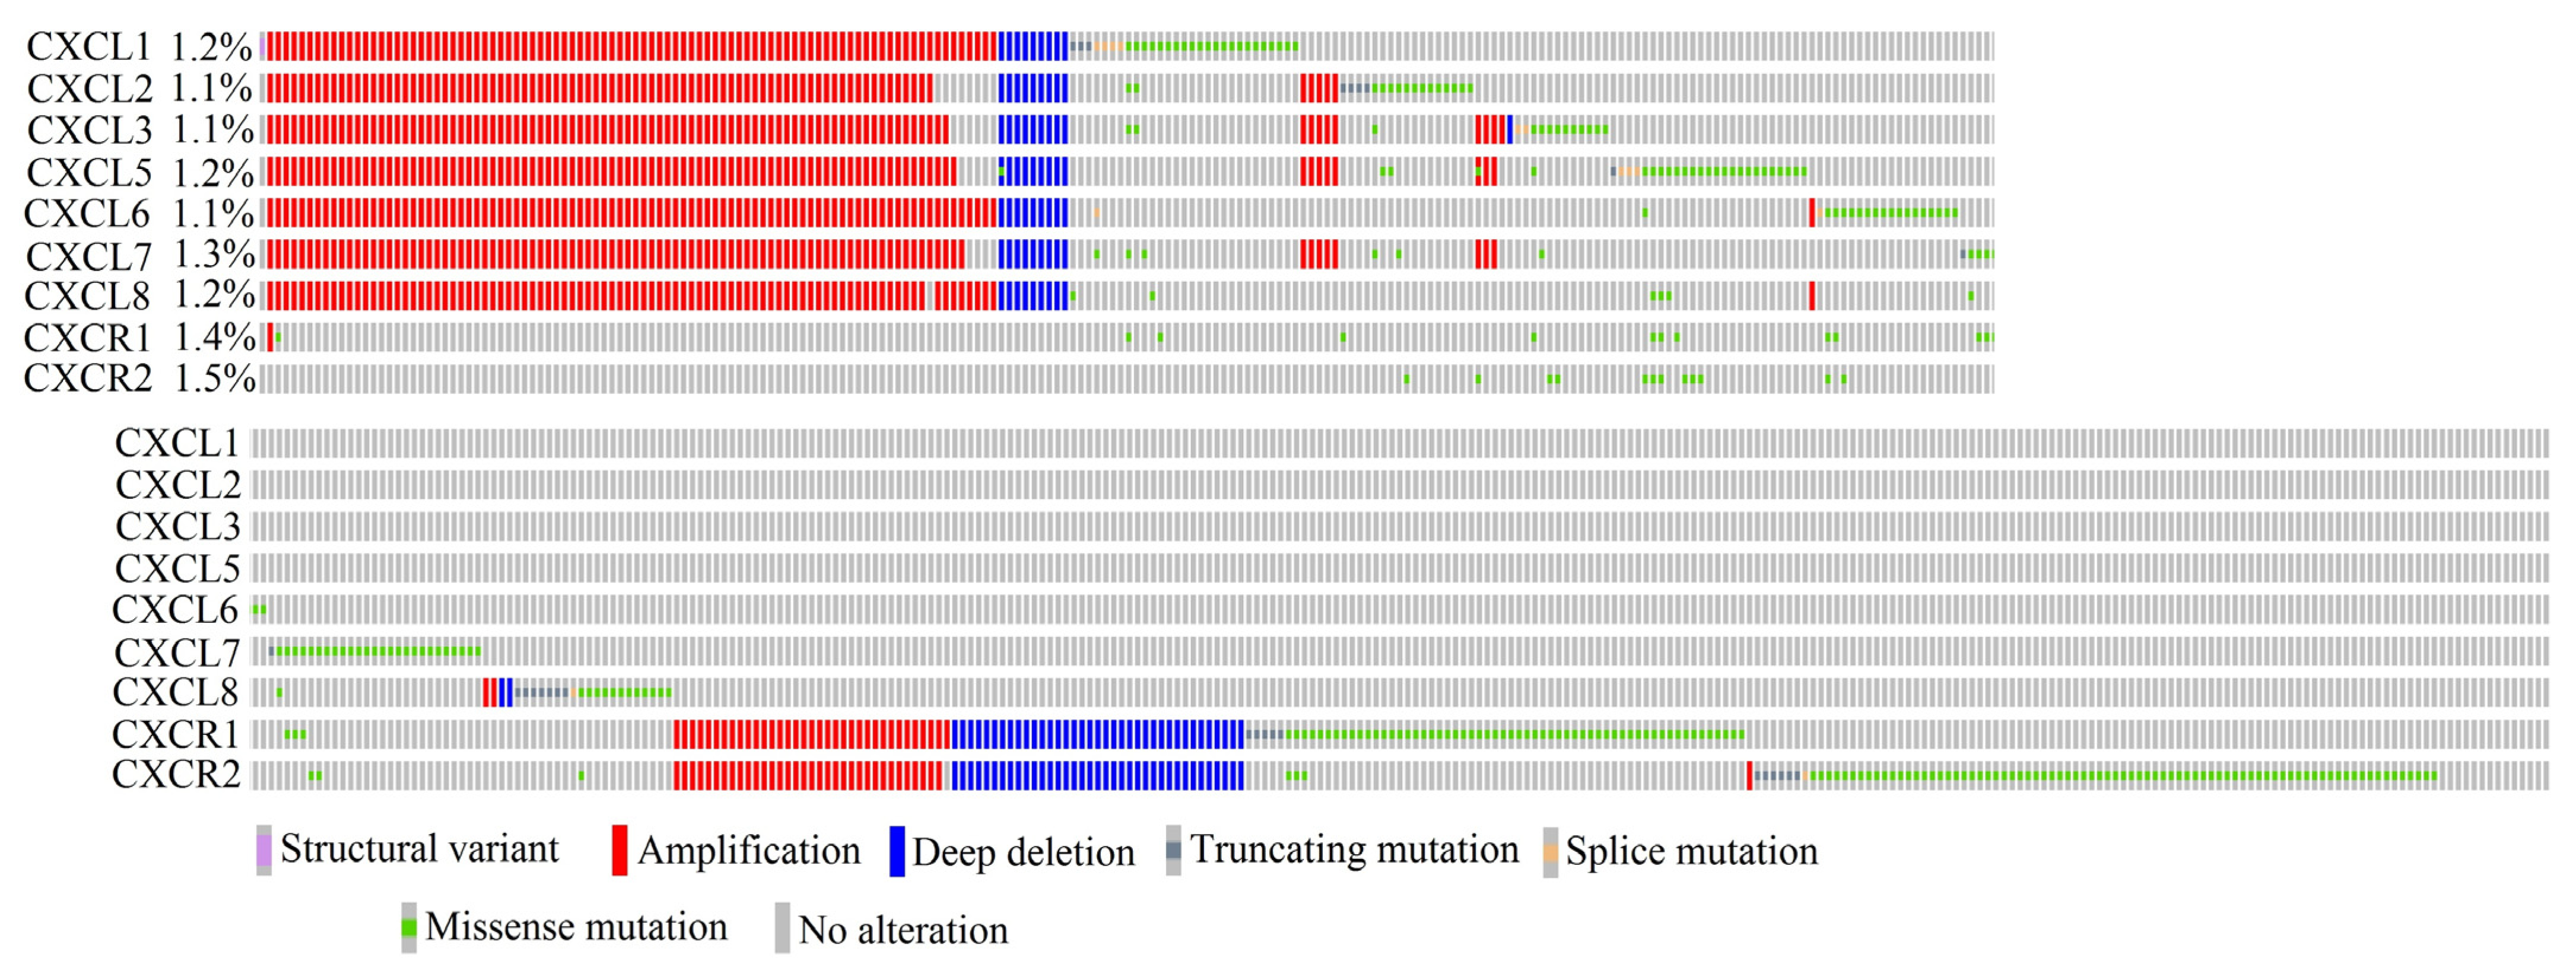
2.16. In Cancer Diseases, Mutations in CXCR2 Ligand Genes Occur at a Frequency Ranging from 1.1% to 1.3% of All Cancer Cases
2.17. Only Some CXCR2 Ligand Proteins Are Very Similar to Each Other
2.18. Regulation of CXCR2 Ligand Transcription May Be Mediated by NF-κB and a Unique Set of Proteins Bound Upstream of the Transcription Start Site
2.19. The Expression of Each CXCR2 Ligand Is Regulated by a Unique Set of microRNAs
3. Discussion
3.1. Regulation of CXCR2 Ligand Expression
3.2. Mutation in CXCR2 Ligand Genes
3.3. Correlation between CXCR2 Ligands Expression and Proliferation
3.4. Correlation between the Expression of CXCR2 Ligands and EMT
3.5. Correlation between CXCR2 Ligand Expression and Lymph Node Metastasis Status
3.6. Correlation between CXCR2 Ligand Expression and Angiogenesis
3.7. Correlation between CXCR2 Ligand Expression and Treg Cell Recruitment
3.8. Correlation between CXCR2 Ligand Expression and Neutrophil Recruitment
3.9. Correlation between CXCR2 Ligand Expression and the Recruitment of MDSCs
3.10. Correlation between CXCR2 Ligand Expression and CD8+ T Cell Infiltration
3.11. Correlation between CXCR2 Ligand Expression and NK Cell Infiltration
3.12. Correlation between CXCR2 Ligand Expression and Infiltration by Dendritic Cells (DCs)
3.13. Correlation between CXCR2 Ligand Expression and Macrophage Infiltration and Polarization
3.14. Expression of CXCR2 Ligands and Prognosis
3.15. Summary
4. Materials and Methods
4.1. GEPIA
- -
- Cancer type designation;
- -
- Targeted gene;
- -
- Analysis using GTEx data;
- -
- |Log2FC| Cutoff: 1;
- -
- p-value Cutoff: 0.05.
- -
- Cancer type designation;
- -
- Targeted gene;
- -
- Overall survival as the prognosis;
- -
- Group cutoff: quartile. If the group size was too small for analysis, median was selected instead.
4.2. UALCAN
- -
- TCGA database was used;
- -
- Cancer type designation;
- -
- Targeted gene.
4.3. TIMER2.0
- -
- Targeted gene;
- -
- Type of analyzed cells.
4.4. cBioPortal
4.5. BLAST
- CXCL1—GenBank: EAX05693.1;
- CXCL2—GenBank: EAX05701.1;
- CXCL3—GenBank: EAX05698.1;
- CXCL5—GenBank: EAX05696.1;
- CXCL6—GenBank: AAH13744.1;
- CXCL7—GenBank: AAH28217.1;
- CXCL8—GenBank: AAH13615.1.
- CXCL1—NCBI: NM_001511.4;
- CXCL2—NCBI: NM_002089.4;
- CXCL3—NCBI: NM_002090.3;
- CXCL5—NCBI: NM_002994.5;
- CXCL6—NCBI: NM_002993.4;
- PPBP—NCBI: NM_002704.3;
- CXCL8—NCBI: NM_000584.4.
4.6. Tfsitescan
- -
- 1500 bp sequences upstream of the transcription start site of CXCR2 ligand genes;
- -
- “IFTI Tfsites” option was selected;
- -
- Tfsites query parameters: mammalian sites.
- CXCL1—Gene ID: 2919;
- CXCL2—Gene ID: 2920;
- CXCL3—Gene ID: 2921;
- CXCL5—Gene ID: 6374;
- CXCL6—Gene ID: 6372;
- PPBP—Gene ID: 5473;
- CXCL8—Gene ID: 3576.
4.7. miRDB
5. Conclusions
- The level of expression of CXCR2 ligands in the tumor compared to healthy tissue depends on the type of cancer, but is often elevated, particularly in the case of CXCL1 and CXCL8/IL-8. The expression of CXCL2 is often decreased in the tumor compared to healthy tissue.
- The regulation of the expression of each CXCR2 ligand is different; therefore, each analyzed chemokine may have a different function in cancer processes.
- Depending on the type of cancer, different CXCR2 ligands are positively or negatively correlated with intense proliferation. PPBP/CXCL7 may have anti-proliferative properties.
- The level of expression of CXCR2 ligands is associated with cancer cell migration in the EMT process.
- CXCR2 ligands are often associated with a better lymph node metastasis status. In rare instances, the increased expression of CXCR2 ligands in the tumor is linked to a poorer lymph node metastasis status.
- Depending on the type of cancer, different CXCR2 ligands are associated with intense angiogenesis. In some cancers, CXCR2 ligands may be associated with the inhibition of angiogenesis.
- CXCR2 ligands are responsible for recruiting neutrophils to the tumor microenvironment, although not all CXCR2 ligands may be responsible for this process in a given tumor.
- In individual cases, CXCR2 ligands are associated with the count of Treg cells in the tumor. Usually, the expression of CXCR2 ligands is not associated with the count of Treg cells in the tumor microenvironment.
- Depending on the type of cancer, CXCR2 ligand expression is positively or negatively correlated with the count of MDSCs in the tumor. However, the expression of CXCL2 is most commonly negatively correlated with the count of these cells.
- CXCR2 ligands are often associated with a decrease in the count of CD8+ T cells in the tumor. In sporadic cases, the expression of CXCR2 ligands is associated with an increase in tumor infiltration by CD8+ T cells.
- CXCR2 ligand expression is not associated with the count of NK cells. In rare cases, there is a negative correlation associated with the immunosuppressive properties of these chemokines.
- The expression of CXCR2 ligands is associated with the count of conventional DCs in the tumor. CXCR2 ligands probably cause infiltration of the tumor microenvironment by conventional DCs, which increases the patient’s anti-tumor response.
- CXCR2 ligands are associated with M1 macrophages, which are anti-tumor cells. Therefore, CXCR2 ligands may be a marker of the immune system’s anti-tumor response, including infiltration of the tumor microenvironment by DCs, NK cells, and CD8+ T cells. However, CXCL2 may be associated with M2 macrophages and pro-tumor reactions.
- Mutations in CXCR2 ligand genes are rare in cancer. If they do occur, it is most often the amplification of the entire gene cluster in which all CXCR2 ligand genes are located.
- The effect of CXCR2 ligands on prognosis depends on the type of cancer.
Supplementary Materials
Author Contributions
Funding
Institutional Review Board Statement
Informed Consent Statement
Data Availability Statement
Conflicts of Interest
References
- Hughes, C.E.; Nibbs, R.J.B. A guide to chemokines and their receptors. FEBS J. 2018, 285, 2944–2971. [Google Scholar]
- Do, H.T.T.; Lee, C.H.; Cho, J. Chemokines and their Receptors: Multifaceted Roles in Cancer Progression and Potential Value as Cancer Prognostic Markers. Cancers 2020, 12, 287. [Google Scholar]
- Massara, M.; Bonavita, O.; Mantovani, A.; Locati, M.; Bonecchi, R. Atypical chemokine receptors in cancer: Friends or foes? J. Leukoc. Biol. 2016, 99, 927–933. [Google Scholar]
- Moser, B.; Clark-Lewis, I.; Zwahlen, R.; Baggiolini, M. Neutrophil-activating properties of the melanoma growth-stimulatory activity. J. Exp. Med. 1990, 171, 1797–1802. [Google Scholar]
- Doke, T.; Abedini, A.; Aldridge, D.L.; Yang, Y.W.; Park, J.; Hernandez, C.M.; Balzer, M.S.; Shrestra, R.; Coppock, G.; Rico, J.M.I.; et al. Single-cell analysis identifies the interaction of altered renal tubules with basophils orchestrating kidney fibrosis. Nat. Immunol. 2022, 23, 947–959. [Google Scholar] [PubMed]
- Sinclair, A.; Park, L.; Shah, M.; Drotar, M.; Calaminus, S.; Hopcroft, L.E.; Kinstrie, R.; Guitart, A.V.; Dunn, K.; Abraham, S.A.; et al. CXCR2 and CXCL4 regulate survival and self-renewal of hematopoietic stem/progenitor cells. Blood 2016, 128, 371–383. [Google Scholar] [PubMed]
- Shi, H.; Han, X.; Sun, Y.; Shang, C.; Wei, M.; Ba, X.; Zeng, X. Chemokine (C-X-C motif) ligand 1 and CXCL2 produced by tumor promote the generation of monocytic myeloid-derived suppressor cells. Cancer Sci. 2018, 109, 3826–3839. [Google Scholar]
- Han, X.; Shi, H.; Sun, Y.; Shang, C.; Luan, T.; Wang, D.; Ba, X.; Zeng, X. CXCR2 expression on granulocyte and macrophage progenitors under tumor conditions contributes to mo-MDSC generation via SAP18/ERK/STAT3. Cell Death Dis. 2019, 10, 598. [Google Scholar] [PubMed]
- Fagerberg, L.; Hallström, B.M.; Oksvold, P.; Kampf, C.; Djureinovic, D.; Odeberg, J.; Habuka, M.; Tahmasebpoor, S.; Danielsson, A.; Edlund, K.; et al. Analysis of the human tissue-specific expression by genome-wide integration of transcriptomics and antibody-based proteomics. Mol. Cell. Proteom. 2014, 13, 397–406. [Google Scholar]
- Brandt, E.; Petersen, F.; Ludwig, A.; Ehlert, J.E.; Bock, L.; Flad, H.D. The beta-thromboglobulins and platelet factor 4: Blood platelet-derived CXC chemokines with divergent roles in early neutrophil regulation. J. Leukoc. Biol. 2000, 67, 471–478. [Google Scholar]
- Ahuja, S.K.; Murphy, P.M. The CXC chemokines growth-regulated oncogene (GRO) alpha, GRObeta, GROgamma, neutrophil-activating peptide-2, and epithelial cell-derived neutrophil-activating peptide-78 are potent agonists for the type B, but not the type A, human interleukin-8 receptor. J. Biol. Chem. 1996, 271, 20545–20550. [Google Scholar]
- Wuyts, A.; Proost, P.; Lenaerts, J.P.; Ben-Baruch, A.; Van Damme, J.; Wang, J.M. Differential usage of the CXC chemokine receptors 1 and 2 by interleukin-8, granulocyte chemotactic protein-2 and epithelial-cell-derived neutrophil attractant-78. Eur. J. Biochem. 1998, 255, 67–73. [Google Scholar]
- Loetscher, P.; Seitz, M.; Clark-Lewis, I.; Baggiolini, M.; Moser, B. Both interleukin-8 receptors independently mediate chemotaxis. Jurkat cells transfected with IL-8R1 or IL-8R2 migrate in response to IL-8, GRO alpha and NAP-2. FEBS Lett. 1994, 341, 187–192. [Google Scholar]
- LaRosa, G.J.; Thomas, K.M.; Kaufmann, M.E.; Mark, R.; White, M.; Taylor, L.; Gray, G.; Witt, D.; Navarro, J. Amino terminus of the interleukin-8 receptor is a major determinant of receptor subtype specificity. J. Biol. Chem. 1992, 267, 25402–25406. [Google Scholar] [PubMed]
- Lee, J.; Horuk, R.; Rice, G.C.; Bennett, G.L.; Camerato, T.; Wood, W.I. Characterization of two high affinity human interleukin-8 receptors. J. Biol. Chem. 1992, 267, 16283–16287. [Google Scholar]
- Ahuja, S.K.; Ozçelik, T.; Milatovitch, A.; Francke, U.; Murphy, P.M. Molecular evolution of the human interleukin-8 receptor gene cluster. Nat. Genet. 1992, 2, 31–36. [Google Scholar] [PubMed]
- Damaj, B.B.; McColl, S.R.; Neote, K.; Songqing, N.; Ogborn, K.T.; Hébert, C.A.; Naccache, P.H. Identification of G-protein binding sites of the human interleukin-8 receptors by functional mapping of the intracellular loops. FASEB J. 1996, 10, 1426–1434. [Google Scholar]
- Damaj, B.B.; McColl, S.R.; Mahana, W.; Crouch, M.F.; Naccache, P.H. Physical association of Gi2alpha with interleukin-8 receptors. J. Biol. Chem. 1996, 271, 12783–12789. [Google Scholar] [PubMed]
- Hall, D.A.; Beresford, I.J.; Browning, C.; Giles, H. Signalling by CXC-chemokine receptors 1 and 2 expressed in CHO cells: A comparison of calcium mobilization, inhibition of adenylyl cyclase and stimulation of GTPgammaS binding induced by IL-8 and GROalpha. Br. J. Pharmacol. 1999, 126, 810–818. [Google Scholar]
- Ha, H.; Debnath, B.; Neamati, N. Role of the CXCL8-CXCR1/2 Axis in Cancer and Inflammatory Diseases. Theranostics 2017, 7, 1543–1588. [Google Scholar]
- Cohen-Hillel, E.; Yron, I.; Meshel, T.; Soria, G.; Attal, H.; Ben-Baruch, A. CXCL8-induced FAK phosphorylation via CXCR1 and CXCR2: Cytoskeleton- and integrin-related mechanisms converge with FAK regulatory pathways in a receptor-specific manner. Cytokine 2006, 33, 1–16. [Google Scholar] [CrossRef]
- Nasser, M.W.; Marjoram, R.J.; Brown, S.L.; Richardson, R.M. Cross-desensitization among CXCR1, CXCR2, and CCR5: Role of protein kinase C-epsilon. J. Immunol. 2005, 174, 6927–6933. [Google Scholar] [CrossRef]
- Devalaraja, M.N.; Wang, D.Z.; Ballard, D.W.; Richmond, A. Elevated constitutive IkappaB kinase activity and IkappaB-alpha phosphorylation in Hs294T melanoma cells lead to increased basal MGSA/GRO-alpha transcription. Cancer Res. 1999, 59, 1372–1377. [Google Scholar]
- Neuschäfer-Rube, F.; Pathe-Neuschäfer-Rube, A.; Hippenstiel, S.; Kracht, M.; Püschel, G.P. NF-κB-dependent IL-8 induction by prostaglandin E(2) receptors EP(1) and EP(4). Br. J. Pharmacol. 2013, 168, 704–717. [Google Scholar] [CrossRef] [PubMed]
- Chang, S.; Zhang, G.; Li, L.; Li, H.; Jin, X.; Wang, Y.; Li, B. Sirt4 deficiency promotes the development of atherosclerosis by activating the NF-κB/IκB/CXCL2/3 pathway. Atherosclerosis 2023, 373, 29–37. [Google Scholar] [CrossRef]
- Balakathiresan, N.S.; Bhattacharyya, S.; Gutti, U.; Long, R.P.; Jozwik, C.; Huang, W.; Srivastava, M.; Pollard, H.B.; Biswas, R. Tristetraprolin regulates IL-8 mRNA stability in cystic fibrosis lung epithelial cells. Am. J. Physiol. Lung Cell. Mol. Physiol. 2009, 296, L1012–L1018. [Google Scholar] [CrossRef]
- Datta, S.; Novotny, M.; Pavicic, P.G., Jr.; Zhao, C.; Herjan, T.; Hartupee, J.; Hamilton, T. IL-17 regulates CXCL1 mRNA stability via an AUUUA/tristetraprolin-independent sequence. J. Immunol. 2010, 184, 1484–1491. [Google Scholar] [CrossRef] [PubMed]
- Herjan, T.; Yao, P.; Qian, W.; Li, X.; Liu, C.; Bulek, K.; Sun, D.; Yang, W.P.; Zhu, J.; He, A.; et al. HuR is required for IL-17-induced Act1-mediated CXCL1 and CXCL5 mRNA stabilization. J. Immunol. 2013, 191, 640–649. [Google Scholar] [CrossRef] [PubMed]
- Loupasakis, K.; Kuo, D.; Sokhi, U.K.; Sohn, C.; Syracuse, B.; Giannopoulou, E.G.; Park, S.H.; Kang, H.; Rätsch, G.; Ivashkiv, L.B.; et al. Tumor Necrosis Factor dynamically regulates the mRNA stabilome in rheumatoid arthritis fibroblast-like synoviocytes. PLoS ONE 2017, 12, e0179762. [Google Scholar] [CrossRef]
- Jiang, Z.; Wang, H.; Li, Y.; Hou, Z.; Ma, N.; Chen, W.; Zong, Z.; Chen, S. MiR-129-5p is down-regulated and involved in migration and invasion of gastric cancer cells by targeting interleukin-8. Neoplasma 2016, 63, 673–680. [Google Scholar] [CrossRef]
- Chen, B.; Song, L.; Nie, X.; Lin, F.; Yu, Z.; Kong, W.; Qi, X.; Wang, W. CXCL1 Regulated by miR-302e Is Involved in Cell Viability and Motility of Colorectal Cancer via Inhibiting JAK-STAT Signaling Pathway. Front. Oncol. 2021, 10, 577229. [Google Scholar] [CrossRef]
- Luo, M.; Hu, Z.; Kong, Y.; Li, L. MicroRNA-432-5p inhibits cell migration and invasion by targeting CXCL5 in colorectal cancer. Exp. Ther. Med. 2021, 21, 301. [Google Scholar] [CrossRef]
- Mortier, A.; Van Damme, J.; Proost, P. Regulation of chemokine activity by posttranslational modification. Pharmacol. Ther. 2008, 120, 197–217. [Google Scholar] [CrossRef]
- Gill, S.E.; Nadler, S.T.; Li, Q.; Frevert, C.W.; Park, P.W.; Chen, P.; Parks, W.C. Shedding of Syndecan-1/CXCL1 Complexes by Matrix Metalloproteinase 7 Functions as an Epithelial Checkpoint of Neutrophil Activation. Am. J. Respir. Cell Mol. Biol. 2016, 55, 243–251. [Google Scholar] [CrossRef] [PubMed]
- Sepuru, K.M.; Rajarathnam, K. Structural basis of a chemokine heterodimer binding to glycosaminoglycans. Biochem. J. 2021, 478, 1009–1021. [Google Scholar] [CrossRef]
- Nesmelova, I.V.; Sham, Y.; Gao, J.; Mayo, K.H. CXC and CC chemokines form mixed heterodimers: Association free energies from molecular dynamics simulations and experimental correlations. J. Biol. Chem. 2008, 283, 24155–24166. [Google Scholar] [CrossRef] [PubMed]
- Brown, A.J.; Joseph, P.R.; Sawant, K.V.; Rajarathnam, K. Chemokine CXCL7 Heterodimers: Structural Insights, CXCR2 Receptor Function, and Glycosaminoglycan Interactions. Int. J. Mol. Sci. 2017, 18, 748. [Google Scholar] [CrossRef]
- Katancik, J.A.; Sharma, A.; de Nardin, E. Interleukin 8, neutrophil-activating peptide-2 and GRO-alpha bind to and elicit cell activation via specific and different amino acid residues of CXCR2. Cytokine 2000, 12, 1480–1488. [Google Scholar] [CrossRef]
- Kuwano, Y.; Adler, M.; Zhang, H.; Groisman, A.; Ley, K. Gαi2 and Gαi3 Differentially Regulate Arrest from Flow and Chemotaxis in Mouse Neutrophils. J. Immunol. 2016, 196, 3828–3833. [Google Scholar] [CrossRef] [PubMed]
- Raman, D.; Neel, N.F.; Sai, J.; Mernaugh, R.L.; Ham, A.J.; Richmond, A.J. Characterization of chemokine receptor CXCR2 interacting proteins using a proteomics approach to define the CXCR2 “chemosynapse”. Methods Enzymol. 2009, 460, 315–330. [Google Scholar]
- Neel, N.F.; Sai, J.; Ham, A.J.; Sobolik-Delmaire, T.; Mernaugh, R.L.; Richmond, A. IQGAP1 is a novel CXCR2-interacting protein and essential component of the “chemosynapse”. PLoS ONE 2011, 6, e23813. [Google Scholar] [CrossRef] [PubMed]
- Swart-Mataraza, J.M.; Li, Z.; Sacks, D.B. IQGAP1 is a component of Cdc42 signaling to the cytoskeleton. J. Biol. Chem. 2002, 277, 24753–24763. [Google Scholar] [CrossRef] [PubMed]
- Sai, J.; Fan, G.H.; Wang, D.; Richmond, A. The C-terminal domain LLKIL motif of CXCR2 is required for ligand-mediated polarization of early signals during chemotaxis. J. Cell Sci. 2004, 117, 5489–5496. [Google Scholar] [CrossRef]
- Bigorgne, A.E.; John, B.; Ebrahimkhani, M.R.; Shimizu-Albergine, M.; Campbell, J.S.; Crispe, I.N. TLR4-Dependent Secretion by Hepatic Stellate Cells of the Neutrophil-Chemoattractant CXCL1 Mediates Liver Response to Gut Microbiota. PLoS ONE 2016, 11, e0151063. [Google Scholar] [CrossRef]
- Fitzsimmons, T.R.; Ge, S.; Bartold, P.M. Compromised inflammatory cytokine response to P. gingivalis LPS by fibroblasts from inflamed human gingiva. Clin. Oral Investig. 2018, 22, 919–927. [Google Scholar] [CrossRef]
- Coelho, F.M.; Pinho, V.; Amaral, F.A.; Sachs, D.; Costa, V.V.; Rodrigues, D.H.; Vieira, A.T.; Silva, T.A.; Souza, D.G.; Bertini, R.; et al. The chemokine receptors CXCR1/CXCR2 modulate antigen-induced arthritis by regulating adhesion of neutrophils to the synovial microvasculature. Arthritis Rheum. 2008, 58, 2329–2337. [Google Scholar] [CrossRef]
- Grist, J.J.; Marro, B.S.; Skinner, D.D.; Syage, A.R.; Worne, C.; Doty, D.J.; Fujinami, R.S.; Lane, T.E. Induced CNS expression of CXCL1 augments neurologic disease in a murine model of multiple sclerosis via enhanced neutrophil recruitment. Eur. J. Immunol. 2018, 48, 1199–1210. [Google Scholar] [CrossRef] [PubMed]
- Greer, A.; Irie, K.; Hashim, A.; Leroux, B.G.; Chang, A.M.; Curtis, M.A.; Darveau, R.P. Site-Specific Neutrophil Migration and CXCL2 Expression in Periodontal Tissue. J. Dent. Res. 2016, 95, 946–952. [Google Scholar] [CrossRef]
- Diana, J.; Lehuen, A. Macrophages and β-cells are responsible for CXCR2-mediated neutrophil infiltration of the pancreas during autoimmune diabetes. EMBO Mol. Med. 2014, 6, 1090–1104. [Google Scholar] [CrossRef] [PubMed]
- Imada, A.; Ina, K.; Shimada, M.; Yokoyama, T.; Yokoyama, Y.; Nishio, Y.; Yamaguchi, T.; Ando, T.; Kusugami, K. Coordinate upregulation of interleukin-8 and growth-related gene product-alpha is present in the colonic mucosa of inflammatory bowel. Scand. J. Gastroenterol. 2001, 36, 854–864. [Google Scholar] [CrossRef]
- Mantovani, A.; Allavena, P.; Sica, A.; Balkwill, F. Cancer-related inflammation. Nature 2008, 454, 436–444. [Google Scholar] [CrossRef]
- Yang, G.; Rosen, D.G.; Liu, G.; Yang, F.; Guo, X.; Xiao, X.; Xue, F.; Mercado-Uribe, I.; Huang, J.; Lin, S.H.; et al. CXCR2 promotes ovarian cancer growth through dysregulated cell cycle, diminished apoptosis, and enhanced angiogenesis. Clin. Cancer Res. 2010, 16, 3875–3886. [Google Scholar] [CrossRef] [PubMed]
- Strieter, R.M.; Polverini, P.J.; Kunkel, S.L.; Arenberg, D.A.; Burdick, M.D.; Kasper, J.; Dzuiba, J.; Van Damme, J.; Walz, A.; Marriott, D.; et al. The functional role of the ELR motif in CXC chemokine-mediated angiogenesis. J. Biol. Chem. 1995, 270, 27348–27357. [Google Scholar] [CrossRef]
- Addison, C.L.; Daniel, T.O.; Burdick, M.D.; Liu, H.; Ehlert, J.E.; Xue, Y.Y.; Buechi, L.; Walz, A.; Richmond, A.; Strieter, R.M. The CXC chemokine receptor 2, CXCR2, is the putative receptor for ELR+ CXC chemokine-induced angiogenic activity. J. Immunol. 2000, 165, 5269–5277. [Google Scholar] [CrossRef]
- Nywening, T.M.; Belt, B.A.; Cullinan, D.R.; Panni, R.Z.; Han, B.J.; Sanford, D.E.; Jacobs, R.C.; Ye, J.; Patel, A.A.; Gillanders, W.E.; et al. Targeting both tumour-associated CXCR2+ neutrophils and CCR2+ macrophages disrupts myeloid recruitment and improves chemotherapeutic responses in pancreatic ductal adenocarcinoma. Gut 2018, 67, 1112–1123. [Google Scholar] [CrossRef] [PubMed]
- SenGupta, S.; Hein, L.E.; Xu, Y.; Zhang, J.; Konwerski, J.R.; Li, Y.; Johnson, C.; Cai, D.; Smith, J.L.; Parent, C.A. Triple-Negative Breast Cancer Cells Recruit Neutrophils by Secreting TGF-β and CXCR2 Ligands. Front. Immunol. 2021, 12, 659996. [Google Scholar] [CrossRef]
- Katoh, H.; Wang, D.; Daikoku, T.; Sun, H.; Dey, S.K.; Dubois, R.N. CXCR2-expressing myeloid-derived suppressor cells are essential to promote colitis-associated tumorigenesis. Cancer Cell 2013, 24, 631–644. [Google Scholar] [CrossRef] [PubMed]
- Zhou, X.; Fang, D.; Liu, H.; Ou, X.; Zhang, C.; Zhao, Z.; Zhao, S.; Peng, J.; Cai, S.; He, Y.; et al. PMN-MDSCs accumulation induced by CXCL1 promotes CD8+ T cells exhaustion in gastric cancer. Cancer Lett. 2022, 532, 215598. [Google Scholar] [CrossRef]
- Nomiyama, H.; Osada, N.; Yoshie, O. Systematic classification of vertebrate chemokines based on conserved synteny and evolutionary history. Genes Cells 2013, 18, 1–16. [Google Scholar] [CrossRef]
- Belperio, J.A.; Keane, M.P.; Burdick, M.D.; Gomperts, B.N.; Xue, Y.Y.; Hong, K.; Mestas, J.; Zisman, D.; Ardehali, A.; Saggar, R.; et al. CXCR2/CXCR2 ligand biology during lung transplant ischemia-reperfusion injury. J. Immunol. 2005, 175, 6931–6939. [Google Scholar] [CrossRef]
- Girbl, T.; Lenn, T.; Perez, L.; Rolas, L.; Barkaway, A.; Thiriot, A.; Del Fresno, C.; Lynam, E.; Hub, E.; Thelen, M.; et al. Distinct Compartmentalization of the Chemokines CXCL1 and CXCL2 and the Atypical Receptor ACKR1 Determine Discrete Stages of Neutrophil Diapedesis. Immunity 2018, 49, 1062–1076.e6. [Google Scholar] [CrossRef]
- Sato, E.; Olson, S.H.; Ahn, J.; Bundy, B.; Nishikawa, H.; Qian, F.; Jungbluth, A.A.; Frosina, D.; Gnjatic, S.; Ambrosone, C.; et al. Intraepithelial CD8+ tumor-infiltrating lymphocytes and a high CD8+/regulatory T cell ratio are associated with favorable prognosis in ovarian cancer. Proc. Natl. Acad. Sci. USA 2005, 102, 18538–18543. [Google Scholar] [CrossRef]
- Sabry, M.; Lowdell, M.W. Tumor-primed NK cells: Waiting for the green light. Front. Immunol. 2013, 4, 408. [Google Scholar] [CrossRef]
- Hansen, M.; Andersen, M.H. The role of dendritic cells in cancer. Semin. Immunopathol. 2017, 39, 307–316. [Google Scholar] [CrossRef]
- Collin, M.; Bigley, V. Human dendritic cell subsets: An update. Immunology 2018, 154, 3–20. [Google Scholar] [CrossRef] [PubMed]
- Park, S.L.; Gebhardt, T.; Mackay, L.K. Tissue-Resident Memory T Cells in Cancer Immunosurveillance. Trends Immunol. 2019, 40, 735–747. [Google Scholar] [CrossRef] [PubMed]
- Kumar, V.; Patel, S.; Tcyganov, E.; Gabrilovich, D.I. The Nature of Myeloid-Derived Suppressor Cells in the Tumor Microenvironment. Trends Immunol. 2016, 37, 208–220. [Google Scholar] [CrossRef] [PubMed]
- Najafi, M.; Farhood, B.; Mortezaee, K. Contribution of regulatory T cells to cancer: A review. J. Cell. Physiol. 2019, 234, 7983–7993. [Google Scholar] [CrossRef] [PubMed]
- Coffelt, S.B.; Wellenstein, M.D.; de Visser, K.E. Neutrophils in cancer: Neutral no more. Nat. Rev. Cancer 2016, 16, 431–446. [Google Scholar] [CrossRef]
- Zhang, X.; Zhang, W.; Yuan, X.; Fu, M.; Qian, H.; Xu, W. Neutrophils in cancer development and progression: Roles, mechanisms, and implications (Review). Int. J. Oncol. 2016, 49, 857–867. [Google Scholar] [CrossRef]
- Shapouri-Moghaddam, A.; Mohammadian, S.; Vazini, H.; Taghadosi, M.; Esmaeili, S.A.; Mardani, F.; Seifi, B.; Mohammadi, A.; Afshari, J.T.; Sahebkar, A. Macrophage plasticity, polarization, and function in health and disease. J. Cell. Physiol. 2018, 233, 6425–6440. [Google Scholar] [CrossRef] [PubMed]
- Saliminejad, K.; Khorram Khorshid, H.R.; Soleymani Fard, S.; Ghaffari, S.H. An overview of microRNAs: Biology, functions, therapeutics, and analysis methods. J. Cell. Physiol. 2019, 234, 5451–5465. [Google Scholar] [CrossRef]
- Luppi, F.; Longo, A.M.; de Boer, W.I.; Rabe, K.F.; Hiemstra, P.S. Interleukin-8 stimulates cell proliferation in non-small cell lung cancer through epidermal growth factor receptor transactivation. Lung Cancer 2007, 56, 25–33. [Google Scholar] [CrossRef] [PubMed]
- Bolitho, C.; Hahn, M.A.; Baxter, R.C.; Marsh, D.J. The chemokine CXCL1 induces proliferation in epithelial ovarian cancer cells by transactivation of the epidermal growth factor receptor. Endocr. Relat. Cancer 2010, 17, 929–940. [Google Scholar] [CrossRef] [PubMed]
- Lepsenyi, M.; Algethami, N.; Al-Haidari, A.A.; Algaber, A.; Syk, I.; Rahman, M.; Thorlacius, H. CXCL2-CXCR2 axis mediates αV integrin-dependent peritoneal metastasis of colon cancer cells. Clin. Exp. Metastasis 2021, 38, 401–410. [Google Scholar] [CrossRef] [PubMed]
- Inoue, M.; Takeuchi, H.; Matsuda, S.; Nishi, T.; Fukuda, K.; Nakamura, R.; Takahashi, T.; Wada, N.; Kawakubo, H.; Kitagawa, Y. IL-8/CXCR2 Signalling Promotes Cell Proliferation in Oesophageal Squamous Cell Carcinoma and Correlates With Poor Prognosis. Anticancer Res. 2021, 41, 783–794. [Google Scholar] [CrossRef] [PubMed]
- Li, W.; Lin, S.; Li, W.; Wang, W.; Li, X.; Xu, D. IL-8 interacts with metadherin promoting proliferation and migration in gastric cancer. Biochem. Biophys. Res. Commun. 2016, 478, 1330–1337. [Google Scholar] [CrossRef]
- Gabellini, C.; Trisciuoglio, D.; Desideri, M.; Candiloro, A.; Ragazzoni, Y.; Orlandi, A.; Zupi, G.; Del Bufalo, D. Functional activity of CXCL8 receptors, CXCR1 and CXCR2, on human malignant melanoma progression. Eur. J. Cancer 2009, 45, 2618–2627. [Google Scholar] [CrossRef]
- Yamamoto, Y.; Sugimoto, A.; Maruo, K.; Tsujio, G.; Sera, T.; Kushiyama, S.; Nishimura, S.; Kuroda, K.; Togano, S.; Eguchi, S.; et al. CXCR2 signaling might have a tumor-suppressive role in patients with cholangiocarcinoma. PLoS ONE 2022, 17, e0266027. [Google Scholar] [CrossRef]
- Ding, J.; Xu, K.; Zhang, J.; Lin, B.; Wang, Y.; Yin, S.; Xie, H.; Zhou, L.; Zheng, S. Overexpression of CXCL2 inhibits cell proliferation and promotes apoptosis in hepatocellular carcinoma. BMB Rep. 2018, 51, 630–635. [Google Scholar] [CrossRef]
- Wang, J.; Huang, M.; Lee, P.; Komanduri, K.; Sharma, S.; Chen, G.; Dubinett, S.M. Interleukin-8 inhibits non-small cell lung cancer proliferation: A possible role for regulation of tumor growth by autocrine and paracrine pathways. J. Interferon Cytokine Res. 1996, 16, 53–60. [Google Scholar] [CrossRef] [PubMed]
- Neote, K.; Mak, J.Y.; Kolakowski, L.F., Jr.; Schall, T.J. Functional and biochemical analysis of the cloned Duffy antigen: Identity with the red blood cell chemokine receptor. Blood 1994, 84, 44–52. [Google Scholar] [CrossRef] [PubMed]
- Szabo, M.C.; Soo, K.S.; Zlotnik, A.; Schall, T.J. Chemokine class differences in binding to the Duffy antigen-erythrocyte chemokine receptor. J. Biol. Chem. 1995, 270, 25348–25351. [Google Scholar] [CrossRef]
- Maeda, S.; Kuboki, S.; Nojima, H.; Shimizu, H.; Yoshitomi, H.; Furukawa, K.; Miyazaki, M.; Ohtsuka, M. Duffy antigen receptor for chemokines (DARC) expressing in cancer cells inhibits tumor progression by suppressing CXCR2 signaling in human pancreatic ductal adenocarcinoma. Cytokine 2017, 95, 12–21. [Google Scholar] [CrossRef] [PubMed]
- Deng, F.; Weng, Y.; Li, X.; Wang, T.; Fan, M.; Shi, Q. Overexpression of IL-8 promotes cell migration via PI3K-Akt signaling pathway and EMT in triple-negative breast cancer. Pathol. Res. Pract. 2021, 223, 152824. [Google Scholar] [CrossRef]
- Zhao, J.; Ou, B.; Han, D.; Wang, P.; Zong, Y.; Zhu, C.; Liu, D.; Zheng, M.; Sun, J.; Feng, H.; et al. Tumor-derived CXCL5 promotes human colorectal cancer metastasis through activation of the ERK/Elk-1/Snail and AKT/GSK3β/β-catenin pathways. Mol. Cancer 2017, 16, 70. [Google Scholar] [CrossRef]
- Jia, X.; Wei, S.; Xiong, W. CXCL5/NF-κB Pathway as a Therapeutic Target in Hepatocellular Carcinoma Treatment. J. Oncol. 2021, 2021, 9919494. [Google Scholar] [CrossRef]
- Wen, J.; Zhao, Z.; Huang, L.; Wang, L.; Miao, Y.; Wu, J. IL-8 promotes cell migration through regulating EMT by activating the Wnt/β-catenin pathway in ovarian cancer. J. Cell. Mol. Med. 2020, 24, 1588–1598. [Google Scholar] [CrossRef]
- Wang, Z.Z.; Li, X.T.; Li, Q.J.; Zhou, J.X. Targeting CXCL5 in Pancreatic Cancer Cells Inhibits Cancer Xenograft Growth by Reducing Proliferation and Inhibiting EMT Progression. Dig. Dis. Sci. 2023, 68, 841–851. [Google Scholar] [CrossRef]
- Lu, Y.; Dong, B.; Xu, F.; Xu, Y.; Pan, J.; Song, J.; Zhang, J.; Huang, Y.; Xue, W. CXCL1-LCN2 paracrine axis promotes progression of prostate cancer via the Src activation and epithelial-mesenchymal transition. Cell Commun. Signal. 2019, 17, 118. [Google Scholar] [CrossRef]
- Taki, M.; Abiko, K.; Baba, T.; Hamanishi, J.; Yamaguchi, K.; Murakami, R.; Yamanoi, K.; Horikawa, N.; Hosoe, Y.; Nakamura, E.; et al. Snail promotes ovarian cancer progression by recruiting myeloid-derived suppressor cells via CXCR2 ligand upregulation. Nat. Commun. 2018, 9, 1685. [Google Scholar] [CrossRef]
- Park, Y.L.; Kim, H.P.; Ock, C.Y.; Min, D.W.; Kang, J.K.; Lim, Y.J.; Song, S.H.; Han, S.W.; Kim, T.Y. EMT-mediated regulation of CXCL1/5 for resistance to anti-EGFR therapy in colorectal cancer. Oncogene 2022, 41, 2026–2038. [Google Scholar] [CrossRef] [PubMed]
- Roy, S.; Kumaravel, S.; Banerjee, P.; White, T.K.; O’Brien, A.; Seelig, C.; Chauhan, R.; Ekser, B.; Bayless, K.J.; Alpini, G.; et al. Tumor Lymphatic Interactions Induce CXCR2-CXCL5 Axis and Alter Cellular Metabolism and Lymphangiogenic Pathways to Promote Cholangiocarcinoma. Cells 2021, 10, 3093. [Google Scholar] [CrossRef]
- Mao, Z.; Zhang, J.; Shi, Y.; Li, W.; Shi, H.; Ji, R.; Mao, F.; Qian, H.; Xu, W.; Zhang, X. CXCL5 promotes gastric cancer metastasis by inducing epithelial-mesenchymal transition and activating neutrophils. Oncogenesis 2020, 9, 63. [Google Scholar] [CrossRef] [PubMed]
- Che, D.; Zhang, S.; Jing, Z.; Shang, L.; Jin, S.; Liu, F.; Shen, J.; Li, Y.; Hu, J.; Meng, Q.; et al. Macrophages induce EMT to promote invasion of lung cancer cells through the IL-6-mediated COX-2/PGE2/β-catenin signalling pathway. Mol. Immunol. 2017, 90, 197–210. [Google Scholar] [CrossRef] [PubMed]
- Huang, K.; Gao, N.; Bian, D.; Zhai, Q.; Yang, P.; Li, M.; Wang, X. Correlation between FAK and EGF-Induced EMT in Colorectal Cancer Cells. J. Oncol. 2020, 2020, 5428920. [Google Scholar] [CrossRef]
- Gong, W.; Yang, S.; Yang, X.; Guo, F. Blood preoperative neutrophil-to-lymphocyte ratio is correlated with TNM stage in patients with papillary thyroid cancer. Clinics 2016, 71, 311–314. [Google Scholar] [CrossRef]
- Martin, C.; Burdon, P.C.; Bridger, G.; Gutierrez-Ramos, J.C.; Williams, T.J.; Rankin, S.M. Chemokines acting via CXCR2 and CXCR4 control the release of neutrophils from the bone marrow and their return following senescence. Immunity 2003, 19, 583–593. [Google Scholar] [CrossRef]
- Urbantat, R.M.; Jelgersma, C.; Vajkoczy, P.; Brandenburg, S.; Acker, G. Combining TMZ and SB225002 induces changes of CXCR2 and VEGFR signalling in primary human endothelial cells in vitro. Oncol. Rep. 2022, 48, 158. [Google Scholar] [CrossRef]
- Matsuo, Y.; Ochi, N.; Sawai, H.; Yasuda, A.; Takahashi, H.; Funahashi, H.; Takeyama, H.; Tong, Z.; Guha, S. CXCL8/IL-8 and CXCL12/SDF-1alpha co-operatively promote invasiveness and angiogenesis in pancreatic cancer. Int. J. Cancer 2009, 124, 853–861. [Google Scholar] [CrossRef]
- Miyake, M.; Goodison, S.; Urquidi, V.; Gomes Giacoia, E.; Rosser, C.J. Expression of CXCL1 in human endothelial cells induces angiogenesis through the CXCR2 receptor and the ERK1/2 and EGF pathways. Lab. Investig. 2013, 93, 768–778. [Google Scholar] [CrossRef]
- Chen, C.; Xu, Z.Q.; Zong, Y.P.; Ou, B.C.; Shen, X.H.; Feng, H.; Zheng, M.H.; Zhao, J.K.; Lu, A.G. CXCL5 induces tumor angiogenesis via enhancing the expression of FOXD1 mediated by the AKT/NF-κB pathway in colorectal cancer. Cell Death Dis. 2019, 10, 178. [Google Scholar] [CrossRef]
- Urbantat, R.M.; Blank, A.; Kremenetskaia, I.; Vajkoczy, P.; Acker, G.; Brandenburg, S. The CXCL2/IL8/CXCR2 Pathway Is Relevant for Brain Tumor Malignancy and Endothelial Cell Function. Int. J. Mol. Sci. 2021, 22, 2634. [Google Scholar] [CrossRef] [PubMed]
- Cao, Y.; Chen, C.; Weatherbee, J.A.; Tsang, M.; Folkman, J. gro-beta, a -C-X-C- chemokine, is an angiogenesis inhibitor that suppresses the growth of Lewis lung carcinoma in mice. J. Exp. Med. 1995, 182, 2069–2077. [Google Scholar] [CrossRef] [PubMed]
- Jetten, N.; Verbruggen, S.; Gijbels, M.J.; Post, M.J.; De Winther, M.P.; Donners, M.M. Anti-inflammatory M2, but not pro-inflammatory M1 macrophages promote angiogenesis in vivo. Angiogenesis 2014, 17, 109–118. [Google Scholar] [CrossRef]
- Zhang, G.; Tao, X.; Ji, B.; Gong, J. Hypoxia-Driven M2-Polarized Macrophages Facilitate Cancer Aggressiveness and Temozolomide Resistance in Glioblastoma. Oxidative Med. Cell. Longev. 2022, 2022, 1614336. [Google Scholar] [CrossRef]
- Szade, A.; Grochot-Przeczek, A.; Florczyk, U.; Jozkowicz, A.; Dulak, J. Cellular and molecular mechanisms of inflammation-induced angiogenesis. IUBMB Life 2015, 67, 145–159. [Google Scholar] [CrossRef]
- Engström, A.; Erlandsson, A.; Delbro, D.; Wijkander, J. Conditioned media from macrophages of M1, but not M2 phenotype, inhibit the proliferation of the colon cancer cell lines HT-29 and CACO-2. Int. J. Oncol. 2014, 44, 385–392. [Google Scholar] [CrossRef] [PubMed]
- Lugano, R.; Ramachandran, M.; Dimberg, A. Tumor angiogenesis: Causes, consequences, challenges and opportunities. Cell. Mol. Life Sci. 2020, 77, 1745–1770. [Google Scholar] [CrossRef]
- Powell, J.A., Jr.; Mousa, S.A. Neutrophil-activating protein-2- and interleukin-8-mediated angiogenesis. J. Cell. Biochem. 2007, 102, 412–420. [Google Scholar] [CrossRef]
- Ohue, Y.; Nishikawa, H. Regulatory T (Treg) cells in cancer: Can Treg cells be a new therapeutic target? Cancer Sci. 2019, 110, 2080–2089. [Google Scholar] [CrossRef] [PubMed]
- Lv, M.; Xu, Y.; Tang, R.; Ren, J.; Shen, S.; Chen, Y.; Liu, B.; Hou, Y.; Wang, T. miR141-CXCL1-CXCR2 signaling-induced Treg recruitment regulates metastases and survival of non-small cell lung cancer. Mol. Cancer Ther. 2014, 13, 3152–3162. [Google Scholar] [CrossRef] [PubMed]
- Eikawa, S.; Ohue, Y.; Kitaoka, K.; Aji, T.; Uenaka, A.; Oka, M.; Nakayama, E. Enrichment of Foxp3+ CD4 regulatory T cells in migrated T cells to IL-6- and IL-8-expressing tumors through predominant induction of CXCR1 by IL-6. J. Immunol. 2010, 185, 6734–6740. [Google Scholar] [CrossRef] [PubMed]
- Wang, D.; Yang, L.; Yue, D.; Cao, L.; Li, L.; Wang, D.; Ping, Y.; Shen, Z.; Zheng, Y.; Wang, L.; et al. Macrophage-derived CCL22 promotes an immunosuppressive tumor microenvironment via IL-8 in malignant pleural effusion. Cancer Lett. 2019, 452, 244–253. [Google Scholar] [CrossRef]
- Li, J.; Wang, S.; Wang, N.; Zheng, Y.; Yang, B.; Wang, X.; Zhang, J.; Pan, B.; Wang, Z. Aiduqing formula inhibits breast cancer metastasis by suppressing TAM/CXCL1-induced Treg differentiation and infiltration. Cell Commun. Signal. 2021, 19, 89. [Google Scholar] [CrossRef] [PubMed]
- Kupper, R.W.; Dewald, B.; Jakobs, K.H.; Baggiolini, M.; Gierschik, P. G-protein activation by interleukin 8 and related cytokines in human neutrophil plasma membranes. Biochem. J. 1992, 282, 429–434. [Google Scholar] [CrossRef]
- Zhou, S.L.; Zhou, Z.J.; Hu, Z.Q.; Huang, X.W.; Wang, Z.; Chen, E.B.; Fan, J.; Cao, Y.; Dai, Z.; Zhou, J. Tumor-Associated Neutrophils Recruit Macrophages and T-Regulatory Cells to Promote Progression of Hepatocellular Carcinoma and Resistance to Sorafenib. Gastroenterology 2016, 150, 1646–1658.e17. [Google Scholar] [CrossRef]
- Zhang, C.; Gao, Y.; Du, C.; Markowitz, G.J.; Fu, J.; Zhang, Z.; Liu, C.; Qin, W.; Wang, H.; Wang, F.; et al. Hepatitis B-Induced IL8 Promotes Hepatocellular Carcinoma Venous Metastasis and Intrahepatic Treg Accumulation. Cancer Res. 2021, 81, 2386–2398. [Google Scholar] [CrossRef]
- Zhu, Q.; Wu, X.; Wu, Y.; Wang, X. Interaction between Treg cells and tumor-associated macrophages in the tumor microenvironment of epithelial ovarian cancer. Oncol. Rep. 2016, 36, 3472–3478. [Google Scholar] [CrossRef] [PubMed]
- Martin, T.R.; Raugi, G.; Merritt, T.L.; Henderson, W.R., Jr. Relative contribution of leukotriene B4 to the neutrophil chemotactic activity produced by the resident human alveolar macrophage. J. Clin. Investig. 1987, 80, 1114–1124. [Google Scholar] [CrossRef]
- Rådmark, O.; Werz, O.; Steinhilber, D.; Samuelsson, B. 5-Lipoxygenase: Regulation of expression and enzyme activity. Trends Biochem. Sci. 2007, 32, 332–341. [Google Scholar] [CrossRef]
- Zhao, W.; Xu, Y.; Xu, J.; Wu, D.; Zhao, B.; Yin, Z.; Wang, X. Subsets of myeloid-derived suppressor cells in hepatocellular carcinoma express chemokines and chemokine receptors differentially. Int. Immunopharmacol. 2015, 26, 314–321. [Google Scholar] [CrossRef]
- Lopez-Bujanda, Z.A.; Haffner, M.C.; Chaimowitz, M.G.; Chowdhury, N.; Venturini, N.J.; Patel, R.A.; Obradovic, A.; Hansen, C.S.; Jacków, J.; Maynard, J.P.; et al. Castration-mediated IL-8 promotes myeloid infiltration and prostate cancer progression. Nat. Cancer 2021, 2, 803–818. [Google Scholar] [CrossRef] [PubMed]
- Akiyama, T.; Yasuda, T.; Uchihara, T.; Yasuda-Yoshihara, N.; Tan, B.J.Y.; Yonemura, A.; Semba, T.; Yamasaki, J.; Komohara, Y.; Ohnishi, K.; et al. Stromal reprogramming through dual PDGFRα/β blockade boosts the efficacy of anti-PD-1 immunotherapy in fibrotic tumors. Cancer Res. 2022, CAN-22, 1890. [Google Scholar] [CrossRef]
- Wang, J.; Yu, F.; Jia, X.; Iwanowycz, S.; Wang, Y.; Huang, S.; Ai, W.; Fan, D. MicroRNA-155 deficiency enhances the recruitment and functions of myeloid-derived suppressor cells in tumor microenvironment and promotes solid tumor growth. Int. J. Cancer 2015, 136, E602–E613. [Google Scholar] [CrossRef]
- Li, E.; Yang, X.; Du, Y.; Wang, G.; Chan, D.W.; Wu, D.; Xu, P.; Ni, P.; Xu, D.; Hu, Y. CXCL8 Associated Dendritic Cell Activation Marker Expression and Recruitment as Indicators of Favorable Outcomes in Colorectal Cancer. Front. Immunol. 2021, 12, 667177. [Google Scholar] [CrossRef]
- Suthen, S.; Lim, C.J.; Nguyen, P.H.D.; Dutertre, C.A.; Lai, H.L.H.; Wasser, M.; Chua, C.; Lim, T.K.H.; Leow, W.Q.; Loh, T.J.; et al. Hypoxia-driven immunosuppression by Treg and type-2 conventional dendritic cells in HCC. Hepatology 2022, 76, 1329–1344. [Google Scholar] [CrossRef]
- Simoncello, F.; Piperno, G.M.; Caronni, N.; Amadio, R.; Cappelletto, A.; Canarutto, G.; Piazza, S.; Bicciato, S.; Benvenuti, F. CXCL5-mediated accumulation of mature neutrophils in lung cancer tissues impairs the differentiation program of anticancer CD8 T cells and limits the efficacy of checkpoint inhibitors. Oncoimmunology 2022, 11, 2059876. [Google Scholar] [CrossRef] [PubMed]
- Lin, C.; He, H.; Liu, H.; Li, R.; Chen, Y.; Qi, Y.; Jiang, Q.; Chen, L.; Zhang, P.; Zhang, H.; et al. Tumour-associated macrophages-derived CXCL8 determines immune evasion through autonomous PD-L1 expression in gastric cancer. Gut 2019, 68, 1764–1773. [Google Scholar] [CrossRef] [PubMed]
- Yao, X.; Matosevic, S. Chemokine networks modulating natural killer cell trafficking to solid tumors. Cytokine Growth Factor Rev. 2021, 59, 36–45. [Google Scholar] [CrossRef]
- Kremer, V.; Ligtenberg, M.A.; Zendehdel, R.; Seitz, C.; Duivenvoorden, A.; Wennerberg, E.; Colón, E.; Scherman-Plogell, A.H.; Lundqvist, A. Genetic engineering of human NK cells to express CXCR2 improves migration to renal cell carcinoma. J. Immunother. Cancer 2017, 5, 73. [Google Scholar] [CrossRef]
- Gao, L.; Yang, L.; Zhang, S.; Ge, Z.; Su, M.; Shi, Y.; Wang, X.; Huang, C. Engineering NK-92 Cell by Upregulating CXCR2 and IL-2 Via CRISPR-Cas9 Improves Its Antitumor Effects as Cellular Immunotherapy for Human Colon Cancer. J. Interferon Cytokine Res. 2021, 41, 450–460. [Google Scholar] [CrossRef] [PubMed]
- Greene, S.; Robbins, Y.; Mydlarz, W.K.; Huynh, A.P.; Schmitt, N.C.; Friedman, J.; Horn, L.A.; Palena, C.; Schlom, J.; Maeda, D.Y.; et al. Inhibition of MDSC Trafficking with SX-682, a CXCR1/2 Inhibitor, Enhances NK-Cell Immunotherapy in Head and Neck Cancer Models. Clin. Cancer Res. 2020, 26, 1420–1431. [Google Scholar] [CrossRef] [PubMed]
- Wu, J.; Gao, F.X.; Wang, C.; Qin, M.; Han, F.; Xu, T.; Hu, Z.; Long, Y.; He, X.M.; Deng, X.; et al. IL-6 and IL-8 secreted by tumour cells impair the function of NK cells via the STAT3 pathway in oesophageal squamous cell carcinoma. J. Exp. Clin. Cancer Res. 2019, 38, 321. [Google Scholar] [CrossRef]
- Zeng, X.; Dong, X.; Ma, Y.; Yao, J. Chemokine (C-X-C motif) ligand 1 maintains the immune surveillance function of natural killer cells via the PDK2/mTOR signaling pathway. Cell Biol. Toxicol. 2022. [Google Scholar] [CrossRef]
- Mingozzi, F.; Spreafico, R.; Gorletta, T.; Cigni, C.; Di Gioia, M.; Caccia, M.; Sironi, L.; Collini, M.; Soncini, M.; Rusconi, M.; et al. Prolonged contact with dendritic cells turns lymph node-resident NK cells into anti-tumor effectors. EMBO Mol. Med. 2016, 8, 1039–1051. [Google Scholar] [CrossRef]
- Morse, M.A.; Lyerly, H.K.; Li, Y. The role of IL-13 in the generation of dendritic cells in vitro. J. Immunother. 1999, 22, 506–513. [Google Scholar] [CrossRef]
- Sozzani, S.; Luini, W.; Borsatti, A.; Polentarutti, N.; Zhou, D.; Piemonti, L.; D’Amico, G.; Power, C.A.; Wells, T.N.; Gobbi, M.; et al. Receptor expression and responsiveness of human dendritic cells to a defined set of CC and CXC chemokines. J. Immunol. 1997, 159, 1993–2000. [Google Scholar] [CrossRef] [PubMed]
- Zhu, K.; Shen, Q.; Ulrich, M.; Zheng, M. Human monocyte-derived dendritic cells expressing both chemotactic cytokines IL-8, MCP-1, RANTES and their receptors, and their selective migration to these chemokines. Chin. Med. J. 2000, 113, 1124–1128. [Google Scholar]
- Feijoó, E.; Alfaro, C.; Mazzolini, G.; Serra, P.; Peñuelas, I.; Arina, A.; Huarte, E.; Tirapu, I.; Palencia, B.; Murillo, O.; et al. Dendritic cells delivered inside human carcinomas are sequestered by interleukin-8. Int. J. Cancer 2005, 116, 275–281. [Google Scholar] [CrossRef]
- Alfaro, C.; Suárez, N.; Martínez-Forero, I.; Palazón, A.; Rouzaut, A.; Solano, S.; Feijoo, E.; Gúrpide, A.; Bolaños, E.; Erro, L.; et al. Carcinoma-derived interleukin-8 disorients dendritic cell migration without impairing T-cell stimulation. PLoS ONE 2011, 6, e17922. [Google Scholar] [CrossRef] [PubMed]
- Wong, K.L.; Tai, J.J.; Wong, W.C.; Han, H.; Sem, X.; Yeap, W.H.; Kourilsky, P.; Wong, S.C. Gene expression profiling reveals the defining features of the classical, intermediate, and nonclassical human monocyte subsets. Blood 2011, 118, e16–e31. [Google Scholar] [CrossRef]
- Laviron, M.; Boissonnas, A. Ontogeny of Tumor-Associated Macrophages. Front. Immunol. 2019, 10, 1799. [Google Scholar] [CrossRef] [PubMed]
- Di Mitri, D.; Mirenda, M.; Vasilevska, J.; Calcinotto, A.; Delaleu, N.; Revandkar, A.; Gil, V.; Boysen, G.; Losa, M.; Mosole, S.; et al. Re-education of Tumor-Associated Macrophages by CXCR2 Blockade Drives Senescence and Tumor Inhibition in Advanced Prostate Cancer. Cell Rep. 2019, 28, 2156–2168.e5. [Google Scholar] [CrossRef]
- Tang, Z.; Li, C.; Kang, B.; Gao, G.; Li, C.; Zhang, Z. GEPIA: A web server for cancer and normal gene expression profiling and interactive analyses. Nucleic Acids Res. 2017, 45, W98–W102. [Google Scholar] [CrossRef] [PubMed]
- Cancer Genome Atlas Research Network; Weinstein, J.N.; Collisson, E.A.; Mills, G.B.; Shaw, K.R.; Ozenberger, B.A.; Ellrott, K.; Shmulevich, I.; Sander, C.; Stuart, J.M. The Cancer Genome Atlas Pan-Cancer analysis project. Nat. Genet. 2013, 45, 1113–1120. [Google Scholar] [CrossRef] [PubMed]
- GTEx Consortium. The Genotype-Tissue Expression (GTEx) project. Nat. Genet. 2013, 45, 580–585. [Google Scholar] [CrossRef]
- GTEx Consortium. Human genomics. The Genotype-Tissue Expression (GTEx) pilot analysis: Multitissue gene regulation in humans. Science 2015, 348, 648–660. [Google Scholar] [CrossRef]
- Sun, X.; Kaufman, P.D. Ki-67: More than a proliferation marker. Chromosoma 2018, 127, 175–186. [Google Scholar] [CrossRef]
- Prihantono, P.; Hatta, M.; Binekada, C.; Sampepajung, D.; Haryasena, H.; Nelwan, B.; Asadul Islam, A.; Nilawati Usman, A. Ki-67 Expression by Immunohistochemistry and Quantitative Real-Time Polymerase Chain Reaction as Predictor of Clinical Response to Neoadjuvant Chemotherapy in Locally Advanced Breast Cancer. J. Oncol. 2017, 2017, 6209849. [Google Scholar] [CrossRef]
- Chen, D.; Liu, G.; Xu, N.; You, X.; Zhou, H.; Zhao, X.; Liu, Q. Knockdown of ARK5 Expression Suppresses Invasion and Metastasis of Gastric Cancer. Cell. Physiol. Biochem. 2017, 42, 1025–1036. [Google Scholar] [CrossRef]
- Brabletz, S.; Schuhwerk, H.; Brabletz, T.; Stemmler, M.P. Dynamic EMT: A multi-tool for tumor progression. EMBO J. 2021, 40, e108647. [Google Scholar] [CrossRef]
- Bhardwaj, M.; Sen, S.; Chosdol, K.; Bakhshi, S.; Pushker, N.; Sharma, A.; Kashyap, S.; Bajaj, M.S.; Singh, V.K. Vimentin overexpression as a novel poor prognostic biomarker in eyelid sebaceous gland carcinoma. Br. J. Ophthalmol. 2020, 104, 879–884. [Google Scholar] [CrossRef]
- Chandrashekar, D.S.; Bashel, B.; Balasubramanya, S.A.H.; Creighton, C.J.; Ponce-Rodriguez, I.; Chakravarthi, B.V.S.K.; Varambally, S. UALCAN: A Portal for Facilitating Tumor Subgroup Gene Expression and Survival Analyses. Neoplasia 2017, 19, 649–658. [Google Scholar] [CrossRef] [PubMed]
- Chandrashekar, D.S.; Karthikeyan, S.K.; Korla, P.K.; Patel, H.; Shovon, A.R.; Athar, M.; Netto, G.J.; Qin, Z.S.; Kumar, S.; Manne, U.; et al. UALCAN: An update to the integrated cancer data analysis platform. Neoplasia 2022, 25, 18–27. [Google Scholar] [CrossRef] [PubMed]
- Li, B.; Severson, E.; Pignon, J.C.; Zhao, H.; Li, T.; Novak, J.; Jiang, P.; Shen, H.; Aster, J.C.; Rodig, S.; et al. Comprehensive analyses of tumor immunity: Implications for cancer immunotherapy. Genome Biol. 2016, 17, 174. [Google Scholar] [CrossRef] [PubMed]
- Li, T.; Fan, J.; Wang, B.; Traugh, N.; Chen, Q.; Liu, J.S.; Li, B.; Liu, X.S. TIMER: A Web Server for Comprehensive Analysis of Tumor-Infiltrating Immune Cells. Cancer Res. 2017, 77, e108–e110. [Google Scholar] [CrossRef] [PubMed]
- Li, T.; Fu, J.; Zeng, Z.; Cohen, D.; Li, J.; Chen, Q.; Li, B.; Liu, X.S. TIMER2.0 for analysis of tumor-infiltrating immune cells. Nucleic Acids Res. 2020, 48, W509–W514. [Google Scholar] [CrossRef]
- Aran, D.; Hu, Z.; Butte, A.J. xCell: Digitally portraying the tissue cellular heterogeneity landscape. Genome Biol. 2017, 18, 220. [Google Scholar] [CrossRef] [PubMed]
- Finotello, F.; Trajanoski, Z. Quantifying tumor-infiltrating immune cells from transcriptomics data. Cancer Immunol. Immunother. 2018, 67, 1031–1040. [Google Scholar] [CrossRef]
- Becht, E.; Giraldo, N.A.; Lacroix, L.; Buttard, B.; Elarouci, N.; Petitprez, F.; Selves, J.; Laurent-Puig, P.; Sautès-Fridman, C.; Fridman, W.H.; et al. Estimating the population abundance of tissue-infiltrating immune and stromal cell populations using gene expression. Genome Biol. 2016, 17, 218. [Google Scholar] [CrossRef] [PubMed]
- Chen, B.; Khodadoust, M.S.; Liu, C.L.; Newman, A.M.; Alizadeh, A.A. Profiling Tumor Infiltrating Immune Cells with CIBERSORT. Methods Mol. Biol. 2018, 1711, 243–259. [Google Scholar] [PubMed]
- Finotello, F.; Mayer, C.; Plattner, C.; Laschober, G.; Rieder, D.; Hackl, H.; Krogsdam, A.; Loncova, Z.; Posch, W.; Wilflingseder, D.; et al. Molecular and pharmacological modulators of the tumor immune contexture revealed by deconvolution of RNA-seq data. Genome Med. 2019, 11, 34. [Google Scholar] [CrossRef] [PubMed]
- Racle, J.; de Jonge, K.; Baumgaertner, P.; Speiser, D.E.; Gfeller, D. Simultaneous enumeration of cancer and immune cell types from bulk tumor gene expression data. Elife 2017, 6, e26476. [Google Scholar] [CrossRef] [PubMed]
- Jiang, P.; Gu, S.; Pan, D.; Fu, J.; Sahu, A.; Hu, X.; Li, Z.; Traugh, N.; Bu, X.; Li, B.; et al. Signatures of T cell dysfunction and exclusion predict cancer immunotherapy response. Nat. Med. 2018, 24, 1550–1558. [Google Scholar] [CrossRef] [PubMed]
- Cerami, E.; Gao, J.; Dogrusoz, U.; Gross, B.E.; Sumer, S.O.; Aksoy, B.A.; Jacobsen, A.; Byrne, C.J.; Heuer, M.L.; Larsson, E.; et al. The cBio cancer genomics portal: An open platform for exploring multidimensional cancer genomics data. Cancer Discov. 2012, 2, 401–404. [Google Scholar] [CrossRef]
- Gao, J.; Aksoy, B.A.; Dogrusoz, U.; Dresdner, G.; Gross, B.; Sumer, S.O.; Sun, Y.; Jacobsen, A.; Sinha, R.; Larsson, E.; et al. Integrative analysis of complex cancer genomics and clinical profiles using the cBioPortal. Sci. Signal. 2013, 6, pl1. [Google Scholar] [CrossRef]
- Bonneville, R.; Krook, M.A.; Kautto, E.A.; Miya, J.; Wing, M.R.; Chen, H.Z.; Reeser, J.W.; Yu, L.; Roychowdhury, S. Landscape of Microsatellite Instability Across 39 Cancer Types. JCO Precis. Oncol. 2017, 2017, PO.17.00073. [Google Scholar] [CrossRef]
- Ding, L.; Bailey, M.H.; Porta-Pardo, E.; Thorsson, V.; Colaprico, A.; Bertrand, D.; Gibbs, D.L.; Weerasinghe, A.; Huang, K.L.; Tokheim, C.; et al. Perspective on Oncogenic Processes at the End of the Beginning of Cancer Genomics. Cell 2018, 173, 305–320.e10. [Google Scholar] [CrossRef]
- Ellrott, K.; Bailey, M.H.; Saksena, G.; Covington, K.R.; Kandoth, C.; Stewart, C.; Hess, J.; Ma, S.; Chiotti, K.E.; McLellan, M.; et al. Scalable Open Science Approach for Mutation Calling of Tumor Exomes Using Multiple Genomic Pipelines. Cell Syst. 2018, 6, 271–281.e7. [Google Scholar] [CrossRef]
- Gao, Q.; Liang, W.W.; Foltz, S.M.; Mutharasu, G.; Jayasinghe, R.G.; Cao, S.; Liao, W.W.; Reynolds, S.M.; Wyczalkowski, M.A.; Yao, L.; et al. Driver Fusions and Their Implications in the Development and Treatment of Human Cancers. Cell Rep. 2018, 23, 227–238.e3. [Google Scholar] [CrossRef] [PubMed]
- Hoadley, K.A.; Yau, C.; Hinoue, T.; Wolf, D.M.; Lazar, A.J.; Drill, E.; Shen, R.; Taylor, A.M.; Cherniack, A.D.; Thorsson, V.; et al. Cell-of-Origin Patterns Dominate the Molecular Classification of 10,000 Tumors from 33 Types of Cancer. Cell 2018, 173, 291–304.e6. [Google Scholar] [CrossRef] [PubMed]
- Taylor, A.M.; Shih, J.; Ha, G.; Gao, G.F.; Zhang, X.; Berger, A.C.; Schumacher, S.E.; Wang, C.; Hu, H.; Liu, J.; et al. Genomic and Functional Approaches to Understanding Cancer Aneuploidy. Cancer Cell 2018, 33, 676–689.e3. [Google Scholar] [CrossRef] [PubMed]
- Altschul, S.F.; Gish, W.; Miller, W.; Myers, E.W.; Lipman, D.J. Basic local alignment search tool. J. Mol. Biol. 1990, 215, 403–410. [Google Scholar] [CrossRef]
- Altschul, S.F.; Madden, T.L.; Schäffer, A.A.; Zhang, J.; Zhang, Z.; Miller, W.; Lipman, D.J. Gapped BLAST and PSI-BLAST: A new generation of protein database search programs. Nucleic Acids Res. 1997, 25, 3389–3402. [Google Scholar] [CrossRef]
- Camacho, C.; Coulouris, G.; Avagyan, V.; Ma, N.; Papadopoulos, J.; Bealer, K.; Madden, T.L. BLAST+: Architecture and applications. BMC Bioinform. 2009, 10, 421. [Google Scholar] [CrossRef]
- Boratyn, G.M.; Thierry-Mieg, J.; Thierry-Mieg, D.; Busby, B.; Madden, T.L. Magic-BLAST, an accurate RNA-seq aligner for long and short reads. BMC Bioinform. 2019, 20, 405. [Google Scholar] [CrossRef]
- Johnson, M.; Zaretskaya, I.; Raytselis, Y.; Merezhuk, Y.; McGinnis, S.; Madden, T.L. NCBI BLAST: A better web interface. Nucleic Acids Res. 2008, 36, W5–W9. [Google Scholar] [CrossRef]
- Venter, J.C.; Adams, M.D.; Myers, E.W.; Li, P.W.; Mural, R.J.; Sutton, G.G.; Smith, H.O.; Yandell, M.; Evans, C.A.; Holt, R.A.; et al. The sequence of the human genome. Science 2001, 291, 1304–1351. [Google Scholar] [CrossRef]
- Strausberg, R.L.; Feingold, E.A.; Grouse, L.H.; Derge, J.G.; Klausner, R.D.; Collins, F.S.; Wagner, L.; Shenmen, C.M.; Schuler, G.D.; Altschul, S.F.; et al. Generation and initial analysis of more than 15,000 full-length human and mouse cDNA sequences. Proc. Natl. Acad. Sci. USA 2002, 99, 16899–16903. [Google Scholar]
- Schneider, V.A.; Graves-Lindsay, T.; Howe, K.; Bouk, N.; Chen, H.C.; Kitts, P.A.; Murphy, T.D.; Pruitt, K.D.; Thibaud-Nissen, F.; Albracht, D.; et al. Evaluation of GRCh38 and de novo haploid genome assemblies demonstrates the enduring quality of the reference assembly. Genome Res. 2017, 27, 849–864. [Google Scholar] [CrossRef] [PubMed]
- Morales, J.; Pujar, S.; Loveland, J.E.; Astashyn, A.; Bennett, R.; Berry, A.; Cox, E.; Davidson, C.; Ermolaeva, O.; Farrell, C.M.; et al. A joint NCBI and EMBL-EBI transcript set for clinical genomics and research. Nature 2022, 604, 310–315. [Google Scholar] [CrossRef] [PubMed]
- Ghosh, D. Object-oriented transcription factors database (ooTFD). Nucleic Acids Res. 2000, 28, 308–310. [Google Scholar] [CrossRef] [PubMed]
- Liu, W.; Wang, X. Prediction of functional microRNA targets by integrative modeling of microRNA binding and target expression data. Genome Biol. 2019, 20, 18. [Google Scholar] [CrossRef]
- Chen, Y.; Wang, X. miRDB: An online database for prediction of functional microRNA targets. Nucleic Acids Res. 2020, 48, D127–D131. [Google Scholar] [CrossRef]


| CXCR2 Ligand | Location of the Highest Expression |
|---|---|
| CXCL1 | Appendix, bone marrow, gall bladder, small intestine, urinary bladder |
| CXCL2 | Appendix, bone marrow, gall bladder, liver, lung |
| CXCL3 | Appendix, bone marrow, colon, gall bladder, liver, lung, stomach, urinary bladder |
| CXCL5 | Appendix, gall bladder, lung, lymph node, stomach, urinary bladder |
| CXCL6 | Appendix, gall bladder, urinary bladder |
| PPBP | Bone marrow, spleen |
| CXCL8 | Appendix, bone marrow, esophagus, gall bladder, liver, urinary bladder |
| Name of the Cancer | CXCL1 | CXCL2 | CXCL3 | CXCL5 | CXCL6 | PPBP | CXCL8 | CXCR1 | CXCR2 |
|---|---|---|---|---|---|---|---|---|---|
| Adrenocortical carcinoma | = | ↓ | = | = | = | = | = | = | = |
| Bladder urothelial carcinoma | = | = | = | = | = | = | = | = | ↓ |
| Breast invasive carcinoma | ↓ | ↓ | ↓ | = | = | = | = | = | = |
| Cervical squamous cell carcinoma and endocervical adenocarcinoma | ↑ | = | ↑ | = | = | = | ↑ | = | = |
| Cholangiocarcinoma | ↑ | ↓ | ↑ | ↑ | ↑ | = | ↑ | = | = |
| Colon adenocarcinoma | ↑ | ↑ | ↑ | ↑ | = | = | ↑ | = | = |
| Lymphoid neoplasm diffuse large B-cell lymphoma | = | = | = | = | = | ↓ | ↓ | ↓ | ↓ |
| Esophageal carcinoma | ↑ | ↑ | ↑ | ↑ | ↑ | = | ↑ | = | ↓ |
| Glioblastoma multiforme | = | ↑ | ↑ | = | = | = | ↑ | = | = |
| Head and neck squamous cell carcinoma | ↑ | = | = | = | = | = | ↑ | = | ↓ |
| Kidney chromophobe | ↓ | ↓ | = | = | = | = | ↓ | = | = |
| Kidney renal clear cell carcinoma | = | = | = | = | = | = | = | = | = |
| Kidney renal papillary cell carcinoma | ↑ | = | = | = | ↑ | = | ↑ | = | = |
| Acute myeloid leukemia | = | = | ↓ | = | = | ↑ | = | = | ↑ |
| Brain lower grade glioma | = | = | = | = | = | = | = | = | = |
| Liver hepatocellular carcinoma | = | ↓ | = | = | = | = | = | = | = |
| Lung adenocarcinoma | = | ↓ | ↓ | = | = | ↓ | = | ↓ | ↓ |
| Lung squamous cell carcinoma | = | ↓ | ↓ | ↓ | ↑ | ↓ | = | ↓ | ↓ |
| Ovarian serous cystadenocarcinoma | ↑ | = | = | = | = | = | ↑ | = | = |
| Pancreatic adenocarcinoma | ↑ | = | ↑ | ↑ | ↑ | = | ↑ | = | = |
| Pheochromocytoma and Paraganglioma | ↓ | = | = | = | = | = | ↓ | = | = |
| Prostate adenocarcinoma | = | ↓ | = | = | = | = | = | = | = |
| Rectum adenocarcinoma | ↑ | ↑ | ↑ | ↑ | = | ↑ | ↑ | = | = |
| Sarcoma | = | = | = | = | = | = | = | = | = |
| Skin cutaneous melanoma | ↑ | = | = | = | = | = | ↑ | = | ↓ |
| Stomach adenocarcinoma | ↑ | = | ↑ | ↑ | ↑ | = | ↑ | = | = |
| Testicular germ cell tumors | = | = | = | = | = | = | = | = | = |
| Thyroid carcinoma | = | = | = | = | = | = | = | = | = |
| Thymoma | ↓ | = | = | = | = | ↓ | ↓ | ↓ | ↓ |
| Uterine corpus endometrial carcinoma | ↑ | = | ↑ | = | = | = | ↑ | = | = |
| Uterine carcinosarcoma | ↑ | = | = | = | = | = | ↑ | = | = |
| Name of the Cancer | CXCL1 | CXCL2 | CXCL3 | CXCL5 | CXCL6 | PPBP | CXCL8 | CXCR1 | CXCR2 |
|---|---|---|---|---|---|---|---|---|---|
| Adrenocortical carcinoma | = | = | = | = | N/A | ↓ p = 0.061 | ↓ | = | = |
| Bladder urothelial carcinoma | = | = | = | = | = | = | = | = | = |
| Breast invasive carcinoma | ↑ | ↑ | ↑ p = 0.056 | ↑ p = 0.08 | ↑ | N/A | = | = | = |
| Cervical squamous cell carcinoma and endocervical adenocarcinoma | ↓ | ↓ | ↓ | ↓ | ↓ p = 0.056 | ↓ p = 0.088 | ↓ | ↓ | = |
| Cholangiocarcinoma | = | = | = | = | = | = | = | = | = |
| Colon adenocarcinoma | = | ↑ | ↑ p = 0.094 | = | = | = | = | = | = |
| Lymphoid neoplasm diffuse large B-cell lymphoma | = | = | ↓ | = | ↓ p = 0.061 | = | = | = | = |
| Esophageal carcinoma | = | = | = | ↓ p = 0.092 | = | = | ↓ | = | = |
| Glioblastoma multiforme | ↓ | ↓ | = | ↓ | ↓ 0.096 | = | = | = | = |
| Head and neck squamous cell carcinoma | ↓ 0.076 | = | = | = | = | = | = | = | = |
| Kidney chromophobe | = | = | = | ↓ | = | = | ↓ | = | = |
| Kidney renal clear cell carcinoma | ↓ | ↓ | ↓ | ↓ | ↓ | = | ↓ | ↑ | ↑ |
| Kidney renal papillary cell carcinoma | = | ↑ p = 0.072 | = | ↑ p = 0.078 | = | = | = | = | = |
| Acute myeloid leukemia | ↓ | ↓ p = 0.055 | = | ↓ | = | ↓ p = 0.099 | = | = | = |
| Brain lower grade glioma | ↓ | ↑ | ↑ p = 0.096 | ↑ | = | = | = | ↓ p = 0.075 | ↓ |
| Liver hepatocellular carcinoma | ↓ | = | ↓ | ↓ | ↓ | = | ↓ | = | = |
| Lung adenocarcinoma | = | = | = | = | ↓ p = 0.076 | = | ↓ | = | = |
| Lung squamous cell carcinoma | = | ↓ | = | = | = | = | = | = | = |
| Ovarian serous cystadenocarcinoma | = | = | = | ↑ p = 0.083 | = | = | = | = | = |
| Pancreatic adenocarcinoma | = | = | = | ↓ | = | = | = | = | = |
| Pheochromocytoma and paraganglioma | = | = | = | = | N/A | = | = | = | = |
| Prostate adenocarcinoma | = | = | = | = | = | N/A | = | = | = |
| Rectum adenocarcinoma | = | = | = | = | = | = | = | = | = |
| Sarcoma | = | ↑ | = | = | = | ↓ p = 0.091 | = | = | = |
| Skin cutaneous melanoma | = | = | = | = | = | ↓ p = 0.064 | = | = | ↓ |
| Stomach adenocarcinoma | = | = | ↑ p = 0.055 | = | = | = | = | = | = |
| Testicular germ cell tumors | = | = | = | = | = | N/A | = | = | = |
| Thyroid carcinoma | = | = | = | = | = | ↓ | = | = | = |
| Thymoma | = | = | = | = | = | = | = | = | = |
| Uterine corpus endometrial carcinoma | = | = | = | = | = | = | = | = | = |
| Uterine carcinosarcoma | = | = | = | = | = | = | = | = | = |
| Name of the Cancer | CXCL1 | CXCL2 | CXCL3 | CXCL5 | CXCL6 | PPBP | CXCL8 | CXCR1 | CXCR2 |
|---|---|---|---|---|---|---|---|---|---|
| Adrenocortical carcinoma | = | ↓ | = | = | = | ↓ p = 0.069 | = | = | = |
| Bladder urothelial carcinoma | = | = | = | = | = | = | = | = | = |
| Breast invasive carcinoma | ?? | ↓ | ↓ | ?? | ?? | = | ↓ | = | = |
| Cervical squamous cell carcinoma | = | = | = | = | = | = | = | = | = |
| Cholangiocarcinoma | = | = | = | = | = | = | = | = | = |
| Colon adenocarcinoma | = | = | = | = | = | = | = | = | = |
| Lymphoid neoplasm diffuse large B-cell lymphoma | N/A | N/A | N/A | N/A | N/A | N/A | N/A | N/A | N/A |
| Esophageal carcinoma | = | = | ?? | = | = | = | ↑ | = | = |
| Glioblastoma multiforme | N/A | N/A | N/A | N/A | N/A | N/A | N/A | N/A | N/A |
| Head and neck squamous cell carcinoma | ↓ | ↓ | ↓ p = 0.082 | ?? | ↓ | = | ↓ | ↓ | ↓ |
| Kidney chromophobe | = | = | = | ?? | ?? | = | = | = | = |
| Kidney renal clear cell carcinoma | = | = | = | = | = | ↑ | = | = | = |
| Kidney renal papillary cell carcinoma | = | = | = | = | ↓ | = | = | = | = |
| Acute myeloid leukemia | N/A | N/A | N/A | N/A | N/A | N/A | N/A | N/A | N/A |
| Brain lower grade glioma | N/A | N/A | N/A | N/A | N/A | N/A | N/A | N/A | N/A |
| Liver hepatocellular carcinoma | = | = | = | ↑ | = | N/A | = | = | = |
| Lung adenocarcinoma | = | = | = | = | = | = | = | = | = |
| Lung squamous cell carcinoma | = | ↓ | ↓ | = | = | ?? | = | ?? | ↓ |
| Ovarian serous cystadenocarcinoma | N/A | N/A | N/A | N/A | N/A | N/A | N/A | N/A | N/A |
| Pancreatic adenocarcinoma | = | = | = | = | = | = | = | = | = |
| Pheochromocytoma and paraganglioma | N/A | N/A | N/A | N/A | N/A | N/A | N/A | N/A | N/A |
| Prostate adenocarcinoma | = | ↓ | ↓ p = 0.059 | ↓ | = | = | = | ↓ | ↓ |
| Rectum adenocarcinoma | ↓ | ↓ | ↓ | = | = | = | = | = | = |
| Sarcoma | N/A | N/A | N/A | N/A | N/A | N/A | N/A | N/A | N/A |
| Skin cutaneous melanoma | = | ↑ | = | = | = | = | = | = | ↑ |
| Stomach adenocarcinoma | ↓ | ↓ | ↓ | = | = | = | = | = | = |
| Testicular germ cell tumors | N/A | N/A | N/A | N/A | N/A | N/A | N/A | N/A | N/A |
| Thyroid carcinoma | ↑ p = 0.094 | ↑ | ↑ p = 0.082 | = | = | = | ↑ | = | = |
| Thymoma | N/A | N/A | N/A | N/A | N/A | N/A | N/A | N/A | N/A |
| Uterine corpus endometrial carcinoma | N/A | N/A | N/A | N/A | N/A | N/A | N/A | N/A | N/A |
| Uterine carcinosarcoma | N/A | N/A | N/A | N/A | N/A | N/A | N/A | N/A | N/A |
| Name of the Cancer | CXCL1 | CXCL2 | CXCL3 | CXCL5 | CXCL6 | PPBP | CXCL8 | CXCR1 | CXCR2 |
|---|---|---|---|---|---|---|---|---|---|
| Adrenocortical carcinoma | 0.03 | 0.02 | 0.08 | −0.08 | 0.02 | 0.15 | 0.39 | 0.11 | 0.24 |
| Bladder urothelial carcinoma | 0.24 | 0.19 | 0.26 | 0.32 | 0.19 | 0.12 | 0.24 | 0.05 | −0.17 |
| Breast invasive carcinoma | 0.13 | −0.08 | 0.11 | 0.23 | 0.09 | 0.05 | 0.26 | 0.00 | 0.01 |
| Cervical squamous cell carcinoma and endocervical adenocarcinoma | 0.16 | 0.03 | 0.06 | 0.09 | 0.19 | 0.01 | 0.24 | 0.10 | 0.18 |
| Cholangiocarcinoma | 0.12 | 0.01 | 0.28 | 0.23 | 0.06 | 0.17 | 0.24 | 0.30 | 0.35 |
| Colon adenocarcinoma | 0.14 | 0.17 | 0.18 | 0.18 | 0.05 | 0.04 | 0.04 | 0.05 | 0.04 |
| Lymphoid neoplasm diffuse large B-cell lymphoma | 0.10 | 0.33 | 0.33 | 0.12 | 0.03 | 0.19 | 0.26 | 0.13 | 0.30 |
| Esophageal carcinoma | 0.19 | 0.16 | 0.20 | 0.18 | 0.13 | −0.02 | 0.17 | −0.07 | −0.14 |
| Glioblastoma multiforme | −0.17 | −0.26 | −0.20 | −0.20 | −0.19 | −0.19 | −0.29 | −0.04 | −0.07 |
| Head and neck squamous cell carcinoma | 0.09 | 0.07 | 0.18 | 0.14 | 0.12 | −0.09 | 0.19 | 0.02 | 0.02 |
| Kidney chromophobe | 0.28 | −0.17 | 0.15 | 0.27 | 0.24 | 0.09 | 0.29 | −0.04 | 0.12 |
| Kidney renal clear cell carcinoma | 0.05 | 0.03 | 0.10 | 0.19 | 0.03 | 0.06 | 0.14 | 0.08 | 0.19 |
| Kidney renal papillary cell carcinoma | −0.06 | −0.05 | −0.02 | 0.00 | −0.07 | 0.00 | 0.14 | −0.03 | 0.19 |
| Acute myeloid leukemia | 0.04 | −0.09 | −0.05 | −0.01 | −0.02 | 0.08 | 0.00 | 0.11 | 0.29 |
| Brain lower grade glioma | −0.09 | −0.13 | −0.16 | −0.24 | −0.10 | −0.07 | −0.02 | 0.04 | 0.19 |
| Liver hepatocellular carcinoma | 0.20 | −0.12 | 0.30 | 0.29 | 0.15 | −0.11 | 0.20 | 0.00 | 0.09 |
| Lung adenocarcinoma | 0.08 | −0.09 | 0.08 | 0.16 | 0.10 | −0.11 | 0.23 | −0.07 | −0.08 |
| Lung squamous cell carcinoma | −0.08 | −0.16 | −0.10 | −0.09 | −0.13 | −0.14 | −0.16 | −0.16 | −0.10 |
| Ovarian serous cystadenocarcinoma | 0.07 | 0.07 | 0.09 | 0.13 | 0.15 | 0.07 | 0.14 | 0.16 | 0.26 |
| Pancreatic adenocarcinoma | −0.02 | −0.09 | 0.13 | 0.18 | −0.08 | 0.01 | 0.10 | 0.02 | −0.04 |
| Pheochromocytoma and paraganglioma | −0.03 | −0.10 | 0.03 | −0.07 | 0.09 | 0.02 | 0.05 | 0.14 | 0.16 |
| Prostate adenocarcinoma | −0.01 | −0.01 | 0.05 | 0.05 | 0.00 | 0.14 | 0.21 | 0.08 | 0.03 |
| Rectum adenocarcinoma | 0.31 | 0.23 | 0.33 | 0.28 | 0.25 | 0.20 | 0.22 | 0.27 | 0.28 |
| Sarcoma | 0.08 | 0.00 | 0.16 | 0.19 | 0.05 | 0.02 | 0.21 | −0.13 | 0.05 |
| Skin cutaneous melanoma | 0.11 | 0.15 | 0.15 | 0.14 | 0.11 | 0.02 | 0.21 | 0.05 | 0.11 |
| Stomach adenocarcinoma | 0.26 | 0.21 | 0.29 | 0.18 | 0.07 | 0.16 | 0.26 | 0.08 | 0.02 |
| Testicular germ cell tumors | 0.07 | −0.06 | 0.11 | 0.05 | 0.08 | −0.03 | −0.06 | −0.15 | 0.00 |
| Thyroid carcinoma | 0.41 | 0.34 | 0.37 | 0.43 | 0.28 | 0.24 | 0.39 | 0.12 | 0.41 |
| Thymoma | −0.25 | 0.28 | 0.71 | −0.07 | −0.02 | −0.25 | 0.32 | −0.23 | 0.11 |
| Uterine corpus endometrial carcinoma | 0.00 | −0.06 | −0.02 | 0.08 | 0.08 | −0.03 | 0.11 | −0.12 | 0.05 |
| Uterine carcinosarcoma | −0.02 | 0.06 | 0.08 | 0.33 | −0.04 | 0.04 | 0.18 | −0.03 | 0.09 |
| Name of the Cancer | CXCL1 | CXCL2 | CXCL3 | CXCL5 | CXCL6 | PPBP | CXCL8 | CXCR1 | CXCR2 |
|---|---|---|---|---|---|---|---|---|---|
| Adrenocortical carcinoma | −0.01 | 0.03 | 0.08 | 0.02 | 0.14 | 0.09 | 0.11 | 0.02 | 0.07 |
| Bladder urothelial carcinoma | 0.25 | 0.52 | 0.41 | 0.41 | 0.24 | 0.20 | 0.19 | 0.39 | −0.15 |
| Breast invasive carcinoma | 0.36 | 0.40 | 0.39 | 0.38 | 0.27 | 0.23 | 0.33 | 0.18 | 0.31 |
| Cervical squamous cell carcinoma and endocervical adenocarcinoma | −0.05 | 0.13 | 0.05 | 0.25 | 0.10 | 0.06 | −0.01 | 0.11 | 0.01 |
| Cholangiocarcinoma | 0.18 | 0.09 | 0.23 | 0.26 | 0.29 | 0.11 | 0.24 | 0.24 | 0.20 |
| Colon adenocarcinoma | 0.05 | −0.07 | −0.10 | 0.27 | 0.34 | 0.25 | 0.40 | 0.47 | 0.40 |
| Lymphoid neoplasm diffuse large B-cell lymphoma | 0.29 | 0.41 | 0.49 | 0.50 | 0.10 | 0.08 | 0.26 | 0.43 | 0.64 |
| Esophageal carcinoma | −0.05 | 0.02 | −0.08 | 0.16 | 0.16 | 0.01 | 0.06 | 0.09 | −0.08 |
| Glioblastoma multiforme | 0.26 | 0.18 | 0.36 | 0.31 | 0.24 | 0.23 | 0.26 | 0.14 | 0.15 |
| Head and neck squamous cell carcinoma | 0.01 | 0.25 | 0.25 | 0.21 | 0.13 | −0.03 | 0.02 | 0.17 | −0.07 |
| Kidney chromophobe | 0.43 | 0.48 | 0.47 | 0.35 | 0.18 | 0.35 | 0.44 | 0.32 | 0.36 |
| Kidney renal clear cell carcinoma | 0.09 | 0.11 | 0.11 | 0.25 | 0.15 | 0.12 | 0.13 | 0.10 | 0.14 |
| Kidney renal papillary cell carcinoma | 0.32 | 0.20 | 0.31 | 0.29 | 0.35 | 0.25 | 0.42 | 0.25 | 0.30 |
| Acute myeloid leukemia | 0.02 | −0.06 | −0.11 | −0.14 | −0.07 | −0.15 | 0.02 | 0.08 | 0.16 |
| Brain lower grade glioma | 0.04 | 0.17 | 0.11 | −0.09 | 0.18 | 0.02 | 0.16 | 0.11 | 0.46 |
| Liver hepatocellular carcinoma | 0.43 | 0.18 | 0.39 | 0.34 | 0.46 | 0.17 | 0.44 | 0.29 | 0.42 |
| Lung adenocarcinoma | 0.19 | 0.11 | 0.14 | 0.14 | 0.21 | 0.27 | 0.13 | 0.17 | 0.30 |
| Lung squamous cell carcinoma | 0.06 | 0.29 | 0.27 | 0.39 | 0.07 | 0.33 | 0.06 | 0.24 | 0.09 |
| Ovarian serous cystadenocarcinoma | 0.15 | 0.16 | 0.13 | 0.19 | 0.21 | 0.21 | 0.17 | 0.31 | 0.30 |
| Pancreatic adenocarcinoma | 0.21 | 0.24 | 0.03 | 0.16 | 0.19 | 0.38 | 0.34 | 0.31 | 0.42 |
| Pheochromocytoma and paraganglioma | 0.09 | 0.17 | 0.20 | 0.04 | 0.04 | 0.14 | 0.17 | 0.08 | 0.06 |
| Prostate adenocarcinoma | 0.26 | 0.29 | 0.25 | 0.24 | 0.33 | 0.22 | 0.27 | 0.32 | 0.36 |
| Rectum adenocarcinoma | 0.04 | −0.04 | −0.13 | 0.33 | 0.20 | 0.26 | 0.40 | 0.47 | 0.34 |
| Sarcoma | 0.18 | 0.05 | 0.25 | 0.17 | 0.14 | 0.15 | 0.26 | 0.08 | 0.05 |
| Skin cutaneous melanoma | 0.10 | −0.05 | 0.01 | 0.03 | 0.02 | 0.01 | 0.10 | −0.04 | −0.02 |
| Stomach adenocarcinoma | −0.05 | −0.07 | −0.17 | 0.01 | 0.08 | −0.02 | 0.02 | 0.16 | 0.16 |
| Testicular germ cell tumors | 0.54 | 0.57 | 0.58 | 0.41 | 0.45 | 0.23 | 0.48 | 0.21 | 0.31 |
| Thyroid carcinoma | 0.02 | 0.21 | 0.16 | 0.04 | 0.09 | 0.11 | 0.13 | 0.22 | 0.13 |
| Thymoma | 0.46 | 0.17 | 0.31 | 0.52 | 0.56 | −0.12 | 0.32 | 0.19 | 0.30 |
| Uterine corpus endometrial carcinoma | 0.17 | 0.17 | 0.18 | 0.18 | 0.11 | 0.01 | 0.17 | 0.16 | 0.22 |
| Uterine carcinosarcoma | 0.17 | 0.30 | 0.26 | 0.35 | 0.07 | 0.19 | 0.32 | 0.26 | 0.11 |
| Name of the Cancer | CXCL1 | CXCL2 | CXCL3 | CXCL5 | CXCL6 | PPBP | CXCL8 | CXCR1 | CXCR2 |
|---|---|---|---|---|---|---|---|---|---|
| Adrenocortical carcinoma | 0.11 | 0.20 | 0.11 | 0.00 | 0.16 | −0.02 | 0.18 | −0.14 | −0.10 |
| Bladder urothelial carcinoma | 0.19 | 0.30 | 0.26 | 0.33 | 0.25 | 0.10 | 0.17 | 0.22 | −0.13 |
| Breast invasive carcinoma | 0.10 | −0.01 | 0.10 | 0.15 | 0.04 | 0.11 | 0.33 | 0.09 | 0.19 |
| Cervical squamous cell carcinoma and endocervical adenocarcinoma | −0.03 | 0.19 | 0.19 | 0.36 | 0.02 | 0.22 | 0.06 | 0.11 | −0.13 |
| Cholangiocarcinoma | −0.10 | −0.05 | −0.07 | −0.10 | −0.02 | 0.20 | 0.11 | 0.00 | 0.02 |
| Colon adenocarcinoma | −0.15 | −0.21 | −0.25 | 0.11 | 0.16 | 0.20 | 0.22 | 0.28 | 0.25 |
| Lymphoid neoplasm diffuse large B-cell lymphoma | 0.15 | 0.24 | 0.30 | 0.39 | 0.42 | 0.06 | 0.24 | 0.18 | 0.28 |
| Esophageal carcinoma | −0.25 | −0.17 | −0.33 | 0.05 | 0.01 | −0.17 | −0.01 | −0.15 | −0.10 |
| Glioblastoma multiforme | 0.12 | 0.10 | 0.16 | 0.12 | 0.01 | 0.10 | 0.04 | 0.10 | 0.17 |
| Head and neck squamous cell carcinoma | −0.04 | 0.14 | 0.19 | 0.21 | 0.09 | 0.01 | 0.07 | 0.04 | −0.08 |
| Kidney chromophobe | 0.47 | 0.20 | 0.31 | 0.44 | 0.29 | 0.08 | 0.48 | 0.05 | 0.09 |
| Kidney renal clear cell carcinoma | 0.03 | −0.01 | 0.00 | 0.08 | 0.08 | 0.12 | 0.14 | 0.31 | 0.42 |
| Kidney renal papillary cell carcinoma | 0.15 | 0.05 | 0.09 | 0.27 | 0.32 | 0.19 | 0.22 | 0.11 | 0.24 |
| Acute myeloid leukemia | 0.03 | 0.15 | 0.13 | 0.17 | 0.02 | 0.02 | −0.05 | −0.02 | −0.25 |
| Brain lower grade glioma | −0.04 | −0.04 | −0.02 | 0.09 | 0.06 | −0.05 | 0.11 | 0.08 | 0.27 |
| Liver hepatocellular carcinoma | 0.15 | 0.10 | 0.20 | 0.08 | 0.14 | 0.00 | 0.20 | 0.15 | 0.28 |
| Lung adenocarcinoma | 0.16 | −0.03 | 0.10 | 0.24 | 0.27 | 0.04 | 0.27 | 0.16 | 0.13 |
| Lung squamous cell carcinoma | −0.01 | 0.07 | 0.10 | 0.15 | 0.02 | 0.17 | 0.02 | 0.11 | 0.07 |
| Ovarian serous cystadenocarcinoma | −0.06 | 0.00 | −0.03 | 0.12 | 0.06 | 0.10 | 0.07 | 0.11 | 0.03 |
| Pancreatic adenocarcinoma | 0.13 | 0.04 | −0.07 | 0.13 | 0.16 | 0.25 | 0.25 | 0.15 | 0.24 |
| Pheochromocytoma and paraganglioma | 0.20 | 0.13 | 0.23 | 0.28 | 0.16 | 0.07 | 0.24 | 0.16 | 0.30 |
| Prostate adenocarcinoma | 0.13 | 0.16 | 0.17 | 0.14 | 0.21 | 0.14 | 0.18 | 0.23 | 0.29 |
| Rectum adenocarcinoma | −0.23 | −0.20 | −0.35 | 0.13 | 0.07 | 0.21 | 0.20 | 0.23 | 0.10 |
| Sarcoma | −0.13 | −0.23 | 0.03 | 0.10 | −0.05 | 0.04 | 0.07 | −0.20 | 0.04 |
| Skin cutaneous melanoma | −0.03 | 0.11 | 0.12 | 0.11 | 0.10 | 0.05 | 0.15 | −0.08 | 0.04 |
| Stomach adenocarcinoma | −0.13 | −0.08 | −0.27 | −0.04 | 0.00 | 0.07 | 0.02 | 0.05 | 0.03 |
| Testicular germ cell tumors | 0.07 | 0.01 | 0.13 | 0.05 | 0.26 | −0.04 | −0.14 | −0.14 | −0.02 |
| Thyroid carcinoma | −0.21 | −0.09 | −0.16 | −0.28 | −0.13 | −0.06 | −0.14 | 0.10 | −0.07 |
| Thymoma | 0.46 | 0.03 | 0.04 | 0.48 | 0.53 | 0.00 | −0.02 | 0.03 | 0.10 |
| Uterine corpus endometrial carcinoma | −0.04 | −0.07 | 0.01 | 0.12 | 0.15 | 0.03 | 0.03 | −0.03 | 0.01 |
| Uterine carcinosarcoma | 0.24 | 0.28 | 0.24 | 0.23 | −0.08 | 0.31 | 0.22 | 0.13 | 0.19 |
| Name of the Cancer | CXCL1 | CXCL2 | CXCL3 | CXCL5 | CXCL6 | PPBP | CXCL8 | CXCR1 | CXCR2 |
|---|---|---|---|---|---|---|---|---|---|
| Adrenocortical carcinoma | −0.10 | 0.02 | 0.09 | 0.11 | 0.02 | −0.03 | 0.14 | 0.22 | 0.14 |
| Bladder urothelial carcinoma | −0.06 | −0.18 | −0.13 | −0.07 | 0.08 | −0.10 | 0.05 | −0.09 | 0.29 |
| Breast invasive carcinoma | −0.23 | −0.30 | −0.25 | −0.13 | −0.13 | −0.07 | −0.05 | 0.09 | 0.03 |
| Cervical squamous cell carcinoma and endocervical adenocarcinoma | 0.18 | 0.01 | 0.02 | 0.05 | 0.22 | 0.06 | 0.19 | 0.08 | 0.14 |
| Cholangiocarcinoma | −0.06 | −0.08 | −0.08 | −0.17 | −0.29 | −0.09 | 0.06 | −0.31 | −0.21 |
| Colon adenocarcinoma | −0.11 | −0.04 | −0.07 | −0.04 | −0.01 | −0.04 | −0.10 | 0.06 | 0.13 |
| Lymphoid neoplasm diffuse large B-cell lymphoma | 0.00 | 0.15 | 0.23 | 0.24 | −0.03 | 0.18 | −0.09 | 0.42 | 0.46 |
| Esophageal carcinoma | 0.07 | −0.04 | 0.04 | −0.03 | 0.05 | 0.01 | 0.05 | 0.03 | 0.13 |
| Glioblastoma multiforme | −0.16 | −0.15 | −0.25 | −0.28 | −0.29 | −0.19 | −0.27 | −0.12 | −0.05 |
| Head and neck squamous cell carcinoma | −0.03 | −0.09 | −0.04 | 0.19 | 0.13 | 0.13 | 0.17 | 0.15 | 0.34 |
| Kidney chromophobe | 0.09 | 0.04 | −0.03 | 0.13 | 0.02 | −0.11 | 0.13 | 0.07 | 0.20 |
| Kidney renal clear cell carcinoma | −0.10 | −0.13 | −0.11 | −0.08 | −0.03 | −0.10 | −0.07 | 0.06 | 0.17 |
| Kidney renal papillary cell carcinoma | −0.04 | 0.03 | 0.02 | −0.05 | 0.00 | 0.04 | −0.06 | 0.01 | 0.12 |
| Acute myeloid leukemia | 0.23 | 0.13 | 0.17 | 0.36 | 0.07 | 0.39 | 0.00 | 0.21 | −0.01 |
| Brain lower grade glioma | −0.13 | 0.23 | 0.22 | 0.17 | 0.10 | −0.04 | −0.05 | 0.03 | 0.15 |
| Liver hepatocellular carcinoma | 0.20 | 0.11 | 0.15 | 0.13 | 0.21 | −0.03 | 0.14 | 0.05 | 0.16 |
| Lung adenocarcinoma | 0.00 | −0.02 | −0.06 | −0.03 | 0.02 | 0.09 | 0.01 | −0.07 | 0.02 |
| Lung squamous cell carcinoma | −0.09 | −0.13 | −0.20 | −0.15 | −0.07 | −0.08 | −0.15 | −0.10 | 0.04 |
| Ovarian serous cystadenocarcinoma | 0.04 | −0.05 | −0.02 | 0.10 | 0.09 | 0.00 | 0.08 | 0.28 | 0.35 |
| Pancreatic adenocarcinoma | 0.06 | −0.09 | 0.18 | 0.14 | 0.12 | 0.06 | 0.21 | 0.01 | 0.01 |
| Pheochromocytoma and paraganglioma | 0.19 | 0.13 | 0.22 | 0.16 | 0.11 | 0.12 | 0.09 | 0.13 | 0.11 |
| Prostate adenocarcinoma | 0.08 | 0.04 | 0.06 | 0.19 | 0.16 | 0.05 | 0.23 | 0.23 | 0.27 |
| Rectum adenocarcinoma | 0.03 | −0.07 | 0.11 | −0.07 | 0.02 | 0.04 | −0.07 | 0.02 | 0.07 |
| Sarcoma | −0.32 | −0.02 | −0.18 | −0.10 | −0.19 | −0.18 | −0.23 | −0.21 | −0.09 |
| Skin cutaneous melanoma | 0.22 | −0.11 | −0.10 | −0.06 | 0.02 | −0.07 | −0.07 | 0.06 | 0.06 |
| Stomach adenocarcinoma | 0.21 | 0.09 | 0.19 | 0.08 | 0.15 | 0.09 | 0.20 | 0.15 | 0.14 |
| Testicular germ cell tumors | 0.20 | 0.21 | 0.16 | 0.49 | 0.05 | 0.44 | 0.37 | 0.40 | 0.24 |
| Thyroid carcinoma | 0.05 | 0.10 | 0.11 | 0.12 | 0.06 | 0.12 | 0.15 | 0.10 | 0.11 |
| Thymoma | 0.38 | −0.01 | −0.37 | 0.33 | 0.28 | 0.18 | 0.11 | 0.22 | 0.32 |
| Uterine corpus endometrial carcinoma | 0.20 | 0.17 | 0.19 | 0.29 | 0.21 | 0.15 | 0.38 | 0.25 | 0.38 |
| Uterine carcinosarcoma | 0.55 | 0.20 | 0.30 | 0.19 | 0.13 | 0.09 | 0.32 | 0.22 | 0.18 |
| Name of the Cancer | CXCL1 | CXCL2 | CXCL3 | CXCL5 | CXCL6 | PPBP | CXCL8 | CXCR1 | CXCR2 |
|---|---|---|---|---|---|---|---|---|---|
| Adrenocortical carcinoma | −0.14 | −0.03 | 0.18 | 0.13 | 0.01 | −0.23 | −0.10 | −0.22 | 0.12 |
| Bladder urothelial carcinoma | 0.18 | 0.14 | 0.18 | 0.16 | 0.10 | −0.01 | 0.19 | 0.12 | 0.02 |
| Breast invasive carcinoma | 0.017 | −0.01 | 0.01 | 0.02 | −0.02 | −0.05 | 0.18 * | −0.02 | 0.12 |
| Cervical squamous cell carcinoma and endocervical adenocarcinoma | −0.02 | −0.03 | −0.04 | 0.05 | 0.16 * | −0.01 | 0.03 | −0.06 | 0.03 |
| Cholangiocarcinoma | −0.20 | −0.05 | −0.15 | −0.29 | −0.17 | −0.24 | −0.15 | −0.14 | 0.00 |
| Colon adenocarcinoma | 0.07 | 0.07 | 0.08 | 0.10 | 0.14 | 0.03 | 0.08 | 0.17 | 0.23 |
| Lymphoid neoplasm diffuse large B-cell lymphoma | −0.30 | −0.27 | −0.13 | −0.01 | −0.22 | −0.17 | −0.28 | −0.21 | 0.10 |
| Esophageal carcinoma | −0.06 | −0.08 * | −0.08 * | −0.07 | 0.00 | −0.08 | 0.03 | −0.09 | 0.05 |
| Glioblastoma multiforme | 0.12 | 0.12 | 0.11 | 0.21 | 0.10 | −0.16 | −0.01 | 0.06 | 0.08 |
| Head and neck squamous cell carcinoma | 0.016 | 0.02 | 0.05 | 0.01 | −0.07 | 0.03 | 0.02 | 0.11 * | 0.09 * |
| Kidney chromophobe | 0.00 | 0.06 | 0.10 | −0.01 | −0.14 | −0.23 | −0.02 | −0.15 | −0.03 |
| Kidney renal clear cell carcinoma | −0.01 | −0.05 | −0.03 | −0.01 | 0.05 | −0.05 | −0.02 | −0.04 | −0.04 |
| Kidney renal papillary cell carcinoma | −0.13 * | −0.02 | −0.11 | −0.23 * | −0.19 * | −0.04 | −0.07 | −0.10 * | −0.05 * |
| Acute myeloid leukemia | N/A | N/A | N/A | N/A | N/A | N/A | N/A | N/A | N/A |
| Brain lower grade glioma | 0.05 | −0.01 * | −0.02 | 0.04 * | −0.03 | −0.08 | 0.07 | 0.11 | −0.02 |
| Liver hepatocellular carcinoma | −0.02 * | 0.10 | −0.01 * | −0.12 * | −0.04 * | −0.09 | 0.07 * | 0.05 | 0.06 |
| Lung adenocarcinoma | 0.04 | 0.08 | 0.07 | 0.05 | −0.06 | −0.01 | 0.11 * | 0.07 | 0.13 |
| Lung squamous cell carcinoma | 0.02 | 0.14 | 0.13 | 0.10 | 0.02 | −0.02 | 0.08 | 0.09 | 0.02 |
| Ovarian serous cystadenocarcinoma | −0.03 | −0.02 | −0.04 | −0.11 | −0.02 | −0.05 | −0.02 | 0.01 | 0.05 |
| Pancreatic adenocarcinoma | −0.14 * | −0.05 * | 0.01 | 0.10 | −0.14 | 0.14 * | 0.02 * | 0.13 | 0.17 |
| Pheochromocytoma and paraganglioma | 0.13 | 0.08 | 0.15 | 0.15 * | 0.04 | 0.05 | 0.20 | 0.11 | 0.04 |
| Prostate adenocarcinoma | −0.05 | −0.02 | −0.02 | −0.08 | −0.03 | −0.04 | 0.10 | 0.08 | 0.01 |
| Rectum adenocarcinoma | 0.14 | 0.24 | 0.21 * | 0.18 | 0.16 | 0.16 | 0.15 | 0.11 * | 0.20 |
| Sarcoma | 0.08 | 0.07 * | 0.11 | −0.02 | 0.06 | 0.11 | 0.13 | 0.10 | 0.05 |
| Skin cutaneous melanoma | 0.16 * | 0.05 | 0.09 | −0.04 | −0.08 | −0.02 | 0.22 | −0.10 * | −0.08 |
| Stomach adenocarcinoma | 0.13 * | 0.05 | 0.13 * | 0.06 | 0.02 | −0.01 | 0.15 * | 0.11 | 0.18 |
| Testicular germ cell tumors | −0.25 * | −0.15 * | −0.06 * | −0.39 * | −0.13 * | −0.34 * | −0.20 * | −0.26 * | −0.18 * |
| Thyroid carcinoma | 0.27 | 0.21 | 0.27 | 0.40 | 0.11 | 0.23 | 0.36 | 0.00 | 0.26 |
| Thymoma | 0.20 | 0.16 | 0.16 | 0.17 * | 0.19 | 0.05 | 0.20 * | −0.02 | 0.22 |
| Uterine corpus endometrial carcinoma | 0.08 | 0.17 | 0.17 | −0.02 | 0.09 | −0.03 | 0.05 | 0.03 | −0.06 * |
| Uterine carcinosarcoma | −0.08 * | −0.05 | −0.07 * | −0.18 | 0.12 | −0.29 * | −0.20 | 0.07 | −0.03 |
| Name of the Cancer | CXCL1 | CXCL2 | CXCL3 | CXCL5 | CXCL6 | PPBP | CXCL8 | CXCR1 | CXCR2 |
|---|---|---|---|---|---|---|---|---|---|
| Adrenocortical carcinoma | 0.13 | 0.00 | 0.15 | 0.15 | −0.08 | 0.22 * | 0.14 | 0.14 * | 0.21 * |
| Bladder urothelial carcinoma | 0.23 | 0.18 | 0.20 | 0.21 | 0.19 | 0.23 | 0.30 | 0.24 | 0.15 |
| Breast invasive carcinoma | 0.12 | 0.09 | 0.11 | 0.09 | 0.13 | 0.13 | 0.09 * | 0.10 * | 0.13 |
| Cervical squamous cell carcinoma and endocervical adenocarcinoma | 0.26 | 0.19 | 0.24 | 0.15 | 0.22 | 0.23 | 0.32 | 0.38 | 0.24 |
| Cholangiocarcinoma | 0.05 | −0.22 | 0.12 | −0.08 | −0.02 | 0.32 | 0.16 | 0.14 | 0.12 |
| Colon adenocarcinoma | 0.27 | 0.25 | 0.25 | 0.35 | 0.36 | 0.18 | 0.43 | 0.58 | 0.54 |
| Lymphoid neoplasm diffuse large B-cell lymphoma | 0.38 | 0.31 | 0.31 | 0.27 | 0.11 | −0.03 | 0.13 | 0.26 | 0.13 |
| Esophageal carcinoma | 0.31 | 0.16 | 0.23 | 0.19 | 0.24 | 0.30 | 0.29 | 0.34 | 0.35 |
| Glioblastoma multiforme | 0.09 * | 0.07 * | 0.11 * | 0.10 * | 0.12 | 0.16 | 0.11 | 0.17 * | 0.18 |
| Head and neck squamous cell carcinoma | 0.32 | 0.20 | 0.19 | 0.24 | 0.26 | 0.32 | 0.33 | 0.40 | 0.43 |
| Kidney chromophobe | 0.02 | 0.01 | 0.22 * | −0.05 | −0.17 | 0.05 | −0.01 | −0.07 | −0.15 |
| Kidney renal clear cell carcinoma | 0.10 | 0.14 | 0.17 | 0.00 | 0.04 * | 0.20 | 0.21 | 0.29 | 0.25 |
| Kidney renal papillary cell carcinoma | 0.04 | −0.06 | 0.07 | 0.09 * | 0.12 * | 0.12 | 0.12 | 0.18 | 0.15 |
| Acute myeloid leukemia | N/A | N/A | N/A | N/A | N/A | N/A | N/A | N/A | N/A |
| Brain lower grade glioma | 0.12 | 0.18 * | 0.20 | 0.14 * | 0.09 | 0.08 | 0.18 | 0.20 | 0.29 |
| Liver hepatocellular carcinoma | 0.11 | 0.12 | 0.12 | 0.18 | 0.12 | 0.07 | 0.13 | 0.18 | 0.21 |
| Lung adenocarcinoma | 0.13 | 0.18 | 0.19 | 0.19 | 0.10 | 0.23 | 0.21 | 0.40 | 0.33 |
| Lung squamous cell carcinoma | 0.31 | 0.22 | 0.30 | 0.15 | 0.19 | 0.19 | 0.40 | 0.48 | 0.42 |
| Ovarian serous cystadenocarcinoma | 0.08 | 0.02 | 0.10 | −0.01 | 0.09 | 0.06 | 0.09 | 0.12 * | 0.10 |
| Pancreatic adenocarcinoma | 0.17 | 0.18 | 0.15 | 0.28 | −0.01 * | 0.05 * | 0.23 | 0.26 | 0.25 |
| Pheochromocytoma and paraganglioma | 0.18 | 0.20 | 0.17 | 0.22 | 0.18 | 0.30 | 0.21 | 0.36 | 0.36 |
| Prostate adenocarcinoma | 0.06 * | 0.07 * | 0.08 * | 0.03 * | 0.07 | 0.08 | 0.08 * | 0.12 | 0.11 |
| Rectum adenocarcinoma | 0.16 * | 0.16 | 0.19 | 0.21 | 0.26 | 0.03 | 0.19 * | 0.40 | 0.36 |
| Sarcoma | 0.16 | 0.22 | 0.04 * | 0.02 | 0.09 | 0.16 | 0.17 | 0.13 | 0.14 |
| Skin cutaneous melanoma | 0.09 * | 0.05 * | 0.09 | 0.09 | 0.06 | 0.02 | 0.13 | 0.06 | 0.09 * |
| Stomach adenocarcinoma | 0.27 | 0.26 | 0.25 | 0.32 | 0.27 | 0.26 | 0.40 | 0.56 | 0.53 |
| Testicular germ cell tumors | 0.02 | 0.05 | 0.11 | 0.25 * | −0.05 | 0.04 | 0.24 | 0.09 | 0.17 |
| Thyroid carcinoma | −0.08 * | −0.02 * | −0.03 * | −0.05 * | −0.05 | 0.06 * | 0.00 | 0.07 | −0.03 * |
| Thymoma | 0.35 | −0.09 | −0.02 | 0.29 | 0.36 * | 0.05 | 0.15 * | 0.11 | 0.25 |
| Uterine corpus endometrial carcinoma | 0.15 | 0.19 * | 0.14 | 0.21 * | 0.19 | 0.11 | 0.30 | 0.37 | 0.18 * |
| Uterine carcinosarcoma | −0.02 * | 0.16 | 0.06 * | −0.16 | 0.07 | 0.16 | 0.10 | −0.04 * | 0.10 |
| Name of the Cancer | CXCL1 | CXCL2 | CXCL3 | CXCL5 | CXCL6 | PPBP | CXCL8 | CXCR1 | CXCR2 |
|---|---|---|---|---|---|---|---|---|---|
| Adrenocortical carcinoma | 0.16 | 0.07 | 0.08 | −0.13 | 0.09 | −0.02 | 0.36 | 0.15 | 0.02 |
| Bladder urothelial carcinoma | 0.23 | 0.13 | 0.20 | 0.27 | 0.17 | 0.18 | 0.24 | −0.05 | −0.26 |
| Breast invasive carcinoma | 0.19 | 0.04 | 0.14 | 0.21 | 0.11 | 0.05 | 0.19 | −0.19 | −0.41 |
| Cervical squamous cell carcinoma and endocervical adenocarcinoma | 0.19 | 0.29 | 0.26 | 0.23 | 0.04 | 0.17 | 0.36 | 0.07 | −0.35 |
| Cholangiocarcinoma | 0.38 | 0.26 | 0.32 | 0.44 | 0.39 | 0.15 | 0.34 | 0.32 | 0.27 |
| Colon adenocarcinoma | 0.02 | 0.07 | 0.06 | 0.00 | −0.10 | 0.02 | −0.09 | −0.37 | −0.34 |
| Lymphoid neoplasm diffuse large B-cell lymphoma | −0.03 | 0.10 | 0.00 | 0.04 | 0.15 | 0.38 | 0.16 | 0.06 | −0.19 |
| Esophageal carcinoma | −0.01 | −0.24 | −0.26 | 0.16 | 0.10 | −0.04 | 0.15 | −0.21 | −0.21 |
| Glioblastoma multiforme | 0.00 | −0.14 | −0.03 | −0.18 | 0.05 | −0.08 | −0.01 | −0.16 | −0.46 |
| Head and neck squamous cell carcinoma | 0.14 | 0.18 | 0.24 | 0.23 | 0.13 | 0.08 | 0.25 | −0.05 | −0.34 |
| Kidney chromophobe | −0.18 | −0.32 | −0.29 | −0.13 | 0.04 | −0.04 | −0.15 | −0.11 | −0.15 |
| Kidney renal clear cell carcinoma | 0.08 | 0.09 | 0.05 | 0.09 | 0.05 | 0.04 | 0.00 | −0.18 | −0.32 |
| Kidney renal papillary cell carcinoma | −0.15 | −0.24 | −0.16 | −0.11 | −0.08 | −0.07 | −0.15 | −0.19 | −0.24 |
| Acute myeloid leukemia | N/A | N/A | N/A | N/A | N/A | N/A | N/A | N/A | N/A |
| Brain lower grade glioma | 0.01 | −0.24 | −0.28 | −0.25 | −0.15 | 0.00 | −0.09 | −0.05 | −0.27 |
| Liver hepatocellular carcinoma | 0.22 | −0.19 | 0.28 | 0.33 | 0.23 | −0.11 | 0.20 | −0.04 | −0.02 |
| Lung adenocarcinoma | 0.10 | −0.12 | 0.05 | 0.13 | 0.12 | −0.07 | 0.32 | −0.16 | −0.37 |
| Lung squamous cell carcinoma | 0.20 | −0.16 | 0.00 | −0.05 | 0.15 | −0.09 | 0.03 | −0.19 | −0.29 |
| Ovarian serous cystadenocarcinoma | −0.06 | −0.06 | −0.05 | 0.05 | −0.03 | 0.11 | 0.00 | −0.23 | −0.42 |
| Pancreatic adenocarcinoma | −0.05 | −0.17 | −0.05 | 0.00 | −0.14 | −0.04 | −0.02 | −0.24 | −0.44 |
| Pheochromocytoma and paraganglioma | −0.49 | −0.43 | −0.38 | −0.33 | −0.13 | −0.36 | −0.40 | −0.27 | −0.32 |
| Prostate adenocarcinoma | −0.24 | −0.23 | −0.21 | −0.22 | −0.21 | −0.06 | −0.14 | −0.32 | −0.40 |
| Rectum adenocarcinoma | 0.07 | 0.10 | 0.09 | 0.22 | 0.17 | 0.14 | 0.02 | −0.24 | −0.20 |
| Sarcoma | −0.20 | −0.33 | −0.08 | 0.06 | −0.13 | 0.03 | −0.02 | −0.29 | −0.32 |
| Skin cutaneous melanoma | 0.20 | 0.13 | 0.25 | 0.23 | 0.23 | 0.20 | 0.29 | 0.08 | −0.01 |
| Stomach adenocarcinoma | 0.18 | 0.22 | 0.16 | 0.07 | 0.14 | 0.26 | 0.16 | −0.17 | −0.23 |
| Testicular germ cell tumors | −0.15 | −0.22 | −0.16 | 0.15 | −0.24 | 0.19 | −0.05 | 0.10 | −0.02 |
| Thyroid carcinoma | −0.21 | −0.12 | −0.14 | −0.18 | −0.22 | −0.02 | −0.16 | −0.17 | −0.44 |
| Thymoma | 0.21 | −0.08 | 0.12 | 0.03 | 0.14 | −0.24 | 0.12 | −0.25 | −0.03 |
| Uterine corpus endometrial carcinoma | −0.02 | −0.23 | −0.12 | −0.14 | 0.00 | −0.02 | 0.01 | −0.35 | −0.40 |
| Uterine carcinosarcoma | −0.05 | −0.18 | −0.10 | 0.03 | −0.22 | 0.11 | 0.06 | −0.30 | −0.29 |
| Name of the Cancer | CXCL1 | CXCL2 | CXCL3 | CXCL5 | CXCL6 | PPBP | CXCL8 | CXCR1 | CXCR2 |
|---|---|---|---|---|---|---|---|---|---|
| Adrenocortical carcinoma | −0.05 | 0.00 | 0.06 | 0.11 | 0.21 | 0.15 | −0.04 | −0.09 | 0.06 |
| Bladder urothelial carcinoma | −0.11 * | −0.05 | −0.09 | −0.14 * | −0.10 | −0.11 * | −0.11 * | −0.06 | 0.08 * |
| Breast invasive carcinoma | 0.12 | 0.01 | 0.07 | 0.06 | 0.12 | −0.04 | −0.04 | −0.02 | 0.06 |
| Cervical squamous cell carcinoma and endocervical adenocarcinoma | −0.17 | −0.13 * | −0.15 * | −0.14 * | −0.05 | −0.15 * | −0.29 | −0.14 * | 0.04 |
| Cholangiocarcinoma | −0.28 | −0.27 | −0.19 | −0.13 | −0.18 | −0.07 | −0.37 * | −0.32 | −0.17 |
| Colon adenocarcinoma | −0.03 | −0.02 | −0.02 | −0.16 | −0.08 | −0.22 | −0.10 | 0.04 | 0.07 |
| Lymphoid neoplasm diffuse large B-cell lymphoma | −0.05 | −0.02 | −0.03 | −0.13 | −0.38 * | −0.34 * | −0.36 * | 0.10 | 0.08 |
| Esophageal carcinoma | −0.13 | −0.05 | −0.09 | −0.15 | −0.22 * | −0.09 | −0.15 * | −0.08 | −0.05 |
| Glioblastoma multiforme | −0.08 | −0.17 | −0.17 | −0.09 | −0.07 | 0.01 | −0.20 * | −0.15 | −0.13 |
| Head and neck squamous cell carcinoma | −0.10 * | −0.09 | −0.10 | −0.24 | −0.17 | −0.19 | −0.25 | −0.01 | 0.13 * |
| Kidney chromophobe | 0.08 | −0.01 | 0.06 | −0.13 | 0.04 | 0.26 * | 0.21 | −0.03 | 0.04 |
| Kidney renal clear cell carcinoma | −0.11 | −0.07 | −0.09 | −0.06 | −0.15 | −0.06 | −0.15 | −0.10 * | −0.05 |
| Kidney renal papillary cell carcinoma | 0.06 | 0.09 | 0.13 | 0.10 | 0.07 | 0.00 | 0.02 * | 0.05 | 0.08 * |
| Acute myeloid leukemia | N/A | N/A | N/A | N/A | N/A | N/A | N/A | N/A | N/A |
| Brain lower grade glioma | −0.04 | 0.05 | 0.10 * | 0.00 | 0.05 | −0.04 | −0.04 | −0.03 | 0.01 |
| Liver hepatocellular carcinoma | −0.15 * | −0.05 | −0.02 * | −0.14 * | −0.21 * | −0.08 | −0.18 * | −0.04 | −0.06 |
| Lung adenocarcinoma | −0.12 * | −0.01 | −0.09 | −0.17 | −0.08 | −0.23 | −0.21 | −0.10 * | −0.11 * |
| Lung squamous cell carcinoma | −0.26 | −0.09 | −0.11 * | −0.07 | −0.17 | −0.11 * | −0.15 | −0.14 * | −0.05 |
| Ovarian serous cystadenocarcinoma | −0.10 | −0.15 | −0.11 | −0.08 | −0.03 | −0.26 | −0.13 * | −0.10 | 0.00 |
| Pancreatic adenocarcinoma | 0.09 | 0.12 | 0.00 | −0.05 | 0.16 | −0.01 | 0.04 | 0.21 | 0.31 |
| Pheochromocytoma and paraganglioma | −0.06 | −0.14 | −0.06 | −0.12 | −0.06 | −0.09 | −0.15 * | −0.09 | −0.08 |
| Prostate adenocarcinoma | 0.02 | −0.04 | 0.01 | 0.04 | 0.00 * | −0.04 | −0.05 * | −0.07 | −0.04 * |
| Rectum adenocarcinoma | −0.01 | 0.14 | −0.02 | −0.02 | −0.04 | 0.02 | 0.07 | 0.17 | 0.13 |
| Sarcoma | 0.05 | 0.11 | 0.10 | 0.00 | 0.02 | −0.06 | −0.03 | −0.07 | 0.00 |
| Skin cutaneous melanoma | −0.16 | 0.00 | −0.11 | −0.12 | −0.19 | −0.20 | −0.14 | −0.16 | −0.10 |
| Stomach adenocarcinoma | −0.18 | −0.19 | −0.12 | −0.16 | −0.24 | −0.24 | −0.22 | −0.11 | −0.10 * |
| Testicular germ cell tumors | −0.17 | −0.09 | −0.14 | −0.35 * | −0.08 | −0.31 | −0.31 | −0.20 * | −0.18 * |
| Thyroid carcinoma | −0.01 | −0.02 | −0.03 | −0.11 * | 0.11 | −0.21 | −0.08 | 0.10 | 0.18 * |
| Thymoma | −0.34 | 0.09 | 0.46 | −0.12 | −0.07 | −0.09 | 0.09 | −0.08 | −0.10 |
| Uterine corpus endometrial carcinoma | −0.07 | −0.01 | −0.05 | −0.15 | −0.07 | −0.08 | −0.26 * | 0.03 * | 0.02 |
| Uterine carcinosarcoma | −0.09 | −0.02 | −0.04 | −0.08 | 0.21 | 0.21 | −0.08 | 0.39 | 0.09 |
| Name of the Cancer | CXCL1 | CXCL2 | CXCL3 | CXCL5 | CXCL6 | PPBP | CXCL8 | CXCR1 | CXCR2 |
|---|---|---|---|---|---|---|---|---|---|
| Adrenocortical carcinoma | −0.09 | −0.22 | −0.08 | 0.10 | −0.01 | −0.08 | −0.06 | −0.06 | 0.08 |
| Bladder urothelial carcinoma | 0.02 | 0.03 | 0.04 | 0.01 | −0.02 | −0.03 | −0.01 | −0.04 | −0.03 |
| Breast invasive carcinoma | −0.02 | −0.06 | −0.05 | −0.04 | 0.02 | −0.02 | −0.04 | 0.00 | −0.07 |
| Cervical squamous cell carcinoma and endocervical adenocarcinoma | 0.03 | 0.03 | 0.01 | 0.06 | −0.01 | 0.02 | 0.07 | 0.02 | 0.00 |
| Cholangiocarcinoma | −0.01 | −0.22 | −0.31 | −0.05 | 0.10 | −0.48 * | −0.18 | −0.31 | −0.35 |
| Colon adenocarcinoma | −0.02 | 0.00 | −0.01 | −0.02 | −0.07 | −0.18 * | 0.02 | −0.08 | −0.09 |
| Lymphoid neoplasm diffuse large B-cell lymphoma | 0.29 | 0.39 | 0.35 | 0.16 | −0.15 | 0.14 | 0.24 | 0.26 | 0.37 * |
| Esophageal carcinoma | −0.04 | 0.01 | −0.03 | −0.14 | −0.03 | −0.09 | −0.07 | −0.16 * | −0.10 |
| Glioblastoma multiforme | −0.06 | −0.06 | 0.00 | 0.00 | −0.06 | 0.02 | −0.04 | 0.02 | −0.07 |
| Head and neck squamous cell carcinoma | −0.02 | 0.00 | 0.03 | 0.03 | 0.00 | 0.04 * | 0.06 | −0.02 | −0.02 |
| Kidney chromophobe | 0.18 | 0.07 | 0.06 | 0.00 | 0.11 | −0.05 | 0.10 | −0.28 * | −0.12 |
| Kidney renal clear cell carcinoma | −0.01 | 0.00 | 0.05 | 0.01 | −0.04 | −0.02 | −0.05 * | 0.01 | −0.04 |
| Kidney renal papillary cell carcinoma | −0.03 * | 0.07 | 0.00 * | −0.06 | −0.06 | −0.16 * | −0.11 | −0.14 * | −0.13 * |
| Acute myeloid leukemia | N/A | N/A | N/A | N/A | N/A | N/A | N/A | N/A | N/A |
| Brain lower grade glioma | 0.04 | 0.03 * | 0.11 | 0.10 | −0.04 | 0.01 | 0.07 | −0.02 | −0.04 |
| Liver hepatocellular carcinoma | 0.03 | 0.03 | 0.05 | 0.06 | 0.08 | −0.06 | 0.01 | −0.11 * | −0.09 |
| Lung adenocarcinoma | −0.01 | 0.01 | 0.00 | −0.06 | −0.07 | −0.05 | −0.04 | −0.08 | −0.04 |
| Lung squamous cell carcinoma | −0.02 | −0.06 | −0.03 | −0.12 | −0.06 | −0.11 * | −0.02 | −0.03 | 0.04 |
| Ovarian serous cystadenocarcinoma | 0.01 | −0.06 | −0.04 | −0.13 | −0.03 | −0.14 | −0.03 | −0.21 * | −0.09 |
| Pancreatic adenocarcinoma | −0.15 | −0.22 * | −0.22 * | −0.07 | 0.00 | −0.13 | −0.23 * | −0.17 * | −0.08 |
| Pheochromocytoma and paraganglioma | 0.01 | 0.00 | 0.04 | −0.03 | −0.11 | −0.01 | 0.04 | −0.02 | −0.05 |
| Prostate adenocarcinoma | −0.01 | 0.02 | 0.00 | −0.01 | −0.01 | −0.02 | 0.03 | −0.03 | −0.05 |
| Rectum adenocarcinoma | 0.11 | 0.05 | 0.04 | −0.02 | 0.05 | 0.16 | 0.09 | −0.01 | 0.07 |
| Sarcoma | −0.02 | −0.07 | −0.06 | 0.03 | 0.01 | 0.10 | 0.08 | −0.02 | 0.03 |
| Skin cutaneous melanoma | 0.05 | −0.02 | −0.01 | −0.08 | −0.09 | −0.08 | 0.02 | −0.08 | −0.08 |
| Stomach adenocarcinoma | 0.02 | 0.04 | 0.05 | 0.02 | −0.03 | 0.03 | 0.06 | 0.05 | 0.05 |
| Testicular germ cell tumors | −0.22 | −0.22 * | −0.22 * | −0.27 | −0.18 * | −0.13 | −0.21 * | −0.09 | −0.17 * |
| Thyroid carcinoma | 0.06 | 0.01 | 0.04 | −0.01 | 0.05 * | 0.00 | 0.04 | 0.02 | −0.01 |
| Thymoma | 0.15 | −0.06 | 0.02 * | 0.14 | 0.18 | −0.01 | 0.12 | 0.18 | −0.17 |
| Uterine corpus endometrial carcinoma | −0.25 * | 0.09 | −0.02 | −0.04 | −0.25 * | 0.11 | −0.15 | 0.00 | −0.09 |
| Uterine carcinosarcoma | −0.20 | −0.45 * | −0.035 * | −0.22 | 0.04 | −0.03 | −0.28 * | −0.02 | 0.04 |
| Name of the Cancer | CXCL1 | CXCL2 | CXCL3 | CXCL5 | CXCL6 | PPBP | CXCL8 | CXCR1 | CXCR2 |
|---|---|---|---|---|---|---|---|---|---|
| Adrenocortical carcinoma | 0.01 | 0.18 | 0.16 | 0.02 | 0.15 | 0.21 | −0.05 | −0.05 | 0.14 |
| Bladder urothelial carcinoma | 0.16 | 0.22 | 0.20 | 0.22 | 0.08 | 0.11 | 0.08 | 0.13 | −0.07 |
| Breast invasive carcinoma | 0.29 | 0.17 | 0.23 | 0.24 | 0.27 | 0.09 | 0.16 | 0.08 | 0.18 |
| Cervical squamous cell carcinoma and endocervical adenocarcinoma | −0.16 | −0.13 | −0.16 | −0.12 | −0.07 | −0.17 | −0.30 | −0.10 | 0.07 |
| Cholangiocarcinoma | 0.03 | 0.06 | 0.22 | −0.09 | 0.00 | 0.29 | 0.07 | 0.05 | 0.16 |
| Colon adenocarcinoma | 0.15 | 0.07 | 0.06 | 0.25 | 0.31 | 0.12 | 0.44 | 0.49 | 0.47 |
| Lymphoid neoplasm diffuse large B-cell lymphoma | −0.05 | −0.19 | −0.09 | 0.03 | 0.08 | −0.35 | −0.13 | 0.13 | 0.32 |
| Esophageal carcinoma | −0.15 | −0.12 | −0.16 | −0.04 | −0.12 | 0.01 | 0.00 | 0.01 | −0.06 |
| Glioblastoma multiforme | 0.10 | −0.05 | 0.15 | 0.21 | 0.16 | 0.08 | 0.09 | 0.03 | 0.06 |
| Head and neck squamous cell carcinoma | −0.05 | 0.04 | 0.05 | 0.01 | −0.02 | −0.02 | −0.07 | 0.07 | 0.10 |
| Kidney chromophobe | 0.44 | 0.46 | 0.46 | 0.35 | 0.09 | 0.26 | 0.47 | 0.18 | 0.15 |
| Kidney renal clear cell carcinoma | 0.11 * | 0.08 | 0.17 | 0.21 | 0.13 | 0.03 | 0.36 | 0.13 | 0.24 |
| Kidney renal papillary cell carcinoma | 0.32 | 0.31 | 0.33 | 0.32 | 0.27 | 0.29 | 0.35 | 0.29 | 0.34 |
| Acute myeloid leukemia | N/A | N/A | N/A | N/A | N/A | N/A | N/A | N/A | N/A |
| Brain lower grade glioma | 0.09 | −0.05 | −0.07 | −0.06 | 0.02 | −0.08 | 0.05 | −0.06 | −0.02 * |
| Liver hepatocellular carcinoma | 0.13 | 0.04 | 0.14 | 0.06 | 0.03 | −0.14 * | 0.07 | 0.03 | 0.06 |
| Lung adenocarcinoma | 0.01 | 0.11 | −0.01 | 0.01 | 0.03 | 0.25 | −0.01 | 0.06 | 0.34 |
| Lung squamous cell carcinoma | −0.04 | 0.16 | 0.13 | 0.25 | 0.04 | 0.18 | 0.15 * | 0.25 | 0.20 |
| Ovarian serous cystadenocarcinoma | 0.22 | 0.17 | 0.17 | 0.11 | 0.20 | −0.04 | 0.21 | 0.16 | 0.14 |
| Pancreatic adenocarcinoma | 0.18 | 0.23 | 0.17 | 0.14 | 0.12 | 0.33 | 0.27 | 0.32 | 0.47 |
| Pheochromocytoma and paraganglioma | 0.41 | 0.39 | 0.38 | 0.21 | 0.08 | 0.23 | 0.39 | 0.16 | 0.21 |
| Prostate adenocarcinoma | 0.20 | 0.16 | 0.18 | 0.16 | 0.13 | 0.08 * | 0.16 | 0.16 | 0.12 |
| Rectum adenocarcinoma | 0.08 | 0.03 | −0.01 | 0.16 | 0.18 | 0.02 | 0.30 | 0.37 | 0.34 |
| Sarcoma | 0.46 | 0.46 | 0.36 | 0.27 | 0.34 | 0.12 | 0.25 | 0.27 | 0.30 |
| Skin cutaneous melanoma | −0.03 | 0.13 | 0.06 | 0.10 | −0.04 | −0.03 | −0.04 | 0.06 | 0.12 * |
| Stomach adenocarcinoma | 0.02 | −0.09 * | −0.02 | −0.03 | −0.04 * | −0.06 * | 0.09 | 0.23 | 0.23 |
| Testicular germ cell tumors | 0.37 | 0.42 | 0.35 | 0.20 | 0.33 | 0.01 | 0.35 | 0.20 | 0.30 |
| Thyroid carcinoma | 0.69 | 0.59 | 0.57 | 0.73 | 0.47 | 0.45 | 0.61 | 0.20 | 0.63 |
| Thymoma | −0.54 | 0.08 | 0.23 | −0.30 * | −0.31 * | −0.16 | −0.10 | −0.13 | −0.23 * |
| Uterine corpus endometrial carcinoma | 0.09 | 0.14 | 0.04 | −0.02 | −0.10 | 0.01 | 0.00 | 0.40 | 0.26 |
| Uterine carcinosarcoma | 0.21 | 0.40 | 0.33 | 0.09 | 0.15 | 0.25 | 0.19 | 0.36 | 0.17 |
| Name of the Cancer | CXCL1 | CXCL2 | CXCL3 | CXCL5 | CXCL6 | PPBP | CXCL8 | CXCR1 | CXCR2 |
|---|---|---|---|---|---|---|---|---|---|
| Adrenocortical carcinoma | 0.04 | 0.13 | −0.16 | −0.29 | −0.05 | 0.12 | 0.03 | 0.24 | 0.19 |
| Bladder urothelial carcinoma | 0.18 | 0.18 | 0.18 | 0.16 | 0.01 | 0.02 | 0.09 | 0.01 | −0.17 |
| Breast invasive carcinoma | 0.16 | −0.05 | 0.11 | 0.13 | 0.10 | 0.01 | 0.11 | 0.00 | 0.06 |
| Cervical squamous cell carcinoma and endocervical adenocarcinoma | −0.16 | −0.07 | −0.13 | −0.12 | −0.10 | −0.12 | −0.18 | −0.03 | 0.05 |
| Cholangiocarcinoma | −0.05 | 0.03 | 0.12 | 0.14 | 0.09 | 0.35 | 0.05 | 0.20 | 0.25 |
| Colon adenocarcinoma | 0.08 | 0.18 | 0.06 | 0.06 | 0.06 | −0.16 | 0.06 | 0.09 | 0.10 |
| Lymphoid neoplasm diffuse large B-cell lymphoma | 0.10 | 0.26 | 0.09 | 0.15 | −0.22 | −0.05 | −0.25 | −0.08 | −0.03 |
| Esophageal carcinoma | 0.13 | 0.17 | 0.19 | 0.08 | 0.02 | 0.04 | 0.05 | 0.17 | −0.04 |
| Glioblastoma multiforme | −0.10 | 0.01 | −0.05 | −0.01 | −0.10 | −0.05 | −0.18 | −0.17 | 0.05 |
| Head and neck squamous cell carcinoma | 0.01 | 0.01 | 0.00 | −0.24 | −0.13 | −0.18 | −0.20 | 0.07 | 0.04 |
| Kidney chromophobe | 0.06 | 0.03 | 0.11 | −0.16 | −0.16 | −0.07 | −0.01 | 0.20 | 0.03 |
| Kidney renal clear cell carcinoma | 0.05 | −0.03 | −0.06 | 0.04 | 0.03 | −0.06 | −0.02 | −0.10 | −0.06 |
| Kidney renal papillary cell carcinoma | 0.04 | 0.11 | 0.11 | 0.03 | −0.01 | −0.07 | 0.02 | 0.05 | 0.02 |
| Acute myeloid leukemia | N/A | N/A | N/A | N/A | N/A | N/A | N/A | N/A | N/A |
| Brain lower grade glioma | 0.00 | −0.08 | −0.02 | −0.02 | −0.05 | 0.06 | −0.02 | 0.09 | 0.16 |
| Liver hepatocellular carcinoma | −0.09 | −0.05 | −0.03 | −0.14 | −0.18 | −0.05 | −0.17 | 0.08 | 0.07 |
| Lung adenocarcinoma | 0.08 | 0.04 | 0.13 | 0.09 | 0.08 | −0.17 | 0.15 | 0.03 | −0.03 |
| Lung squamous cell carcinoma | −0.16 | −0.03 | 0.02 | 0.10 | −0.18 | −0.09 | −0.02 | −0.03 | −0.08 |
| Ovarian serous cystadenocarcinoma | 0.17 | 0.01 | 0.06 | 0.02 | 0.00 | −0.12 | 0.10 | −0.08 | −0.07 |
| Pancreatic adenocarcinoma | −0.07 | −0.07 | 0.04 | 0.18 | −0.05 | −0.09 | −0.03 | 0.13 | 0.09 |
| Pheochromocytoma and paraganglioma | −0.06 | −0.07 | −0.09 | −0.06 | −0.07 | 0.02 | −0.07 | −0.04 | 0.02 |
| Prostate adenocarcinoma | 0.05 | 0.05 | 0.06 | 0.04 | −0.04 | 0.07 | 0.08 | −0.02 | −0.04 |
| Rectum adenocarcinoma | 0.08 | 0.22 | 0.10 | 0.07 | 0.12 | −0.07 | 0.09 | 0.01 | 0.06 |
| Sarcoma | 0.11 | 0.23 | 0.26 | 0.15 | 0.10 | 0.02 | 0.02 | 0.07 | 0.06 |
| Skin cutaneous melanoma | −0.03 | 0.04 | −0.03 | −0.05 | −0.13 | −0.22 | −0.11 | −0.10 | −0.12 |
| Stomach adenocarcinoma | 0.22 | 0.10 | 0.26 | 0.07 | −0.07 | 0.03 | 0.20 | 0.15 | 0.11 |
| Testicular germ cell tumors | −0.15 | −0.11 | −0.14 | −0.25 | −0.16 | −0.30 | −0.20 | −0.18 | −0.04 |
| Thyroid carcinoma | 0.05 | −0.03 | 0.00 | −0.06 | 0.11 | −0.12 | −0.04 | 0.08 | 0.09 |
| Thymoma | −0.55 | 0.05 | 0.11 | −0.42 | −0.46 | 0.02 | −0.28 | 0.00 | −0.18 |
| Uterine corpus endometrial carcinoma | −0.05 | 0.02 | −0.07 | −0.10 | −0.15 | −0.07 | −0.25 | 0.18 | 0.04 |
| Uterine carcinosarcoma | −0.02 | 0.22 | 0.14 | −0.07 | −0.06 | 0.05 | −0.08 | 0.03 | −0.23 |
| Name of the Cancer | CXCL1 | CXCL2 | CXCL3 | CXCL5 | CXCL6 | PPBP | CXCL8 | CXCR1 | CXCR2 |
|---|---|---|---|---|---|---|---|---|---|
| Adrenocortical carcinoma | −0.09 | 0.03 | −0.08 | −0.16 | −0.17 | 0.15 | −0.26 | 0.17 | 0.06 |
| Bladder urothelial carcinoma | −0.20 | 0.10 | −0.06 | −0.04 | −0.18 * | 0.03 | −0.20 | 0.17 | −0.06 |
| Breast invasive carcinoma | −0.08 | 0.15 | −0.05 | −0.12 | 0.00 | 0.12 | −0.12 | 0.16 | 0.12 |
| Cervical squamous cell carcinoma and endocervical adenocarcinoma | −0.03 | 0.15 | 0.12 * | 0.21 | −0.03 * | 0.15 | 0.00 * | 0.22 | −0.02 |
| Cholangiocarcinoma | 0.10 | −0.04 | −0.05 | −0.08 | −0.08 | 0.13 | −0.14 | −0.05 | −0.09 |
| Colon adenocarcinoma | 0.06 | −0.02 | −0.08 * | 0.24 | 0.25 | 0.17 | 0.28 | 0.42 | 0.38 |
| Lymphoid neoplasm diffuse large B-cell lymphoma | 0.19 | 0.34 | 0.09 | 0.24 | −0.01 | 0.41 | 0.13 | 0.03 | −0.29 |
| Esophageal carcinoma | 0.21 | 0.37 | 0.33 | 0.20 | 0.17 | 0.17 * | 0.01 | 0.26 | 0.03 |
| Glioblastoma multiforme | 0.15 | −0.10 | −0.09 | 0.00 | 0.03 | 0.09 | 0.09 | 0.17 | 0.10 |
| Head and neck squamous cell carcinoma | 0.02 | 0.18 | 0.14 | 0.27 | 0.24 | 0.23 | 0.09 * | 0.33 | 0.13 |
| Kidney chromophobe | 0.06 | 0.28 | 0.15 | 0.04 | 0.05 | 0.17 | 0.02 | 0.09 | 0.14 * |
| Kidney renal clear cell carcinoma | −0.04 | 0.08 | 0.05 | −0.05 | 0.06 | 0.25 | −0.04 | 0.17 | 0.09 * |
| Kidney renal papillary cell carcinoma | −0.23 | −0.11 * | −0.16 | −0.26 | −0.34 | 0.00 | 0.00 | 0.09 | 0.03 |
| Acute myeloid leukemia | N/A | N/A | N/A | N/A | N/A | N/A | N/A | N/A | N/A |
| Brain lower grade glioma | 0.18 | −0.14 * | −0.17 | −0.29 | −0.09 | 0.20 | 0.13 | 0.19 | 0.13 |
| Liver hepatocellular carcinoma | −0.24 * | 0.07 | −0.28 | −0.31 | −0.21 * | 0.08 | −0.25 * | 0.03 | −0.03 |
| Lung adenocarcinoma | 0.08 | 0.17 | 0.18 | 0.16 | 0.01 | 0.28 | 0.05 | 0.43 | 0.31 |
| Lung squamous cell carcinoma | −0.10 | 0.29 | 0.13 | 0.19 | −0.05 | 0.26 | −0.04 | 0.25 | 0.11 |
| Ovarian serous cystadenocarcinoma | −0.04 | 0.06 | 0.00 | −0.05 | −0.04 | 0.16 | −0.06 | 0.12 * | 0.07 * |
| Pancreatic adenocarcinoma | 0.12 * | 0.21 | −0.06 | 0.03 | 0.06 * | 0.12 * | 0.05 | 0.26 | 0.35 |
| Pheochromocytoma and paraganglioma | 0.02 | 0.05 | 0.01 | −0.13 | 0.01 | 0.17 | 0.03 | 0.01 | 0.00 |
| Prostate adenocarcinoma | 0.01 * | 0.06 * | −0.04 | −0.05 | 0.02 * | 0.14 | −0.01 * | 0.16 | 0.02 * |
| Rectum adenocarcinoma | 0.24 * | 0.18 | 0.09 | 0.39 | 0.35 | 0.06 | 0.38 | 0.42 | 0.36 |
| Sarcoma | 0.26 | 0.26 | 0.04 | −0.05 | 0.13 | 0.24 | 0.15 | 0.38 | 0.31 |
| Skin cutaneous melanoma | −0.23 | 0.04 | −0.05 | 0.10 * | 0.05 | 0.17 | −0.07 | 0.10 | 0.10 |
| Stomach adenocarcinoma | −0.02 | −0.01 | −0.08 * | 0.14 | 0.16 | 0.01 | 0.04 | 0.16 | 0.15 |
| Testicular germ cell tumors | 0.45 | 0.47 | 0.43 | 0.54 | 0.30 | 0.47 | 0.42 | 0.50 | 0.42 |
| Thyroid carcinoma | −0.38 | −0.23 | −0.31 | −0.53 | −0.18 | −0.20 | −0.40 | 0.10 | −0.23 |
| Thymoma | 0.33 | 0.00 | −0.32 | 0.17 * | 0.20 | 0.28 | −0.17 | 0.30 | −0.15 |
| Uterine corpus endometrial carcinoma | −0.27 * | −0.21 * | −0.26 | −0.20 | 0.04 | 0.04 | −0.18 | −0.11 | −0.18 |
| Uterine carcinosarcoma | −0.24 | 0.02 | −0.18 | 0.08 | −0.09 | −0.16 | −0.20 | 0.12 | 0.09 |
| Name of the Cancer | CXCL1 | CXCL2 | CXCL3 | CXCL5 | CXCL6 | PPBP | CXCL8 | CXCR1 | CXCR2 |
|---|---|---|---|---|---|---|---|---|---|
| Adrenocortical carcinoma | −0.08 * | 0.06 * | 0.04 | −0.04 | −0.06 | 0.21 * | 0.10 | 0.09 | 0.11 |
| Bladder urothelial carcinoma | 0.17 | 0.23 | 0.20 | 0.25 | 0.06 | 0.03 | 0.07 | 0.00 | −0.26 |
| Breast invasive carcinoma | 0.01 | −0.13 | 0.04 | 0.06 | −0.01 | 0.07 | 0.19 | 0.08 * | 0.30 |
| Cervical squamous cell carcinoma and endocervical adenocarcinoma | −0.25 | −0.21 | −0.29 | −0.19 | −0.18 * | −0.17 | −0.33 | −0.12 * | 0.07 |
| Cholangiocarcinoma | −0.18 | −0.46 | −0.18 | −0.22 | −0.06 | −0.09 | −0.09 | −0.01 | 0.12 |
| Colon adenocarcinoma | 0.08 | −0.03 | −0.02 | 0.21 | 0.23 | 0.14 | 0.35 | 0.43 | 0.40 |
| Lymphoid neoplasm diffuse large B-cell lymphoma | 0.30 | 0.16 | 0.22 | 0.33 * | −0.03 | −0.06 | 0.31 | 0.01 | 0.22 |
| Esophageal carcinoma | −0.11 | −0.01 | 0.03 | 0.18 | −0.06 | 0.08 | 0.06 | 0.12 | −0.14 * |
| Glioblastoma multiforme | 0.18 | 0.16 | 0.19 * | 0.30 | 0.28 | 0.22 | 0.24 | 0.08 | 0.33 |
| Head and neck squamous cell carcinoma | −0.12 * | 0.02 | 0.01 | −0.03 | −0.13 * | −0.10 | −0.09 | 0.02 | −0.09 |
| Kidney chromophobe | 0.21 | 0.22 | 0.37 | 0.18 | −0.14 | 0.14 * | 0.30 | 0.18 | 0.18 * |
| Kidney renal clear cell carcinoma | 0.03 | −0.09 | 0.02 | 0.14 | 0.02 | −0.10 | 0.24 | −0.02 | 0.13 |
| Kidney renal papillary cell carcinoma | 0.14 | 0.23 | 0.17 | 0.10 * | 0.09 * | 0.09 * | 0.20 | 0.16 | 0.21 |
| Acute myeloid leukemia | N/A | N/A | N/A | N/A | N/A | N/A | N/A | N/A | N/A |
| Brain lower grade glioma | 0.01 | 0.11 | 0.14 | −0.08 | 0.14 | 0.02 | 0.17 | 0.08 | 0.50 |
| Liver hepatocellular carcinoma | 0.04 | 0.14 | 0.02 | 0.01 | 0.03 | −0.02 | 0.05 | 0.04 | 0.08 |
| Lung adenocarcinoma | −0.03 | 0.00 | 0.03 | 0.08 | 0.06 * | 0.08 | 0.11 | 0.09 * | 0.22 |
| Lung squamous cell carcinoma | −0.26 | 0.08 * | 0.01 | 0.16 | −0.24 | 0.07 | 0.03 | 0.10 | 0.10 * |
| Ovarian serous cystadenocarcinoma | 0.08 | 0.04 | 0.06 | 0.05 | 0.06 | −0.14 | 0.15 * | 0.13 | 0.30 |
| Pancreatic adenocarcinoma | 0.00 | 0.05 | −0.03 | 0.19 | 0.13 | 0.04 | 0.14 * | 0.19 | 0.33 |
| Pheochromocytoma and paraganglioma | 0.39 | 0.35 | 0.34 | 0.32 | 0.16 | 0.25 | 0.39 | 0.21 | 0.29 |
| Prostate adenocarcinoma | 0.06 | 0.07 | 0.09 | 0.09 | 0.04 * | 0.05 | 0.08 | 0.10 | 0.00 * |
| Rectum adenocarcinoma | −0.02 | −0.11 | −0.13 | 0.04 | 0.02 | 0.15 | 0.32 | 0.25 | 0.19 |
| Sarcoma | 0.40 | 0.21 | 0.39 | 0.30 | 0.30 | 0.12 | 0.32 | 0.23 | 0.24 |
| Skin cutaneous melanoma | −0.05 * | 0.01 | −0.02 | −0.08 | −0.13 * | −0.18 | 0.09 | −0.12 * | −0.02 |
| Stomach adenocarcinoma | 0.10 | −0.01 | 0.11 * | 0.06 | −0.08 | −0.06 | 0.19 | 0.27 | 0.25 |
| Testicular germ cell tumors | 0.27 * | 0.41 | 0.31 | 0.16 | 0.15 | −0.03 | 0.48 | 0.13 | 0.23 * |
| Thyroid carcinoma | 0.26 | 0.17 | 0.22 | 0.29 | 0.17 | 0.07 | 0.25 | 0.01 | 0.29 |
| Thymoma | 0.08 | −0.04 | −0.27 | 0.10 | −0.06 | 0.26 | −0.09 | 0.14 | 0.03 |
| Uterine corpus endometrial carcinoma | −0.04 | 0.01 | −0.13 | −0.28 * | −0.14 | −0.17 | −0.05 | 0.13 | −0.03 |
| Uterine carcinosarcoma | 0.13 | 0.37 * | 0.27 | 0.20 | 0.01 | 0.07 | 0.13 | 0.36 | 0.10 |
| Name of the Cancer | CXCL1 | CXCL2 | CXCL3 | CXCL5 | CXCL6 | PPBP | CXCL8 | CXCR1 | CXCR2 |
|---|---|---|---|---|---|---|---|---|---|
| Adrenocortical carcinoma | 0.01 | 0.09 | −0.05 | −0.18 | −0.10 | 0.10 | 0.05 | 0.12 | 0.15 |
| Bladder urothelial carcinoma | 0.13 | 0.25 | 0.19 | 0.22 | 0.02 | 0.02 | 0.02 * | 0.03 | −0.31 |
| Breast invasive carcinoma | 0.15 | −0.02 | 0.15 | 0.18 | 0.11 | 0.09 | 0.18 | 0.01 | 0.14 |
| Cervical squamous cell carcinoma and endocervical adenocarcinoma | −0.25 | −0.18 | −0.27 | −0.16 | −0.15 * | −0.14 | −0.31 | −0.08 | 0.04 |
| Cholangiocarcinoma | −0.27 | −0.27 | −0.09 | −0.10 | −0.14 | 0.24 | −0.08 | 0.01 | 0.12 |
| Colon adenocarcinoma | 0.07 | −0.03 | −0.04 | 0.24 | 0.25 | 0.18 | 0.39 | 0.50 | 0.44 |
| Lymphoid neoplasm diffuse large B-cell lymphoma | 0.38 | 0.26 | 0.20 * | 0.30 | −0.01 | −0.02 | 0.39 * | 0.00 | 0.19 |
| Esophageal carcinoma | −0.03 | 0.11 | 0.09 | 0.20 | 0.03 | 0.09 | 0.10 | 0.16 | −0.15 |
| Glioblastoma multiforme | 0.25 * | 0.18 | 0.33 * | 0.42 | 0.36 | 0.29 | 0.33 | 0.16 | 0.30 |
| Head and neck squamous cell carcinoma | −0.12 * | 0.04 | 0.01 | −0.05 | −0.11 * | −0.12 | −0.13 * | 0.03 | −0.11 * |
| Kidney chromophobe | 0.31 | 0.36 | 0.40 | 0.15 | −0.06 | 0.18 | 0.32 | 0.27 * | 0.19 |
| Kidney renal clear cell carcinoma | 0.09 | −0.07 | 0.05 | 0.16 | 0.05 | −0.07 | 0.24 | −0.01 | 0.09 |
| Kidney renal papillary cell carcinoma | 0.17 | 0.25 | 0.21 | 0.07 | 0.10 | 0.10 | 0.22 | 0.15 | 0.20 |
| Acute myeloid leukemia | N/A | N/A | N/A | N/A | N/A | N/A | N/A | N/A | N/A |
| Brain lower grade glioma | 0.02 | 0.09 | 0.12 | −0.17 * | 0.12 | 0.02 | 0.17 | 0.07 | 0.48 |
| Liver hepatocellular carcinoma | 0.23 | 0.02 | 0.18 | 0.18 | 0.16 | −0.08 | 0.18 | 0.05 | 0.06 |
| Lung adenocarcinoma | 0.02 | −0.06 | 0.04 | 0.08 | 0.12 | −0.02 | 0.16 | 0.09 | 0.11 |
| Lung squamous cell carcinoma | −0.26 | 0.05 | −0.01 | 0.15 | −0.23 * | 0.02 | −0.01 | 0.08 | 0.05 |
| Ovarian serous cystadenocarcinoma | 0.14 | 0.08 | 0.11 | 0.08 | 0.11 | −0.10 | 0.14 | 0.13 | 0.31 |
| Pancreatic adenocarcinoma | −0.04 | −0.01 | −0.09 | 0.13 * | 0.08 | −0.04 | 0.05 | 0.09 | 0.20 |
| Pheochromocytoma and paraganglioma | 0.46 | 0.41 | 0.39 | 0.34 | 0.21 | 0.29 | 0.41 | 0.27 | 0.32 |
| Prostate adenocarcinoma | 0.10 | 0.11 | 0.12 | 0.03 | 0.06 | 0.11 | 0.00 | 0.10 | 0.05 |
| Rectum adenocarcinoma | −0.02 | −0.04 | −0.12 | 0.17 | 0.12 | 0.09 | 0.31 | 0.31 | 0.27 |
| Sarcoma | 0.41 | 0.28 | 0.41 | 0.30 | 0.32 | 0.11 | 0.32 | 0.22 | 0.29 |
| Skin cutaneous melanoma | −0.08 | 0.02 | −0.03 | −0.05 | −0.11 | −0.15 | 0.07 | −0.09 | 0.02 |
| Stomach adenocarcinoma | 0.09 | −0.01 | 0.08 | 0.05 | −0.05 | −0.01 | 0.17 | 0.27 | 0.23 |
| Testicular germ cell tumors | 0.43 | 0.55 | 0.44 | 0.35 | 0.28 | 0.11 | 0.59 | 0.29 | 0.40 |
| Thyroid carcinoma | 0.17 | 0.16 | 0.17 | 0.11 | 0.14 | −0.03 | 0.12 | 0.11 | 0.27 |
| Thymoma | 0.10 | −0.02 | −0.27 | 0.09 | −0.03 | 0.19 | −0.07 | 0.14 | 0.16 |
| Uterine corpus endometrial carcinoma | −0.05 | −0.06 | −0.17 | −0.32 * | −0.10 | −0.16 | −0.14 | 0.04 | −0.13 |
| Uterine carcinosarcoma | 0.02 | 0.14 | 0.06 | 0.08 | 0.05 | −0.04 | −0.10 | 0.33 | 0.18 |
| Name of the Cancer | CXCL1 | CXCL2 | CXCL3 | CXCL5 | CXCL6 | PPBP | CXCL8 | CXCR1 | CXCR2 |
|---|---|---|---|---|---|---|---|---|---|
| Adrenocortical carcinoma | 0.00 | 0.13 | 0.05 | 0.18 | −0.10 | 0.20 | −0.05 | 0.00 | 0.12 |
| Bladder urothelial carcinoma | −0.11 | 0.09 | 0.06 | 0.06 | −0.12 | −0.01 | −0.20 | −0.04 | −0.15 * |
| Breast invasive carcinoma | −0.16 | −0.10 | −0.13 | −0.16 | −0.16 | 0.04 | 0.02 | 0.15 | 0.31 |
| Cervical squamous cell carcinoma and endocervical adenocarcinoma | −0.24 | −0.20 | −0.42 | −0.19 | −0.18 | −0.13 | −0.39 | −0.11 | 0.02 |
| Cholangiocarcinoma | −0.31 | −0.53 | −0.20 | −0.33 | −0.21 | −0.13 | −0.24 | −0.36 * | −0.22 |
| Colon adenocarcinoma | 0.00 * | −0.06 | −0.41 | 0.03 | 0.03 | 0.13 * | 0.12 | 0.16 | 0.12 |
| Lymphoid neoplasm diffuse large B-cell lymphoma | 0.11 | 0.05 | 0.04 | 0.21 | 0.07 | −0.02 | 0.18 | −0.06 | 0.02 |
| Esophageal carcinoma | −0.01 * | 0.23 * | −0.27 | 0.15 | −0.08 | 0.14 | −0.05 | 0.18 * | −0.12 |
| Glioblastoma multiforme | −0.02 | −0.05 | −0.14 | 0.00 | 0.04 | −0.03 | −0.10 | −0.03 | 0.23 |
| Head and neck squamous cell carcinoma | −0.18 | −0.07 | −0.13 | −0.12 | −0.17 | −0.09 * | −0.20 | −0.04 | −0.06 |
| Kidney chromophobe | 0.21 | 0.25 | 0.23 | 0.18 | −0.07 | 0.22 | 0.17 | 0.30 | 0.11 |
| Kidney renal clear cell carcinoma | 0.03 | −0.07 | −0.03 | 0.00 | −0.01 | −0.05 | 0.11 | 0.01 | 0.12 |
| Kidney renal papillary cell carcinoma | 0.09 | 0.17 | 0.03 | 0.01 | 0.04 | 0.02 | 0.07 | 0.08 | 0.08 |
| Acute myeloid leukemia | N/A | N/A | N/A | N/A | N/A | N/A | N/A | N/A | N/A |
| Brain lower grade glioma | 0.07 | −0.05 | −0.18 | 0.01 | −0.01 | 0.08 | 0.09 | 0.06 | 0.17 |
| Liver hepatocellular carcinoma | −0.10 | 0.16 | −0.17 | −0.19 | −0.05 | 0.02 | −0.12 * | 0.01 | 0.03 |
| Lung adenocarcinoma | −0.15 | 0.06 | −0.02 | 0.05 | −0.10 | 0.19 | −0.11 | 0.13 | 0.26 |
| Lung squamous cell carcinoma | −0.27 | 0.13 | −0.03 | 0.06 | −0.24 | 0.12 | −0.02 | 0.11 | 0.15 |
| Ovarian serous cystadenocarcinoma | −0.14 | −0.09 | −0.11 | −0.13 * | −0.12 | −0.18 | −0.03 | 0.02 | 0.23 |
| Pancreatic adenocarcinoma | 0.00 | 0.04 | −0.03 | 0.16 | 0.04 | 0.04 | 0.05 | 0.27 | 0.39 |
| Pheochromocytoma and paraganglioma | 0.12 | 0.21 | 0.19 | 0.01 | 0.00 | 0.14 | 0.19 | 0.11 | 0.17 |
| Prostate adenocarcinoma | −0.06 | −0.01 | −0.05 | −0.08 | −0.10 * | 0.04 | −0.05 | 0.00 | −0.12 |
| Rectum adenocarcinoma | −0.09 | −0.23 | −0.18 | −0.11 | −0.16 | 0.07 | 0.14 | 0.08 | 0.00 |
| Sarcoma | 0.15 | 0.19 | 0.09 | 0.04 | 0.04 | −0.02 | 0.09 * | 0.23 | 0.15 |
| Skin cutaneous melanoma | −0.13 | −0.17 | −0.17 | −0.25 | −0.19 * | −0.16 | −0.19 | −0.12 * | −0.09 |
| Stomach adenocarcinoma | 0.02 * | −0.03 * | 0.08 * | 0.09 | −0.09 * | −0.14 | 0.07 | 0.26 | 0.24 |
| Testicular germ cell tumors | 0.03 | 0.23 | 0.22 | 0.02 * | −0.04 | −0.06 | 0.24 | 0.01 * | 0.02 * |
| Thyroid carcinoma | −0.21 | −0.21 | −0.19 | −0.17 | −0.06 | −0.18 | −0.16 | −0.07 | −0.05 |
| Thymoma | 0.21 | 0.01 | −0.31 | 0.15 | 0.06 | 0.22 | −0.02 | 0.05 * | 0.01 * |
| Uterine corpus endometrial carcinoma | −0.10 | −0.09 | −0.21 | −0.31 | −0.08 | −0.13 | −0.15 | 0.03 | −0.06 |
| Uterine carcinosarcoma | −0.23 | 0.00 | −0.03 | −0.11 | −0.12 | −0.06 | −0.12 | 0.04 | −0.10 |
| Name of the Cancer | Number of Cases Studied | CXCL1 | CXCL2 | CXCL3 | CXCL5 | CXCL6 | PPBP | CXCL8 | CXCR1 | CXCR2 |
|---|---|---|---|---|---|---|---|---|---|---|
| Adrenocortical carcinoma | 92 | 1.1% T | 1.1% A | 1.1% A | 1.1% A | - | 1.1% A | - | - | - |
| Bladder urothelial carcinoma | 411 | 1.9% A | 1.2% A | 1.2% A | 1.5% A | 1.9% A | 1.7% A | 2.2% A | 1.2% D | 1.2% D |
| Breast invasive carcinoma | 1084 | 1.9% A | 2.1% A | 2.2% A | 2.2% A | 1.9% A | 2.2% A | 1.9% A | 0.37% A 0.46% D | 0.37% A 0.46% D |
| Cervical squamous cell carcinoma and endocervical adenocarcinoma | 297 | 0.67% A 0.34% D | 0.34% A 0.34% D | 0.67% A 0.34% D | 0.67% A 0.34% D | 0.67% A 0.34% D | 0.67% A 0.34% D | 0.67% A 0.34% D 0.34% T | 2.0% D | 2.0% D |
| Cholangiocarcinoma | 36 | - | - | - | - | - | - | - | - | - |
| Colon adenocarcinoma | 378 | 0.26% A 0.26% D | 0.26% A 0.26% D 0.26% T | 0.53% A 0.26% D | 0.53% A 0.26% D | 0.26% A 0.26% D | 0.53% A 0.26% D | 0.26% A 0.26% D | - | - |
| Lymphoid neoplasm diffuse large B-cell lymphoma | 48 | - | - | - | - | - | - | - | - | - |
| Esophageal carcinoma | 182 | 2.7% A | 2.7% A | 3.3% A | 3.3% A | 2.7% A | 3.3% A | 2.7% A | 0.55% D | 0.55% A 0.55% D 1.6% T |
| Glioblastoma multiforme | 585 | 0.17% A | 0.17% A | 0.17% A | 0.17% A | 0.17% A | 0.17% A | 0.17% A | 0.17% A 0.17% D | 0.17% A 0.17% D |
| Head and neck squamous cell carcinoma | 523 | 0.76% A 0.19% T 0.19% CXCL1-AFP | 0.57% A | 0.57% A | 0.57% A | 0.76% A | 0.57% A | 0.76% A | 1.3% D 0.19% T | 1.3% D |
| Kidney chromophobe | 65 | - | - | - | - | - | - | - | - | - |
| Kidney renal clear cell carcinoma | 512 | 0.39% A | 0.20% A | 0.20% A | 0.20% A | 0.39% A | 0.20% A | 0.39% A | 0.20% A 0.20% D | 0.20% A 0.20% D |
| Kidney renal papillary cell carcinoma | 283 | - | - | - | - | - | - | - | 1.1% D | 1.1% D |
| Acute myeloid leukemia | 200 | - | - | - | - | 0.50% A | - | 0.50% A | - | - |
| Brain lower grade glioma | 514 | 0.19% D | 0.19% D | 0.19% D | 0.19% D | 0.19% D | 0.19% D | 0.19% D | 0.19% A 0.19% D | 0.19% A 0.19% D |
| Liver hepatocellular carcinoma | 372 | 0.27% A 0.27% D | 0.27% D | 0.27% D | 0.27% D | 0.27% A 0.27% D | 0.27% D | 0.27% A 0.27% D | 0.81% A | 0.54% A |
| Lung adenocarcinoma | 566 | 0.88% A | 0.88% A 0.18% T | 0.88% A | 0.88% A | 0.88% A | 0.88% A 0.18% T | 0.88% A | 0.35% A | 0.35% A 0.35% T |
| Lung squamous cell carcinoma | 487 | 2.3% A | 2.3% A | 2.3% A | 2.3% A | 2.3% A | 2.3% A | 2.3% A | 0.21% A 0.62% D 0.21% T | 0.21% A 0.62% D |
| Ovarian serous cystadenocarcinoma | 585 | 2.6% A 0.34% D | 2.6% A 0.34% D | 2.6% A 0.34% D | 2.6% A 0.34% D | 2.6% A 0.34% D | 2.6% A 0.34% D | 2.4% A 0.51% D | 0.68% A 0.17% T | 0.68% A |
| Pancreatic adenocarcinoma | 184 | 0.54% A | 0.54% A | 0.54% A | 0.54% A | 0.54% A | 0.54% A | 0.54% A | 1.1% A | 1.1% A |
| Pheochromocytoma and Paraganglioma | 178 | 0.56% A | 0.56% A | 1.1% A | 0.56% A | 0.56% A | 0.56% A | 0.56% A | - | - |
| Prostate adenocarcinoma | 494 | 0.61% A 0.20% D | 0.61% A 0.20% D | 0.81% A 0.20% D | 0.81% A 0.20% D | 0.61% A 0.20% D | 0.81% A 0.20% D | 0.61% A 0.20% D | 0.61% A | 0.61% A |
| Rectum adenocarcinoma | 155 | - | - | - | - | - | - | - | - | - |
| Sarcoma | 255 | 1.2% A 0.39% D | 1.2% A 0.39% D | 1.2% A 0.39% D | 1.2% A 0.39% D | 1.2% A 0.39% D | 1.2% A 0.39% D | 1.2% A 0.39% D 0.39% T | 1.6% A 1.2% D | 1.6% A 1.2% D |
| Skin cutaneous melanoma | 442 | 0.23% A 0.23% D | 0.23% A 0.23% D | 0.23% A 0.23% D | 0.23% A 0.23% D | 0.23% A 0.23% D | 0.23% A 0.23% D | 0.23% A 0.23% D 0.23% T | 0.23% A 0.23% T | 0.23% A |
| Stomach adenocarcinoma | 440 | 1.6% A | 1.8% A | 1.8% A | 1.8% A | 1.6% A | 1.8% A | 1.6% A | 0.68% A | 0.45% A |
| Testicular germ cell tumors | 149 | - | - | 0.67% D | - | - | - | - | - | - |
| Thyroid carcinoma | 500 | - | - | - | - | - | - | - | - | - |
| Thymoma | 123 | - | - | - | - | - | - | - | - | - |
| Uterine corpus endometrial carcinoma | 529 | 0.19% T | 0.38% T | - | - | - | - | 0.19% A 0.19% D 0.57% T | 1.1% A 0.19% D 0.19% T | 1.1% A 0.19% D 0.19% T |
| Uterine carcinosarcoma | 57 | - | - | - | - | - | - | - | - | - |
| Pan-cancer analysis | 10,726 | 0.85% A 0.08% D 0.03% T | 0.83% A 0.08% D 0.04% T | 0.88% A 0.09% D | 0.88% A 0.08% D 0.01% T | 0.86% A 0.08% D | 0.89% A 0.08% D 0.01% T | 0.87% A 0.10% D 0.06% T | 0.33% A 0.34% D 0.05% T | 0.33% A 0.34% D 0.06% T |
| Ligand CXCR2 Gene | Up to 200 bp Upstream of the Transcription Start Site | From 200 bp to 500 bp Upstream of the Transcription Start Site | 500 to 1500 bp Upstream of the Transcription Start Site |
|---|---|---|---|
| CXCL1 | AP-2 (−59), NF-κB (−77), Sp1 (−128), AP-2 (−133), TEF2-GT-I/EGR-1 (−163), | TRF-site-C (TREF1/2) (−265), CuE4.1 (−296), E1A (−299), ASP-CYP21/EGR-1 (−387), Fli-1-Ets-site-1 (−411), PEA-3 (−412), NF-E1 (−475), | FREAC-2/EGFR-downstream-enh (−659), ??(a) (−664), GATA-1 (−707), NF-E1.2 (−769), PEA-3 (−773), NF-IL6 (−803), C/EBPa (−817), M-Box (−953), TEF1 (−1057), Ets1 (−1076), NF-IL3 site (−1207), TFII-I (−1262), C/EBP (−1278), tPA-GC-box-I (−1292), E-box/NF-kappaE1 site (−1413) |
| CXCL2 | c-Myb (−76), NF-κB (−77), pyrimidine-rich domain (−112), IRE-A/DSE/TRE (−127), ZIP-site (Sp1/EGR-1) (−137), | Sp1 (−252), epsilon-NRA-FP2 (−267), UIRR-GATA (−268), MT-I.4 (−318), (−474), | X2 (−535), poly CACA sequence (−612–−636), Wt1 (−624–−636), microE5 motif (−658), HNF-3 (−709), Sox2-POU-site-1 (−1019), NMP-2 (−1040), NFE4 site (−1186), NF-4FA (−1193), HoxA-5 (−1197), RIPE3b (−1392) |
| CXCL3 | NF-κB (−77), Sp1 (−127), c-GC-box (−128), ZIP-site (Sp1/EGR-1) (−138), | epsilon-NRA-FP2 (−281), PEA-3 (−401), (−406), Ets-1-Octa-1 (−433), | FREAC-2/EGFR-downstream-enh (−669), ??(a) (−675), Fli-1-Ets-site-1/GATA-1 (−788), TIN-1 (NRE)/IL-1 response_eleme (−810), Tbx2 (−841), C/EBP-AT-Site-A (−968) |
| CXCL5 | MZF-1 (−51), NF-AT (−63), TTF (−67), NF-κB (−89), C/EBP (−113), U-prosaposin (−130), H4TF1/IKAROS/LYF-1 (−132), Sp1 (−133), XRE (−133), | TFII-I (−255), mTDT-site D (−268), mTDT-site D (−278), GATA-1 (−350), NF-E4 site (−359), C/EBP (−421), NF-κB/ISGF1 (−495), | PEA-3 (−512), TATA box (−552), Ets-1-Octa-1 (−782), GATA-1 (−961), ?? (−1051), Stat3 (−1102), ??(a) (−1279), STAT5B (−1345), C/EBPa (−1349), Optimedin-Opts2 (Pax6)(−1408) |
| CXCL6 | Kaiso-box (−56), NF-AT (−62), TTF (−66), NF-κB (−88), C/EBP (−112), ADA-NF2 (−132), Sp1 (−137), Ets1 (−144), E2A (−150), | Sp1 (−215), c-GC-box (−216), mTDT-site D (−267), AP-2 (−284), GATA-1 (−338), HoxTF-Hoxb-4 (NFY/YY1 motif) (−354), PEA-3 (−381), BAR1.2 (−438), C/EBP (−440), | Optimedin-Opts2 (Pax6) (−509), AP-1 (−514), DBP (−527), Optimedin-Opts2 (Pax6) (−628), AP-1 (−633), DBP (−646), C/EBP (−870), HNF-6 (−881), beta-RARE (−988), oct-element N1 (−1171), kappaY (Oct-1/2) (−1306) |
| PPBP | ?? (−42), PEA-3 (−61), PU.1/Fli-1-Ets-site-1 (−78), EF-1A-site A (−81), PuF site (−128), ?? (−134), | NF-E1.2 (−217), PEA-3 (−221), kappaY (Oct-1/2) (−222), TBP (−323), CuE3.1 (−381), ISGF2 (−396), Ncx (−496), | epsilon-NRA-FP5 (−557), Ets-1 (−599), (−756), NF-E1.2 (−980), T3RE (−989), HBP1 (−1014), AGP-HA (−1123), Brn-3 (−1404) |
| CXCL8 | C/EBP (−77), IL-8-NRE (NF-κB)/CSBP-1 (−87), NF-κB/NF-AT (−91), Oct-1 (−104), NF-E2-consensus (−136), AP-1 (−137), | Oct3/MEF2-like-sequence (−232), Fbx15-oct-site (−296), E-box (Hes-1) (−334), microE5 motif (−345), NF-E1.2 (−422), ERK2-CAAT-box (NF-Y/CBF) (−433), XOR-TATA-like element (NRE) (TFIID) (−440), Bcl-6 (NRE)/MEF2-like-sequence (−495), | Gfi-1 (NRE) (−551), Gfi-1 (NRE) (−610), PEA-3 (−841), TEF1 (−863), SF-1 (−886), ?? (−893), Tbx2/EGR-1 (−959), AP-2/Sp1 (−966), GATA-1 (−1409) |
| miRNA | Target Score for CXCL1 | Target Score for CXCL2 | Target Score for CXCL3 | Target Score for CXCL5 | Target Score for CXCL6 | Target Score for PPBP | Target Score for CXCL8 | Number of CXCR2 Ligands as a Target |
|---|---|---|---|---|---|---|---|---|
| miR-7-1-3p | <50 | 87 | <50 | 63 | <50 | <50 | <50 | 2 |
| miR-7-2-3p | <50 | 87 | <50 | 63 | <50 | <50 | <50 | 2 |
| let-7c-3p | <50 | <50 | 93 | <50 | <50 | <50 | <50 | 1 |
| miR-17-5p | <50 | <50 | <50 | <50 | 88 | <50 | <50 | 1 |
| miR-20a-5p | <50 | <50 | <50 | <50 | 90 | <50 | <50 | 1 |
| miR-20b-5p | <50 | <50 | <50 | <50 | 90 | <50 | <50 | 1 |
| miR-25-3p | <50 | <50 | <50 | 90 | <50 | <50 | <50 | 1 |
| miR-32-5p | <50 | <50 | <50 | 90 | <50 | <50 | <50 | 1 |
| miR-92a-3p | <50 | <50 | <50 | 90 | <50 | <50 | <50 | 1 |
| miR-92b-3p | <50 | <50 | <50 | 90 | <50 | <50 | <50 | 1 |
| miR-93-5p | <50 | <50 | <50 | <50 | 88 | <50 | <50 | 1 |
| miR-95-5p | 87 | 99 | <50 | <50 | <50 | <50 | <50 | 2 |
| miR-106a-5p | <50 | <50 | <50 | <50 | 88 | <50 | <50 | 1 |
| miR-106b-5p | <50 | <50 | <50 | <50 | 88 | <50 | <50 | 1 |
| miR-140-3p | <50 | <50 | <50 | <50 | <50 | <50 | 94 | 1 |
| miR-153-5p | <50 | <50 | <50 | <50 | <50 | <50 | 89 | 1 |
| miR-190a-3p | <50 | <50 | <50 | 97 | 54 | <50 | <50 | 2 |
| miR-192-5p | <50 | 91 | <50 | <50 | <50 | <50 | <50 | 1 |
| miR-194-5p | <50 | <50 | 86 | <50 | <50 | <50 | <50 | 1 |
| miR-215-5p | <50 | 91 | <50 | <50 | <50 | <50 | <50 | 1 |
| miR-302a-3p | 86 | <50 | <50 | <50 | <50 | <50 | <50 | 1 |
| miR-302b-3p | 86 | <50 | <50 | <50 | <50 | <50 | <50 | 1 |
| miR-302c-3p | 86 | <50 | <50 | <50 | <50 | <50 | <50 | 1 |
| miR-302d-3p | 86 | <50 | <50 | <50 | <50 | <50 | <50 | 1 |
| miR-302e | 86 | <50 | <50 | <50 | <50 | <50 | <50 | 1 |
| miR-335-3p | <50 | <50 | 86 | <50 | <50 | <50 | <50 | 1 |
| miR-363-3p | <50 | <50 | <50 | 90 | <50 | <50 | <50 | 1 |
| miR-367-3p | <50 | <50 | <50 | 90 | <50 | <50 | <50 | 1 |
| miR-376c-3p | 51 | <50 | <50 | 85 | <50 | <50 | <50 | 2 |
| miR-380-3p | <50 | <50 | <50 | 85 | <50 | <50 | <50 | 1 |
| miR-466 | <50 | 86 | <50 | <50 | <50 | <50 | <50 | 1 |
| miR-495-3p | <50 | 87 | <50 | 51 | <50 | <50 | <50 | 2 |
| miR-519d-3p | <50 | <50 | <50 | <50 | 90 | <50 | <50 | 1 |
| miR-526b-3p | <50 | <50 | <50 | <50 | 90 | <50 | <50 | 1 |
| miR-532-5p | 92 | 86 | <50 | <50 | <50 | <50 | <50 | 2 |
| miR-548p | <50 | <50 | <50 | 85 | <50 | <50 | <50 | 1 |
| miR-548t-3p | <50 | <50 | <50 | <50 | 99 | <50 | <50 | 1 |
| miR-548aa | <50 | <50 | <50 | <50 | 99 | <50 | <50 | 1 |
| miR-548ah-5p | <50 | <50 | <50 | 94 | <50 | <50 | <50 | 1 |
| miR-548ap-3p | <50 | <50 | <50 | <50 | 99 | <50 | <50 | 1 |
| miR-548at-5p | <50 | <50 | <50 | <50 | <50 | <50 | 92 | 1 |
| miR-548l | <50 | <50 | 86 | <50 | <50 | <50 | <50 | 1 |
| miR-548n | <50 | <50 | 64 | 87 | <50 | <50 | <50 | 2 |
| miR-548o-3p | 86 | <50 | <50 | <50 | 70 | <50 | <50 | 2 |
| miR-570-3p | 96 | 68 | <50 | <50 | <50 | <50 | <50 | 2 |
| miR-629-5p | <50 | <50 | <50 | <50 | <50 | 88 | <50 | 1 |
| miR-642a-3p | <50 | <50 | 92 | 56 | <50 | <50 | <50 | 2 |
| miR-656-3p | <50 | <50 | <50 | 93 | <50 | <50 | <50 | 1 |
| miR-889-3p | <50 | <50 | <50 | 89 | <50 | <50 | 76 | 2 |
| miR-1266-3p | <50 | 92 | <50 | <50 | <50 | <50 | <50 | 1 |
| miR-1277-5p | <50 | <50 | <50 | 100 | 51 | 51 | <50 | 3 |
| miR-1323 | 87 | <50 | <50 | <50 | 73 | <50 | <50 | 2 |
| miR-2115-3p | <50 | <50 | <50 | <50 | <50 | <50 | 85 | 1 |
| miR-3123 | <50 | 63 | <50 | <50 | 87 | <50 | <50 | 2 |
| miR-3140-5p | <50 | <50 | <50 | <50 | <50 | 91 | <50 | 1 |
| miR-3148 | <50 | <50 | <50 | 57 | 91 | <50 | <50 | 2 |
| miR-3152-3p | <50 | <50 | <50 | <50 | <50 | 87 | <50 | 1 |
| miR-3163 | <50 | <50 | 65 | 89 | <50 | <50 | 68 | 3 |
| miR-3606-5p | <50 | <50 | <50 | <50 | 86 | <50 | <50 | 1 |
| miR-3609 | <50 | <50 | <50 | 93 | <50 | <50 | <50 | 1 |
| miR-3671 | <50 | <50 | <50 | <50 | 75 | <50 | 92 | 2 |
| miR-4291 | <50 | <50 | 90 | <50 | <50 | <50 | <50 | 1 |
| miR-4312 | <50 | <50 | <50 | <50 | <50 | <50 | 85 | 1 |
| miR-4436b-5p | <50 | <50 | <50 | <50 | <50 | <50 | 87 | 1 |
| miR-4524a-3p | <50 | <50 | <50 | <50 | <50 | 88 | <50 | 1 |
| miR-4687-5p | <50 | <50 | <50 | 88 | <50 | <50 | <50 | 1 |
| miR-4699-3p | <50 | <50 | <50 | <50 | <50 | <50 | 88 | 1 |
| miR-4753-3p | <50 | <50 | 95 | 86 | <50 | <50 | <50 | 2 |
| miR-4776-3p | <50 | <50 | <50 | 99 | <50 | <50 | <50 | 1 |
| miR-4782-5p | <50 | <50 | <50 | <50 | <50 | <50 | 85 | 1 |
| miR-4789-3p | <50 | 87 | 79 | <50 | <50 | <50 | <50 | 2 |
| miR-4795-3p | <50 | <50 | 65 | <50 | <50 | 85 | <50 | 2 |
| miR-5009-3p | <50 | <50 | <50 | <50 | <50 | 94 | <50 | 1 |
| miR-5011-5p | <50 | <50 | <50 | 100 | 75 | <50 | <50 | 2 |
| miR-5582-3p | <50 | <50 | 90 | <50 | <50 | <50 | 51 | 2 |
| miR-5584-3p | 88 | 73 | <50 | <50 | <50 | <50 | <50 | 2 |
| miR-5688 | <50 | 87 | <50 | 52 | <50 | <50 | <50 | 2 |
| miR-5692a | 78 | 89 | 87 | <50 | <50 | <50 | 100 | 4 |
| miR-5692b | <50 | <50 | <50 | 99 | <50 | <50 | 52 | 2 |
| miR-5692c | <50 | <50 | <50 | 99 | <50 | <50 | 52 | 2 |
| miR-5706 | <50 | <50 | <50 | <50 | <50 | <50 | 85 | 1 |
| miR-6074 | <50 | <50 | <50 | 76 | 90 | 67 | <50 | 3 |
| miR-6853-3p | <50 | <50 | <50 | 89 | <50 | <50 | <50 | 1 |
| miR-6882-5p | <50 | <50 | <50 | 87 | <50 | <50 | <50 | 1 |
| miR-7161-5p | <50 | <50 | <50 | 87 | <50 | <50 | <50 | 1 |
| miR-8080 | <50 | <50 | <50 | 87 | <50 | <50 | <50 | 1 |
| miR-12136 | <50 | <50 | 85 | <50 | <50 | 60 | <50 | 2 |
| Name of the Cancer | Abbreviation | Size of the Control Group | Number of Patients |
|---|---|---|---|
| Adrenocortical carcinoma | ACC | 128 | 77 |
| Bladder urothelial carcinoma | BLCA | 28 | 404 |
| Breast invasive carcinoma | BRCA | 291 | 1085 |
| Cervical squamous cell carcinoma and endocervical adenocarcinoma | CESC | 13 | 306 |
| Cholangiocarcinoma | CHOL | 9 | 36 |
| Colon adenocarcinoma | COAD | 349 | 275 |
| Lymphoid neoplasm diffuse large B-cell lymphoma | DLBC | 337 | 47 |
| Esophageal carcinoma | ESCA | 286 | 182 |
| Glioblastoma multiforme | GBM | 207 | 163 |
| Head and neck squamous cell carcinoma | HNSC | 44 | 519 |
| Kidney chromophobe | KICH | 53 | 66 |
| Kidney renal clear cell carcinoma | KIRC | 100 | 523 |
| Kidney renal papillary cell carcinoma | KIRP | 60 | 286 |
| Acute myeloid leukemia | LAML | 70 | 173 |
| Brain lower grade glioma | LGG | 207 | 518 |
| Liver hepatocellular carcinoma | LIHC | 160 | 369 |
| Lung adenocarcinoma | LUAD | 347 | 483 |
| Lung squamous cell carcinoma | LUSC | 338 | 486 |
| Ovarian serous cystadenocarcinoma | OV | 88 | 426 |
| Pancreatic adenocarcinoma | PAAD | 171 | 179 |
| Pheochromocytoma and Paraganglioma | PCPG | 3 | 182 |
| Prostate adenocarcinoma | PRAD | 152 | 492 |
| Rectum adenocarcinoma | READ | 318 | 92 |
| Sarcoma | SARC | 2 | 262 |
| Skin cutaneous melanoma | SKCM | 558 | 461 |
| Stomach adenocarcinoma | STAD | 211 | 408 |
| Testicular germ cell tumors | TGCT | 165 | 137 |
| Thyroid carcinoma | THCA | 337 | 512 |
| Thymoma | THYM | 339 | 118 |
| Uterine corpus endometrial carcinoma | UCEC | 91 | 174 |
| Uterine carcinosarcoma | UCS | 78 | 57 |
Disclaimer/Publisher’s Note: The statements, opinions and data contained in all publications are solely those of the individual author(s) and contributor(s) and not of MDPI and/or the editor(s). MDPI and/or the editor(s) disclaim responsibility for any injury to people or property resulting from any ideas, methods, instructions or products referred to in the content. |
© 2023 by the authors. Licensee MDPI, Basel, Switzerland. This article is an open access article distributed under the terms and conditions of the Creative Commons Attribution (CC BY) license (https://creativecommons.org/licenses/by/4.0/).
Share and Cite
Korbecki, J.; Bosiacki, M.; Chlubek, D.; Baranowska-Bosiacka, I. Bioinformatic Analysis of the CXCR2 Ligands in Cancer Processes. Int. J. Mol. Sci. 2023, 24, 13287. https://doi.org/10.3390/ijms241713287
Korbecki J, Bosiacki M, Chlubek D, Baranowska-Bosiacka I. Bioinformatic Analysis of the CXCR2 Ligands in Cancer Processes. International Journal of Molecular Sciences. 2023; 24(17):13287. https://doi.org/10.3390/ijms241713287
Chicago/Turabian StyleKorbecki, Jan, Mateusz Bosiacki, Dariusz Chlubek, and Irena Baranowska-Bosiacka. 2023. "Bioinformatic Analysis of the CXCR2 Ligands in Cancer Processes" International Journal of Molecular Sciences 24, no. 17: 13287. https://doi.org/10.3390/ijms241713287
APA StyleKorbecki, J., Bosiacki, M., Chlubek, D., & Baranowska-Bosiacka, I. (2023). Bioinformatic Analysis of the CXCR2 Ligands in Cancer Processes. International Journal of Molecular Sciences, 24(17), 13287. https://doi.org/10.3390/ijms241713287