Article

Quantitative Lipid Profiling Reveals Major Differences between Liver Organoids with Normal Pi*M and Deficient Pi*Z Variants of Alpha-1-antitrypsin

1
Molecular Genetics and Genetic Diagnostic Units, Institute of Rare Diseases Research (IIER), Spanish National Institute of Health Carlos III (ISCIII), 28220 Madrid, Spain
2
Models and Mechanisms Unit, Institute of Rare Diseases Research (IIER), Spanish National Institute of Health Carlos III (ISCIII), 28220 Madrid, Spain
3
Centro de Investigación Biomédica en Red de Enfermedades Raras, CIBERER U758, 28029 Madrid, Spain
4
Bioinformatics Unit, Institute of Health Carlos III (ISCIII), 28220 Madrid, Spain
5
General and Digestive Surgery Department, Hospital 12 de Octubre, 28041 Madrid, Spain
6
Paediatric Hepatology Service, Research Institute of University Hospital La Paz, (IdiPAZ), 28046 Madrid, Spain
7
Digestive Department, Hospital 12 de Octubre, 28041 Madrid, Spain
8
Department of Respiratory Medicine, Member of the German Center for Lung Research (DZL), Biomedical Research in Endstage and Obstructive Lung Disease Hannover (BREATH), Hannover Medical School, 30625 Hannover, Germany
*
Author to whom correspondence should be addressed.
Int. J. Mol. Sci. 2023, 24(15), 12472; https://doi.org/10.3390/ijms241512472
Submission received: 29 June 2023 / Revised: 27 July 2023 / Accepted: 3 August 2023 / Published: 5 August 2023
(This article belongs to the Special Issue Genetic, Genomic and Metabolomic Investigation of Rare Diseases)

Abstract

:
Different mutations in the SERPINA1 gene result in alpha-1 antitrypsin (AAT) deficiency and in an increased risk for the development of liver diseases. More than 90% of severe deficiency patients are homozygous for Z (Glu342Lys) mutation. This mutation causes Z-AAT polymerization and intrahepatic accumulation which can result in hepatic alterations leading to steatosis, fibrosis, cirrhosis, and/or hepatocarcinoma. We aimed to investigate lipid status in hepatocytes carrying Z and normal M alleles of the SERPINA1 gene. Hepatic organoids were developed to investigate lipid alterations. Lipid accumulation in HepG2 cells overexpressing Z-AAT, as well as in patient-derived hepatic organoids from Pi*MZ and Pi*ZZ individuals, was evaluated by Oil-Red staining in comparison to HepG2 cells expressing M-AAT and liver organoids from Pi*MM controls. Furthermore, mass spectrometry-based lipidomics analysis and transcriptomic profiling were assessed in Pi*MZ and Pi*ZZ organoids. HepG2 cells expressing Z-AAT and liver organoids from Pi*MZ and Pi*ZZ patients showed intracellular accumulation of AAT and high numbers of lipid droplets. These latter paralleled with augmented intrahepatic lipids, and in particular altered proportion of triglycerides, cholesterol esters, and cardiolipins. According to transcriptomic analysis, Pi*ZZ organoids possess many alterations in genes and cellular processes of lipid metabolism with a specific impact on the endoplasmic reticulum, mitochondria, and peroxisome dysfunction. Our data reveal a relationship between intrahepatic accumulation of Z-AAT and alterations in lipid homeostasis, which implies that liver organoids provide an excellent model to study liver diseases related to the mutation of the SERPINA1 gene.

Graphical Abstract

1. Introduction

Alpha-1 antitrypsin deficiency (AATD) is a rare inherited disorder (ORPHA 60) most prevalent among Caucasians (1:2000–5000 people). AATD is characterized by low levels of circulating alpha-1 antitrypsin (AAT), it is a risk factor for developing lung and/or liver diseases, as well as neutrophilic panniculitis or systemic vasculitis in some cases [1]. AATD is a monogenic condition caused by mutations in the SERPINA1 gene [2] encoding AAT, an acute phase glycoprotein and a major inhibitor of neutrophil elastase primarily synthetized in hepatocytes (by about 80%) and then released into the bloodstream, it also expressed to a lesser extent by monocytes and macrophages [3,4]. In addition, AAT is regarded as a multifunctional immunomodulatory protein that inhibits apoptosis and binds and neutralizes activities of cytokines and oxidants, among others [5,6].
The SERPINA1 gene is localized in the long arm of chromosome 14, is composed of 7 exons, and has more than 150 allelic variants [7]. Some of the variants seem to have no clinical relevance and are classified as “normal” or as a typical “M” variant. Clinically relevant, so-called deficient, variants result from point mutations or small deletions in the SERPINA1 gene which lead to the low or undetectable levels of circulating AAT protein. The S allele (Glu206Val) originating from a point mutation in exon 3 and the Z allele (Glu342Lys) from a point mutation in exon 5 are the most common. In fact, about 96% of clinically recognized AATD cases carry the Z allele in homozygosity and only about 4–5% are heterozygous (Pi*SZ or Pi*MZ) or contain other rare alleles [2,8]. The Z allele is the most clinically relevant [7]. The Z mutation alters the normal folding of the AAT protein and triggers its polymerization. Therefore, hepatic manifestations are related to “gain of function mechanisms” due to the intrahepatic accumulation and cytotoxicity of Z-AAT polymers [9]. By contrast, lung pathologies are linked to “loss of function mechanisms” due to the low circulating monomeric and high polymeric Z-AAT having insufficient antiprotease/anti-inflammatory activities [3], notwithstanding that other epigenetic factors can also contribute [10,11].
Recent studies described lipid alterations in Pi*ZZ patients with liver diseases. Specifically, serum levels of triglyceride and cholesterol levels were found to be lower in AATD in comparison to non-AATD patients [12,13]. Transgenic mice expressing the human Z allele also showed alterations in hepatic lipid metabolism, namely increased levels of hepatic triglycerides and cholesterol [14], and high numbers of lipid droplets [12]. Lipids are key cellular components necessary for maintaining the integrity of the cellular membranes and energy homeostasis, although they may also contribute to pathologies [15]. Specifically, the formation of intracellular lipid droplets (lipid storage) can trigger pathological mechanisms [16].
Hepatic organoids are new models that reproduce the main characteristics of the liver and are useful for the modeling of hepatic disease or drug screening [17,18]. Liver organoids offer possibilities for deepening the understanding of the molecular mechanisms underlying Z-AAT polymerization and the related consequences of AATD, and for testing new therapeutic strategies. Herein, we used hepatic organoids derived from liver biopsies obtained from a Pi*MZ and a Pi*ZZ patient (MZ-ORG and ZZ-ORG) and from a Pi*MM, non-deficient individual (MM-ORG), with the aim of checking whether liver organoid cultures also recapitulate the hepatic steatosis found in patients with AATD and investigating the molecular alterations related to such lipid deposits leading to liver damage. Experimental data based on Z-AAT expressing HepG2 cells and AATD patient-derived organoids confirmed a link between AAT polymer accumulation and changes in hepatic lipid metabolism.

2. Results

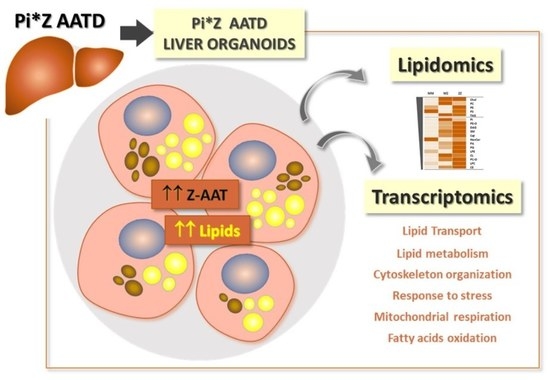
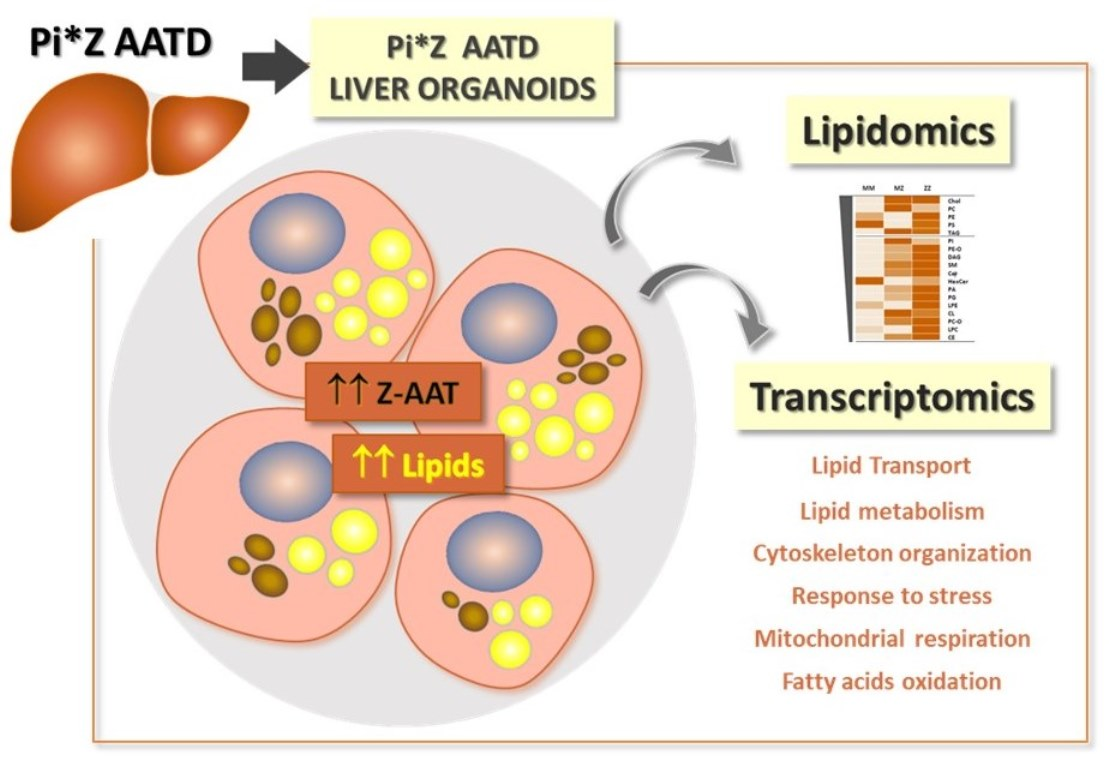
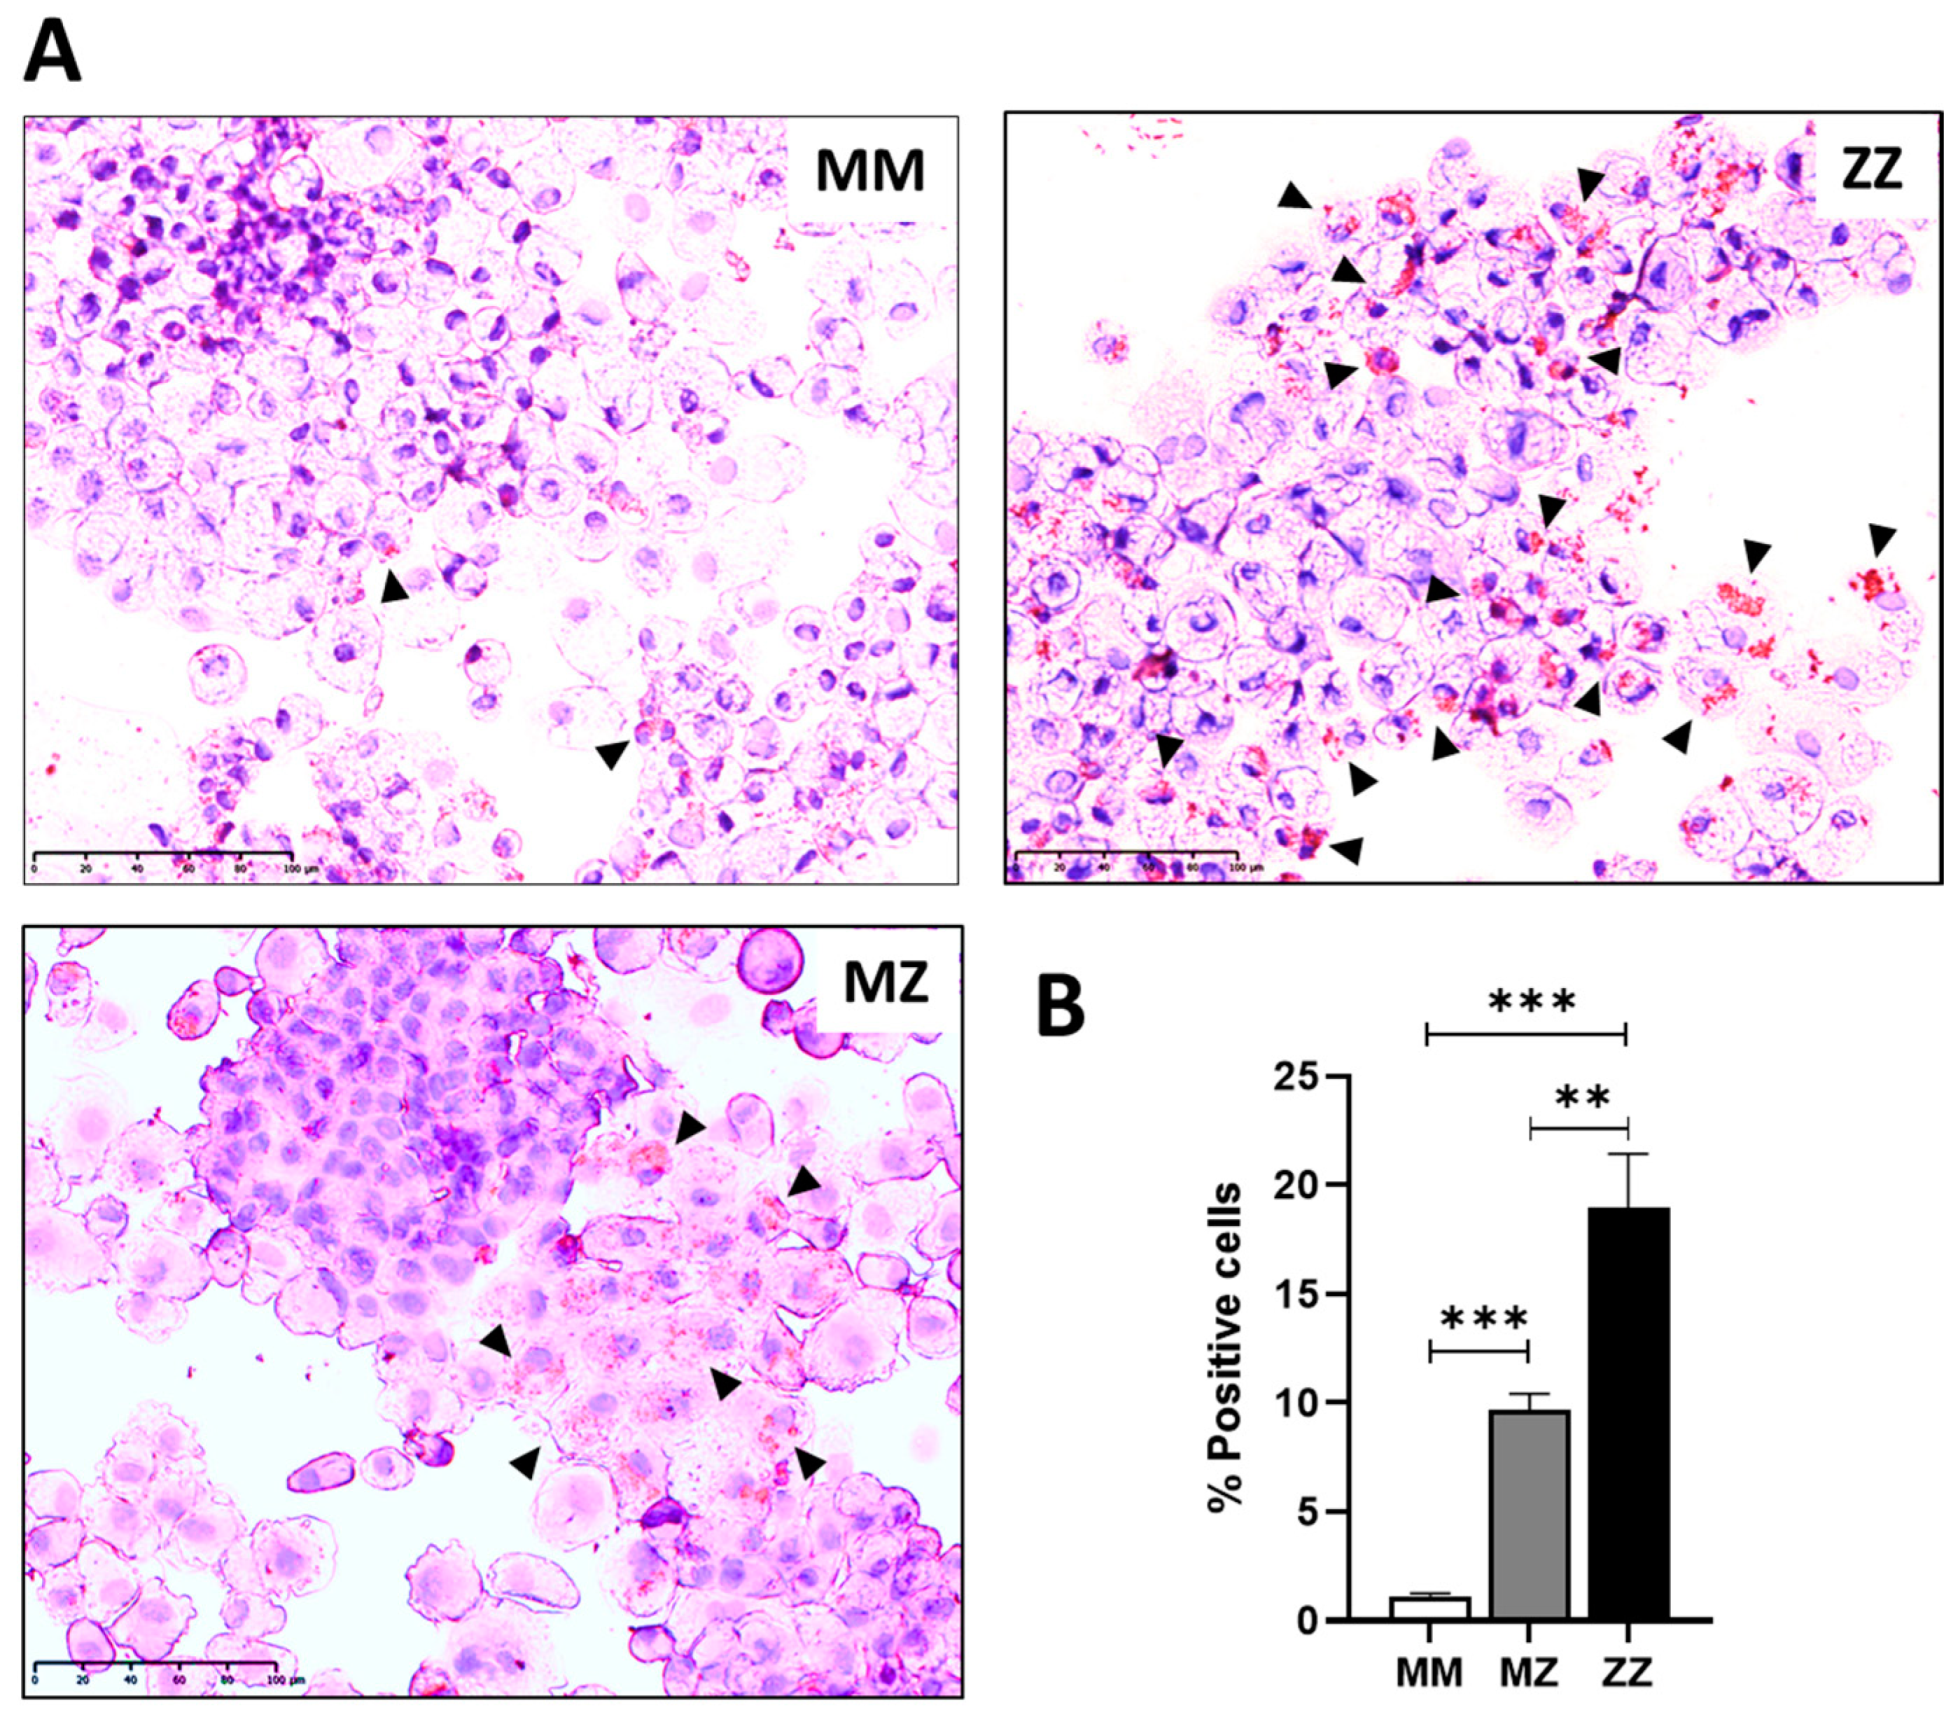
2.1. Intracellular Accumulation of Z-AAT Polymers Parallel with Increased Lipid Content

We first used HepG2 cells expressing Z- or M-AAT to check for intracellular AAT and lipid accumulation. As shown in Figure 1, HepG2 cells transfected with either M or Z alleles expressed higher amounts of intracellular protein in comparison to transfected cells when immunohistochemistry was performed to detect total AAT protein (Figure 1A). As expected, cell lines containing M-AAT plasmids expressed a high amount of monomeric AAT protein, whereas cells transfected with Z-AAT plasmid expressed Z-AAT polymers which retained in the insoluble cell fraction (Figure 1B). Remarkably, HepG2 cells expressing Z-AAT polymers, but not M-AAT monomers, contained a lot of intracellular lipid droplets (LDs) stained with Oil-Red O (Figure 1C, D).
To further investigate if there is a link between intracellular Z-AAT polymers and lipid accumulation, we performed Oil-Red O staining in liver organoids (Figure 2). When compared to MM-ORG, MZ-, but especially ZZ-ORG, had a high number of cells containing LDs which paralleled with Z-AAT polymer accumulation (Figure 2A, B).

2.2. Differences in Lipidomic Profiles between MM-, MZ-, and ZZ-ORGs

Mass spectrometry and quantitative lipidomic analyses were used to determine membrane and intracellular lipids. As shown in Figure 3A, the total content of lipids was significantly higher in MZ- and ZZ-ORG than in MM-ORG. A more detailed analysis revealed specific lipid species being substantially high in MZ- but even higher in ZZ-ORG compared to in MM-ORG (Table 1). As illustrated in Figure 3B, ZZ-ORG showed the largest number of significantly altered lipid species while MZ-ORG had an intermediate profile. Among the most abundant intracellular lipids (those with >1000 pmol), there were triglycerides (TAG), cholesterol (Chol), and phosphatidylcholine (PC) which were clearly higher in MZ- and ZZ-ORG than in MM-ORG. C lipids of intermediate abundance (10–1000 pmol), ceramides (CERs), cardiolipins (CLs), phosphatidylcholine (-ether) (PC-O), phosphatidylethanolamine (-ether) (PE-O), and cholesterol esters (CEs) were found to be higher in MZ- and ZZ-ORG relative to MM-ORG. Lipids with lower abundance (<10 pmol) included different lysophospholipids, many of which were not detected in MZ-ORG but were high in ZZ-ORG (Figure 3B).

2.3. Distribution of Specific Lipids within ZZ-, MZ-, and MM-ORG Relative to the Total Lipid Content

Examining the percentages of the specific lipid classes within the total lipid content, we found that MZ- and ZZ-ORG had more similar lipid profiles in comparison to MM-ORG (Figure 3C). Among the dominant lipid species in MZ- and ZZ-ORG were TAG, PE-O, CER, CL, PC-O, and CE (Table 2). Specifically, TAG constituted 7% of total lipids in MM-ORG but was significantly increased by nearly 16% in MZ- and ZZ-ORG (p < 0.0001). Similarly, CE represented less than 0.1% of lipids in MM-ORG but was increased by 0.6–0.8% in MZ- and ZZ-ORG (p < 0.0001). By contrast, the proportion of other lipid species, such as PC, was significantly lower in ZZ-ORG relative to MZ-ORG (p = 0.0066) or MM-ORG (p = 0.0028) (Figure 3C, Table 2).

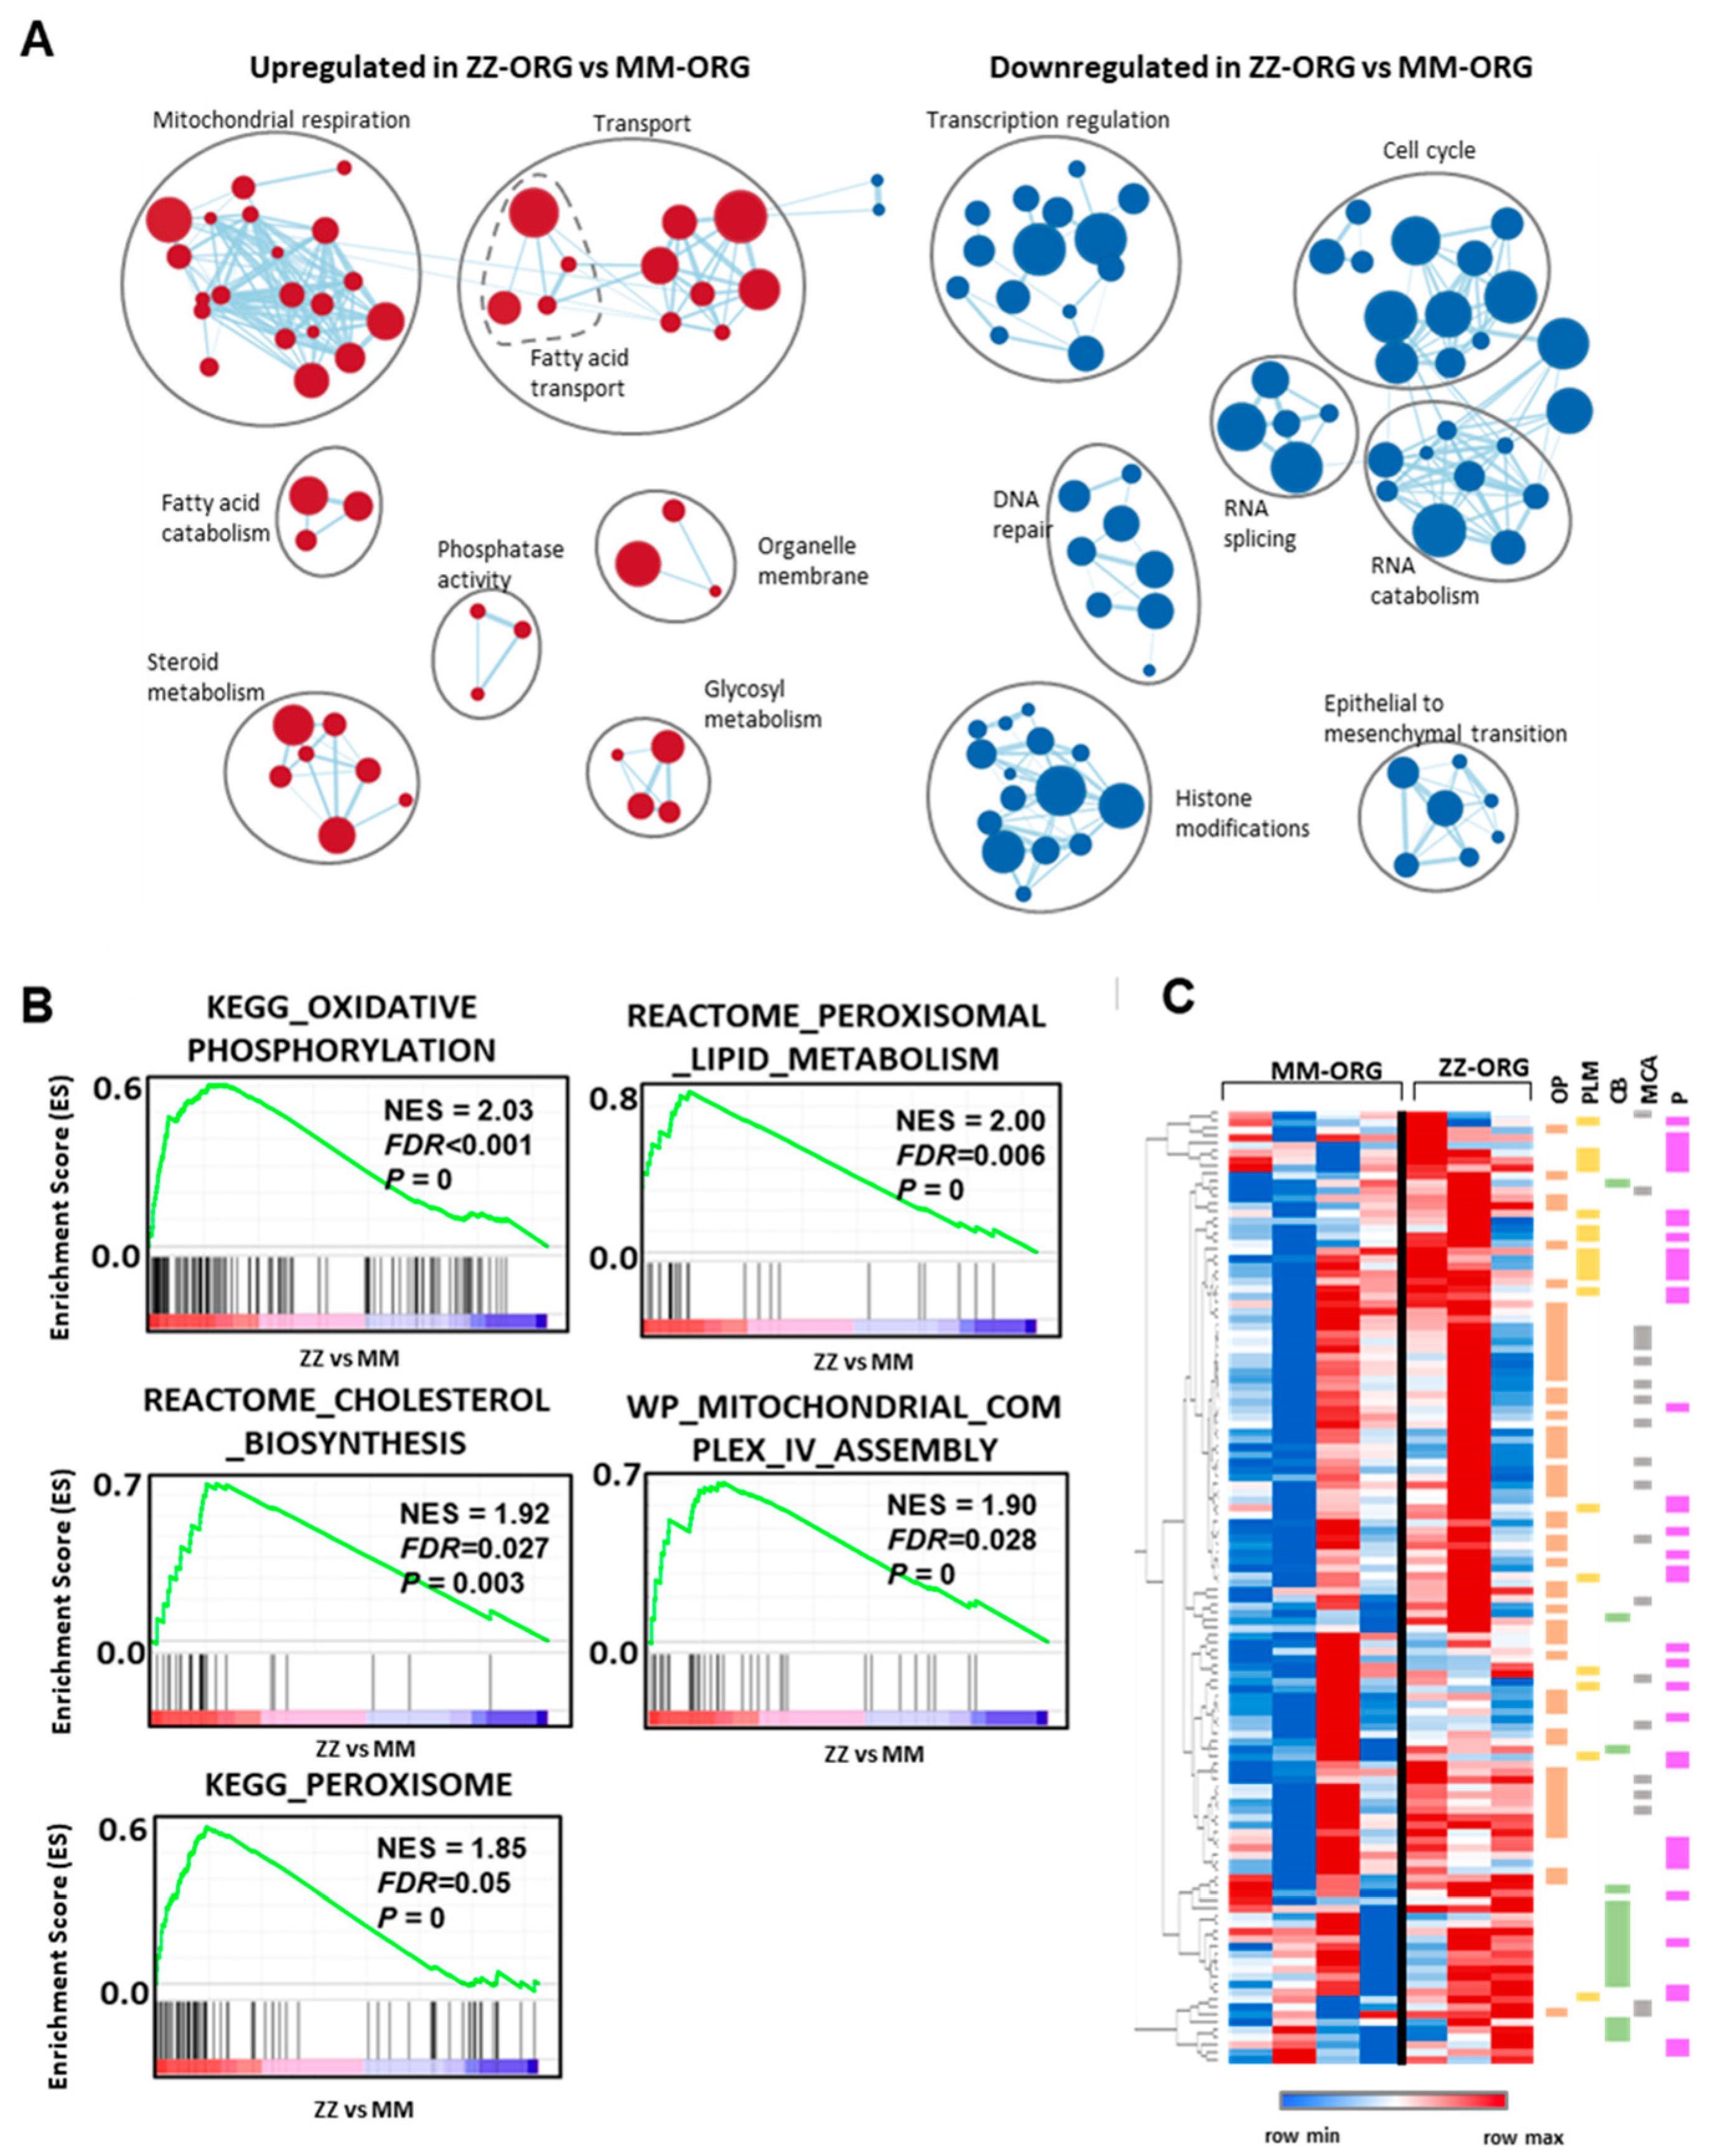
2.4. Functional Annotation Analysis of Differentially Expressed Genes (DEGs) between ZZ- and MM-ORG

To characterize MM- and ZZ-ORG in more detail, we performed a transcriptome analysis. When comparing ZZ- and MM-ORG, we found 633 DEGs, among which 345 were up-regulated and 288 down-regulated in ZZ- versus MM-ORG. Functional annotation analysis of DEGs based on enrichment of Gene Ontology (GO) terms and KEGG pathways revealed five gene clusters related to different functions (Table 3). Cluster 1 included genes of actin binding (False Discovery Rate, FDR: 8.25 × 10⁻⁷), cytoskeleton organization (FDR: 0.0017), and vesicles (FDR: 0.039), such as WAS/WASL, interacting protein family member 3 (WIPF3), FH2 domain containing 1 (FHDC1), actin related protein 3C (ACTR3C), and transferrin receptor (TFRC). On the other hand, the cluster 2 included genes associated with metabolic process (FDR: 1.45 × 10⁻⁹), regulation of gene expression (FDR: 3.64 × 10⁻⁹), response to stress (FDR: 4.68 × 10⁻⁶), and inflammatory response (FDR: 0.001). Specifically, this cluster included genes encoding enzymes like phospholipase C beta 1 (PLCB1), argininosuccinate synthase 1 (ASS1), insulin like growth factor binding protein 5 (IGFBP5) or cytochrome p450 oxidoreductase (POR), and a number of transcription factors, such as GATA binding protein 3 (GATA3), Jun proto-oncogene, AP-1 transcription factor subunit (JUN), activating transcription factor 3 (ATF3), MAF bZIP transcription factor (MAF), MYCN proto-oncogene, and bHLH transcription factor (MYCN) which may regulate complex processes related to cellular stress response and inflammatory response. Furthermore, cluster 2 included genes encoding alpha-2-macroglobulin (A2M) and serpin family members (SERPINE1, SERPINF1), which are involved in the regulation of proteolysis. Cluster 3 contained genes related to liver metabolism such as drug metabolism (FDR: 4.22 × 10⁻⁶), fatty acid metabolic process (FDR:0.04), and bile secretion (FDR:0.0025). Among other genes were CD36, acyl-CoA thioesterase 1 and 2 (ACOT1, ACOT2) carnitine O-octanoyltransferase (CROT), cytochrome P450 family members (CYP2A6, CYP1B1), and some UDP glucuronosyltransferase (UGT2B10, UGT2B28, UGT1A4, UGT1A5). Cluster 4 formed genes related to the intrinsic components of plasma membrane (FDR: 0.02) and cell junctions (FDR:0.001), whereas a cluster 5 included genes of the organelle and endomembrane system (FDR: 0.002), Golgi apparatus (FDR:0.002), and cation channel complexes. In this latter cluster were Mannosidase alpha class 1A member 1 (MAN1A1) and genes involved in ER to Golgi vesicle-mediated transport, such as Bet1 Golgi vesicular membrane trafficking protein (BET1), KDEL endoplasmic reticulum protein retention receptor 2 (KDELR2), or YKT6 V-SNARE homolog (YKT6), as well as different polypeptide N-acetylglucosaminyltransferases (GALNT12, GALNT5, GALNT6).

2.5. Gene Set Enrichment Analysis (GSEA) in ZZ-ORG Versus MM-ORG

We used GSEA to interpret gene expression data and find differentially enriched functional terms in ZZ-ORG comparing to MM-ORG (Figure 4A). The top upregulated genes in ZZ-ORG revealed significant GO terms such as cellular transport, fatty acid transport, mitochondrial respiration, fatty acid catabolism, steroid metabolism, glycosyl metabolism, phosphatase activity, and organelle membranes. On the other hand, highly downregulated genes appear grouped in GO terms as cell cycle, transcription regulation, RNA splicing, RNA catabolism, DNA repair, histone modification, and epithelial to mesenchymal transition (Figure 4A).
Furthermore, different established pathways (KEGG, Reactome, WP) were also found significantly upregulated in ZZ-ORG relative to MM-ORG, revealing 126 genes involved in oxidative phosphorylation (FDR < 0.001), mitochondrial complex IV assembly (FDR = 0.028), cholesterol biosynthesis (FDR = 0.027), peroxisome (FDR = 0.05), and peroxisomal lipid metabolism (FDR = 0.006) (Figure 4B). The unsupervised clustering of the genes in the leading edge of the gene sets (Figure 4B) showed that genes belonging to these pathways are coordinately overrepresented in ZZ-ORGs (Figure 4C).

2.6. Expression Levels of Specific DEGs Related to Lipid Transport and Metabolism

Focusing on different aspects of lipid homeostasis, we found several DEGs related to lipid transport and metabolism (Figure 5). In comparison with MM-ORG, ZZ-ORG showed lower expression of Fatty Acid Binding Protein 1, FABP1 (intracellular lipid transporter), and Proline Rich Acidic Protein 1, PRAP1 (promoter of lipoprotein assembly and secretion). Moreover, lipid metabolism genes, such as ACOT1 and ACOT2, involved in the regulation of fatty acid oxidation were also downregulated in ZZ-ORG. On the other hand, ZZ-ORG showed higher expression of CD36 (a long-chain fatty acids transporter), CROT (a gene involved in peroxisomal lipid metabolism and fatty acid beta-oxidation), PNPLA3 (a TAG hydrolase), PNPLN8 (which catalyses the cleavage of fatty acids from membrane phospholipids), ASS1 (an enzyme of the urea cycle), and ABCG5 (involved in sterol excretion by the liver into bile).

3. Discussion

Homozygous Pi*ZZ AATD is a genetic condition caused by the incorrect folding of the Z-AAT protein, which through different molecular mechanisms can affect the liver and/or lungs [1,3]. Although most heterozygotes Pi*MZ individuals remain clinically healthy, the Z-allele is still considered a genetic modifier and a risk factor for cirrhosis in alcoholic and non-alcoholic fatty liver diseases [19]. The pathophysiological mechanisms implicated in Pi*Z AATD-related liver diseases are still incompletely understood.
Human organoids, as a novel model system, are very useful in studying organ health and diseases, as well as the effects of treatments [20,21]. Three-dimensional liver organoids are becoming more widely used for developmental and chronic disease modelling because they represent human liver cells more accurately than in vitro cell cultures lacking 3D tissue organization or in vivo animal models which are expensive, difficult to generate, and cannot completely recapitulate the underlying mechanisms of human diseases. For example, previous work from our group and others shows that liver organoids derived from Pi*ZZ AATD patients mimic the main liver features, are, namely, positive for PAS (Periodic acid-Schiff) diastase-resistant staining, contain intracellular Z-AAT polymers, and show reduced secretion of AAT into extracellular medium [17]. Moreover, in comparison with Pi*MM, Pi*ZZ liver organoids express lower levels of albumin or apolipoprotein B, two hepatocyte markers reported to be reduced in Pi*ZZ AATD liver patients [12,17]. In this study we further confirm that ZZ-ORG, and to a lesser extend MZ-ORG, are positive for PAS staining and accumulate Z-AAT polymers in hepatocytes.
Recent clinical studies provide clear evidence that patients with Pi*ZZ AATD-related liver disease often develop steatosis [12,22]. Hepatic steatosis is defined by the formation of cytosolic LDs in more than 5% of the hepatocytes and may reflect early liver injury [23] related to various pathologies, including non-alcoholic fatty liver disease (NAFLD) [24].
Our results show that liver ZZ-ORG contain more LD-positive cells and that LDs are larger than in MZ-ORG and, especially, than in MM-ORG. Likewise, according to lipidomic analysis, total lipid content is higher in ZZ-ORG, and also in MZ-ORG, relative to MM-ORG. These results support previously reported findings in Z-AAT transgenic mice models, and in cohorts of Pi*ZZ liver patients [12,22]. For example, liver steatosis was observed in Z-AAT overexpressing mice as well as in Pi*ZZ patients, as assessed by controlled attenuation parameter (CAP) [12]. Furthermore, it has been reported that liver patients with Pi*ZZ AATD have lower serum levels of triglycerides and very low-density lipoprotein cholesterol (VLDL), which may reflect an impaired hepatic secretion of lipids [12]. In fact, most of the lipid species evaluated in liver organoids were strongly augmented in ZZ-ORG compared to MM-ORG. Despite the net increase in many lipid species in ZZ-ORG, triacylglycerol (TAG) and cholesterol esters (CEs) together with ceramides (CERs) and cardiolipins (CLs) were most significantly elevated. TAG and CE are typically stored in LDs, and act as energy storages and protectors against deleterious effects of free fatty acids [25]. Moreover, TAG and CE are in the core of lipoproteins, which distribute lipids to the different tissues and organs [26]. The observed significant increment of TAG and CE might be related to higher numbers and sizes of intracellular LDs in ZZ- and in MZ-ORG in comparison to MM-ORG. On the other hand, the significantly lower percentage of phosphatidylcholine (PC) in ZZ-ORG than in MZ- or MM-ORG may also be related to the larger LDs in ZZ-ORG. The PC localizes on the surface of LDs and is described as an inhibitor of LDs’ enlargement [27]. These findings enable us to speculate that high number of large intrahepatic LDs may be related to hindered lipoprotein export from Pi*ZZ hepatocytes.
The levels of ceramides are also higher in ZZ-ORG relative to MM-ORG. Ceramides are precursors of sphingolipids and constituents of the cell membrane subdomains so called lipid rafts [28]. Ceramides increase upon cellular stimulation, and according to model membrane studies, an increase in ceramide/cholesterol content promotes the miscibility of lipid rafts [29]. This structural alteration in lipid rafts has been related to impaired liver function [30]. Finally, cardiolipins, which are also higher in ZZ-ORG, are among the most abundant lipids in the inner mitochondrial membrane, playing roles in mitochondria stability, metabolism, and dynamics [31]. It is conceivable that abnormalities in the content and/or the composition of cardiolipins may negatively impact mitochondrial function, with implications in diseases such as NAFLD [32].
Likewise, differential gene expression analysis between ZZ-ORG and MM-ORG revealed a divergent expression of genes encoding proteins related to lipid and fatty acids metabolism. For instance, in comparison with MM-ORG, ZZ-ORG showed a higher expression of CD36, a gene coding a transmembrane protein in charge of hepatic fatty acid uptake [33], which could contribute to the increased lipid content of hepatocytes. On the other hand, ZZ-ORG showed a lower expression of FABP1, a gene encoding a fatty acid binding protein responsible for the intracellular transport of long chain fatty acids and the assembly and export of lipoproteins. This hepatic protein might also play a role in controlling oxidative stress because its main function is to direct fatty acids to oxidation into the mitochondria [34]. Data from experimental models show that FABP1 silencing results in intrahepatic TAG accumulation and the development of liver disease [35], while FABP1 can also act as a transcription factor activating genes contributing to TAG accumulation [36].
The liver is a central organ that maintains de novo lipogenesis and triglyceride secretion in a form of lipoproteins [37,38]. As mentioned above, patients with Pi*ZZ AATD-related liver disease have lower levels of circulating triglycerides and VLDL than non-AATD liver patients [12]. We found that the expression of the APOB gene is significantly lower in ZZ-ORG compared to MM-ORG [17]. The APOB protein provides stability for the lipoproteins, and the isoform APOB100 is a key component of HDL, LDL, and VLDL [39]. Apolipoproteins assemble in the ER, and thus TAG accumulation can induce ER stress and the inhibition of APOB synthesis [40]. The lower expression of APOB could contribute to the steatosis in Pi*ZZ AATD patients, as it has been similarly described for APOA1 and APOF in NAFLD [41,42]. Hence, altered lipoprotein transport and secretion, mirrored by the reduced expression of APOB and/or FABP1, and increased expression of CD36 may, at least in part, explain the accumulation of lipids in Pi*ZZ liver. Concomitantly, other altered genes in ZZ-ORG also point to defective lipid processes such as fatty acid metabolism and bile acids secretion. ZZ-ORG showed overexpression of patatin-like phospholipase domain containing 8 (PNPLA8), a mitochondria membrane-bound phospholipase which cleaves phospholipid releasing fatty acids regulating membrane physical properties. The overexpression of PNPLA8 is thought to cause mitochondrial abnormalities and dysfunction [43]. The CROT is another overexpressed gene found in ZZ-ORG that is involved in transport of medium- and long- chain acyl-CoA molecules out of the peroxisome to the cytosol and mitochondria. Other upregulated genes in ZZ-ORG, including several UDP glucuronosyltransferases (UGT1A4, UGT1A5, UGT2B28, UGT2B10) and ATP Binding Cassette Subfamily G Member 5, ABCG5, pointed to putatively altered bile secretion.
Likewise, GSEA functional readouts of the DEGs found in ZZ-ORG pointed to metabolic alterations, specifically to a downregulation of replication and transcription related genes, which are a hallmark of basal cellular activity, and a significant upregulation in genes of mitochondrial function, oxidative phosphorylation, and cholesterol biosynthesis, together with peroxisome and peroxisome lipid metabolism. In previous studies based on cell models, liver tissues of Pi*ZZ patients and transgenic mice expressing human Z-AAT described alterations in mitochondrial autophagy [44]. It is proposed that mitochondrial damage, including mitochondrial depolarization, increased permeability, and the activation of oxidative signaling pathways, occurs due to the intracellular accumulation of Z-AAT and lipids. In support of this idea, the alteration in the redox state of the liver ER was demonstrated in a transgenic Z-AAT expressing mice model [45]. In line, multi-omics analysis of MZ and ZZ edited iPSCs differentiated to hepatocytes (iHeps) revealed altered ER and mitochondrial morphology, reduced mitochondrial respiration, and branch-specific activation of the UPR [46]. Our results, both at transcription level and lipid alterations, also highlight the mitochondria as a player in AATD-related liver disease development. The DEG analysis revealed a significant number of mitochondrial genes of oxidative phosphorylation to be overexpressed in ZZ-ORG. As already mentioned, cardiolipins specifically were found to be higher expressed in ZZ-ORG than in MM-ORG [31].
Mitochondrial and peroxisomal proteins have functional overlap in lipid catabolism [47]. Among overexpressed DEGs in ZZ-ORG, we found peroxisome, peroxisome lipid metabolism, and cholesterol biosynthesis genes. Peroxisomes are also involved in lipid degradation and in the synthesis of bile acids [48]. Hence, increased peroxisomal β-oxidation can inhibit lipid hydrolysis and induce hepatic steatosis [49].
Bringing it all together, current knowledge suggests that AATD-associated lipid accumulation in hepatocytes can be initiated concomitantly with an increase in Z-AAT polymers and alterations in metabolic organelles, namely the ER, mitochondria, and peroxisome. Historical studies observed the increased number of peroxisomes located near dilated ER in Pi*ZZ hepatocytes, but no further experiments have been performed [50]. The peroxisomal involvement in AATD liver disease warrants further studies; therefore, patient-derived organoids are useful models for this purpose. Furthermore, patient-derived ZZ-, MZ-, and MM-ORG are appropriate models resembling the heterogeneity in degree of steatosis and liver damage found in patients with genetic variants of AAT. However, organoids are usually derived from a limited number of samples and conclusions obtained from comparison among genotype categories might not be representative for all patients. However, organoid models are interesting in revealing inter-individual differences and are useful models in the implementation of personalized medicine.

4. Materials and Methods

4.1. Culture of Human Liver Organoids

Liver organoids from patients with Pi*MZ AATD (who underwent cholecystectomy) and Pi*ZZ AATD (with hepatic failure that had liver transplant) and Pi*MM used as controls (unaffected tissue areas from a person undergoing surgical resection due to hepatocellular carcinoma) (Table 4) were developed as previously described [17]. All subjects signed the informed consent for the study and the research was approved by the ethics committee of Instituto de Salud Carlos III, Madrid, Spain.
Undifferentiated organoids were cultured in extracellular matrix BME-2 and expansion medium (EM) [51]. The differentiation into the hepatocytes was achieved by organoid culture in the differentiation medium (DM) for 15 days, as previously described [51].
To detect intracellular lipids, cytospins of differentiated organoids were prepared. Organoids were disaggregated, incubated in TrypLE Express (GibcoTM, ThermoFisher Scientific) at 37 °C, and centrifuged. After washing with phosphate-buffered saline (PBS), cells were spread on slides and fixed with 4% PFA.

4.2. Culture and Transfection of HepG2 Cell Line

The human hepatocellular carcinoma HepG2 cell line (ATCC No. HB-8065), obtained from the American Type Culture Collection, was grown in DMEM (GibcoTM, ThermoFisher Scientific, Waltham, MA, USA) supplemented with 10% FCS (GibcoTM, ThermoFisher Scientific, Waltham, MA, USA) and antibiotics (pen/strep) at 37 °C with 5% CO2. HepG2 cells were transiently transfected with the expression plasmid pCMV6 (Origene, Maryland, EE. UU), containing either the wild-type M allele or the mutated Z allele [52], with LipofectamineTM 2000 (Thermo Fisher Scientific, Waltham, MA, USA) in serum-free Opti-MEM culture medium (GibcoTM, ThermoFisher Scientific, Waltham, MA, USA) following the manufacturer’s recommendations. Then, transfection Opti-MEM was replaced by complete DMEM and cells were harvested after 48 h for subsequent experiments. HepG2 cells were washed with PBS and fixed with 4% paraformaldehyde (PFA) for further lipid staining.

4.3. Lipid Extraction for Mass Spectrometry Lipidomics

Lipids were extracted using a two-step chloroform/methanol procedure [53]. After extraction, the organic phase was transferred to an infusion plate and dried in a speed vacuum concentrator. The dry extract was re-suspended in 7.5 mM ammonium formiate in chloroform/methanol/propanol (1:2:4, v:v:v). All liquid handling steps were performed using Hamilton Robotics STARlet robotic platform with the Anti Droplet Control feature for organic solvent pipetting.

4.4. Mass Spectrometry Data Acquisition, Analysis, and Post-Processing

Samples were analyzed by direct infusion on a QExactive mass spectrometer (Thermo Scientific) equipped with a TriVersa NanoMate ion source (Advion Biosciences, New York, NY, USA). Samples were analyzed in both positive and negative ion modes with a resolution of Rm/z = 200 = 280,000 for MS and Rm/z = 200 = 17,500 for MSMS experiments, in a single acquisition. MSMS was triggered by an inclusion list encompassing corresponding MS mass ranges scanned in 1 Da increments. Both MS and MSMS data were combined to monitor CE, Chol, DAG, and TAG ions as ammonium adducts; LPC, LPC O-, PC, and PC O- as formiate adducts; and CL, LPS, PA, PE, PE O-, PG, PI, and PS as deprotonated anions. MS was only used to monitor LPA, LPE, LPE O-, LPG, and LPI as deprotonated anions; Cer, HexCer, and SM as formiate adducts; and cholesterol as ammonium adduct of an acetylated derivative.
Data were analyzed with in-house developed lipid identification software based on LipidXplorer. Data post-processing and normalization were performed using an in-house developed data management system. Only lipid identifications with a signal-to-noise ratio >5 and a signal intensity 5-fold higher than in the corresponding blank samples were considered for further data analysis.

4.5. Determination of Intracellular Lipid Content

Intracellular accumulation of lipids was determined by using Oil-Red-O (ORO) (Sigma Aldrich, Madrid, Spain) which binds to neutral lipids. Before staining, preparations were washed once with PBS followed by 60% isopropanol. Staining was carried out at 37 °C for 5 min, then washing was performed with 60% isopropanol and PBS, and finally preparations were visualized using Leica DFC 7000T microscope (Leica Microsystems, Wetzlar, Germany). For quantification, ORO staining was extracted with 1 mL 100% isopropanol and the optical density of the samples was measured at a wavelength of 510 nm using a microplate reader Infinite 200 PRO spectrophotometer (Tecan, Männedorf, Switzerland). Cells were also stained with crystal violet solution and dye was extracted for quantification with 50% 0.1 M sodium citrate (Sigma Aldrich, Madrid, Spain) and 50% ethanol and absorbance was measured at 590 nm. Alternatively, organoids-derived cells were stained with hematoxylin, washed twice with distilled water, and, finally, visualized using Leica DFC 7000T microscope (Leica Microsystems). For quantification, randomly selected fields were captured and lipid content was quantified using IP Win32 software v4.5.0.29.

4.6. Western-Blot Analysis of AAT

Native and polymeric forms of AAT were detected in HepG2 cells transfected with M and Z alleles as previously described [17]. Quantification of the Western blot bands of the AAT protein in MM-ORG and ZZ-ORG was performed with Image J software v1.48. The antibodies used for Western blotting were: rabbit polyclonal antisera against human AAT (1:1000; Dako, Denmark); antibody D11 (1:800) [54] for the detection of AAT aggregates; and monoclonal antibody AC-74 anti-beta-actin (1:5000; Sigma Aldrich). The secondary antibodies used were chicken anti-mouse IgG-HRP (sc-2954 Santa Cruz Biotechnology, USA) and donkey anti-rabbit (Cytiva Europe GMBH, Barcelona Spain), both at 1:5000 dilution.

4.7. Detection of Intracellular AAT by Immunofluoresce

Immunostaining was performed on HepG2 cells transfected with M and Z alleles cultured on coverslips that were fixed at room temperature for 10 min with PBS containing 2% paraformaldehyde (PFA) followed by another 10 min with PBS 4% PFA. After several washes with PBS, the cells were permeabilized in PBS containing 0.1% Triton X-100 and 1% BSA (PBS-TS). The cells were then incubated overnight at 4 °C with the primary antibody against AAT (1:250; Dako, Denmark) diluted in PBS-TS, and after washing with PBS they were incubated for 1 h at room temperature in PBS-TS with ant-rabbit Alexa-488-conjugated secondary antibody (1:400; Invitrogen). Following extensive washes, the preparations were stained with 4′-6-diamidine-2-phenylindole (DAPI; 1:5000; Sigma-Aldrich) and after washing, the cells were immediately mounted with Fluoromount g (Southern Biotech, Birmingham, AL, USA). The preparations were examined under a fluorescence microscope Zeiss Ax10 (Zeiss, Oberkochen, Germany).

4.8. Transcriptomic Analysis of Liver Organoids (RNA-Seq)

Total RNA was isolated from organoid cells using TriReagent (Sigma Aldrich, Madrid, Spain) followed by a DNaseI digestion step to ensure that the samples were not contaminated with genomic DNA. The purity of RNA was assessed using Agilent RNA 6000 Nano Kit and the Agilent 2100 Bioanalyzer. TruSeq Stranded mRNA Kit (Illumina) was used for library preparation based on the recommendations from the manufacturer. The sequencing was performed at the Genomics Unit (ISCIII) on a NextSeq 500 sequencer using 75 base read lengths in paired-end mode. RNA-Seq data were analyzed by the Bioinformatics Facility (ISCIII) with an RNA-seq pipeline (https://github.com/BU-ISCIII/rnaseq-nf) written in Nextflow (https://www.nextflow.io/) based on the those written by nf-core (https://nf-co.re/) (https://github.com/nf-core/rnaseq) (accessed on 21 December 2021). (Accession no. GSE220537).
Functional characterization was investigated using the STRING database (https://string-db.org/) (accessed on 23 May 2022) to find out functional enrichments within the set of differentially expressed genes (DEGs) [55].
For GSEA Preranked, genes were pre-ranked according to the statistic test of fold change in ZZ-ORG versus MM-ORG obtained in the RNA-Seq analysis, setting ‘gene set’ as the permutation method and with 1000 permutations. Clustering of enriched GO terms at p-value < 0.01 was analyzed using EnrichmentMap for Cytoscape. An unsupervised hierarchical cluster heatmap was plotted using Morpheus (https://software.broadinstitute.org/morpheus) (accessed 23 May 2022) with the expression of genes in the leading edge of the significantly enriched gene sets from the Molecular Signature Database (MSigDB) KEEG_Oxidative phosphorylation, REACTOME_Peroximal Lipid metabolism, REACTOME_Cholesterol biosynthesis, WP_Mitochondrial complex IV assembly, and KEGG_Peroxisome.

4.9. Data Processing and Statistical Analysis

Graphical data presentation was performed using GraphPad Prism [Version 9.1.2 (226), Dotamatics]. Student’s t-test was applied to compare two sample means on one variable. The normally distributed data presented as a mean and standard deviation of the mean (SD). If the normality test failed, the nonparametric Kruskal–Wallis one-way analysis followed by Mann–Whitney rank-sum test was performed. A p-value below 0.05 considered as a significant.

Author Contributions

S.P.-L., J.L., N.M., S.R.-D.S. and G.G.-M. isolated the organoids; S.P.-L., J.L., S.G.-M. and G.G.-M. performed the experiments; S.V., S.M. and I.C. analyzed data; I.J., A.M., L.H. and C.G. provided liver biopsies; S.P.-L. and G.G.-M. wrote the manuscript; M.J.B. and S.J. analyzed data and contributed to critical data interpretation; B.M.-D. conceived and supervised the study. All authors have provided comments on the manuscript. All authors have read and agreed to the published version of the manuscript.

Funding

This research was funded by INSTITUTO DE SALUD CARLOS III (ISCIII), grants numbers AESI PI20CIII/00015 and PT20CIII/00009, and the APC was funded by AESI PI20CIII/00015.

Institutional Review Board Statement

The study was conducted in accordance with the Declaration of Helsinki, and approved by the ethics committee of INSTITUO DE SALUD CARLOS III, Madrid, Spain (CEI PI 27_2021-v3, 21/06/2021).

Informed Consent Statement

All subjects signed the informed consent for the study.

Data Availability Statement

The data presented in this study are openly available in the Gene Expression Omnibus (GEO) repository, reference number (GSE220537).

Acknowledgments

We thank members of the Human Genetics Area at IIER, the Genomics Unit and the scientific and technological facilities at the ISCIII for their support. We also thank the BioNER, Biobanco Nacional de Enfermedades Raras for administration and managing samples.

Conflicts of Interest

The authors declare no conflict of interest.

References

  1. Janciauskiene, S.M.; Bals, R.; Koczulla, R.; Vogelmeier, C.; Köhnlein, T.; Welte, T. The Discovery of A1-Antitrypsin and Its Role in Health and Disease. Respir. Med. 2011, 105, 1129–1139. [Google Scholar] [CrossRef] [Green Version]
  2. Foil, K.E. Variants of SERPINA1 and the Increasing Complexity of Testing for Alpha-1 Antitrypsin Deficiency. Ther. Adv. Chronic Dis. 2021, 12, 20406223211015950. [Google Scholar] [CrossRef]
  3. Sinden, N.J.; Baker, M.J.; Smith, D.J.; Kreft, J.-U.; Dafforn, T.R.; Stockley, R.A. α-1-Antitrypsin Variants and the Proteinase/Antiproteinase Imbalance in Chronic Obstructive Pulmonary Disease. Am. J. Physiol. Lung Cell. Mol. Physiol. 2015, 308, L179–L190. [Google Scholar] [CrossRef]
  4. Miravitlles, M. Alpha-1-Antitrypsin and Other Proteinase Inhibitors. Curr. Opin. Pharmacol. 2012, 12, 309–314. [Google Scholar] [CrossRef] [PubMed]
  5. Blanco, I.; Lipsker, D.; Lara, B.; Janciauskiene, S. Neutrophilic Panniculitis Associated with Alpha-1-Antitrypsin Deficiency: An Update. Br. J. Dermatol. 2016, 174, 753–762. [Google Scholar] [CrossRef] [PubMed]
  6. Sun, R.; Xu, Z.; Zhu, C.; Chen, T.; Muñoz, L.E.; Dai, L.; Zhao, Y. Alpha-1 Antitrypsin in Autoimmune Diseases: Roles and Therapeutic Prospects. Int. Immunopharmacol. 2022, 110, 109001. [Google Scholar] [CrossRef]
  7. Seixas, S.; Marques, P.I. Known Mutations at the Cause of Alpha-1 Antitrypsin Deficiency an Updated Overview of SERPINA1 Variation Spectrum. Appl. Clin. Genet. 2021, 14, 173–194. [Google Scholar] [CrossRef]
  8. de Serres, F.J.; Blanco, I. Prevalence of A1-Antitrypsin Deficiency Alleles PI*S and PI*Z Worldwide and Effective Screening for Each of the Five Phenotypic Classes PI*MS, PI*MZ, PI*SS, PI*SZ, and PI*ZZ: A Comprehensive Review. Ther. Adv. Respir. Dis. 2012, 6, 277–295. [Google Scholar] [CrossRef] [PubMed] [Green Version]
  9. Lomas, D.A.; Evans, D.L.; Finch, J.T.; Carrell, R.W. The Mechanism of Z Alpha 1-Antitrypsin Accumulation in the Liver. Nature 1992, 357, 605–607. [Google Scholar] [CrossRef]
  10. Rotondo, J.C.; Oton-Gonzalez, L.; Selvatici, R.; Rizzo, P.; Pavasini, R.; Campo, G.C.; Lanzillotti, C.; Mazziotta, C.; De Mattei, M.; Tognon, M.; et al. SERPINA1 Gene Promoter Is Differentially Methylated in Peripheral Blood Mononuclear Cells of Pregnant Women. Front. Cell Dev. Biol. 2020, 8, 550543. [Google Scholar] [CrossRef]
  11. Qiu, W.; Baccarelli, A.; Carey, V.J.; Boutaoui, N.; Bacherman, H.; Klanderman, B.; Rennard, S.; Agusti, A.; Anderson, W.; Lomas, D.A.; et al. Variable DNA Methylation Is Associated with Chronic Obstructive Pulmonary Disease and Lung Function. Am. J. Respir. Crit. Care Med. 2012, 185, 373–381. [Google Scholar] [CrossRef] [PubMed] [Green Version]
  12. Hamesch, K.; Mandorfer, M.; Pereira, V.M.; Moeller, L.S.; Pons, M.; Dolman, G.E.; Reichert, M.C.; Schneider, C.V.; Woditsch, V.; Voss, J.; et al. Liver Fibrosis and Metabolic Alterations in Adults With Alpha-1-Antitrypsin Deficiency Caused by the Pi*ZZ Mutation. Gastroenterology 2019, 157, 705–719.e18. [Google Scholar] [CrossRef] [PubMed]
  13. Winther, S.V.; Ahmed, D.; Al-Shuweli, S.; Landt, E.M.; Nordestgaard, B.G.; Seersholm, N.; Dahl, M. Severe A1-Antitrypsin Deficiency Associated with Lower Blood Pressure and Reduced Risk of Ischemic Heart Disease: A Cohort Study of 91,540 Individuals and a Meta-Analysis. Respir. Res. 2022, 23, 55. [Google Scholar] [CrossRef]
  14. Khodayari, N.; Wang, R.L.; Oshins, R.; Lu, Y.; Millett, M.; Aranyos, A.M.; Mostofizadeh, S.; Scindia, Y.; Flagg, T.O.; Brantly, M. The Mechanism of Mitochondrial Injury in Alpha-1 Antitrypsin Deficiency Mediated Liver Disease. Int. J. Mol. Sci. 2021, 22, 13255. [Google Scholar] [CrossRef]
  15. Anand, P.K. Lipids, Inflammasomes, Metabolism, and Disease. Immunol. Rev. 2020, 297, 108–122. [Google Scholar] [CrossRef]
  16. Krahmer, N.; Farese, R.V.; Walther, T.C. Balancing the Fat: Lipid Droplets and Human Disease. EMBO Mol. Med. 2013, 5, 905–915. [Google Scholar] [CrossRef]
  17. Gómez-Mariano, G.; Matamala, N.; Martínez, S.; Justo, I.; Marcacuzco, A.; Jimenez, C.; Monzón, S.; Cuesta, I.; Garfia, C.; Martínez, M.T.; et al. Liver Organoids Reproduce Alpha-1 Antitrypsin Deficiency-Related Liver Disease. Hepatol. Int. 2020, 14, 127–137. [Google Scholar] [CrossRef] [PubMed] [Green Version]
  18. Rezvani, M.; Vallier, L.; Guillot, A. Modeling Nonalcoholic Fatty Liver Disease in the Dish Using Human-Specific Platforms: Strategies and Limitations. Cell. Mol. Gastroenterol. Hepatol. 2023, 15, 1135–1145. [Google Scholar] [CrossRef] [PubMed]
  19. Schaefer, B.; Mandorfer, M.; Viveiros, A.; Finkenstedt, A.; Ferenci, P.; Schneeberger, S.; Tilg, H.; Zoller, H. Heterozygosity for the Alpha-1-Antitrypsin Z Allele in Cirrhosis Is Associated with More Advanced Disease. Liver Transpl. 2018, 24, 744–751. [Google Scholar] [CrossRef] [Green Version]
  20. Prior, N.; Inacio, P.; Huch, M. Liver Organoids: From Basic Research to Therapeutic Applications. Gut 2019, 68, 2228–2237. [Google Scholar] [CrossRef] [Green Version]
  21. Shi, S.; Verstegen, M.M.A.; Roest, H.P.; Ardisasmita, A.I.; Cao, W.; Roos, F.J.M.; de Ruiter, P.E.; Niemeijer, M.; Pan, Q.; IJzermans, J.N.M.; et al. Recapitulating Cholangiopathy-Associated Necroptotic Cell Death In Vitro Using Human Cholangiocyte Organoids. Cell Mol. Gastroenterol. Hepatol. 2021, 13, 541–564. [Google Scholar] [CrossRef]
  22. Schneider, C.V.; Hamesch, K.; Gross, A.; Mandorfer, M.; Moeller, L.S.; Pereira, V.; Pons, M.; Kuca, P.; Reichert, M.C.; Benini, F.; et al. Liver Phenotypes of European Adults Heterozygous or Homozygous for Pi∗Z Variant of AAT (Pi∗MZ vs Pi∗ZZ Genotype) and Noncarriers. Gastroenterology 2020, 159, 534–548.e11. [Google Scholar] [CrossRef] [PubMed]
  23. Leroux, A.; Ferrere, G.; Godie, V.; Cailleux, F.; Renoud, M.-L.; Gaudin, F.; Naveau, S.; Prévot, S.; Makhzami, S.; Perlemuter, G.; et al. Toxic Lipids Stored by Kupffer Cells Correlates with Their Pro-Inflammatory Phenotype at an Early Stage of Steatohepatitis. J. Hepatol. 2012, 57, 141–149. [Google Scholar] [CrossRef] [PubMed]
  24. Mundi, M.S.; Velapati, S.; Patel, J.; Kellogg, T.A.; Abu Dayyeh, B.K.; Hurt, R.T. Evolution of NAFLD and Its Management. Nutr. Clin. Pract. 2020, 35, 72–84. [Google Scholar] [CrossRef] [PubMed]
  25. Olzmann, J.A.; Carvalho, P. Dynamics and Functions of Lipid Droplets. Nat. Rev. Mol. Cell Biol. 2019, 20, 137–155. [Google Scholar] [CrossRef] [PubMed]
  26. Hoofnagle, A.N.; Heinecke, J.W. Lipoproteomics: Using Mass Spectrometry-Based Proteomics to Explore the Assembly, Structure, and Function of Lipoproteins. J. Lipid Res. 2009, 50, 1967–1975. [Google Scholar] [CrossRef] [PubMed] [Green Version]
  27. Krahmer, N.; Guo, Y.; Wilfling, F.; Hilger, M.; Lingrell, S.; Heger, K.; Newman, H.W.; Schmidt-Supprian, M.; Vance, D.E.; Mann, M.; et al. Phosphatidylcholine Synthesis for Lipid Droplet Expansion Is Mediated by Localized Activation of CTP:Phosphocholine Cytidylyltransferase. Cell Metab. 2011, 14, 504–515. [Google Scholar] [CrossRef] [Green Version]
  28. Pouget, J.-P.; Georgakilas, A.; Ravanat, J.-L. Targeted and Off-Target (Bystander and Abscopal) Effects of Radiation Therapy: Redox Mechanisms and Risk/Benefit Analysis. Antioxid. Redox Signal. 2018, 29, 1447–1487. [Google Scholar] [CrossRef] [Green Version]
  29. Kinoshita, M.; Matsumori, N. Inimitable Impacts of Ceramides on Lipid Rafts Formed in Artificial and Natural Cell Membranes. Membranes 2022, 12, 727. [Google Scholar] [CrossRef]
  30. Idowu, J.Y.; Hagenbuch, B. Free Cholesterol Affects the Function and Localization of Human Na+/Taurocholate Cotransporting Polypeptide (NTCP) and Organic Cation Transporter 1 (OCT1). Int. J. Mol. Sci. 2022, 23, 8457. [Google Scholar] [CrossRef] [PubMed]
  31. Jiang, Z.; Shen, T.; Huynh, H.; Fang, X.; Han, Z.; Ouyang, K. Cardiolipin Regulates Mitochondrial Ultrastructure and Function in Mammalian Cells. Genes 2022, 13, 1889. [Google Scholar] [CrossRef]
  32. Prola, A.; Pilot-Storck, F. Cardiolipin Alterations during Obesity: Exploring Therapeutic Opportunities. Biology 2022, 11, 1638. [Google Scholar] [CrossRef]
  33. Wilson, C.G.; Tran, J.L.; Erion, D.M.; Vera, N.B.; Febbraio, M.; Weiss, E.J. Hepatocyte-Specific Disruption of CD36 Attenuates Fatty Liver and Improves Insulin Sensitivity in HFD-Fed Mice. Endocrinology 2016, 157, 570–585. [Google Scholar] [CrossRef] [PubMed] [Green Version]
  34. Wang, G.; Bonkovsky, H.L.; de Lemos, A.; Burczynski, F.J. Recent Insights into the Biological Functions of Liver Fatty Acid Binding Protein 1. J. Lipid Res. 2015, 56, 2238–2247. [Google Scholar] [CrossRef] [Green Version]
  35. Smathers, R.L.; Galligan, J.J.; Shearn, C.T.; Fritz, K.S.; Mercer, K.; Ronis, M.; Orlicky, D.J.; Davidson, N.O.; Petersen, D.R. Susceptibility of L-FABP-/- Mice to Oxidative Stress in Early-Stage Alcoholic Liver. J. Lipid Res. 2013, 54, 1335–1345. [Google Scholar] [CrossRef] [PubMed] [Green Version]
  36. Petrescu, A.D.; Huang, H.; Martin, G.G.; McIntosh, A.L.; Storey, S.M.; Landrock, D.; Kier, A.B.; Schroeder, F. Impact of L-FABP and Glucose on Polyunsaturated Fatty Acid Induction of PPARα-Regulated β-Oxidative Enzymes. Am. J. Physiol. Gastrointest. Liver Physiol. 2013, 304, G241–G256. [Google Scholar] [CrossRef] [Green Version]
  37. Diraison, F.; Moulin, P.; Beylot, M. Contribution of Hepatic de Novo Lipogenesis and Reesterification of Plasma Non Esterified Fatty Acids to Plasma Triglyceride Synthesis during Non-Alcoholic Fatty Liver Disease. Diabetes Metab. 2003, 29, 478–485. [Google Scholar] [CrossRef]
  38. Adiels, M.; Olofsson, S.-O.; Taskinen, M.-R.; Borén, J. Overproduction of Very Low-Density Lipoproteins Is the Hallmark of the Dyslipidemia in the Metabolic Syndrome. Arterioscler. Thromb. Vasc. Biol. 2008, 28, 1225–1236. [Google Scholar] [CrossRef]
  39. Aggarwal, D.J.; Kathariya, M.G.; Verma, D.P.K. LDL-C, NON-HDL-C and APO-B for Cardiovascular Risk Assessment: Looking for the Ideal Marker. Indian. Heart J. 2021, 73, 544–548. [Google Scholar] [CrossRef] [PubMed]
  40. Ota, T.; Gayet, C.; Ginsberg, H.N. Inhibition of Apolipoprotein B100 Secretion by Lipid-Induced Hepatic Endoplasmic Reticulum Stress in Rodents. J. Clin. Investig. 2008, 118, 316–332. [Google Scholar] [CrossRef] [Green Version]
  41. Chen, C.; Li, H.; Song, J.; Zhang, C.; Li, M.; Mao, Y.; Liu, A.; Du, J. Role of Apolipoprotein A1 in PPAR Signaling Pathway for Nonalcoholic Fatty Liver Disease. PPAR Res. 2022, 2022, 4709300. [Google Scholar] [CrossRef] [PubMed]
  42. Deprince, A.; Hennuyer, N.; Kooijman, S.; Pronk, A.C.M.; Baugé, E.; Lienard, V.; Verrijken, A.; Dirinck, E.; Vonghia, L.; Woitrain, E.; et al. Apolipoprotein F Is Reduced in Humans with Steatosis and Controls Plasma Triglyceride-Rich Lipoprotein Metabolism. Hepatology 2023, 77, 1278–1302. [Google Scholar] [CrossRef] [PubMed]
  43. Hara, S.; Yoda, E.; Sasaki, Y.; Nakatani, Y.; Kuwata, H. Calcium-Independent Phospholipase A2γ (IPLA2γ) and Its Roles in Cellular Functions and Diseases. Biochim. Biophys. Acta Mol. Cell Biol. Lipids 2019, 1864, 861–868. [Google Scholar] [CrossRef]
  44. Teckman, J.H.; An, J.-K.; Blomenkamp, K.; Schmidt, B.; Perlmutter, D. Mitochondrial Autophagy and Injury in the Liver in Alpha 1-Antitrypsin Deficiency. Am. J. Physiol. Gastrointest. Liver Physiol. 2004, 286, G851–G862. [Google Scholar] [CrossRef]
  45. Papp, E.; Száraz, P.; Korcsmáros, T.; Csermely, P. Changes of Endoplasmic Reticulum Chaperone Complexes, Redox State, and Impaired Protein Disulfide Reductase Activity in Misfolding Alpha1-Antitrypsin Transgenic Mice. FASEB J. 2006, 20, 1018–1020. [Google Scholar] [CrossRef] [Green Version]
  46. Kaserman, J.E.; Werder, R.B.; Wang, F.; Matte, T.; Higgins, M.I.; Dodge, M.; Lindstrom-Vautrin, J.; Bawa, P.; Hinds, A.; Bullitt, E.; et al. Human IPSC-Hepatocyte Modeling of Alpha-1 Antitrypsin Heterozygosity Reveals Metabolic Dysregulation and Cellular Heterogeneity. Cell Rep. 2022, 41, 111775. [Google Scholar] [CrossRef] [PubMed]
  47. Heier, C.; Haemmerle, G. Fat in the Heart: The Enzymatic Machinery Regulating Cardiac Triacylglycerol Metabolism. Biochim. Biophys. Acta (BBA) Mol. Cell Biol. Lipids 2016, 1861, 1500–1512. [Google Scholar] [CrossRef]
  48. Ferdinandusse, S.; Denis, S.; Faust, P.L.; Wanders, R.J.A. Bile Acids: The Role of Peroxisomes. J. Lipid Res. 2009, 50, 2139–2147. [Google Scholar] [CrossRef] [Green Version]
  49. Kleiboeker, B.; Lodhi, I.J. Peroxisomal Regulation of Energy Homeostasis: Effect on Obesity and Related Metabolic Disorders. Mol. Metab. 2022, 65, 101577. [Google Scholar] [CrossRef]
  50. Hultcrantz, R.; Mengarelli, S. Ultrastructural Liver Pathology in Patients with Minimal Liver Disease and Alpha 1-Antitrypsin Deficiency: A Comparison between Heterozygous and Homozygous Patients. Hepatology 1984, 4, 937–945. [Google Scholar] [CrossRef]
  51. Broutier, L.; Andersson-Rolf, A.; Hindley, C.J.; Boj, S.F.; Clevers, H.; Koo, B.-K.; Huch, M. Culture and Establishment of Self-Renewing Human and Mouse Adult Liver and Pancreas 3D Organoids and Their Genetic Manipulation. Nat. Protoc. 2016, 11, 1724–1743. [Google Scholar] [CrossRef] [Green Version]
  52. Matamala, N.; Lara, B.; Gomez-Mariano, G.; Martínez, S.; Retana, D.; Fernandez, T.; Silvestre, R.A.; Belmonte, I.; Rodriguez-Frias, F.; Vilar, M.; et al. Characterization of Novel Missense Variants of SERPINA1 Gene Causing Alpha-1 Antitrypsin Deficiency. Am. J. Respir. Cell Mol. Biol. 2018, 58, 706–716. [Google Scholar] [CrossRef] [PubMed]
  53. Ejsing, C.S.; Sampaio, J.L.; Surendranath, V.; Duchoslav, E.; Ekroos, K.; Klemm, R.W.; Simons, K.; Shevchenko, A. Global Analysis of the Yeast Lipidome by Quantitative Shotgun Mass Spectrometry. Proc. Natl. Acad. Sci. USA 2009, 106, 2136–2141. [Google Scholar] [CrossRef] [PubMed]
  54. Janciauskiene, S.; Dominaitiene, R.; Sternby, N.H.; Piitulainen, E.; Eriksson, S. Detection of Circulating and Endothelial Cell Polymers of Z and Wild Type Alpha 1-Antitrypsin by a Monoclonal Antibody. J. Biol. Chem. 2002, 277, 26540–26546. [Google Scholar] [CrossRef] [PubMed] [Green Version]
  55. Szklarczyk, D.; Gable, A.L.; Nastou, K.C.; Lyon, D.; Kirsch, R.; Pyysalo, S.; Doncheva, N.T.; Legeay, M.; Fang, T.; Bork, P.; et al. The STRING Database in 2021: Customizable Protein-Protein Networks, and Functional Characterization of User-Uploaded Gene/Measurement Sets. Nucleic Acids Res 2021, 49, D605–D612. [Google Scholar] [CrossRef] [PubMed]
Figure 1. Z-AAT protein expression in HepG2 cells and lipid accumulation in hepatocytes. (A) Representative immunofluorescence photomicrographs of HepG2 cell lines (not transfected and expressing M or Z alleles) labelled in green with AAT and in DAPI (blue) for nuclei; scale bar represents 25 µm. (B) Representative Western blotting showing AAT protein levels after transfection of HepG2 cells. (C,D) Oil-Red-O staining and quantification of lipids in transfected cells compared to control cells; images were taken with a 20× magnification. The values are expressed as mean ± SEM in relative percentage of the control (* p ≤ 0.05).
Ijms 24 12472 g001
Figure 2. Oil-Red-O staining in MM, MZ, and ZZ organoids. (A) Representative images of ORO staining in organoids derived from different AAT genotypes. Arrowheads point to cells showing positive lipid staining. (B) Number of positive cells for ORO staining. At least 10 fields of three different cytospin preparations were used for quantification; scale bar represents 100 µm (** p ≤ 0.01, *** p ≤ 0.005).
Ijms 24 12472 g002
Figure 3. Lipid content in AATD-derived organoids. (A) Total amount of lipids (pmol) in MZ and ZZ organoids compared to MM ones; data represent the mean of three different replicates analyzed (*** p ≤ 0.005). (B) Heat-map showing the mean amount of each lipid in the MM, MZ, and ZZ organoids. Lipid species are ordered from the most abundant in MM organoids at the top to the lowest at the bottom. Groups separating the most highly abundant lipids (>1000 pmol), intermediate level (10–1000 pmol), and low abundant (>10 pmol) are represented. (C) Diagrams showing the percentages, relative to the total amount, of each lipidic species in the MM-, MZ-, and ZZ-ORG. The lipid distribution in MZ- and ZZ-ORG show more similar profiles compared to MM-ORG.
Ijms 24 12472 g003
Figure 4. GSEA analysis of ZZ-ORG vs. MM-ORG differential gene expression. (A) Clusters of GO gene sets differentially enriched in ZZ-ORG vs. MM-ORG at p-value < 0.01 according to preranked GSEA analysis. Node size is proportional to the number of genes identified in each gene set. The light blue edges indicate gene overlap between gene sets. (B) Graphs of positive enrichment scores (ESs) found in preranked GSEA analysis in ZZ-ORG compared to MM-ORG. (C) Unsupervised hierarchical cluster heatmap of mRNA levels of genes belonging to the leading edge of pathways depicted in B. Lower expression of genes is represented in blue and higher expression in red. Genes belonging to the pathways of oxidative phosphorylation (OP) are in orange, peroxisomal lipid metabolism (PLM) in green, cholesterol biosynthesis (CB) in yellow, mitochondrial complex IV assembly (MCA) in grey, and peroxisome (P) in pink are indicated.
Ijms 24 12472 g004
Figure 5. Relative expression of deregulated genes in the RNASeq analysis. The main differentially expressed genes implicated in lipid homeostasis are represented, grouped according to those involved in lipid transport (APOB, CD36, FABP1 and MAN1A1); or different processes of lipid metabolism (ACOT1, ACOT2, ASS1, CROT, PLCB1, PNPLA3, PNPLA8, PRAP1, ABGC5, UGT1A4, UGT1A5, UGT2B10, UGT2B28). Data represent the mean ± SEM from three different replicates. * p < 0.05; *** p < 0.001.
Ijms 24 12472 g005
Table 1. Total lipid amount measured in organoids with the different genotypes.
Class 1MMMZZZ
Media (pmol)SD *Media (pmol)SDFC **p-Value
***
Media (pmol)SDFCp-Value
***
CholesterolChol5070.61488.565776.7357.551.140.03525793.16678.171.140.1075
PhosphatidylcholinePC3814.2391.594848.09426.641.270.07464116.96398.061.080.3082
PhosphatidylethanolaminePE2116.96207.092001.29144.140.950.33662257.92284.741.070.3556
PhosphatidylserinePS1076.2145.321025.3595.450.950.39331071.83101.3610.4908
TriacylglycerolTAG1065.2860.733325.34312.733.120.00793112.48399.462.920.0168
PhosphatidylinositolPI525.2526.77775.5241.671.480.0054601.5853.741.150.1475
Phosphatidylethanolamine (-ether)PE-O460.3343.84641.1449.711.390.0267868.37108.361.890.0243
DiacylglycerolDAG376.6125.09417.0439.621.110.2227466.1865.621.240.1527
SphingomyelinSM290.8931.92350.4722.771.20.1053367.7343.071.260.1154
CeramideCer231.3218.2363.7218.651.570.0035434.4657.111.880.0297
HexosylceramideHexCer87.76941.951.720.480.016365.466.450.750.0608
PhosphatidatePA69.815.1276.215.811.090.227983.7910.231.20.1552
PhosphatidylglycerolPG47.584.8960.244.361.270.063181.5210.361.710.0317
lyso-PhasphatidylethanolamineLPE25.942.4616.820.570.650.029544.625.141.720.0247
CardiolipinsCL25.061.6542.692.150.00147.677.271.90.0417
Phosphatidylcholine (-ether)PC-O24.712.3450.624.232.050.005859.88.122.420.0204
lyso-PhasphatidylcholineLPC22.382.1717.962.680.80.135949.034.962.190.0099
Cholesterol estersCE13.470.59120.217.928.920.0026173.2524.0212.860.0109
lyso-PhasphatidateLPA4.610.240000.00147.481.041.620.0519
lyso-PhosphatidylserineLPS3.120.530.710.710.230.02874.280.491.370.092
lyso-PhosphatidylinositolLPI2.70.411.511.510.560.25832.540.320.940.3845
lyso-Phosphatidylethanolamine (-ether)LPE-O2.340.220000.00436.60.722.810.01
lyso-PhosphatidylglycerolLPG1.590.10000.00193.660.52.310.0246
lyso-Phosphatidylcholine (-ether)LPC-O0.860.180000.02093.040.283.530.0025
1 Lipid species are ordered from most abundant to less abundant in MM-ORG, divided in the three groups of High abundant (>1000 pmol), Intermediate abundant (10 to 1000 pmol), and Low abundant (<10 pmol). * SD: Standard deviation; ** FC: Fold change; *** p-value is referred to in comparison with MM-ORG.
Table 2. Percentage of the lipid species representing the relative abundance within each genotype (molar fraction).
ClassMMMZZZ
Media (%)SD *Media (%)SD *p-Value MMMedia (%)SD *p-Value MMp-Value MZ
CholesterolChol330.080128.990.55540.01729.350.08656.87 × 10-60.5837
PhosphatidylcholinePC24.80.419724.240.47110.421520.950.410.00280.0066
PhosphatidylethanolaminePE13.780.134510.030.15670.000111.420.16630.00050.0005
Triacylglycerol TAG6.980.267816.610.37370.000115.740.31713.70 × 10-50.1512
Phosphatidylserine PS6.960.26445.140.2880.00985.460.20010.01260.4155
Phosphatidylinositol PI3.450.14243.90.0870.06633.070.07920.09910.0022
Phosphatidylethanolamine (-ether) PE-O30.0423.210.02870.01794.390.04823.01 × 10-50.0001
DiacylglycerolDAG2.470.09442.080.04720.0372.350.0740.38650.0479
Sphingomyelin SM1.890.06951.760.01710.19051.870.05070.78520.1581
CeramideCer1.510.03161.830.06680.02542.190.08760.00930.0328
HexosylceramideHexCer0.570.03430.210.00710.0070.330.00620.01740.0002
PhasphatidatePA0.460.01080.380.00720.0070.420.00370.08430.0135
Phosphatidylglycerol PG0.310.00440.30.00730.43990.410.00570.00020.0004
lyso-PhosphatidylethanolamineLPE0.170.0080.080.00350.00350.230.00480.00680
CardiolipinsCL0.160.00520.270.00790.00070.240.01170.01210.0946
Phosphatidylcholine (-ether) PC-O0.160.00310.260.02640.06750.30.00980.00250.2206
lyso-PhosphatidylcholineLPC0.150.00220.090.00680.00910.250.00334.18 × 10-50.0003
Cholesterol estersCE0.090.01030.60.01033.88 × 10-60.870.0220.00010.002
lyso-PhosphatidateLPA0.030.0032000.01060.040.00280.16180.0055
lyso-PhosphatidylserineLPS0.020.003900.0040.04250.020.00020.78660.0483
lyso-PhosphatidylinositolLPI0.020.0010.010.00670.24570.010.00110.04090.4465
lyso-Phosphatidylethanolamine (-ether)LPE-O0.020.0011000.00520.030.00040.00140.0014
lyso-Phosphatidylglycerol LPG0.010.0005000.00230.020.00070.00090.0013
lyso-Phosphatidylcholine (-ether)LPC-O0.010.0007000.0170.020.00150.010.0091
* SD: Standard deviation.
Table 3. Functional annotations of differentially expressed genes in ZZ-ORG versus MM-ORG.
ClusterTerm IDTerm DescriptionObserved Gene CountBackground Gene CountStrengthFDR *
(1)GO:0003779Actin binding154380.938.25 × 10−7
Actin CytoskeletonGO:0007010Cytoskeleton organization1811260.60.0017
GO:0031982Vesicle2938790.270.0393
(2)GO:0019222Regulation of metabolic process6269480.321.45 × 10−9
Regulation of
metabolic processes
GO:0060255Regulation of macromolecule metabolic process6064070.341.45 × 10−9
GO:0010468Regulation of gene expression5148130.43.64 × 10−9
GO:0006950Response to stress3734850.44.68 × 10−6
GO:0030162Regulation of proteolysis157470.688.76 × 10−5
GO:0001817Regulation of cytokine production167420.711.82 × 10−5
GO:0042981Regulation of apoptotic process2115500.50.00019
GO:0006954Inflammatory response115150.70.0011
GO:0006955Immune response1815880.430.0061
(3)GO:0032787Monocarboxylic acid metabolic process135150.730.0119
Fatty acid metabolic processesGO:0019752Carboxylic acid metabolic process168530.610.0138
GO:0006631Fatty acid metabolic process93110.790.0448
KEGG-hsa00982Drug metabolism - cytochrome P4507641.374.22 × 10−6
KEGG-hsa00140Steroid hormone biosynthesis5591.260.00056
KEGG-hsa04976Bile secretion5891.080.0025
(4)GO:0030054Cell junction2820750.430.0011
Plasma membraneGO:0031226Intrinsic component of plasma membrane2217030.420.0229
(5)GO:0031090Organelle membrane2735480.390.002
Endomembrane systemGO:0005794Golgi apparatus1715840.540.0027
GO:0034703Cation channel complex72141.020.0027
GO:0012505Endomembrane system3045420.330.003
GO:0098797Plasma membrane protein complex95470.720.0079
GO:0008194UDP-glycosyltransferase activity61431.130.0092
* FDR: False Discovery Rate.
Table 4. Clinical features of patients included in deriving hepatic organoid lines.
OrganoidsSexAgeReason of SurgerySerum AATGPTGOTGGTPlateletsGlucoseAlbuminBilirubin
Genotype(Years)(g/L)(U/L)(U/L)(U/L)(×1000/uL)(mg/dL)(g/dL)(mg/dL)
(5–45) *(5–33) *(8–61) *(140–450) *(70–110) *(3.5–5) *(0.2–1) *
MMF78Hepatocellular carcinomaND3131492461134.50.3
MZM82CholecystectomyND6436331261103.90.3
ZZM1Hepatic failure. Liver transplant0.41199360551927133.67
* Range of normal values.; ND: non-determined.
Disclaimer/Publisher’s Note: The statements, opinions and data contained in all publications are solely those of the individual author(s) and contributor(s) and not of MDPI and/or the editor(s). MDPI and/or the editor(s) disclaim responsibility for any injury to people or property resulting from any ideas, methods, instructions or products referred to in the content.

