Abstract
Commercially available lactones, as well as those synthesized by us, turned out to be good substrates for the synthesis of sugar hydrazides. The exception was L-ascorbic acid, whose hydrazinolysis led to the formation of a hydrazinium salt, not the hydrazide as expected. The structure of all compounds was confirmed by NMR and X-ray analyses. The lower durability of hydrazinium L-ascorbate was additionally confirmed by thermogravimetric tests. All products were tested for biological activity against Gram-negative bacteria strains Escherichia coli ATCC 25922 and Pseudomonas aeruginosa ATCC 27853 and against Gram-positive Staphylococcus aureus ATCC 25923 and Staphylococcus aureus ATCC 29213. Their antifungal activity against Candida albicans SC5314, Candida glabrata DSM 11226 SM 11226, Candida krusei DSM 6128, and Candida parapsilosis DSM 5784 was also tested. The most interesting results of microbiological activity were obtained for D-gluconic acid hydrazide and hydrazinium L-ascorbate. The results of the latter encourage more extensive testing.
1. Introduction
Hydrazides, according to the definition recommended by IUPAC, are compounds derived from oxoacids RkE(=O)l(OH)m (l ≠ 0) by replacing –OH by –NRNR2 (R groups are commonly H), as in carbohydrazides, RC(=O)NHNH2, sulfonohydrazides, RS(=O)2NHNH2, and phosphonic dihydrazides, RP(=O)(NHNH2)2 [1]. Many examples of reactions leading to obtaining the corresponding hydrazide derivatives are described in the literature: from alcohols [2,3,4], from aryl tosylates [5], from arenes [6], from styrenes [7], from aryl halides [8,9,10,11], by alkylation of hydrazine [12,13], and from heteroarylboronic acids [14]. However, still the most commonly used methods of hydrazide synthesis use esters and carbonyl compounds [15,16,17,18].
There are many interesting examples of the use of hydrazides in the literature. One of the first effective antibiotics used in the treatment of Mycobacterium tuberculosis was isonidazid (pyridine-4-carboxylic acid hydrazide). It was first synthesized in 1912, but its effectiveness as a drug against tuberculosis was discovered only in the 1950s [19,20]. Some hydrazide derivatives have antiretroviral properties, including HIV-1 [21,22,23]. In addition, the derivatives of isonidazid (N′-isopropyl and the N′-benzyl) show activity against monoamine oxidase, responsible for the deamination of serotonin and norepinephrine [24].
An interesting example of a hydrazide with biological activity is carbidopa hydrazine acid. It affects the rate of dopamine release, prolonging the effect of the drug in the treatment of Parkinson’s disease [25].
Hydrazides are also important substrates for obtaining an extremely interesting group of compounds, which are hydrazide–hydrazones. This is a group of compounds in which alkyl or aryl groups are connected by a bridge -C(=O)-NH-N=CH-. There are many examples of their biological activity [26].
Carbohydrate hydrazides, despite their high potential, are still a little-studied group of compounds. They are obtained mainly from free sugars by the reaction of the carbonyl group of aldoses with hydrazine [27,28,29,30], as derivatives of uronic acids [31], or from D-ribono-1,4-lactone [32].
In this paper, we present the synthesis, structure, and biological activity studies of a selected group of compounds that are products of the reaction of sugar lactones with hydrazine.
2. Results and Discussion
The lactones used for the reaction with hydrazine were commercially available (D-gluconolactone and L-ascorbic acid) or were obtained from commercially available sugars (D-ribose, 2-deoxy-D-ribose, and D- and L-fucose). For their synthesis, the bromine oxidation method in the presence of potassium carbonate developed for D-ribono-1,4-lactone was used [33]. The indisputable advantage of this method is its simplicity, the possibility of conducting it on a large scale, as well as the high yields and high purity of the obtained products. In the case of synthesized lactones, the size of the ring (γ- or δ-lactones) was not important because after their isolation, they underwent further reaction without the need for purification, and the hydrazides formed were not affected by the size of the lactone ring, as shown in Figure 1 below.
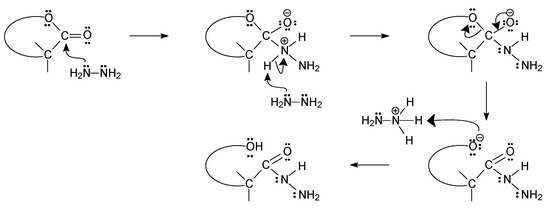
Figure 1.
Proposed mechanism for the reaction of sugar lactones with hydrazine.
The choice of the configuration of the synthesized hydrazides resulted from the desire to study the wide range of structural systems occurring in natural sugars; therefore, we used three hexoses, two pentoses, and ascorbic acid for the synthesis. Among the hexoses, we used the most common D-glucose and two enantiomers of fucose (6-deoxy galactose). The use of D- and L-fucose allowed us to test the possible impact of the lack of a hydroxyl group at the terminal carbon atom C6 and to compare the activity of the two enantiomers. The studies of D-ribose and 2-deoxy-D-ribose were able to determine the effect of the length of the carbon chain (compared with hexoses) and the lack of a hydroxyl group in the α position to the hydrazide moiety on the structure and biological activity. The choice of ascorbic acid resulted from its known biological activity and the fact that a C=C double bond would be present in the obtained hydrazide.
In all cases of the synthesis, after some time, we observed the precipitation of a white precipitate from the methanolic lactone and hydrazine solution, which was then recrystallized from a mixture of methyl alcohol and water. The obtained crystal deposits showed high purity, which was confirmed by the results of elemental analysis, and the crystals were of such good quality that it was possible to determine the crystal structure for all of them. First, we confirmed the structure of all the products by performing NMR spectroscopic analyses. Full characterization of all compounds is presented in Table S4 (Supplementary Materials). Although the synthesis of D-gluconic and D-ribonic acid hydrazides has been previously described in the literature [34], we decided to include it in this article since we were unable to find their full characteristics in the literature. The structures of all obtained compounds are shown in Figure 2.

Figure 2.
The structures of the obtained products.
Looking at the chemical shift values of the C1 carbon atom in compounds 1–5, it can be seen that they range between 172.51 and 173.91 ppm (full NMR spectra are shown in Figures S1–S24 in Supplementary Materials). Such a value of these shifts, if based on the literature data [35], may indicate that the E-isomer predominates in the aqueous solution. As shown by the authors’ studies using modern NMR techniques of the Z/E isomerism of hydrazides, the chemical shift of the carbonyl carbon atom in the Z-isomer was below or approx. 170 ppm, while in the E-isomer it was approx. 175 ppm (Figure 3).
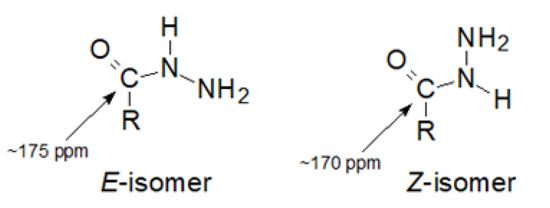
Figure 3.
The Z/E isomerism of the hydrazide moiety.
In the case of compound 6, the value of the carbon C1 chemical shift reached an even higher value of 177.51 ppm. More surprising, however, was the value of the chemical shift in this compound of the C3 carbon atom, which was 175.59 ppm. Such values indicated that it was not ascorbic acid hydrazide. Such a high value also did not correspond to the chemical shift of the C3 carbon atom in the substrate, which was 155.22 ppm [36]. Studies of the literature data have shown that such high values of chemical shifts of carbon atoms C1 and C3 are close to the value of shifts of these carbon atoms in sodium ascorbate [37]. The results obtained in further studies explained such a high value of the chemical shift of the C3 carbon atom. It was the result of the transfer of a proton from the C3-OH group to the hydrazine molecule and the formation of an appropriate anion. L-Ascorbic acid turned out to be such a strong acid that instead of the assumed nucleophilic attack of the hydrazine nitrogen atom on the carbonyl carbon atom, the hydrazine molecule was protonated as a result of proton transfer from the enol group at the carbon atom C3, resulting in the formation of a hydrazinium salt (Figure 4).
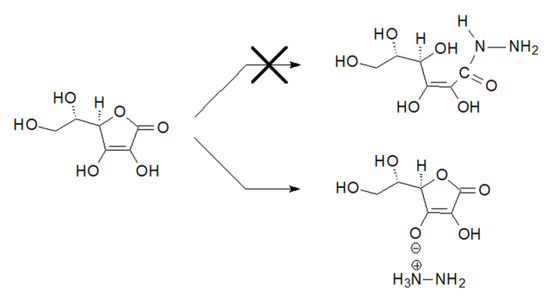
Figure 4.
Reaction of L-ascorbic acid with hydrazine.
In addition, the lower stability of compound 6 in comparison with derivatives 1–5 could indicate its structure as being other than hydrazide. The positive mode ESI MS spectrum showed only the m/z 174.7 ion, while the negative mode ESI MS contained the two main ions m/z 176.9 and 209.0 (see Figures S25–S27 in Supplementary Materials for more details). Such a spectrum is often characteristic of ionic compounds, and while the m/z 209.0 ion was not a surprise [M + 1], the ions 174.7 and 176.9 closely resembled the ions characteristic of ascorbic acid [M 176.1]. In addition, an analysis of the positive MS-MS spectrum showed that the fragmentation of the m/z 176.9 ion was very similar to that of ascorbic acid [38]. There were fragmentation ions m/z 158.9 [176.9–1H2O] and 141.0 [176.9–2H2O]. All these results showed that compound 6 was not likely to be a hydrazide, and its behavior was more indicative of some derivative of ascorbic acid. Its low stability (24 h in an aqueous solution and approx. 30 days in a crystalline form at −20 °C) prompted us to perform a thermogravimetric analysis for it (Figure S28 Supplementary Materials). Up to a temperature of approx. 140 °C, compound 6 showed high thermal stability and did not melt. It began to decompose at approx. 146 °C, unlike L-ascorbic acid, which begins to decompose at approx. 191 °C (Merck Index, 14th ed.). During the thermal decomposition of the analyzed compound, a mixture of gases was observed, including H2O, CO2, CO, and ammonia. It was a multi-stage process, but due to the speed of the processes, it was not possible to determine the individual stages of the sample’s decomposition or to determine the exact mass losses. Above the temperature of 152 °C, a significant increase in the quantity of gaseous products was observed, and their structure was determined by the recorded IR spectra. At the wavenumber values of 932.72 cm−1 and 961.83 cm−1, absorbance signals characteristic of ammonia or its derivatives (N-H) appeared, which confirmed that this compound was formed as a result of the reaction of hydrazine and ascorbic acid. In addition, at wavenumbers 2155, 2121.8 cm−1, and approx. 2350 cm−1, signals corresponding to νC=O vibrations appeared, indicating the formation of CO and CO2 (Figure S29A, see Supplementary Materials). With an increase in the temperature of approx. 7.5 °C, there was an increase in the release of water vapor (H2O). This confirmed the presence of signals on the IR spectrum at the wavenumber values of 3400–4000 cm−1 and 1500–1600 cm−1, corresponding to νO-H vibrations. In contrast to the TG analysis curve for pure L-ascorbic acid, it was difficult to confirm the formation of HCOOH in the released gases due to the possibility of their being masked by the presence of a significant amount of H2O as a result of dehydration. At a temperature of approx. 272 °C, there was a significant decrease in H2O and NH3 emissions (Figure S29B, see Supplementary Materials). In the final stage of decomposition, CO2 was released in the largest quantity, which is confirmed by the IR spectra.
2.1. Crystal Structure and Analysis of Intermolecular Interactions
The crystallographic structures of compounds 1–6 with the numbering of atoms are shown in Figure 5. Full crystal data and structure refinement for compounds 1–6 are included in Table 1. All obtained hydrazides in the crystal lattice existed as Z isomers. Hydrazides 2–5 with a chain structure adopted a similar zigzag conformation in the crystal lattice. The situation was different in the case of D-ribonic acid hydrazide (1), in which the molecule was rotated around the C2-C3 bond. This may have been due to the difference in the arrangement of the hydroxyl groups at the C2 and C3 atoms in the hydrazide with the D-ribo, D-gluco, and D- or L-fuco configurations. Due to the lack of a hydroxyl group at the C2 carbon atom, this was not observed in the case of 2-deoxy-D-ribonic acid hydrazide. Such rotation enabled the formation of an intramolecular hydrogen bond between the hydrogen atom of the hydroxyl group on the C2 carbon atom and the oxygen atom of the hydroxyl group on the C4 carbon atom (C4-O-H···O4). This bond is shown in Figure 6, and its data are included in Table S2 (Supplementary Materials). All compounds formed a large number of hydrogen bonds in the crystal lattice, shown in Figure 6, Figure 7, Figure 8, Figure 9, Figure 10 and Figure 11, and the full geometry of these bonds is included in Tables S2 and S3 (Supplementary Materials). Compound 6 contained a nearly planar five-membered ring in which the torsion angle C1-C2-C3-C4 was 1.2(4) degrees.
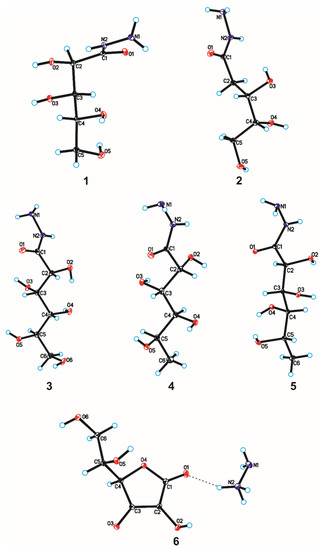
Figure 5.
Molecular structures of compounds 1–6 with the atom-labelling scheme. Displacement ellipsoids are drawn at the 15% probability level, and H atoms are shown as small spheres of arbitrary radius (hydrogen bonds are represented by dashed line).

Table 1.
Crystal data and structure refinement for compounds 1–6.
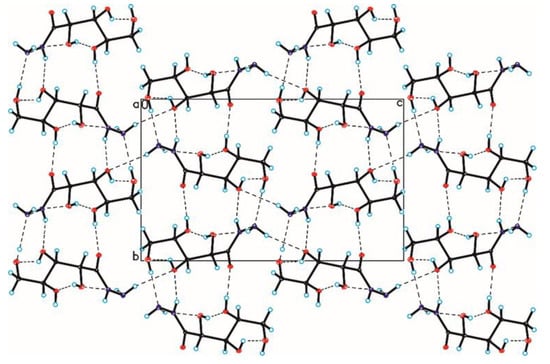
Figure 6.
Crystal packing of compound 1 viewed along the a-axis (hydrogen bonds are represented by dashed lines).
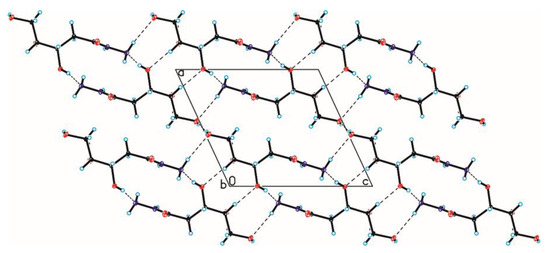
Figure 7.
Crystal packing of compound 2 viewed along the b-axis (hydrogen bonds are represented by dashed lines).
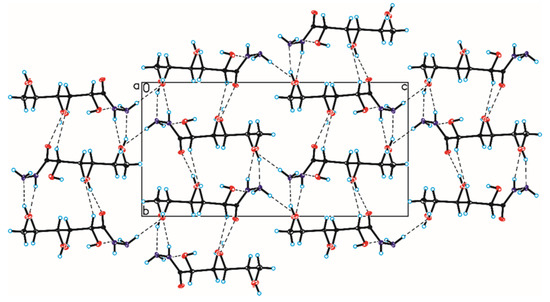
Figure 8.
Crystal packing of compound 3 viewed along the a-axis (hydrogen bonds are represented by dashed lines).
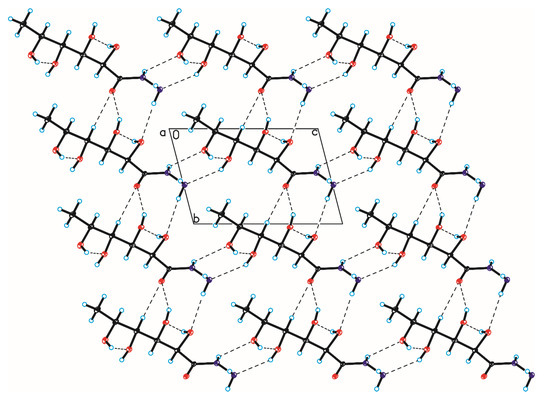
Figure 9.
Crystal packing of compound 4 viewed along the a-axis (hydrogen bonds are represented by dashed lines).
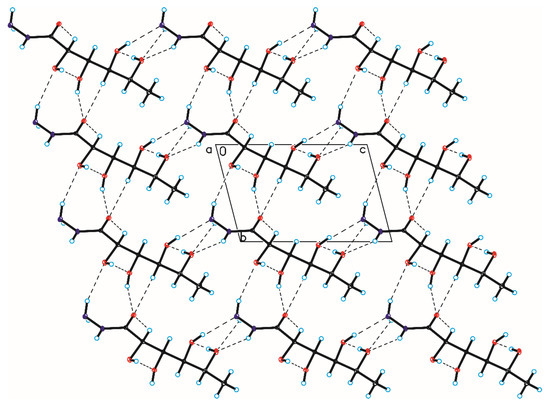
Figure 10.
Crystal packing of compound 5 viewed along the a-axis (hydrogen bonds are represented by dashed lines).

Figure 11.
Crystal packing of compound 6 viewed along the b-axis (hydrogen bonds are represented by dashed lines).
Due to the amide–iminol tautomerism shown in Figure 12, hydrazides resemble a peptide bond in structure.
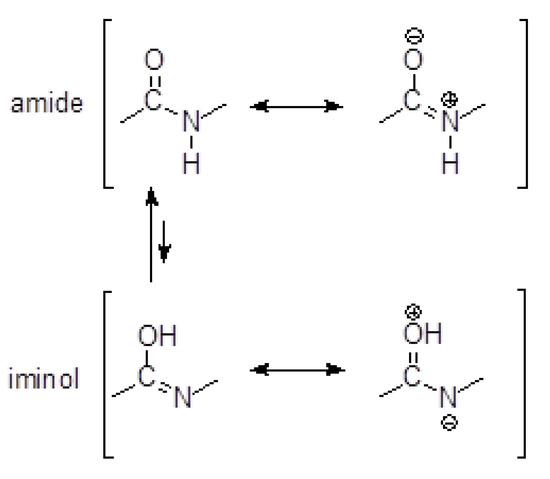
Figure 12.
Amide–iminol tautomerism.
The parameters of selected bond lengths and angles of hydrazides 1–5 are presented in Table 2.

Table 2.
Selected geometric parameters characterizing molecules of compounds 1–5.
Their analysis showed that, similarly to the peptide bond, the C=O bond was elongated in relation to the analogous bond in carboxylic acids, which was 1.20 Å. As in the case of the peptide bond, the C-N bond partially acquired the character of a double bond, which resulted in its significant shortening. A typical single C-N bond has a length of 1.47 Å [39], while in the analyzed hydrazides, it did not exceed 1.35 Å. In addition, the N-N bond in the crystals of compounds 1–5 was shorter than that in the hydrazine crystal lattice, which was 1.46 Å [40]. Perhaps this was due to the interaction of the non-bonding electron pair of the terminal nitrogen atom with the delocalized pair in the C-N bond. As in the case of the peptide bond, the O-C-N-H atoms were located almost in one plane.
Compound 6 as a derivative of L-ascorbic acid had a cyclic structure. Selected bond lengths of compound 6 compared with ascorbic acid are shown in Table 3.

Table 3.
Selected lengths of chemical bonds (Å) in crystals of molecules of compound 6 and L-ascorbic acid (AA) [41].
The analysis of the data contained in Table 3 showed that as a result of delocalization of electrons in the ascorbate anion, the C1=O and C2-C3 bonds were elongated compared with the undissociated L-ascorbic acid molecule. On the other hand, the C3-O bond was significantly shortened, becoming more of a double bond. This may explain the above-described difference in the chemical shift of the C3 carbon atom.
2.2. Microbiological Testing
The conducted research revealed some important differences in the antibacterial as well as the antifungal potential of the synthesized products. The growth of both the reference strains of staphylococci was inhibited only by compound 6 (hydrazinium L-ascorbate) at its highest concentration (512 µg/mL). Gram-negative bacteria, particularly E. coli, exhibited an importantly higher level of susceptibility. The MIC values (Table 4) for this strain were in the range of concentrations from 64 µg/mL (compound 3) to 512 µg/mL (compound 2). P. aeruginosa ATCC 27853 exhibited the highest sensitivity to D-rybonic acid hydrazide (1) (MIC = 128 µg/mL) and was most resistant (MIC = 512 µg/mL) to 2-deoxy-D-derybonic acid hydrazide (2), whereas other compounds inhibited the growth of this strain at the concentration 256 µg/mL.

Table 4.
Antibacterial activity of the synthesized compounds 1–6.
The most interesting observation from this part of the study devoted to the analysis of the antifungal activity of the synthesized hydrazides was an important dependence of their activity on the composition of the growth medium used for the assay (Table 5). Interestingly, all strains tested exhibited the highest level of susceptibility in the RPMI medium not supplemented with glucose. This medium contained glucose at the final concentration of 2.0 g/L, whilst the two other media contained 2.0% (w/w) of glucose, and the concentration of this sugar was the only difference between the two RPMI media. The MIC values for the most sensitive C. albicans strain in RPMI+GLC, RPMI-GLC and minimal YNB medium were in the ranges 32–128, 32–64, and 128->512 µg/mL, respectively. The highest inhibitory activity against this strain was shown by hydrazinium L-ascorbate (6) and D-gluconic acid hydrazide (3), with MIC values of 32, 32, and 128 and 32, 32, and 256 µg/mL respectively. Among the compounds, the highest activity was exhibited by D-gluconic acid hydrazide (3)—a derivative of glucose. Up to a concentration of 512 µg/mL, this hydrazide was able to inhibit the growth of all strains tested in all media except C. glabra and C. krusei, which were grown in minimal YNB medium (containing 2.0% of glucose). Compound 2 exhibited the lowest antifungal potential and was able to inhibit the growth of only the C. albicans strain in both RPMI media. In the RPMI medium not supplemented with glucose, compounds 1, 4, 5, and 6 effectively inhibited the growth of C. glabra, C. krusei, and C. parapsilosis at concentrations of 256 or 512 µg/mL. Considering the tested range of concentrations, none of the synthesized compounds was able to inhibit the growth of the C. glabra and C. krusei in the YNB medium, whilst compounds 1, 3, and 4 inhibited the growth of C. parapsilosis in this medium at the highest investigated concentration—512 µg/mL.

Table 5.
Antifungal activity of the synthesized compounds 1–6 in different media.
3. Materials and Methods
3.1. General Section
All sugar substrates: D-ribose, 2-deoxy-D-ribose, D-glucono-1,5-lactone, D-fucose, L-fucose, and L-ascorbic acid were purchased from Biosynth Ltd. (Compton, UK).
3.2. NMR Measurements
All measurements were carried out on a Bruker 500 MHz spectrometer. All spectra were recorded at controlled temperature of 298 K using TXI inverse probe. Obtained spectra were processed and analyzed with the usage of TopSpin 3.2 (Bruker BioSpin GmbH, Mannheim, Germany) software.
3.3. MS Spectrometry
MS spectra with ESI ionization were recorded using a Bruker Daltonics HCT Ultra spectrometer with an ion trap analyzer.
3.4. TG Analysis
Thermogravimetric analysis was performed using the TG209 thermobalance by Netzsch coupled with FT-IR, which enabled infrared (MIR) analysis of gaseous thermal decomposition products of the tested sample. High sensitivity of both thermogravimetric and infrared measurements was ensured by the liquid-nitrogen-cooled MCT detector. A sample of 5726 mg was analyzed in the temperature range of 28–450 °C, with a temperature increase of 10 °C per min in an argon atmosphere.
3.5. Elemental Analysis
Elemental analysis of the samples was performed using the Elementarny Vario El Cube CHNS analyzer by Elementar (Elementar Analysensysteme GmbH, Hesse, Germany). Measurements were taken twice (full results are in Table S1 in Supplementary Materials), and their values were averaged.
3.6. Polarimetry
Polarimetric measurements for both enantiomers of fuconic acid hydrazides (compound 4 and 5) were performed in water using the ISS REPo-1 Portable Refracto-Polarimeter by ATAGO (ATAGO Co. Ltd., Tokyo, Japan).
3.7. Single-Crystal X-ray Diffraction
Single-crystal X-ray diffraction data were collected on an Oxford Diffraction Gemini R ULTRA Ruby CCD diffractometer with MoKα (λ = 0.71073 Å) radiation at T = 295(2) K (Table 1). The lattice parameters were obtained by least-squares fit to the optimized setting angles of the reflections collected by means of CrysAlis CCD [39]. Data were reduced using CrysAlis RED software (Version 1.171.36.24) [42] by and applying multi-scan absorption corrections. The structural resolution procedure was carried out using the SHELX package [43]. The structures were solved with direct methods that carried out refinements by full-matrix least-squares on F2 using the SHELXL-2017/1 program [43]. All H-atoms bound to O/N-atoms were located on a difference Fourier map and refined freely with Uiso(H) = 1.5/1.2Ueq(O/N). All H-atoms bound to C-atoms were placed geometrically and refined using a riding model with d(C–H) = 0.97–0.98 Å and Uiso(H) = 1.2Ueq(C) or with d(C–H) = 0.96 Å and Uiso(H) = 1.5Ueq(C) for the methyl groups. All interactions were calculated using the PLATON program [44]. The following programs were used to prepare the molecular graphics: ORTEPII [45], PLUTO-78 [46], and Mercury [47]. Full crystallographic details of the structures reported in this paper have been deposited with the Cambridge Crystallographic Data Centre (deposition No. CCDC 2262959, CCDC 2262961, CCDC 2262964, CCDC 2262963, CCDC 2262960, and CCDC 2262962 for compounds 1–6, respectively), and they may be obtained from www: http://www.ccdc.cam.ac.uk (accessed on 2 July 2023), e-mail: deposit@ccdc.cam.ac.uk, or The Director, CCDC, 12 Union Road, Cambridge, CB2 1EZ, UK.
3.8. Antimicrobial Activity
The antimicrobial potential of the synthesized hydrazides was evaluated against two reference strains of Gram-negative bacteria (Escherichia coli ATCC 25922 and Pseudomonas aeruginosa ATCC 27853), two reference strains of Gram-positive staphylococci (Staphylococcus aureus ATCC 25923 and Staphylococcus aureus ATCC 29213), and four reference strains of pathogenic yeasts of the genus Candida spp. (Candida albicans SC5314, Candida glabrata DSM 11226, Candida krusei DSM 6128, and Candida parapsilosis DSM 5784). The assays were performed using a serial, twofold dilution method in 96-well microtiter plates under conditions recommended by the Clinical and Laboratory Standards Institute (CLSI, Pittsburgh, PA, USA). The aim of this procedure was the determination of the MIC parameter (Minimum Inhibitory Concentration)—the minimum concentration of a tested agent capable of inhibiting the growth of a specified strain of microorganism. In the case of bacterial strains, the assay was performed in Mueller–Hinton Broth (MHB) medium, and three different media were used for assessment of the antifungal potential of the synthesized compounds, namely RPMI (RPMI—10.4 g/L; Glucose 18 g/L, MOPS—35 g/L; this medium contained glucose at a final concentration of 2% (w/v), pH 7.0), RPMI not supplemented with glucose (RPMI—10,4 g/L; MOPS—35 g/L; this medium contained glucose at final concentration of 0.2% (w/v), pH 7.0), and YNB (Yeast Nitrogen Base with (NH4)2SO4—6.8 g/L, Glucose 20 g/L; this medium contained glucose at final concentration of 2% (w/v), pH of this medium was not adjusted). All three media dedicated to yeasts were filter-sterilized, whilst the MHB medium was sterilized in an autoclave. The amount of 1024 µg/mL solutions of all the synthesized hydrazides were prepared in all the above-mentioned sterile media. In the next step, the serial, twofold dilutions of the tested agents (over a range of concentrations from 1024.0 to 2.0 µg/mL) were prepared in the rows of 96-well microtitration plates, with a final volume of 100 μL of the appropriate medium. The bacterial strains were grown on the Mueller–Hinton Agar (MHA) for 18–24 h at 37 °C, and yeasts strains were cultivated on the YPD agar in the same conditions. A small amount of the biomass of the culture of each strain of microorganisms was suspended in the sterile PBS (phosphate buffered saline, pH 7.4 at 25 °C, purchased from Sigma) solution to obtain an optical density OD600 = 0.13 (for bacteria—equal to the cells concentration of approximately 1 × 10⁸ CFU/mL) and OD660 = 0.10 (for yeasts—equal to the cells concentration of approximately 1 × 10⁶ CFU/mL). The obtained suspensions of the bacterial strains were then diluted 1:100 (v/v) in the MHB2 medium, whilst yeasts’ suspensions were diluted 1:50 (v/v) in the appropriate medium. Then, 100 μL of the cells’ suspension was finally loaded into the wells of plates prepared in advance, which contained 100 μL of twofold dilutions of the tested hydrazides (the final concentration of the bacterial cells in all wells was approximately 5 × 10⁵ CFU/mL and 1 × 10⁴ CFU/mL for yeasts). A positive growth control of each strain (both bacteria and yeasts) was prepared in the wells without the tested substances. A negative control containing only the media was included in each assay. Microtiter plates were incubated at 37 °C for 24 h. Following the incubation period, the determination of the MIC values of the tested agents was carried out by measuring the absorbance at 531 nm using a Victor3 microplate reader (Perkin Elmer, Inc., Waltham, MA, USA). The lowest concentration of the agent causing inhibition of growth equal to or greater than 90% (MIC90) of the growth control was taken as the MIC value. Each test was repeated three times.
3.9. General Procedure for the Preparation of Lactones
The appropriate monosaccharide was dissolved in water and K2CO3 was added. The mixture was cooled to 0 °C, and Br2 was added dropwise while stirring. After one hour, the temperature was allowed to rise to room temperature, and the mixture was further stirred for 24 h. Then, the solution was acidified with formic acid to a pH of approx. 3.5, and the volatile components were then evaporated under reduced pressure not exceeding the bath temperature of 50 °C. The residue was extracted three times with ethanol. The combined extracts were filtered and concentrated. The obtained crude lactone was used for the synthesis of hydrazide without further purification.
D-Ribono-1,4-lactone—D-Ribose (8.00 g, 53.3 mM) was dissolved in H2O (70 mL), and K2CO3 was added (8.80 g, 63.7 mM). After cooling to 0 °C, Br2 was added dropwise (3.0 mL, 58.5 mM); 8.26 g of crude lactone was obtained.
2-Deoksy-D-ribono-1.4-lactone—2-Deoxy-D-ribose (5.00 g, 37.9 mM) was dissolved in H2O (50 mL), and K2CO3 was added (5.50 g, 40.0 mM). After cooling to 0 °C, Br2 was added dropwise (2.0 mL, 39.0 mM); 5.23 g of crude lactone was obtained.
D-Fuconolactone—D-Fucose (3.00 g, 18.3 mM) was dissolved in H2O (40 mL), and K2CO3 was added (3.10 g, 22.4 mM). After cooling to 0 °C, Br2 was added dropwise (1.0 mL, 19.5 mM); 3.3 g of crude lactone was obtained.
L-Fuconolactone—L-Fucose (3.00 g, 18.3 mM) was dissolved in H2O (40 mL), and K2CO3 was added (3.10 g, 22.4 mM). After cooling to 0 °C, Br2 was added dropwise (1.0 mL, 19.5 mM); 3.5 g of crude lactone was obtained.
3.10. General Procedure for the Preparation of Hydrazides
The appropriate lactone was dissolved in methanol and mixed in a glycerin bath at 65 °C. To this mixture was added hydrazine monohydrate, and the mixture was stirred at that temperature for another hour. The mixture then slowly reached room temperature and was stirred for a further 24 h. At this time, the white precipitate was filtered off and recrystallized from a mixture of methanol and water 70:30 (v/v).
D-Ribonic acid hydrazide (1)—Crude D-ribono-1,4-lactone (8.26 g) was dissolved in MeOH (70 mL), and hydrazine monohydride was added (2.6 mL, 52.0 mM). Pure hydrazide was obtained after recrystallization (4.47 g, yield after two steps 46.6%, mp. 145.7–146.9 °C, lit. 150 °C [34]). Elemental analysis data: Analyzed Calc. for C5H12N2O5: C, 33.34; H, 6.67; N, 15.6. Found: C, 33.34; H, 6.630; N, 15.47. NMR: 1H NMR (D2O, 500 MHz): 4.32 (d, 1 H, J1,2 = 3.72 Hz, H-2), 3,86 (dd, 1 H, J2,3 = 3.67 Hz, H-3), 3.79–3.76 (m, 1 H, H-4), 3.74 (dd, 1 H, J4,5 = 6.32 Hz, H-5), 3.58 (dd, 1 H, J5,5′ = 11.83 Hz, H-5′); 13C NMR (D2O, 125 MHz): 172.51 C1, 72.66 C3, 72.13 C2, 70.94 C4, 62.83 C5.
2-Deoxy-D-ribonic acid hydrazide (2)—Crude 2-deoxy-D-ribono-1,4-lactone (5.23 g) was dissolved in MeOH (50 mL), and hydrazine monohydride was added (1.9 mL, 38.0 mM). Pure hydrazide was obtained after recrystallization (4.30 g, yield after two steps 70.2%, mp. 136.6-137.4 °C). Elemental analysis data: Analyzed Calc. for C5H12N2O4: C, 36.59; H, 7.32; N, 17.07. Found: C, 36.66; H, 7.257; N, 17.04. NMR: 1H NMR (D2O, 500 MHz): 3.96 (m, 1 H, H-4), 3.69 (dd, 1 H, J2,2 = 10.92 Hz, J2,3 = 2.12 Hz, H-2), 3.56 (m, 2 H, H-2′, H-3), 2.51 (dd, 1 H, J4,5 = 2.82 Hz, J5,5′ = 14.63 Hz, H-5), 2.28 (dd, 1 H, J4,5′ = 9.80 Hz, H-5′); 13C NMR (D2O, 125 MHz): 172.92 C1, 74.26 C3, 68.77 C4, 62.38 C5, 37.47 C2.
D-Gluconic acid hydrazide (3)—Commercially available δ-D-gluconolactone (7.00 g, 39.3 mM) was dissolved in MeOH (70 mL), and hydrazine monohydride was added (2.0 mL, 40.0 mM). Pure hydrazide was obtained after recrystallization (4.30 g, yield 89.3%, mp. 143.5–144.5 °C, lit. 142 °C [34]). Elemental analysis data: Analyzed Calc. for C6H14N2O6: C, 34.29; H, 6.67; N, 13.33. Found: C, 34.31; H, 6.628; N, 13.22. NMR: 1H NMR (D2O, 500 MHz): 4.30 (dd, 1 H, J1,2 = 4.17 Hz, H-2), 4.05–4.01 (m, 1 H, H-3), 3.79–3.74 (m, 1 H, H-6), 3.72–3.67 (m, 1 H, H-5), 3.67–3.63 (m, 1 H, H-4), 3.62–3.57 (m, 1 H, H-6′); 13C NMR (D2O, 125 MHz): 172.65 C1, 72.85 C2, 71.74 C4, 71.05 C5, 70.39 C3, 62.63 C6.
D-Fuconic acid hydrazide (4) –Crude D-fuconolactone (3.3 g) was dissolved in MeOH (50 mL), and hydrazine monohydride was added (1.00 mL, 20.0 mM). Pure hydrazide was obtained after recrystallization (1.86 g, yield after two steps 52.4%, decomposition above 191 °C). Specific rotation [ Elemental analysis data: Analyzed Calc. for C6H14N2O5: C, 37.11; H, 7.22; N, 14.43. Found: C, 37.02; H, 7.263; N, 14.36. NMR: 1H NMR (D2O, 500 MHz): 4.45 (s, 1 H, H-2), 4.04 (d, 1 H, J5,6 = 6.57 Hz, H-5), 3.91 (d, 1 H, J3,4 = 9.48 Hz, H-3), 3.43 (d, 1 H, H-4), 1.20 (d, 3 H, H-6); 13C NMR (D2O, 125 MHz): 173.92 C1, 72.51 C4, 71.11 C3, 70.86 C2, 65.82 C5, 18.69 C6.
L-Fuconic acid hydrazide (5) –Crude L-fuconolactone (3.5 g) was dissolved in MeOH (50 mL), and hydrazine monohydride was added (1.00 mL, 20.0 mM). Pure hydrazide was obtained after recrystallization (1.51 g, yield after two steps 42.5%, decomposition above 191 °C). Specific rotation [ Elemental analysis data: Analyzed Calc. for C6H14N2O5: C, 37.11; H, 7.22; N, 14.43. Found: C, 37.08; H, 7.259; N, 14.38. NMR: 1H NMR (D2O, 500 MHz): 4.45 (s, 1 H, H-2), 4.04 (d, 1 H, J5,6 = 6.57 Hz, H-5), 3.91 (d, 1 H, J3,4 = 9.48 Hz, H-3), 3.43 (d, 1 H, H-4), 1.20 (d, 3 H, H-6); 13C NMR (D2O, 125 MHz): 173.92 C1, 72.51 C4, 71.11 C3, 70.86 C2, 65.82 C5, 18.69 C6.
Hydrazinium L-ascorbate (6)—Commercially available L-ascorbic acid (5.00 g, 28.4 mM) was dissolved in MeOH (70 mL), and hydrazine monohydride was added (1.42 mL, 28.4 mM). Pure hydrazide was obtained after recrystallization (4.38 g, yield 74.2%, decomposition above 140 °C). Elemental analysis data: Analyzed Calc. for C6H12N2O6: C, 34.62; H, 5.77; N, 13.46. Found: C, 34.67; H, 5.746; N, 13.46. NMR: 1H NMR (D2O, 500 MHz): 4.42 (d, 1 H, J4,5 = 1.83 Hz, H-4), 3.92 (m, 1 H, H-5), 3.65 (m, 2 H, H-6 and H-6′); 13C (D2O, 125 MHz): 177.51 C1, 175.59 C3, 113.09 C2, 78.35 C4, 59.52 C5, 62.52 C6.
4. Conclusions
Sugar lactones, both commercially available and those synthesized by us by oxidation of appropriate monosaccharides with bromine, turned out to be good substrates for obtaining sugar hydrazides. At the same time, L-ascorbic acid, which is also a lactone, turned out to be such a strong acid whose reaction with hydrazine led to the formation of hydrazinium L-ascorbate (compound 6), and not, as initially assumed, to the corresponding hydrazide. We were able to obtain all products of hydrazinolysis in a crystalline form and perform X-ray crystallographic measurements on them. The results of these analyses showed that all obtained hydrazides had the Z-isomer structure in the crystal lattice. Moreover, the crystallographic results completely confirmed the structure of hydrazinium ascorbate for the reaction product of L-ascorbic acid with hydrazine.
Summing up, the results of the microbiological tests performed seem to suggest that the lack of a hydroxyl group at the C-2 carbon atom (compound 2) significantly affected the activity of the compound. Such a strong effect was not observed in the absence of such a group on the C-6 carbon atom (compounds 4 and 5). Additionally, for these compounds, which are enantiomers, no significant difference in activity was observed. In addition, based on the obtained results, it can be concluded that the length of the carbon chain may have affected the microbial activity (five-carbon in compound 2 and six-carbon in hydrazides 3, 4, and 5). Compound 6 (hydrazinium L-ascorbate) should be considered separately; its results were so interesting that it seems worth subjecting it to a broader study of biological activity.
Supplementary Materials
The following supporting information can be downloaded at: https://www.mdpi.com/article/10.3390/ijms241512114/s1.
Author Contributions
Conceptualization, J.M.; investigation, J.M. and P.S.; X-ray crystallography, A.S.; data curation: J.M., J.S.-F., B.D., A.S. and P.S.; writing—original draft preparation, J.M.; writing—review and editing, J.M., J.S.-F., B.D., A.S. and P.S.; supervision, J.M.; project administration, J.S.-F.; funding acquisition, J.M. All authors have read and agreed to the published version of the manuscript.
Funding
This study was supported by University of Gdansk, task grant no. DS/531-T100-D501-23.
Institutional Review Board Statement
Not applicable.
Informed Consent Statement
Not applicable.
Data Availability Statement
Not applicable.
Conflicts of Interest
The authors declare no conflict of interest. The funders had no role in the design of the study; in the collection, analyses, or interpretation of data; in the writing of the manuscript, or in the decision to publish the results.
References
- Moss, G.P.; Smith, P.A.S.; Tavernier, D. Glossary of class names of organic compounds and reactivity intermediates based on structure (IUPAC Recommendations 1995). Pure Appl. Chem. 1995, 67, 1307–1375. [Google Scholar] [CrossRef]
- Joly, N.; Bettoni, L.; Gaillard, S.; Poater, A.; Renaud, J.L. Phosphine-Free Ruthenium Complex-Catalyzed Synthesis of Mono- or Dialkylated Acyl Hydrazides via the Borrowing Hydrogen Strategy. J. Org. Chem. 2021, 86, 6813–6825. [Google Scholar] [CrossRef] [PubMed]
- Brosse, N.; Pinto, M.F.; Jamart-Grégoire, B. New Synthesis of 1,1-Substituted Hydrazines by Alkylation of N-Acyl- or N-alkyloxycarbonylaminophthalimide Using the Mitsunobu Protocol. J. Org. Chem. 2000, 65, 4370–4374. [Google Scholar] [CrossRef] [PubMed]
- Cui, Z.; Du, D.M. Enantioselective Synthesis of β-Hydrazino Alcohols Using Alcohols and N-Boc-Hydrazine as Substrates. Org. Lett. 2016, 18, 5616–5619. [Google Scholar] [CrossRef] [PubMed]
- Huang, Y.; Choy, P.Y.; Wang, J.; Tse, M.K.; Sun, R.W.; Chan, A.S.; Kwong, F.Y. Palladium-Catalyzed Monoarylation of Arylhydrazines with Aryl Tosylates. J. Org. Chem. 2020, 85, 14664–14673. [Google Scholar] [CrossRef] [PubMed]
- Gu, L.; Neo, B.S.; Zhang, Y. Gold-catalyzed direct amination of arenes with azodicarboxylates. Org. Lett. 2011, 13, 1872–1874. [Google Scholar] [CrossRef]
- Cao, J.; Lv, D.; Yu, F.; Chiou, M.F.; Li, Y.; Bao, H. Regioselective Three-Component Synthesis of Vicinal Diamines via 1,2-Diamination of Styrenes. Org. Lett. 2021, 23, 3184–3189. [Google Scholar] [CrossRef]
- Ma, F.-F.; Peng, Z.-Y.; Li, W.-F.; Xie, X.-M.; Zhang, Z. An efficient Pd-catalyzed coupling of hydrazine derivatives with aryl halides. Synlett 2011, 2011, 2555–2558. [Google Scholar] [CrossRef]
- Xiong, X.; Jiang, Y.; Ma, D. Assembly of N,N-disubstituted hydrazines and 1-aryl-1H-indazoles via copper-catalyzed coupling reactions. Org. Lett. 2012, 14, 2552–2555. [Google Scholar] [CrossRef] [PubMed]
- Jiang, L.; Lu, X.; Zhang, H.; Jiang, Y.; Ma, D. CuI/4-hydro-L-proline as a more effective catalytic system for coupling of aryl bromides with N-boc hydrazine and aqueous ammonia. J. Org. Chem. 2009, 74, 4542–4546. [Google Scholar] [CrossRef]
- Wolter, M.; Klapars, A.; Buchwald, S.L. Synthesis of N-aryl hydrazides by copper-catalyzed coupling of hydrazides with aryl iodides. Org. Lett. 2001, 3, 3803–3805. [Google Scholar] [CrossRef] [PubMed]
- Bredihhin, A.; Mäeorg, U. Use of polyanions for alkylation of hydrazine derivatives. Org. Lett. 2007, 9, 4975–4977. [Google Scholar] [CrossRef] [PubMed]
- Bredihhin, A.; Groth, U.M.; Mäeorg, U. Formation and Use of a Nitrogen Dianion for Selective Hydrazine Alkylation Provides a Fast and Easy Access to Substituted Hydrazines, Which Are Widely Used as Drugs, Pesticides and Precursors for a Variety of Compounds in Organic Synthesis. Org. Lett. 2007, 9, 1097–1099. [Google Scholar] [CrossRef]
- Kisseljova, K.; Tsubrik, O.; Sillard, R.; Mäeorg, S.; Mäeorg, U. Addition of arylboronic acids to symmetrical and unsymmetrical azo compounds. Org. Lett. 2006, 8, 43–45. [Google Scholar] [CrossRef]
- Kawase, Y.; Yamagishi, T.; Kato, J.-Y.; Kutsuma, T.; Kataoka, T.; Iwakuma, T.; Yokomatsu, T. Reductive Alkylation of Hydrazine Derivatives with α-Picoline-Borane and Its Applications to the Syntheses of Useful Compounds Related to Active Pharmaceutical Ingredients. Synthesis 2014, 46, 455–464. [Google Scholar] [CrossRef]
- Wang, T.; Di, X.; Wang, C.; Zhou, L.; Sun, J. Reductive Hydrazination with Trichlorosilane: A Method for the Preparation of 1,1-Disubstituted Hydrazines. Org. Lett. 2016, 18, 1900–1903. [Google Scholar] [CrossRef]
- Shamsabadi, A.; Chudasama, V. An overview of the synthesis of acyl hydrazides from aldehydes and reactions of the products thereof. Org. Biomol. Chem. 2016, 15, 17–33. [Google Scholar] [CrossRef]
- Al-Iraqi, M.A.; Al-Allaf, H.A.I. Synthesis of Some 2-Substituted Quinazolin-4(3H)-one Compounds from Methyl α-[(4-oxoquinazolin-2-yl)thio]acetate. Egypt. J. Chem. 2021, 64, 7363–7370. [Google Scholar] [CrossRef]
- Bernstein, J.; Lott, W.A.; Steinberg, B.A.; Yale, H.L. Chemotherapy of experimental tuberculosis. V. Isonicotinic acid hydrazide (nydrazid) and related compounds. Am. Rev. Tuberc. 1952, 65, 357–364. [Google Scholar] [CrossRef]
- Fox, H.H. The chemical approach to the control of tuberculosis. Science 1952, 116, 129–134. [Google Scholar] [CrossRef] [PubMed]
- Gloaguen, E.; Brenner, V.; Alauddin, M.; Tardivel, B.; Mons, M.; Zehnacker-Rentien, A.; Declerck, V.; Aitken, D.J. Direct spectroscopic evidence of hyperconjugation unveils the conformational landscape of hydrazides. Angew. Chem. Int. Ed. 2014, 53, 13756–13759. [Google Scholar] [CrossRef]
- Hastings, J.; Owen, G.; Dekker, A.; Ennis, M.; Kale, N.; Muthukrishnan, V.; Turner, S.; Swainston, N.; Mendes, P.; Steinbeck, C. Improved services and an expanding collection of metabolites. Nucleic Acids Res. 2016, 44, D1214–D1219. [Google Scholar] [CrossRef]
- Le Tiec, C.; Barrail, A.; Goujard, C.; Taburet, A.M. Clinical pharmacokinetics and summary of efficacy and tolerability of atazanavir. Clin. Pharmacokinet. 2005, 44, 1035–1050. [Google Scholar] [CrossRef]
- Ragnarsson, U. Synthetic methodology for alkyl substituted hydrazines. Chem. Soc. Rev. 2001, 30, 205–213. [Google Scholar] [CrossRef]
- Haddad, F.; Sawalha, M.; Khawaja, Y.; Najjar, A.; Karaman, R. Dopamine and Levodopa Prodrugs for the Treatment of Parkinson’s Disease. Molecules 2017, 23, 40. [Google Scholar] [CrossRef]
- Popiołek, Ł. Updated Information on Antimicrobial Activity of Hydrazide-Hydrazones. Int. J. Mol. Sci. 2021, 22, 9389. [Google Scholar] [CrossRef]
- Flinn, N.S.; Quibell, M.; Monk, T.P.; Ramjee, M.K.; Urch, C.J. A single-step method for the production of sugar hydrazides: Intermediates for the chemoselective preparation of glycoconjugates. Bioconjug. Chem. 2005, 16, 722–728. [Google Scholar] [CrossRef]
- Tweeddale, H.J.; Redmond, J.W. NMR Studies of Saccharide Hydrazones, Thiosemicarbazones and Azines: Model Compounds for Immobilisation Studies. J. Carbohydr. Chem. 1998, 17, 27–38. [Google Scholar] [CrossRef]
- Augé, J.; Nadège, L.-G. Glycosylhydrazides, a New Class of Sugar Surfactant. Preparation and Amphiphilic Properties of 1-Glycosyl-2-Acylhydrazines. J. Carbohydr. Chem. 2000, 19, 379–392. [Google Scholar] [CrossRef]
- Godula, K.; Bertozzi, C.R. Synthesis of glycopolymers for microarray applications via ligation of reducing sugars to a poly(acryloyl hydrazide) scaffold. J. Am. Chem. Soc. 2010, 132, 9963–9965. [Google Scholar] [CrossRef]
- Becher, J.; Seidel, I.; Plass, W.; Klemm, D. Synthesis pathway to carbohydrate-derived salicylidene hydrazides as ligands for oxovanadium complexes. Tetrahedron 2006, 62, 5675–5681. [Google Scholar] [CrossRef]
- Smith, A.; Nobmann, P.; Henehan, G.; Bourke, P.; Dunne, J. Synthesis and antimicrobial evaluation of carbohydrate and polyhydroxylated non-carbohydrate fatty acid ester and ether derivatives. Carbohydr. Res. 2008, 343, 2557–2566. [Google Scholar] [CrossRef]
- Batra, H.; Moriarty, R.M.; Penmasta, R.; Sharma, V.; Stanciuc, G.; Staszewski, J.P.; Tuladhar, S.M.; Walsh, D.A.; Datla, S.; Krishnaswamy, S.; et al. Efficient and Production-Scale Synthesis of a Protected L-Lyxonolactone Derivative: An Important Aldonolactone Core. Org. Process Res. Dev. 2006, 10, 484–486. [Google Scholar] [CrossRef]
- Van Marle, T.W.J. Des Relations Entre la Configuration et le Pouvoir Rotatoire Optique de Quelques Dérivés D’Acides du Groupe des Sucres. Recl. Trav. Chim. Pays-Bas. 1920, 39, 549–572. [Google Scholar] [CrossRef]
- Le Grel, P.; Salaün, A.; Mocquet, C.; Le Grel, B.; Roisnel, T.; Potel, M. Z/E isomerism in Nα-Nα-disubstituted hydrazides and the amidoxy bond: Application to the conformational analysis of pseudopeptides built of hydrazinoacids and α-aminoxyacids. J. Org. Chem. 2011, 76, 8756–8767. [Google Scholar] [CrossRef]
- Andrea, A.; Barge, A.; Cravotto, G.; Genzini, L.; Gobetto, R.; Vincenti, M. Natural origin of ascorbic acid: Validation by 13C NMR and IRMS. Food Chem. 2009, 112, 715–720. [Google Scholar] [CrossRef]
- Kang, S.O.; Sapper, H.; Lohmann, W. The Oxidative Degradation of l-Ascorbic Acid via an α-Ketoaldehyde. Z. Naturforschung C 1982, 37, 1064–1069. [Google Scholar] [CrossRef]
- Cimino, P.; Troiani, A.; Pepi, F.; Garzoli, S.; Salvitti, C.; Di Rienzo, B.; Barone, V.; Ricci, A. From ascorbic acid to furan derivatives: The gas phase acid catalyzed degradation of vitamin C. Phys. Chem. Chem. Phys. 2018, 20, 17132–17140. [Google Scholar] [CrossRef]
- Allen, F.H.; Kennard, O.; Watson, D.G.; Brammer, L.; Orpen, A.G.; Taylor, R. Tables of Bond Lengths determined by X-ray and Neutron Diffraction. Part 1. Bond Lengths in Organic Compounds. J. Chem. Soc. Perkin Trans. 1987, 2, S1–S19. [Google Scholar] [CrossRef]
- Collin, R.L.; Lipscomb, W.N. The crystal structure of hydrazine. Acta Crystallogr. 1951, 4, 10–14. [Google Scholar] [CrossRef]
- Hvoslef, J. The crystal structure of L-ascorbic acid, “vitamin C”. The X-ray analysis. Acta Crystallogr. B Struct. Crystallogr. Cryst. Chem. 1968, 24, 23–35. [Google Scholar] [CrossRef] [PubMed]
- CrysAlis CCD and CrysAlis RED, Version 1.171.36.24; Oxford Diffraction Ltd.: Yarnton, UK, 2012.
- Sheldrick, G.M. Crystal structure refinement with SHELXL. Acta Crystallogr. C Struct. Chem. 2015, 71, 3–8. [Google Scholar] [CrossRef] [PubMed]
- Spek, A.L. Structure validation in chemical crystallography. Acta Crystallogr. D Biol. Crystallogr. 2009, 65, 148–155. [Google Scholar] [CrossRef]
- Johnson, C.K. ORTEP II, Report ORNL-5138; Oak Ridge National Laboratory: Oak Ridge, TN, USA, 1976. [Google Scholar]
- Motherwell, S.; Clegg, S. PLUTO-78, Program for Drawing and Molecular Structure; University of Cambridge: Cambridge, UK, 1978. [Google Scholar]
- Macrae, C.; Bruno, I.; Chisholm, J.; Edgington, P.; McCabe, P.; Pidcock, E.; Rodriguez-Monge, L.; Taylor, R.; van de Streek, J.; Wood, P. Mercury CSD 2.0—New features for the visualization and investigation of crystal structures. J. Appl. Cryst. 2008, 41, 466–470. [Google Scholar] [CrossRef]
Disclaimer/Publisher’s Note: The statements, opinions and data contained in all publications are solely those of the individual author(s) and contributor(s) and not of MDPI and/or the editor(s). MDPI and/or the editor(s) disclaim responsibility for any injury to people or property resulting from any ideas, methods, instructions or products referred to in the content. |
© 2023 by the authors. Licensee MDPI, Basel, Switzerland. This article is an open access article distributed under the terms and conditions of the Creative Commons Attribution (CC BY) license (https://creativecommons.org/licenses/by/4.0/).
