
New Gene Markers of Exosomal Regulation Are Involved in Porcine Granulosa Cell Adhesion, Migration, and Proliferation

 , , ,
, , ,  ,
,
Abstract
1. Introduction
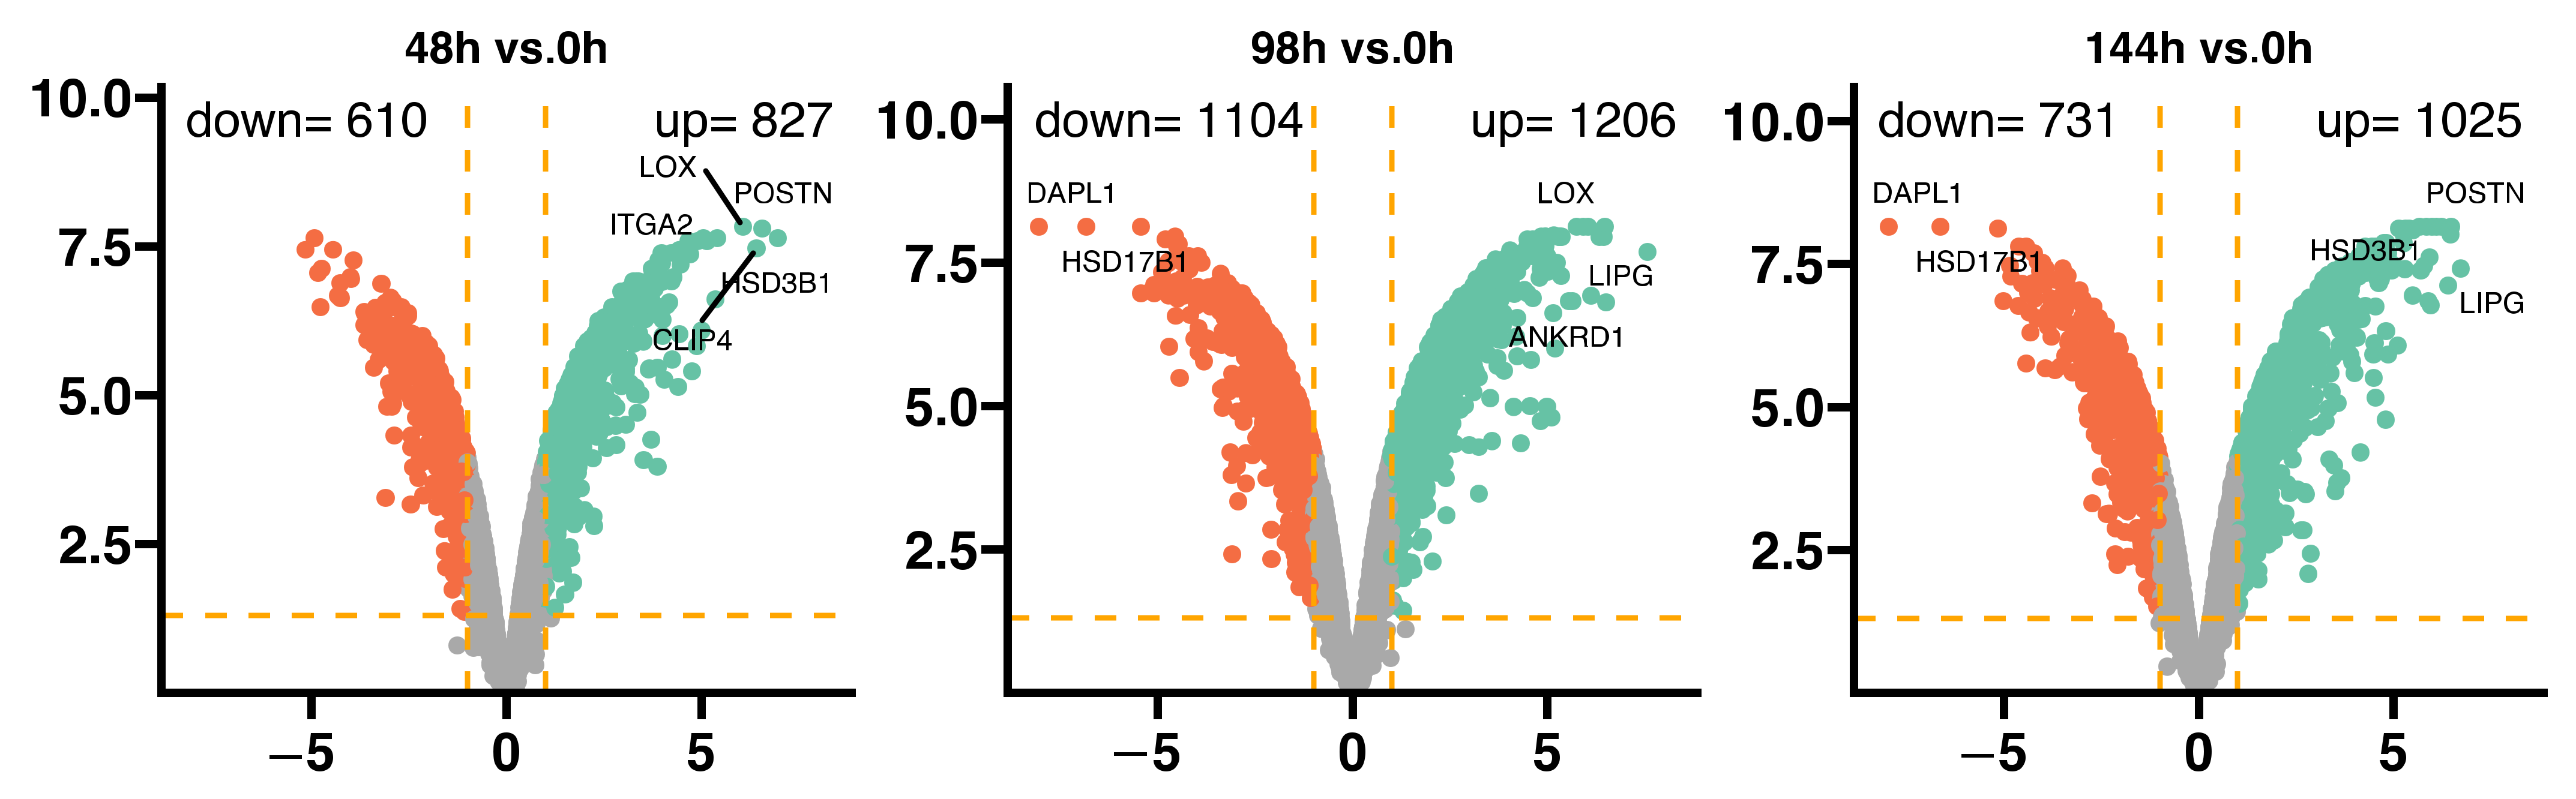
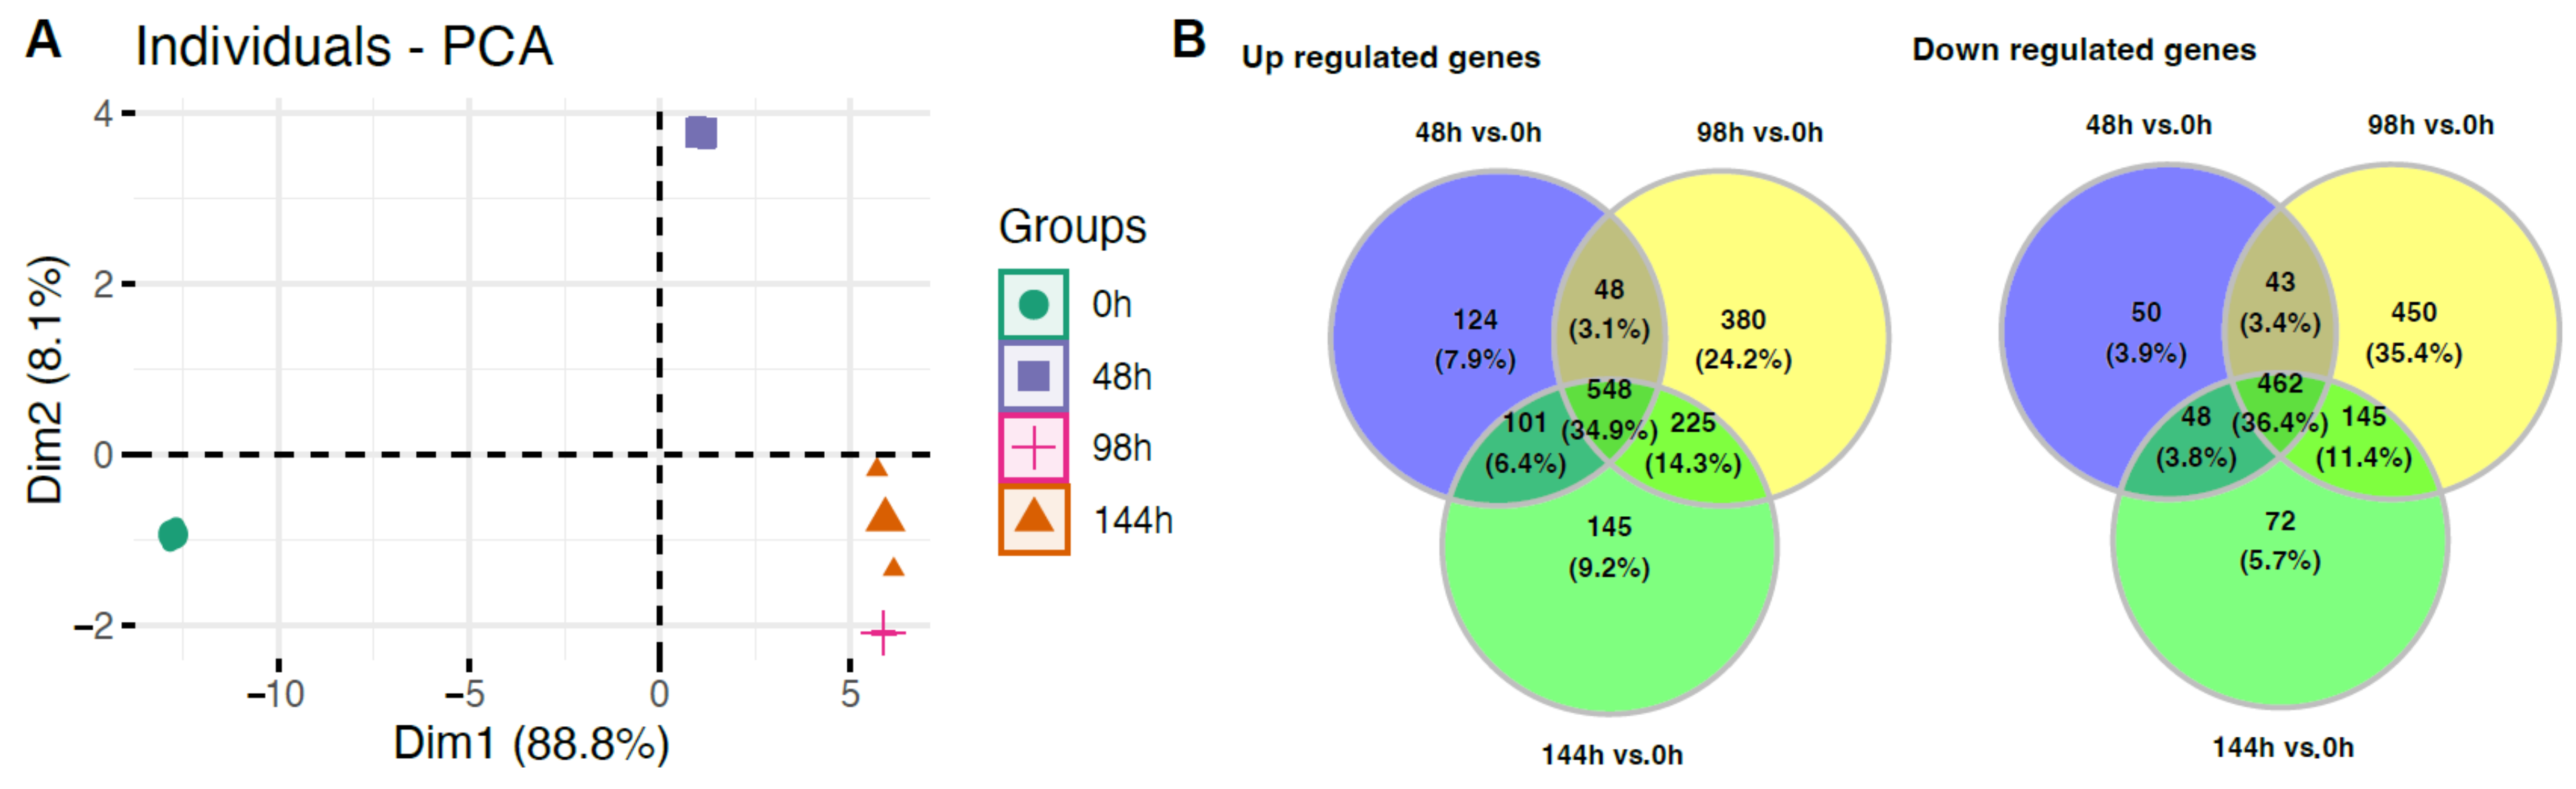
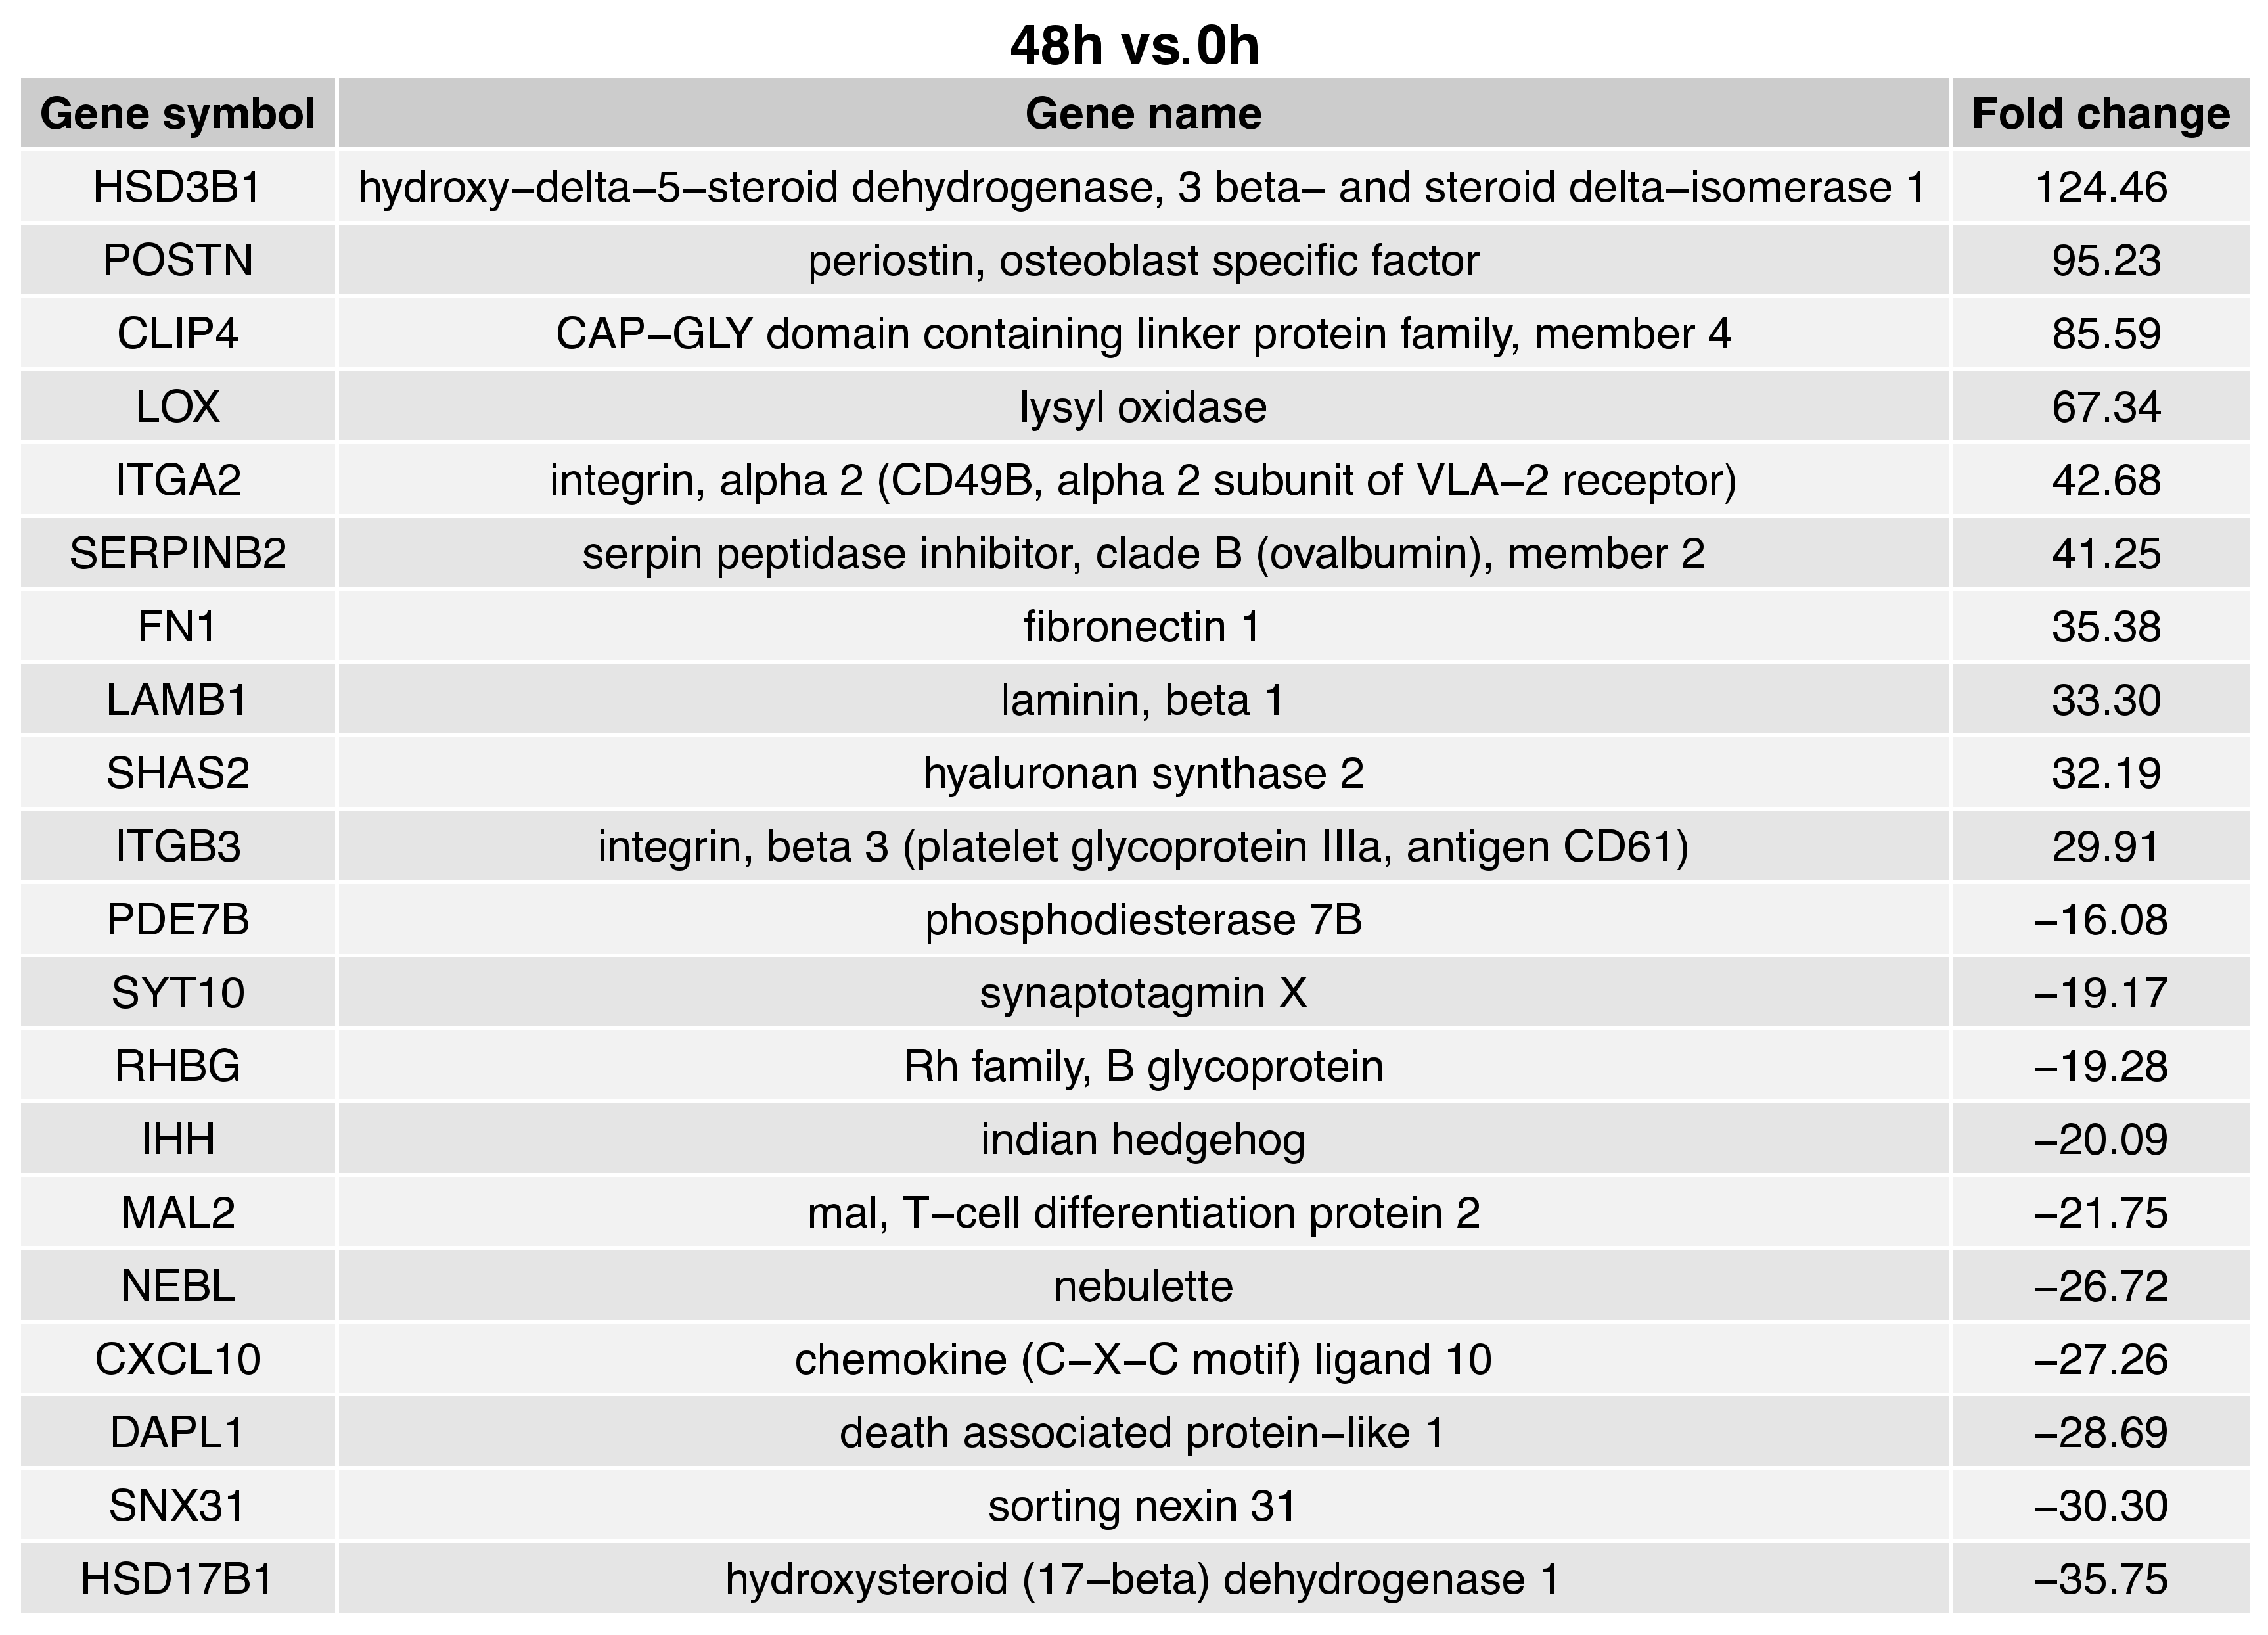
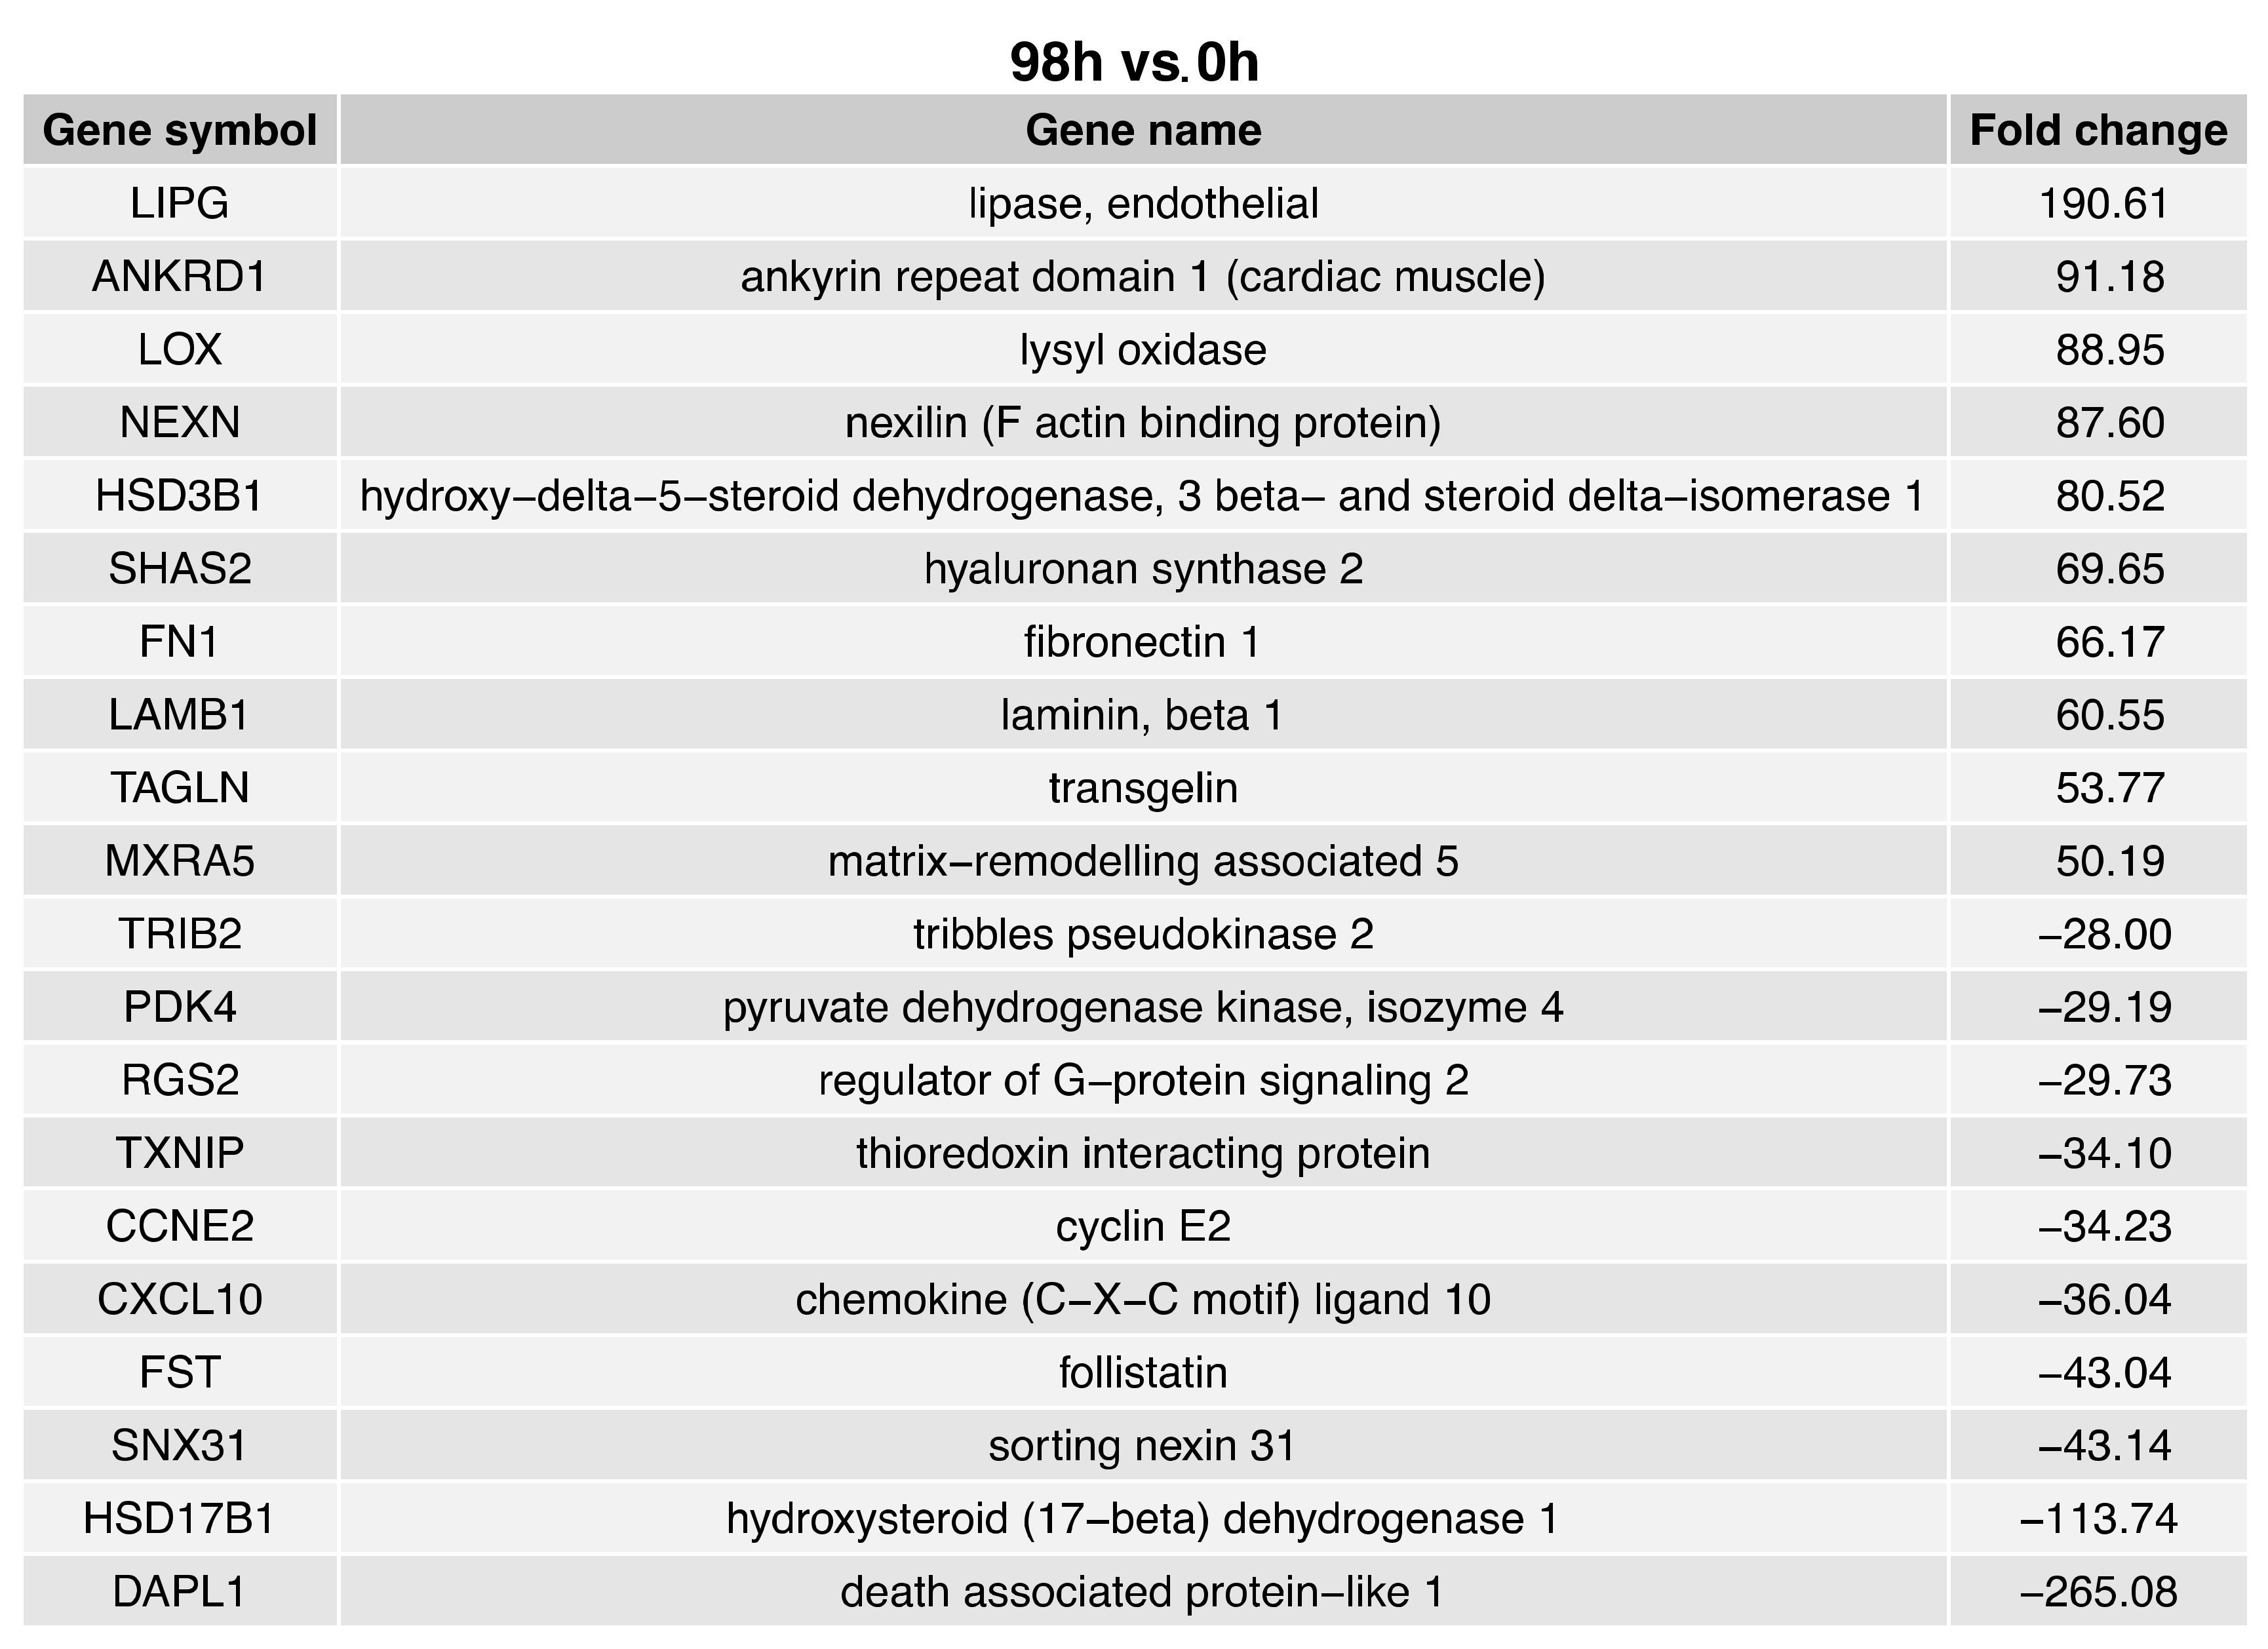
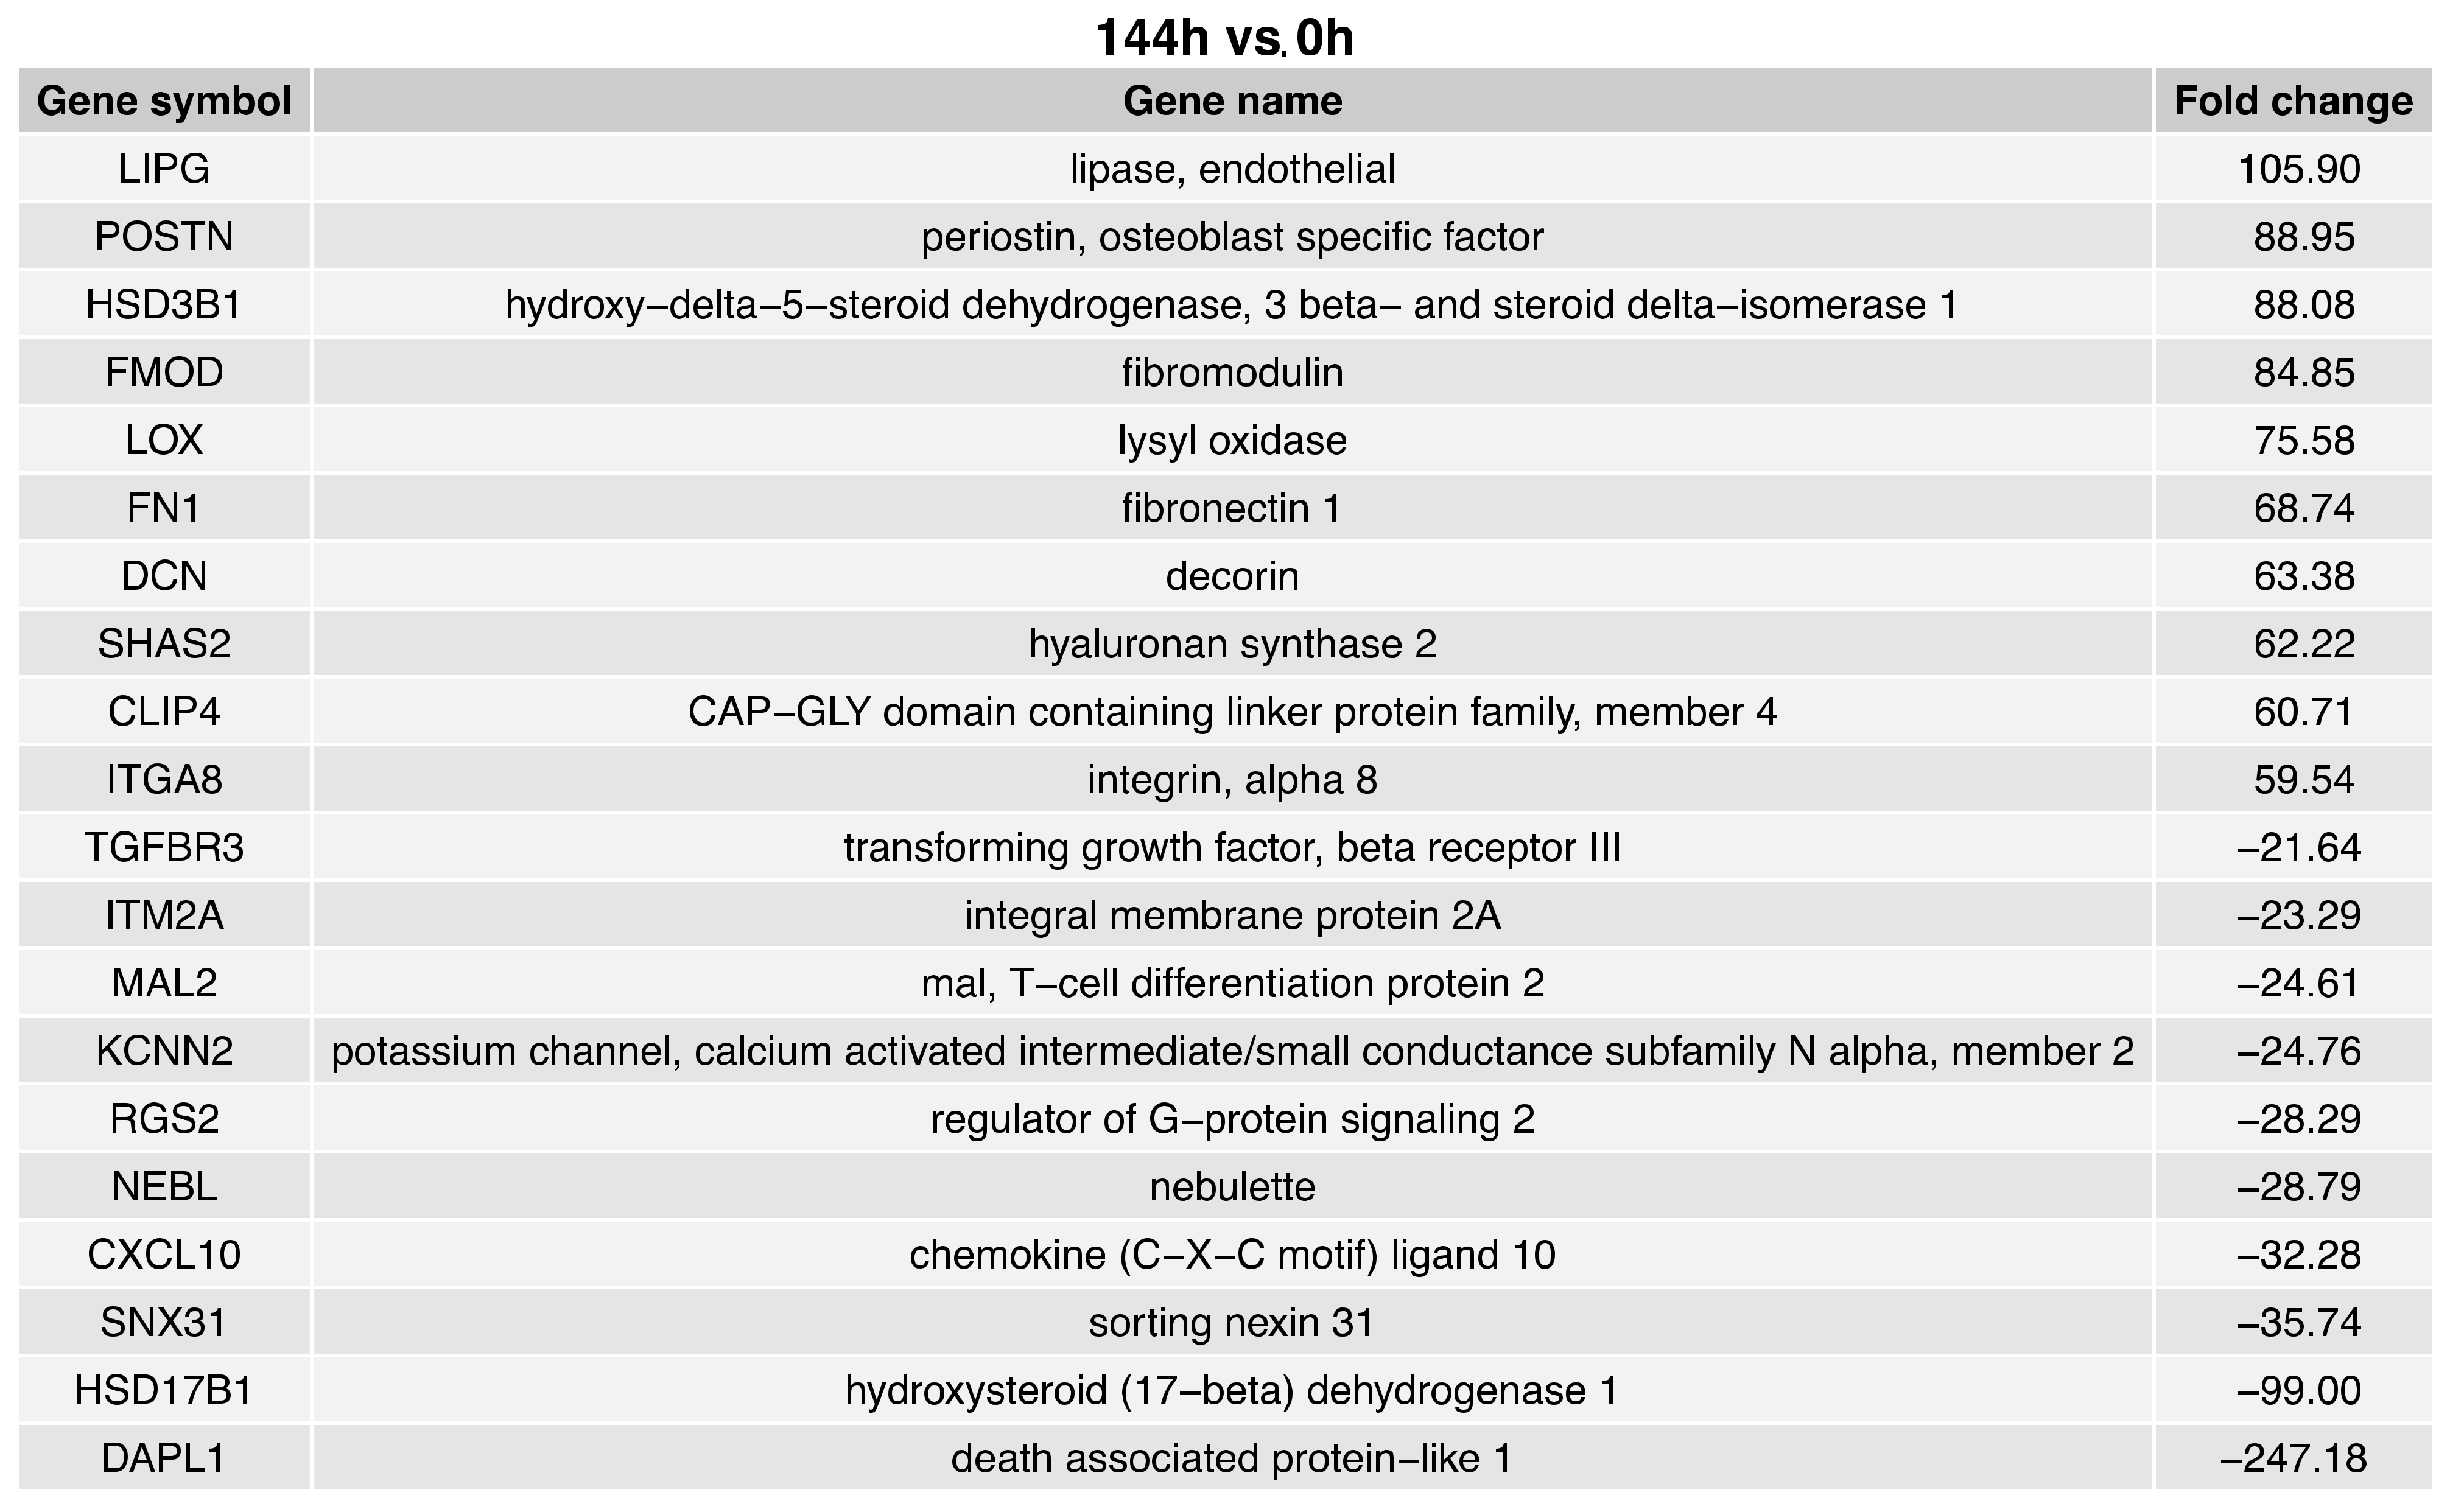
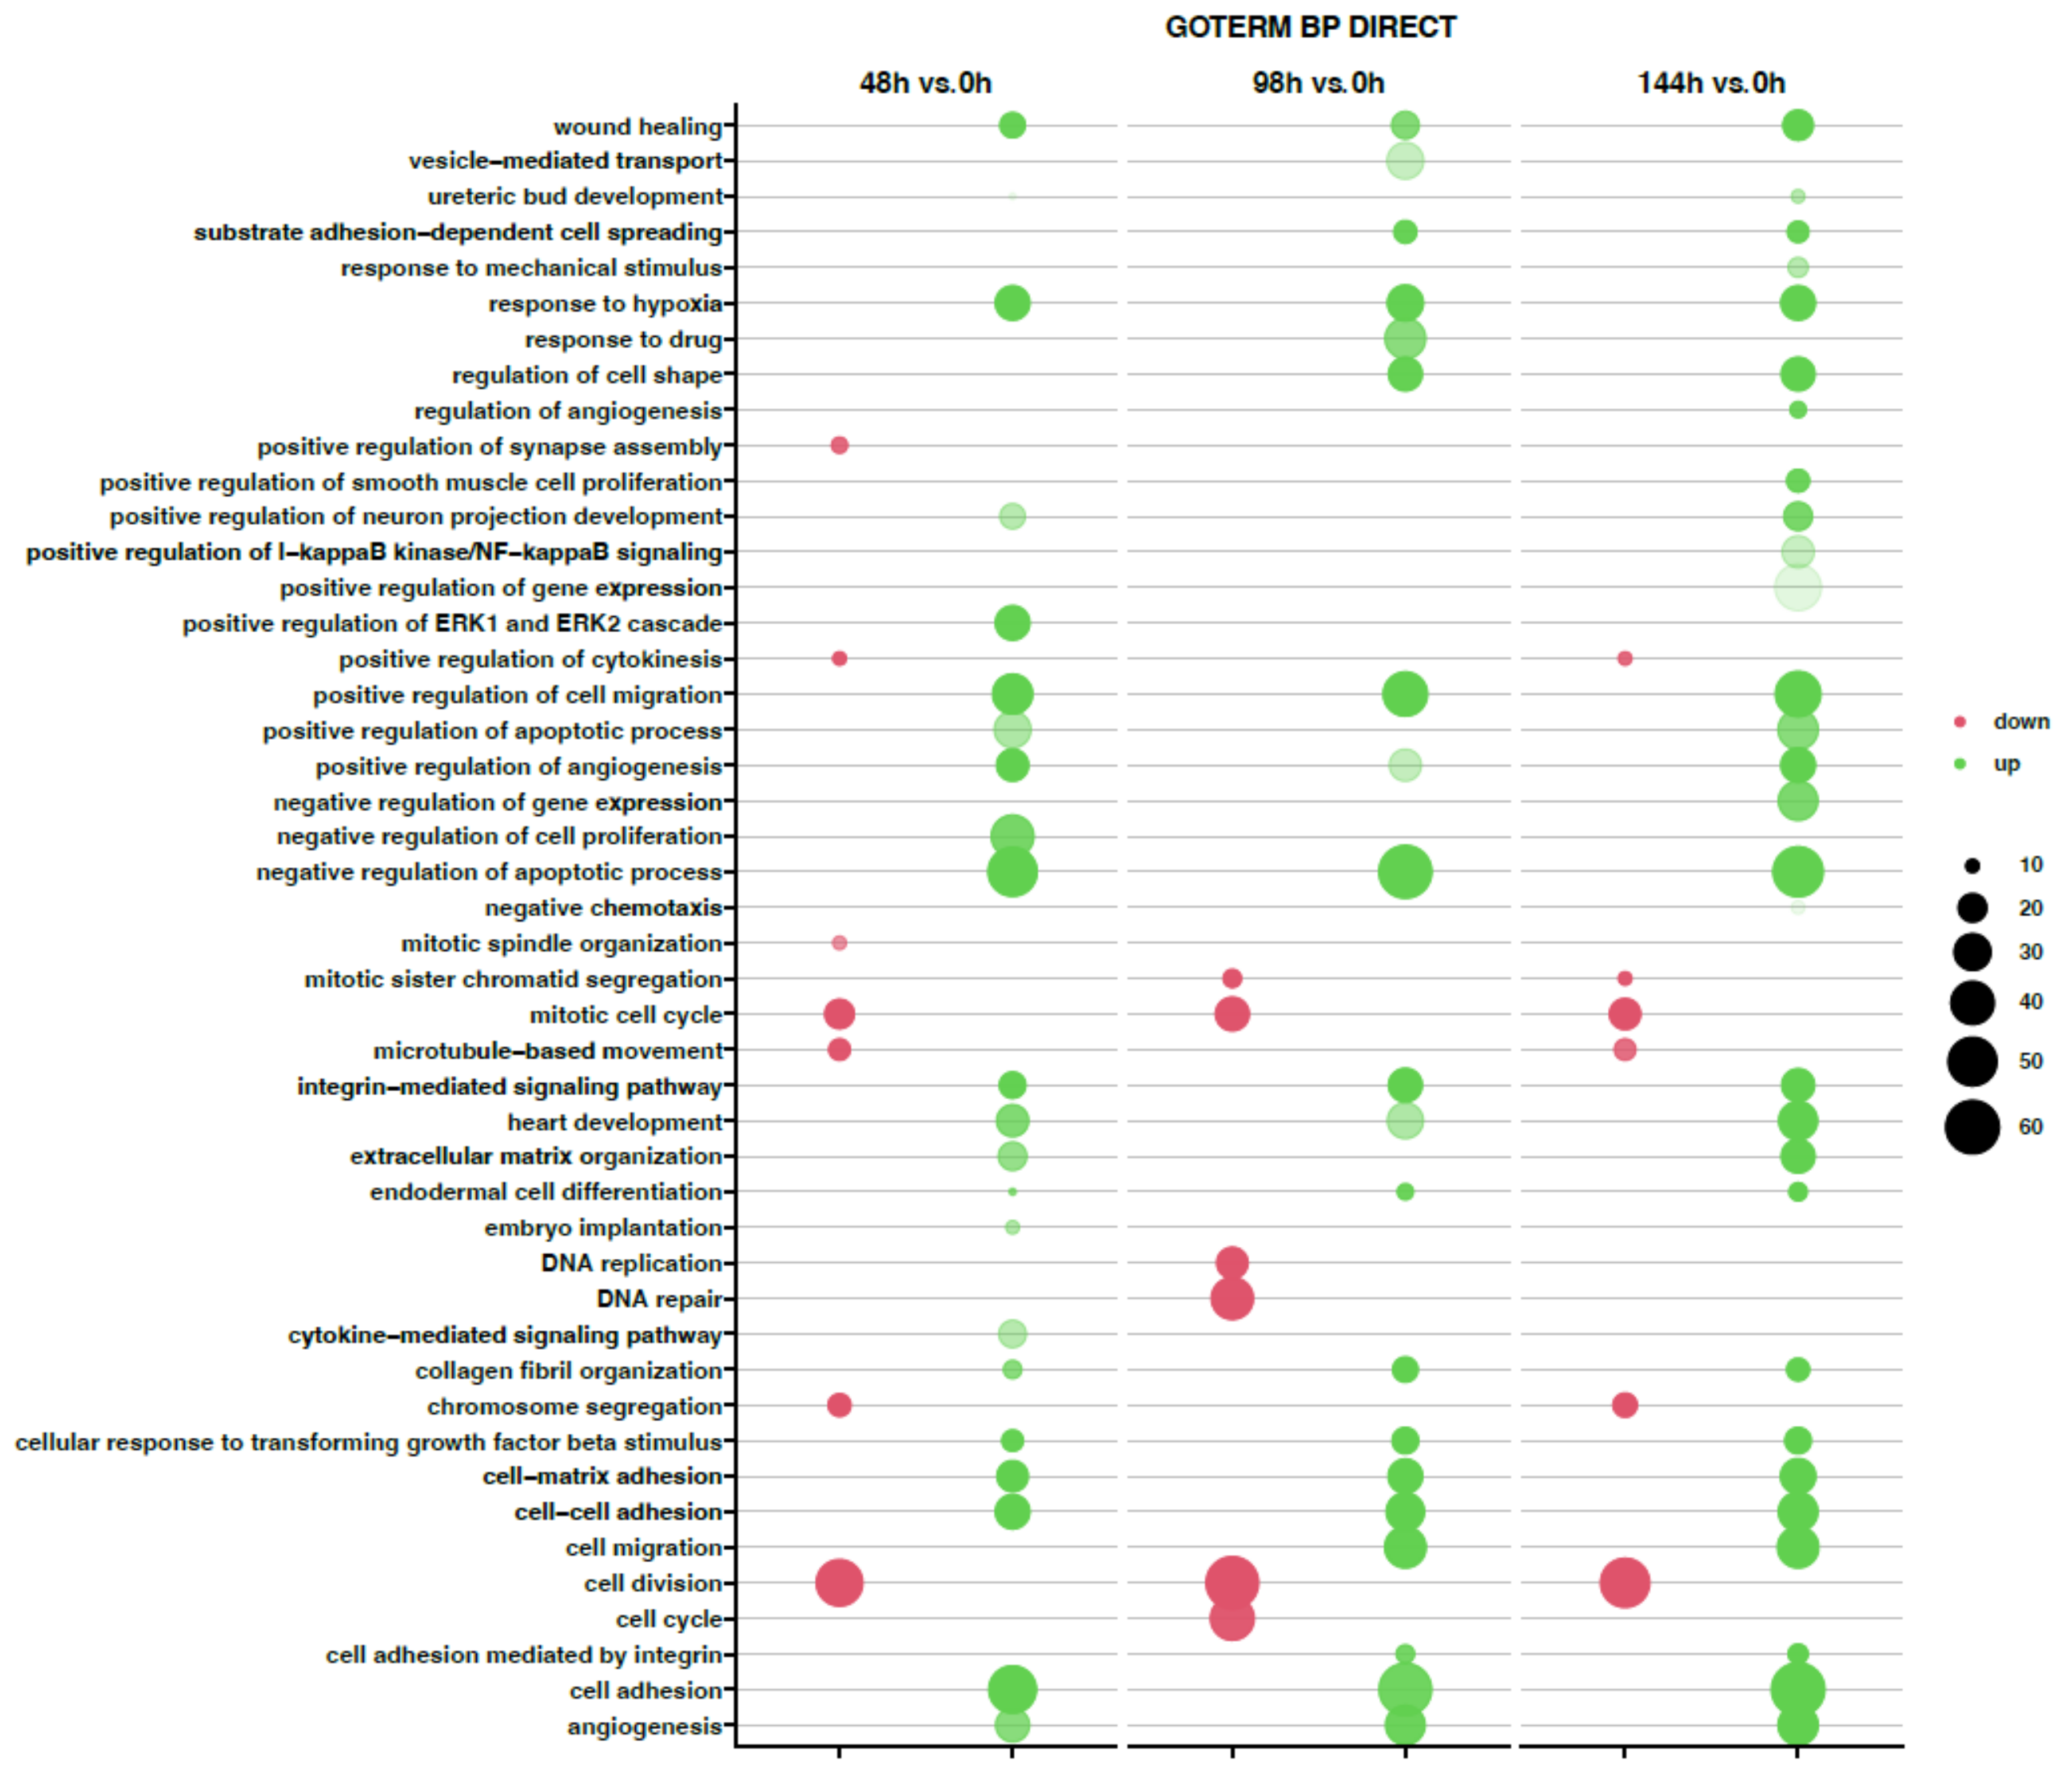
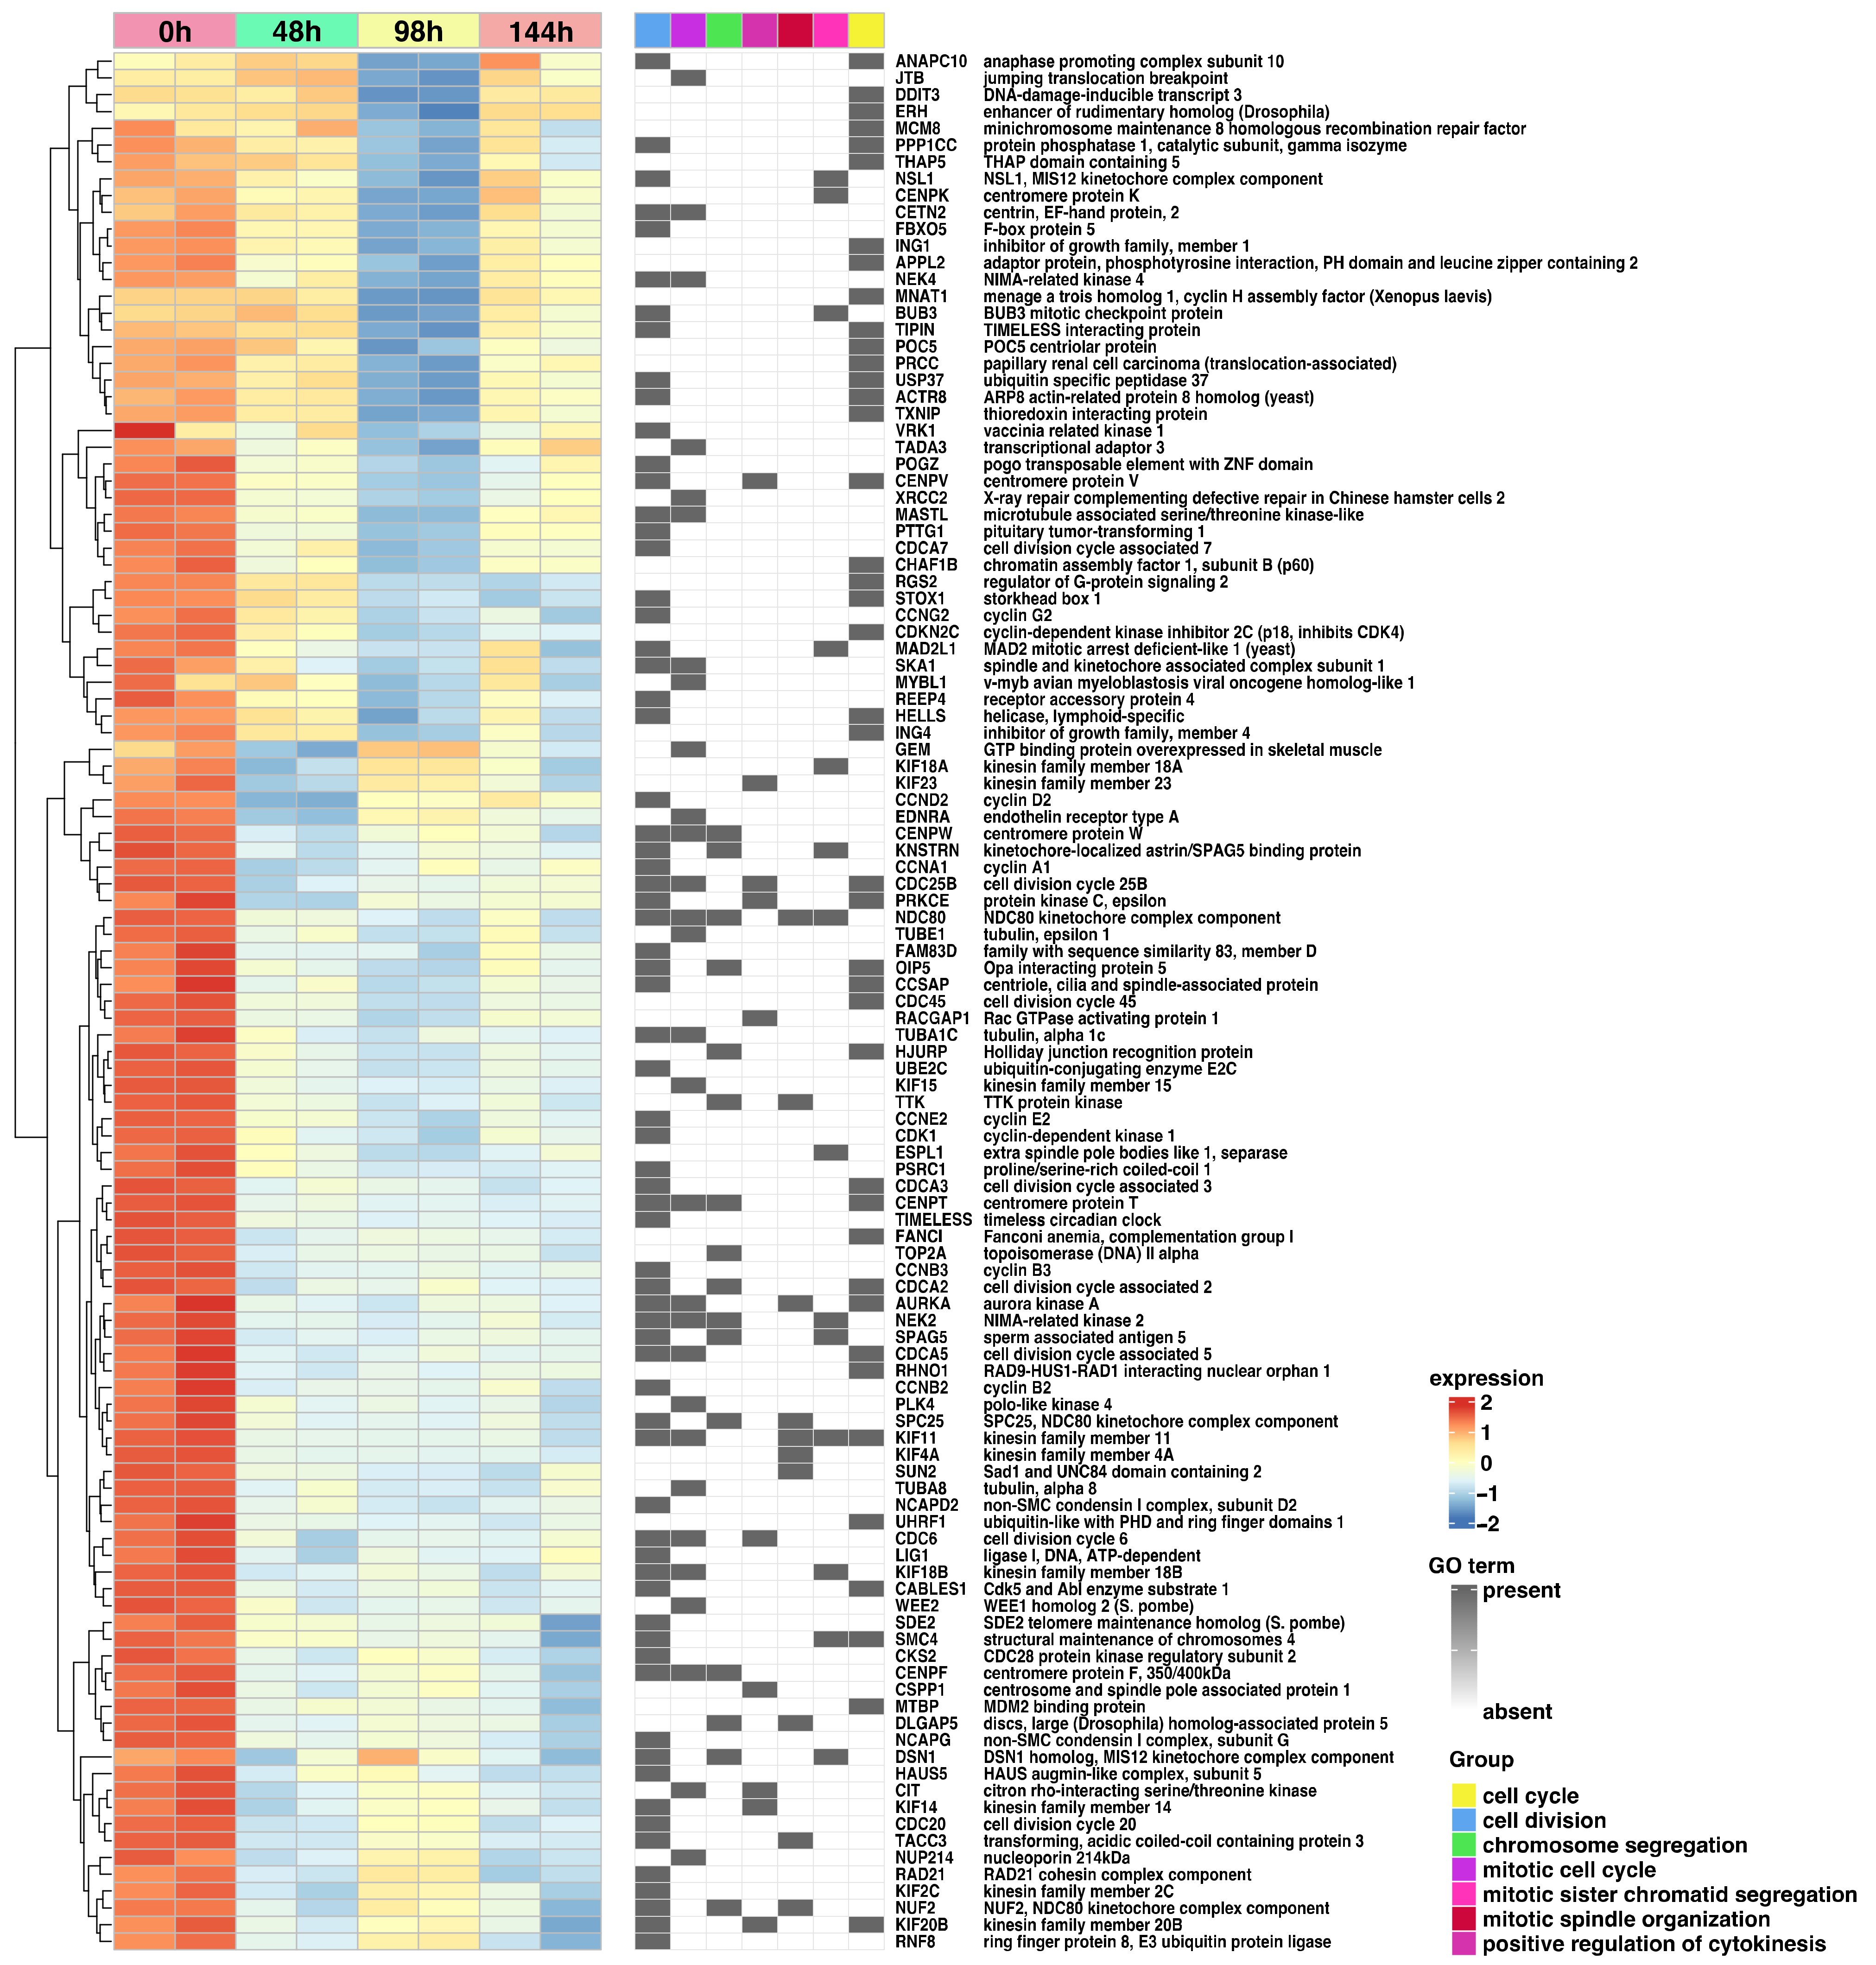
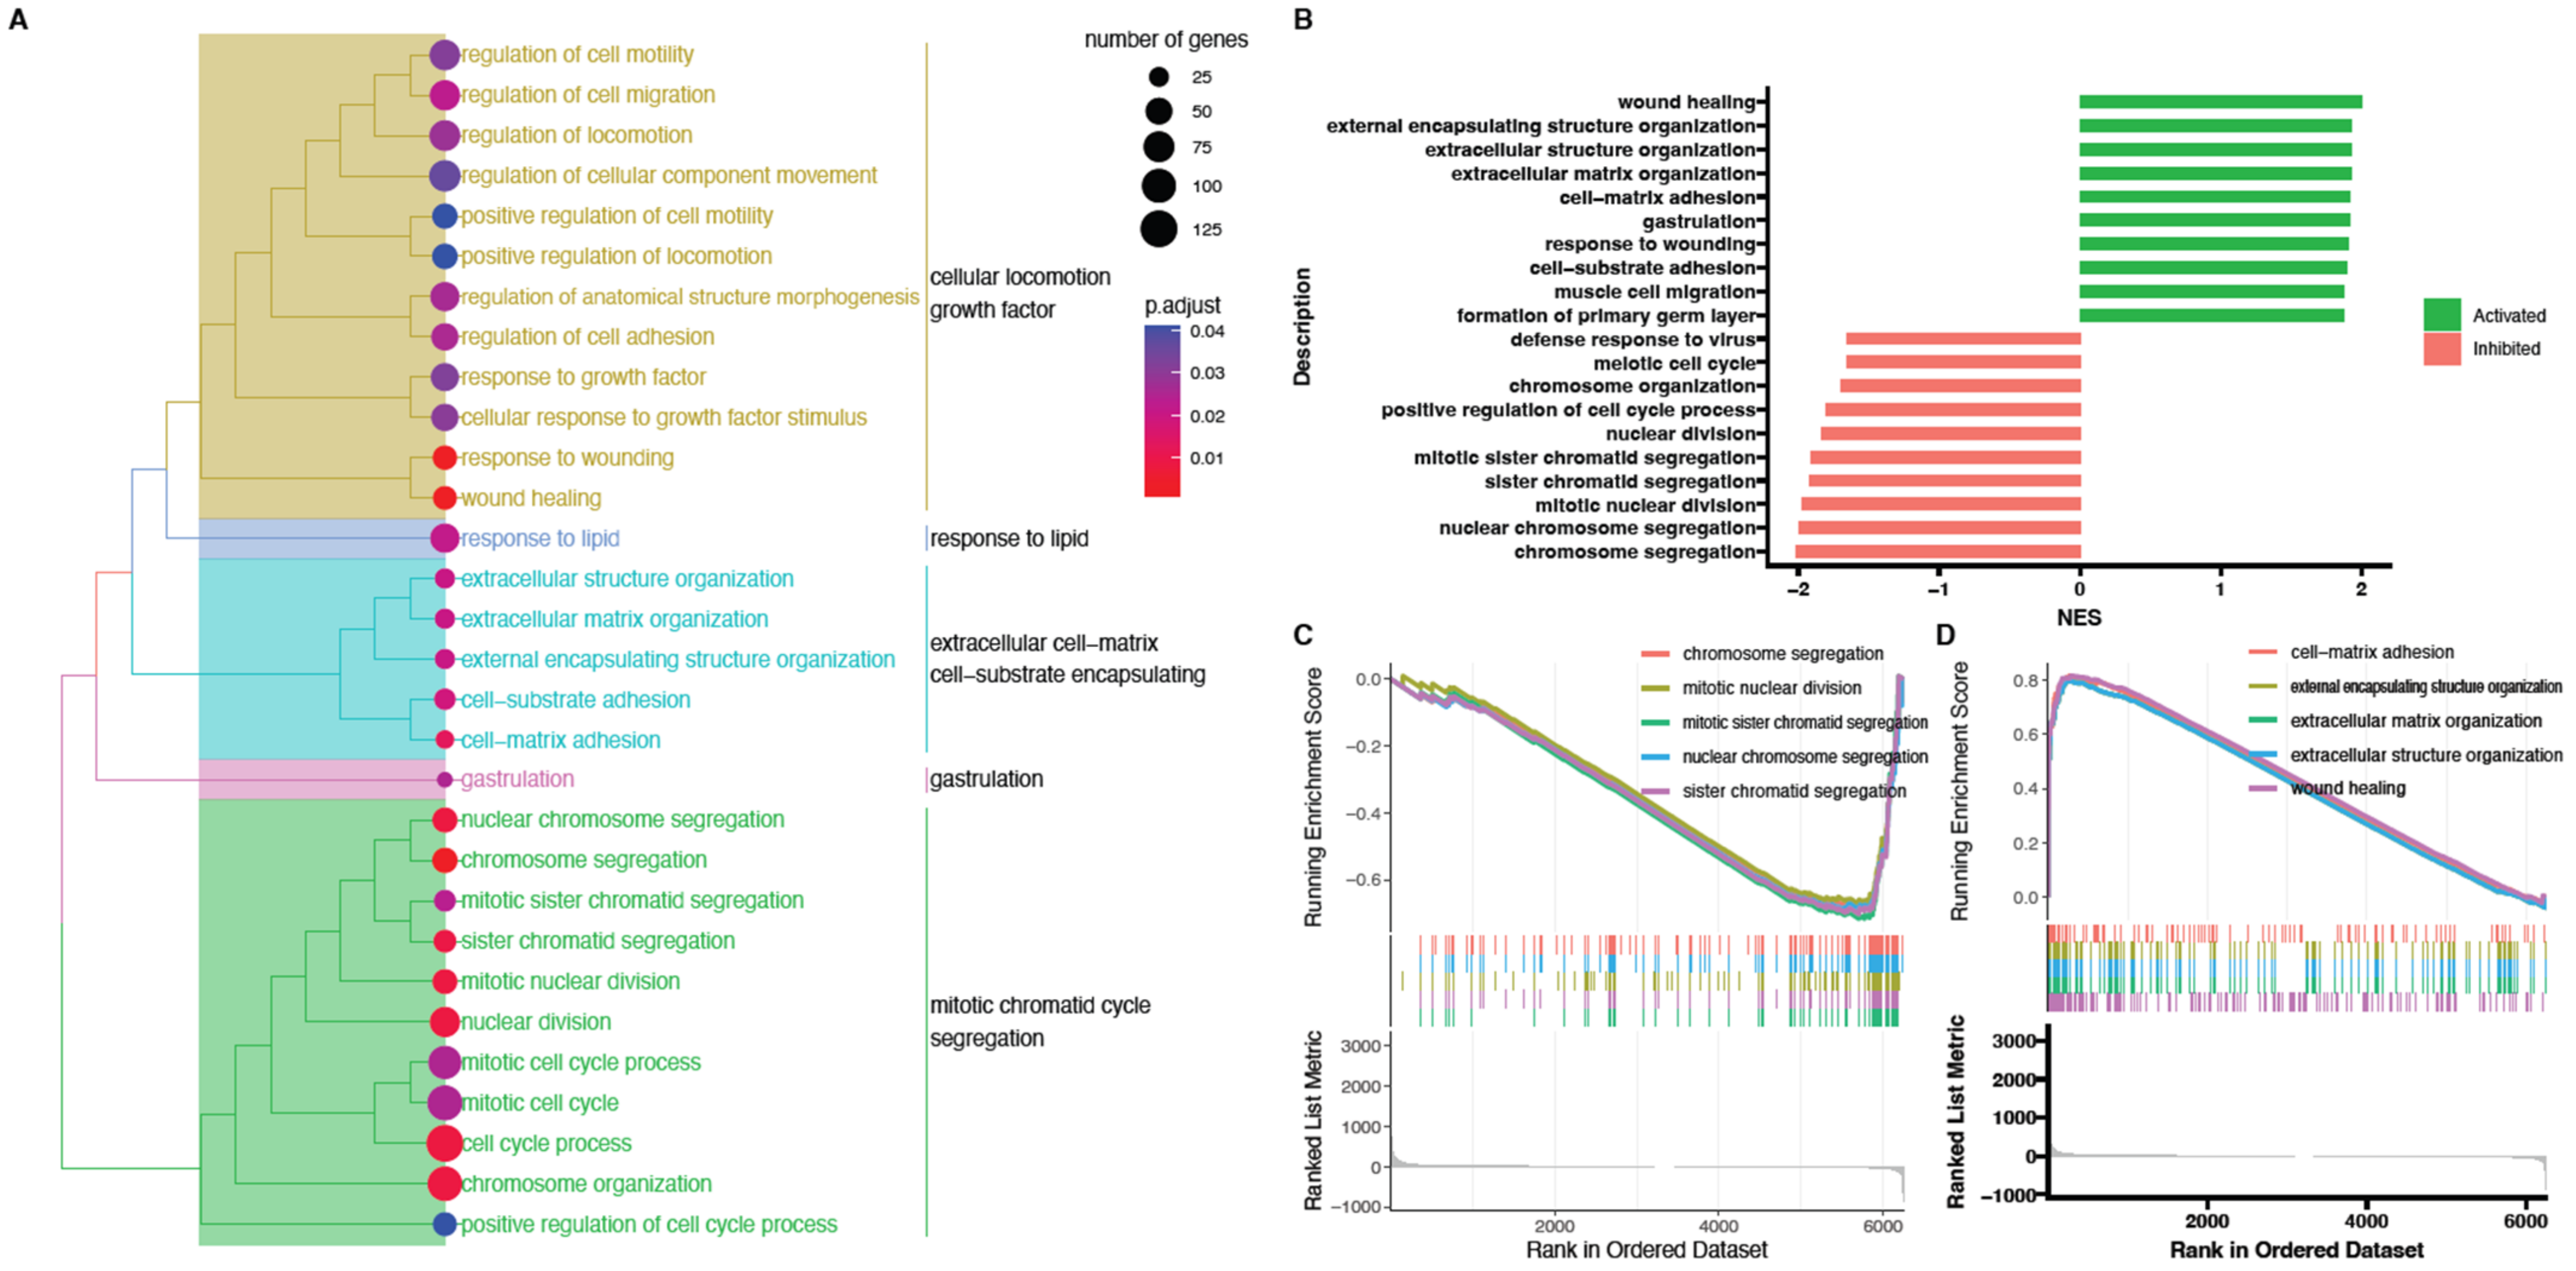
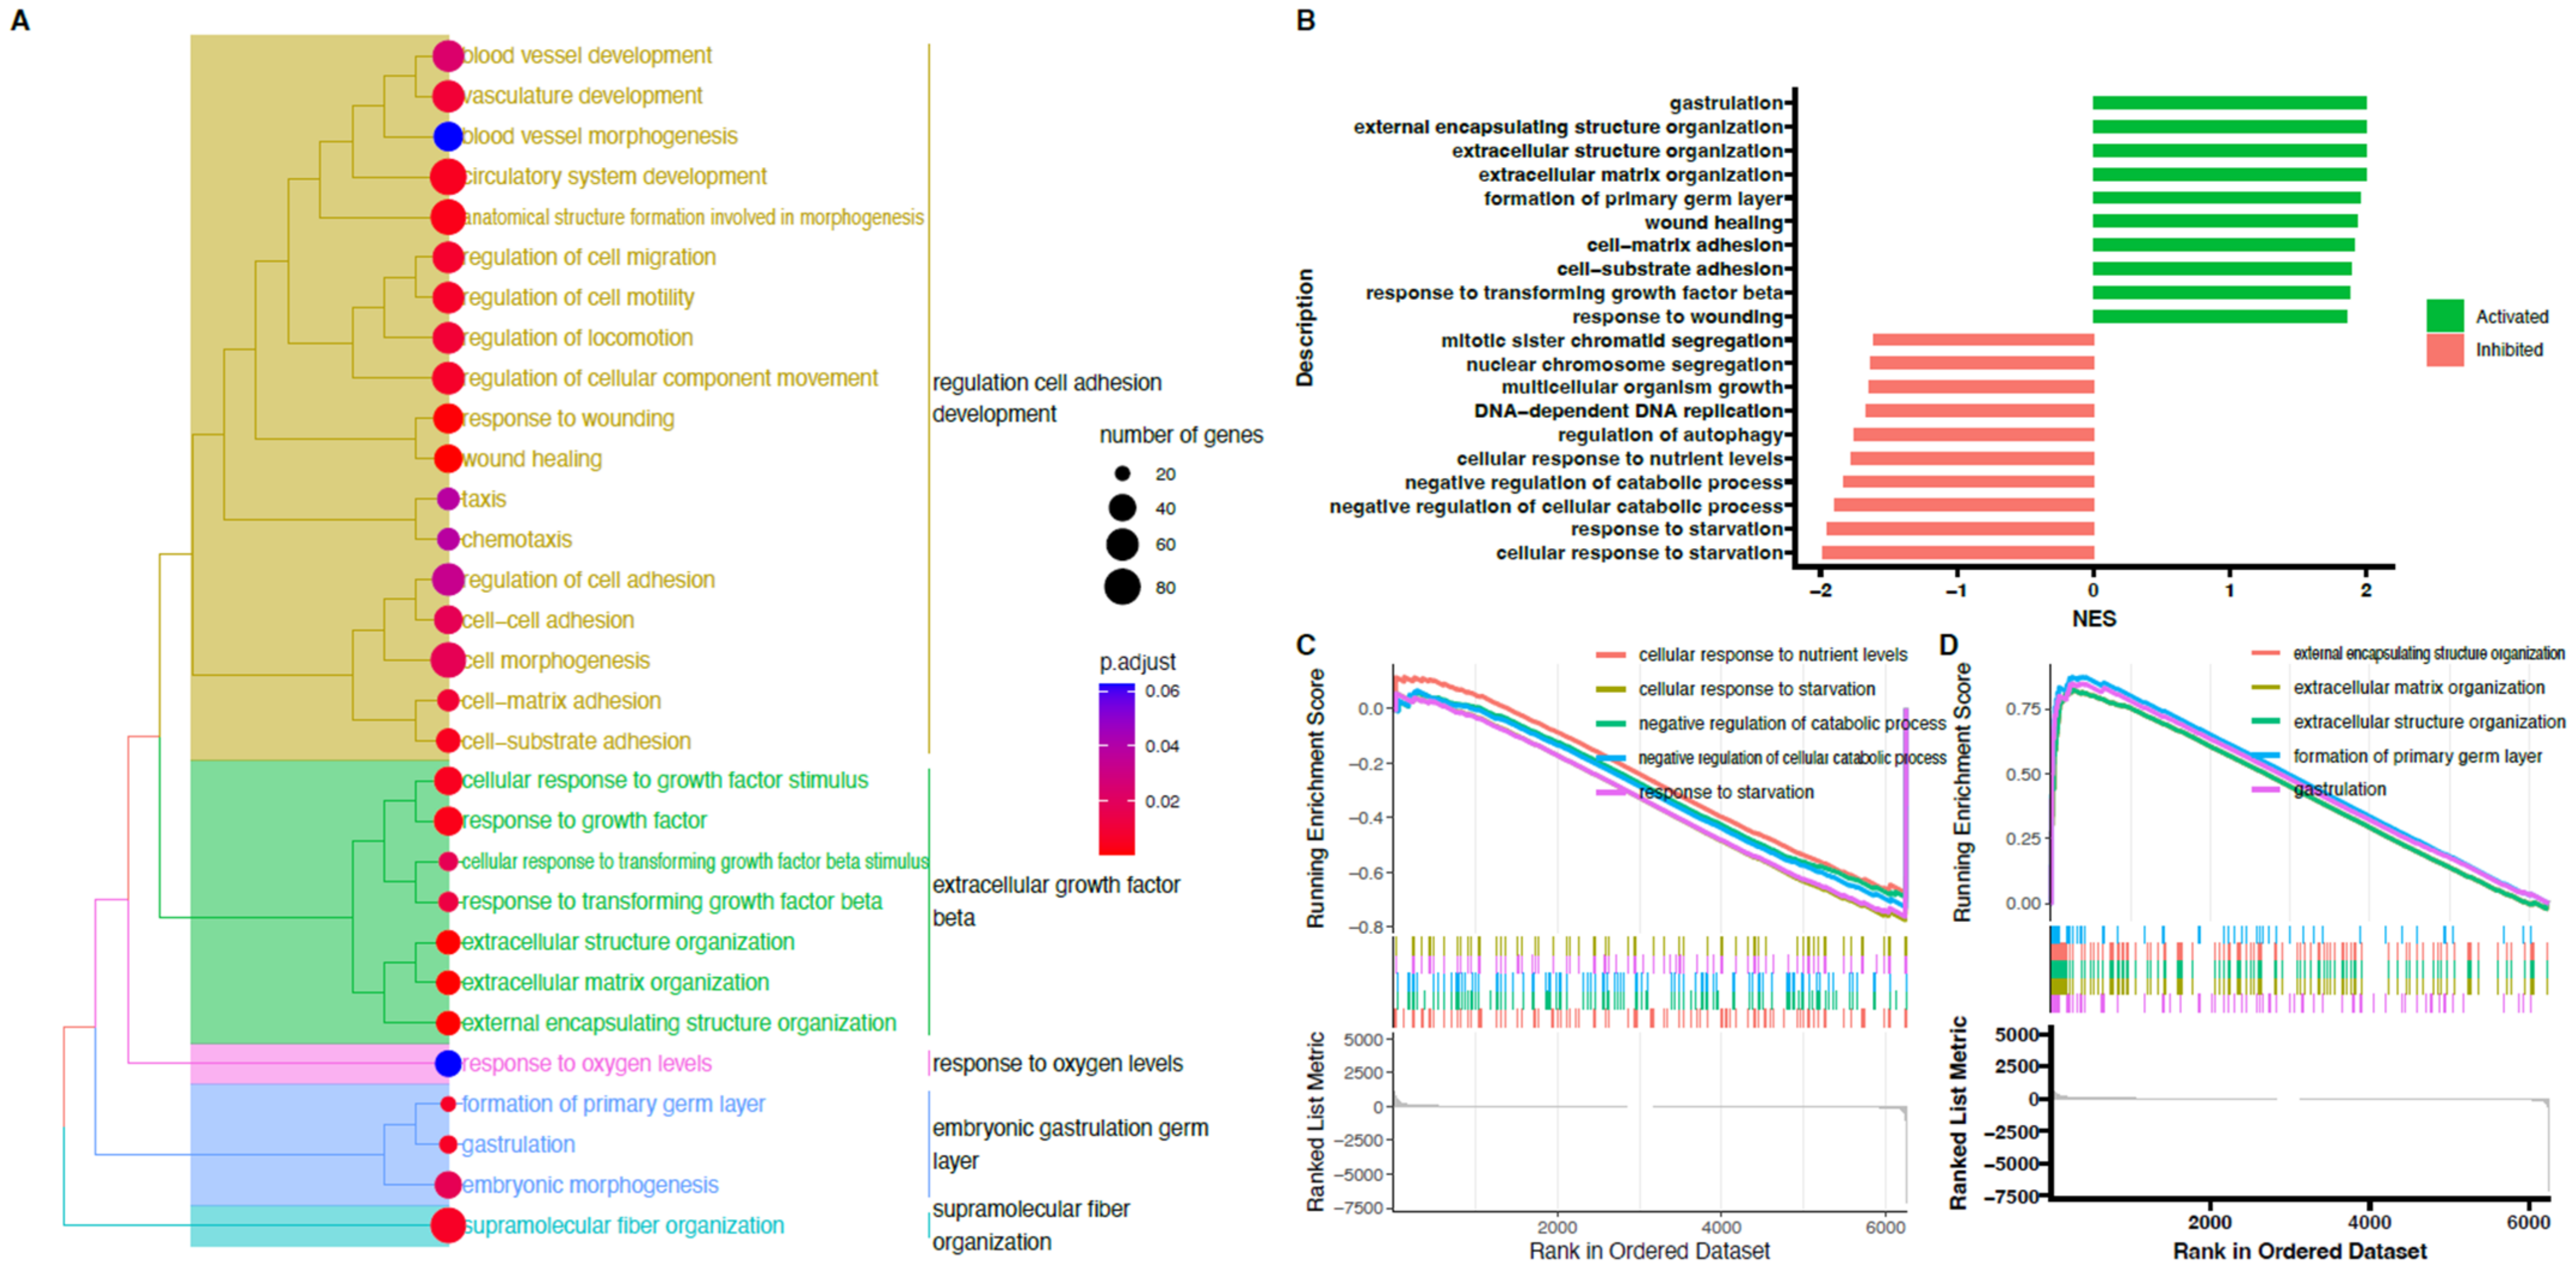
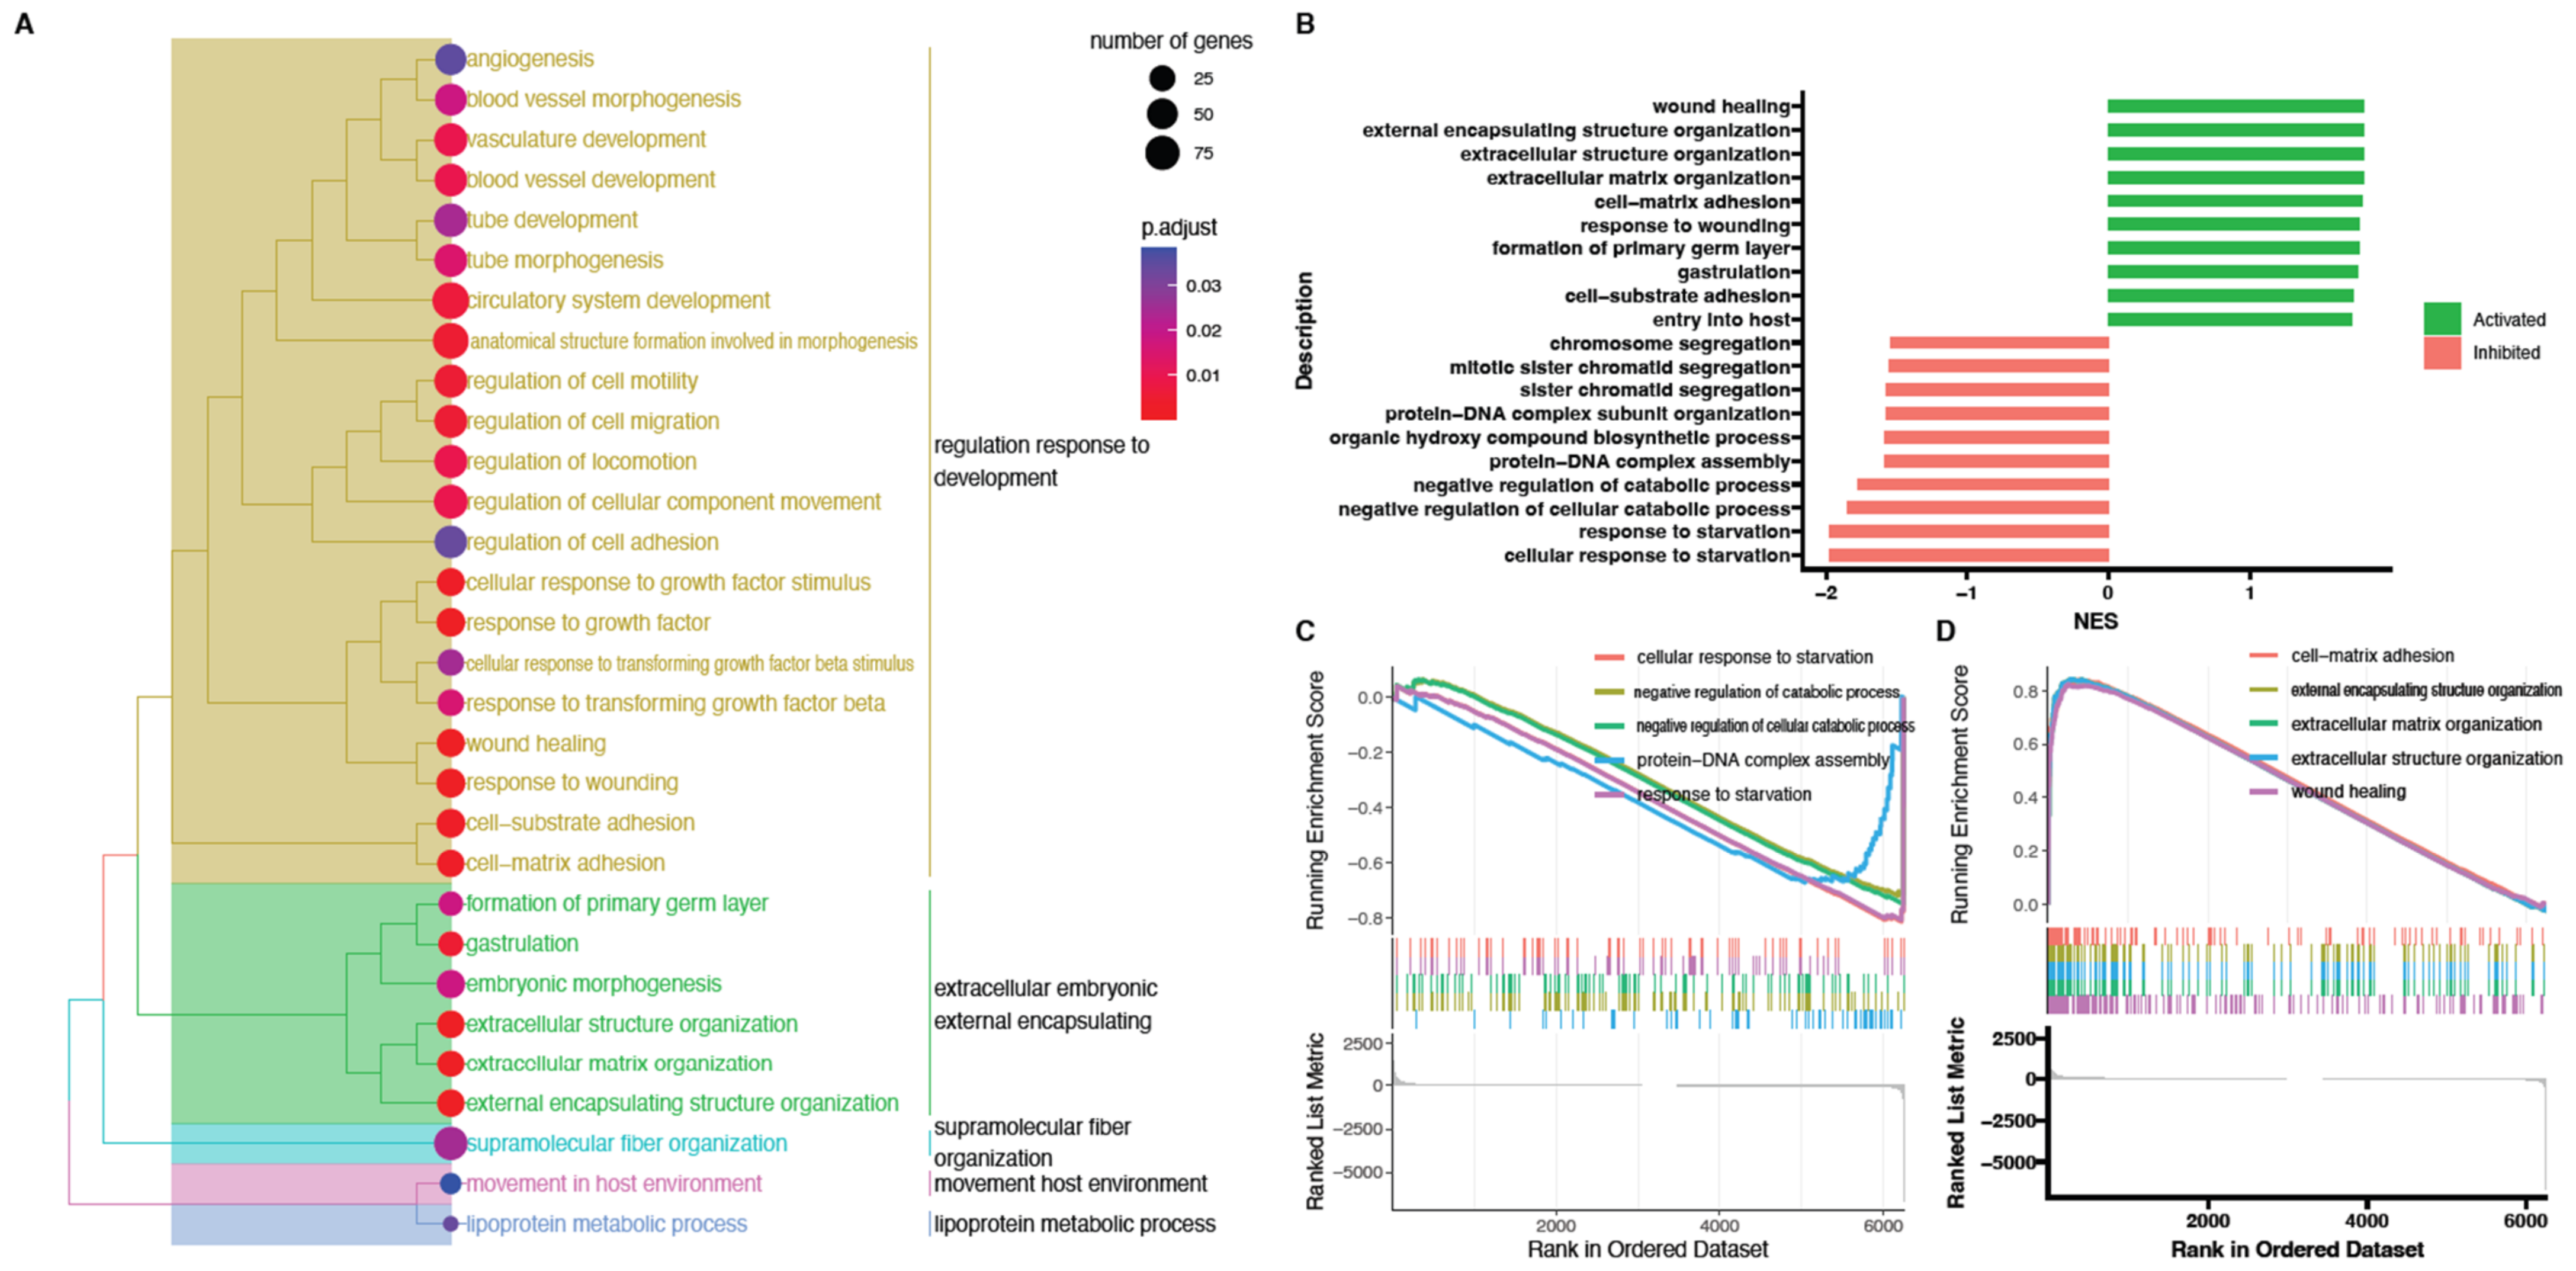
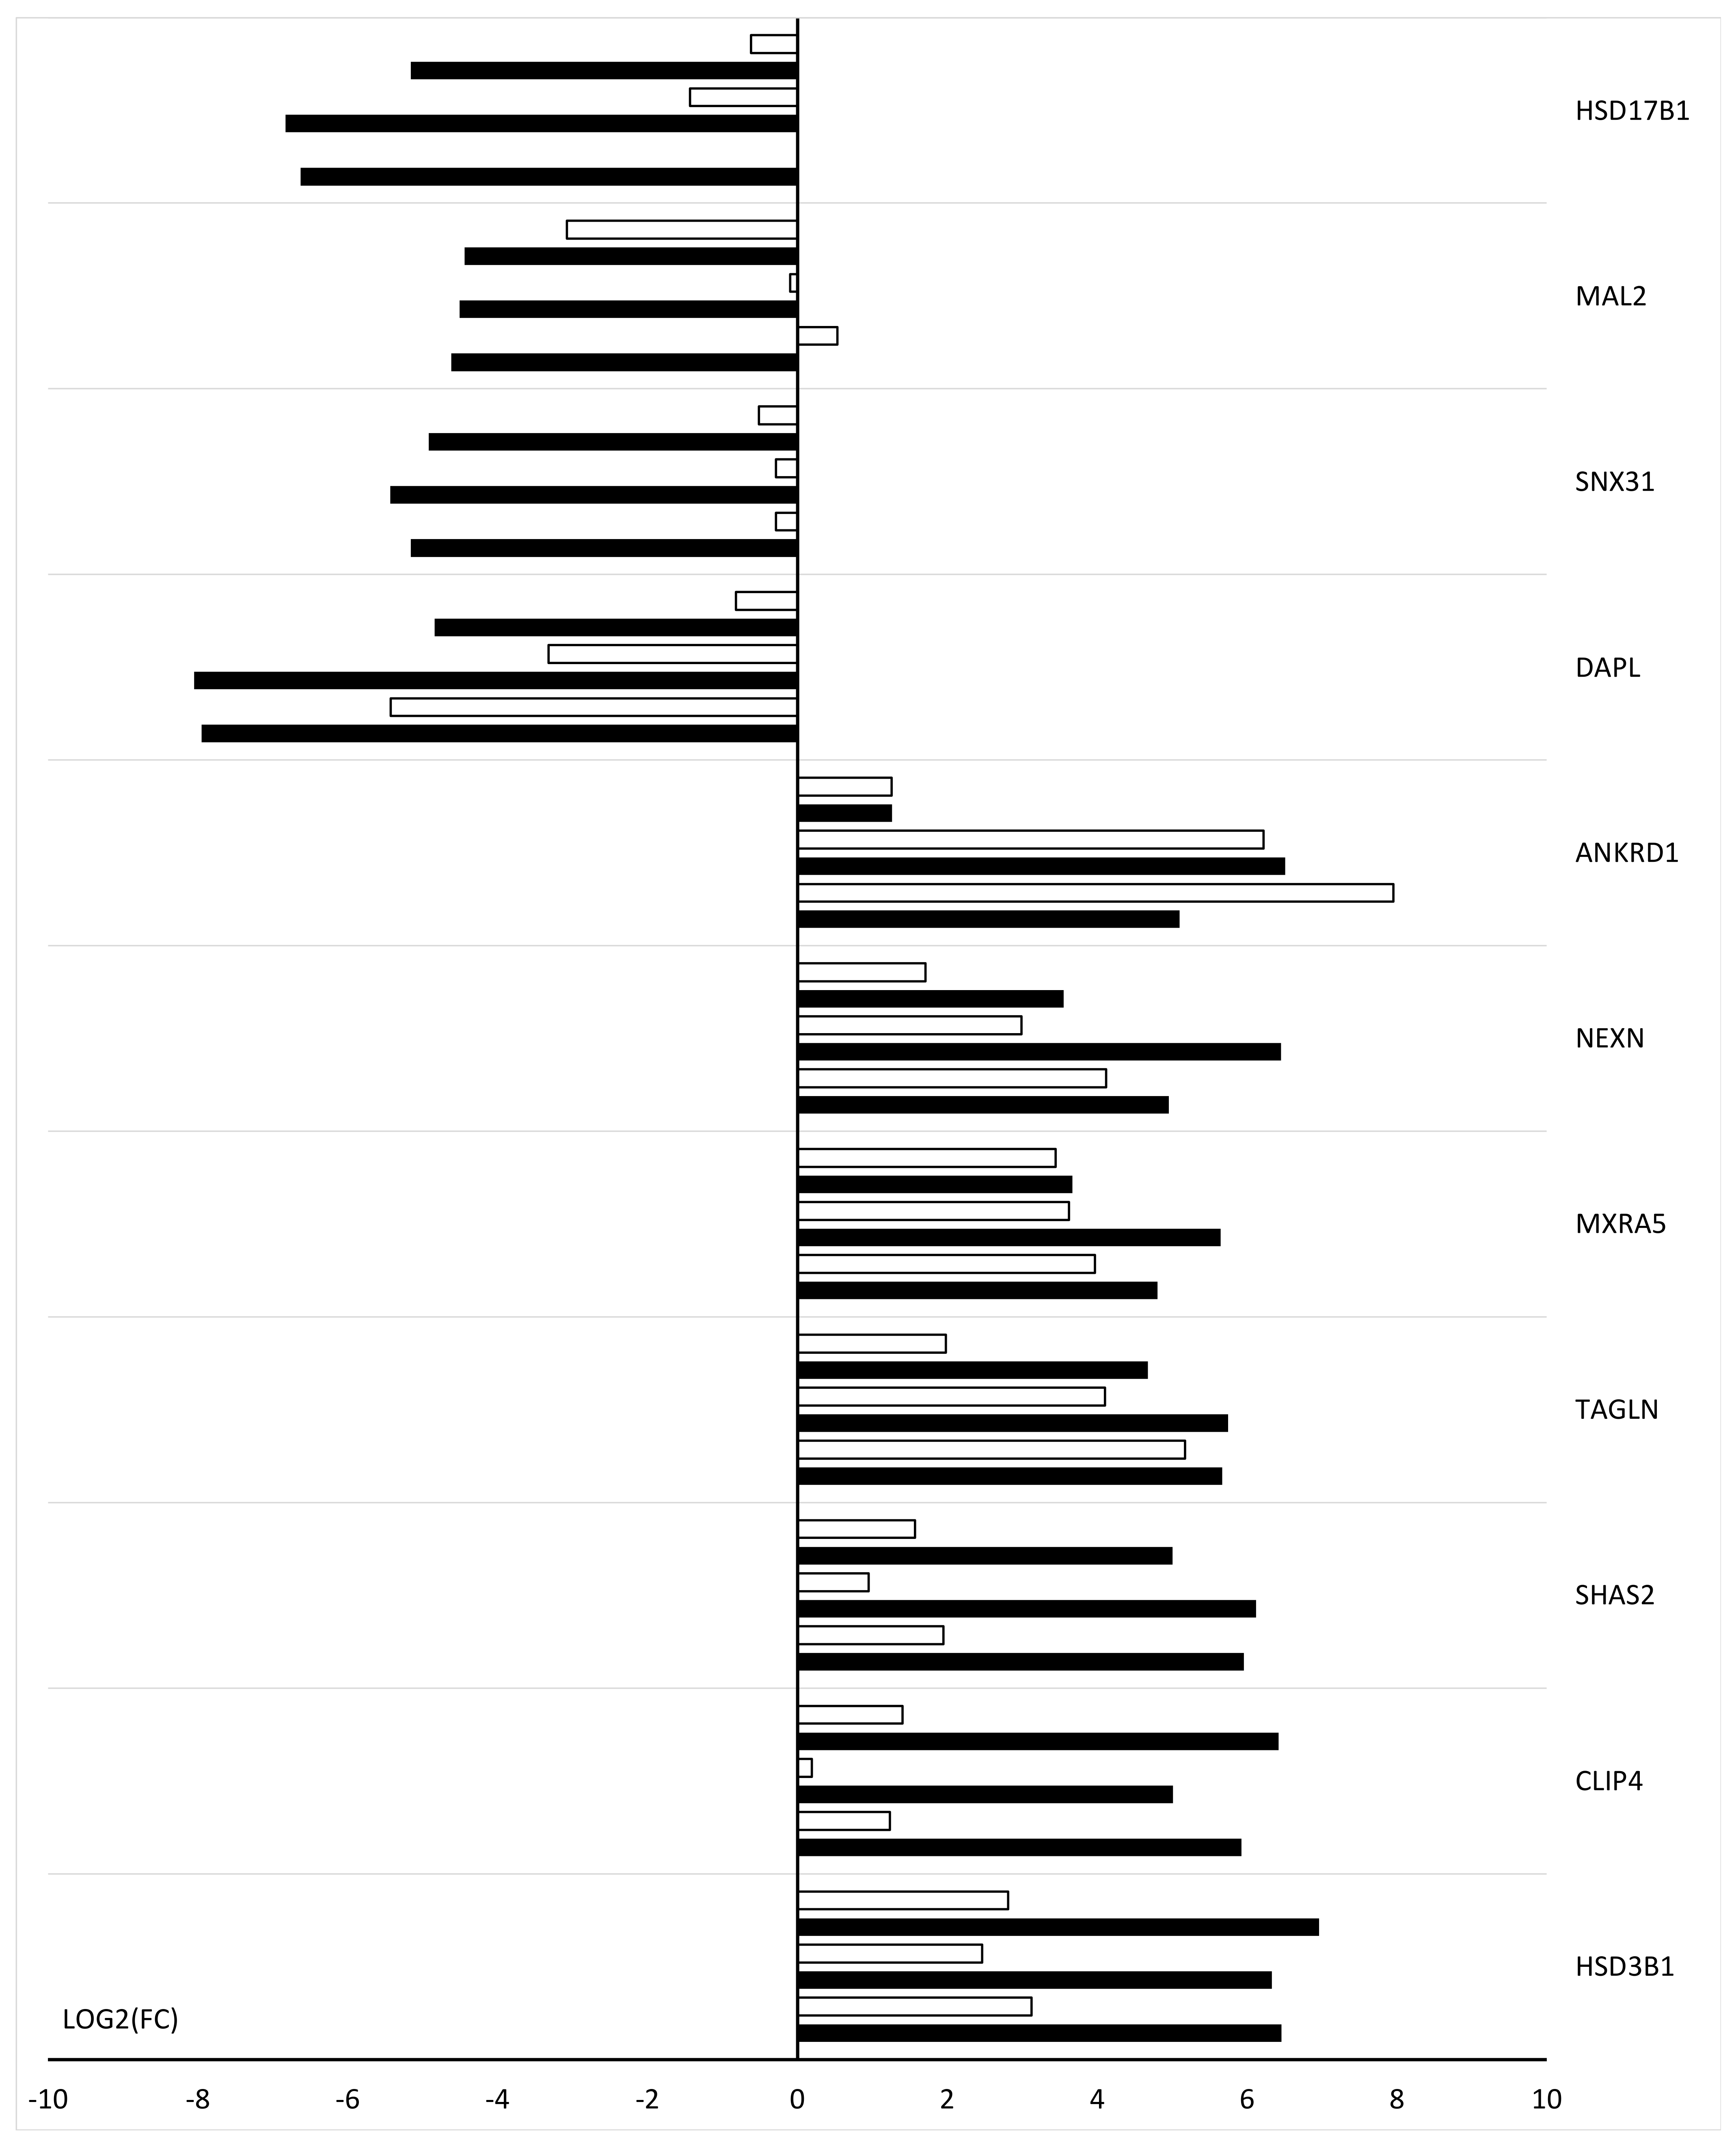
2. Results
3. Discussion
4. Materials and Methods
4.1. Animals
4.2. Collection of Porcine Ovarian Granulosa Cells
4.3. In Vitro Primary Culture of Porcine Granulosa Cells
4.4. Microarray Expression Analysis and Statistics
4.5. Real-Time Quantitative Polymerase Chain Reaction (RT-qPCR) Analysis
5. Conclusions
Author Contributions
Funding
Institutional Review Board Statement
Informed Consent Statement
Data Availability Statement
Conflicts of Interest
References
- Cecconi, S.; Ciccarelli, C.; Barberi, M.; Macchiarelli, G.; Canipari, R. Granulosa Cell-Oocyte Interactions. Eur. J. Obstet. Gynecol. Reprod. Biol. 2004, 115 (Suppl 1), S19–S22. [Google Scholar] [CrossRef]
- Turathum, B.; Gao, E.M.; Chian, R.C. The Function of Cumulus Cells in Oocyte Growth and Maturation and in Subsequent Ovulation and Fertilization. Cells 2021, 10, 2292. [Google Scholar] [CrossRef]
- Kidder, G.M.; Mhawi, A.A. Gap Junctions and Ovarian Folliculogenesis. Reproduction 2002, 123, 613–620. [Google Scholar] [CrossRef] [PubMed]
- Strączyńska, P.; Papis, K.; Morawiec, E.; Czerwiński, M.; Gajewski, Z.; Olejek, A.; Bednarska-Czerwińska, A. Signaling Mechanisms and Their Regulation during in Vivo or in Vitro Maturation of Mammalian Oocytes. Reprod. Biol. Endocrinol. 2022, 20, 37. [Google Scholar] [CrossRef] [PubMed]
- Robker, R.L.; Richards, J.S. Hormone-Induced Proliferation and Differentiation of Granulosa Cells: A Coordinated Balance of the Cell Cycle Regulators Cyclin D2 and P27Kip1. Mol. Endocrinol. 1998, 12, 924–940. [Google Scholar] [CrossRef] [PubMed]
- Wang, J.; Chu, K.; Wang, Y.; Li, J.; Fu, J.; Zeng, Y.A.; Li, W. Procr-Expressing Granulosa Cells Are Highly Proliferative and Are Important for Follicle Development. iScience 2021, 24, 102065. [Google Scholar] [CrossRef] [PubMed]
- Pan, B.; Liu, C.; Zhan, X.; Li, J. Protegrin-1 Regulates Porcine Granulosa Cell Proliferation via the EGFR-ERK1/2/P38 Signaling Pathway in Vitro. Front. Physiol. 2021, 12, 733. [Google Scholar] [CrossRef] [PubMed]
- Kranc, W.; Brązert, M.; Budna, J.; Celichowski, P.; Bryja, A.; Nawrocki, M.J.; Ożegowska, K.; Jankowski, M.; Chermuła, B.; Dyszkiewicz-Konwińska, M.; et al. Genes Responsible for Proliferation, Differentiation, and Junction Adhesion Are Significantly up-Regulated in Human Ovarian Granulosa Cells during a Long-Term Primary in Vitro Culture. Histochem. Cell Biol. 2019, 151, 125–143. [Google Scholar] [CrossRef] [PubMed]
- Kulus, J.; Kulus, M.; Kranc, W.; Jopek, K.; Zdun, M.; Józkowiak, M.; Jáskowski, J.M.; Piotrowska-Kempisty, H.; Bukowska, D.; Antosik, P.; et al. Transcriptomic Profile of New Gene Markers Encoding Proteins Responsible for Structure of Porcine Ovarian Granulosa Cells. Biology 2021, 10, 1214. [Google Scholar] [CrossRef]
- Bader, G.D.; Hogue, C.W.V. An Automated Method for Finding Molecular Complexes in Large Protein Interaction Networks. BMC Bioinform. 2003, 4, 2. [Google Scholar] [CrossRef]
- Jiang, X.; Qin, Y.; Kun, L.; Zhou, Y. The Significant Role of the Microfilament System in Tumors. Front. Oncol. 2021, 11, 333. [Google Scholar] [CrossRef]
- McBeath, R.; Pirone, D.M.; Nelson, C.M.; Bhadriraju, K.; Chen, C.S. Cell Shape, Cytoskeletal Tension, and RhoA Regulate Stem Cell Lineage Commitment. Dev. Cell 2004, 6, 483–495. [Google Scholar] [CrossRef]
- Mathieu, M.; Martin-Jaular, L.; Lavieu, G.; Théry, C. Specificities of Secretion and Uptake of Exosomes and Other Extracellular Vesicles for Cell-to-Cell Communication. Nat. Cell Biol. 2019, 21, 9–17. [Google Scholar] [CrossRef]
- Shen, Y.; You, Y.; Zhu, K.; Fang, C.; Chang, D.; Yu, X. Exosomes in the f Ield of Reproduction: A Scientometric Study and Visualization Analysis. Front. Pharmacol. 2022, 13, 1001652. [Google Scholar] [CrossRef] [PubMed]
- Muñoz, E.L.; Fuentes, F.B.; Felmer, R.N.; Yeste, M.; Arias, M.E. Extracellular Vesicles in Mammalian Reproduction: A Review. Zygote 2022, 30, 440–463. [Google Scholar] [CrossRef]
- de ávila, A.C.F.C.M.; Andrade, G.M.; Bridi, A.; Gimenes, L.U.; Meirelles, F.V.; Perecin, F.; da Silveira, J.C. Extracellular Vesicles and Its Advances in Female Reproduction. Anim. Reprod. 2020, 16, 31–38. [Google Scholar] [CrossRef] [PubMed]
- Llobat, L. Extracellular Vesicles and Domestic Animal Reproduction. Res. Vet. Sci. 2021, 136, 166–173. [Google Scholar] [CrossRef] [PubMed]
- Lan, Y.; Jin, Q.; Xie, H.; Yan, C.; Ye, Y.; Zhao, X.; Chen, Z.; Xie, Z. Exosomes Enhance Adhesion and Osteogenic Differentiation of Initial Bone Marrow Stem Cells on Titanium Surfaces. Front. Cell Dev. Biol. 2020, 8, 1216. [Google Scholar] [CrossRef]
- Sung, B.H.; Parent, C.A.; Weaver, A.M. Extracellular Vesicles: Critical Players during Cell Migration. Dev. Cell 2021, 56, 1861–1874. [Google Scholar] [CrossRef]
- Miller, C.M.; Enninga, E.A.L.; Rizzo, S.A.; Phillipps, J.; Guerrero-Cazares, H.; Destephano, C.C.; Peterson, T.E.; Stalboerger, P.G.; Behfar, A.; Khan, Z. Platelet-Derived Exosomes Induce Cell Proliferation and Wound Healing in Human Endometrial Cells. Regen. Med. 2022, 17, 805–817. [Google Scholar] [CrossRef]
- Jiang, H.; Zhao, H.; Zhang, M.; He, Y.; Li, X.; Xu, Y.; Liu, X. Hypoxia Induced Changes of Exosome Cargo and Subsequent Biological Effects. Front. Immunol. 2022, 13, 1140. [Google Scholar] [CrossRef]
- Karampoga, A.; Tzaferi, K.; Koutsakis, C.; Kyriakopoulou, K.; Karamanos, N.K. Exosomes and the Extracellular Matrix: A Dynamic Interplay in Cancer Progression. Int. J. Dev. Biol. 2022, 66, 97–102. [Google Scholar] [CrossRef] [PubMed]
- Walma, D.A.C.; Yamada, K.M. The Extracellular Matrix in Development. Development 2020, 147, 175596. [Google Scholar] [CrossRef]
- Mecham, R.P. Overview of Extracellular Matrix. Curr. Protoc. Cell Biol. 2012, 57, 10.1.1–10.1.16. [Google Scholar] [CrossRef]
- Jones, M.C.; Zha, J.; Humphries, M.J. Connections between the Cell Cycle, Cell Adhesion and the Cytoskeleton. Philos. Trans. R. Soc. Lond. B Biol. Sci. 2019, 374, 20180227. [Google Scholar] [CrossRef] [PubMed]
- Forth, S.; Kapoor, T.M. The Mechanics of Microtubule Networks in Cell Division. J. Cell Biol. 2017, 216, 1525–1531. [Google Scholar] [CrossRef]
- Sanghvi-Shah, R.; Weber, G.F. Intermediate Filaments at the Junction of Mechanotransduction, Migration, and Development. Front. Cell Dev. Biol. 2017, 5, 81. [Google Scholar] [CrossRef]
- Kamranvar, S.A.; Rani, B.; Johansson, S. Cell Cycle Regulation by Integrin-Mediated Adhesion. Cells 2022, 11, 2521. [Google Scholar] [CrossRef]
- Baruah, J.; Wary, K.K. Exosomes in the Regulation of Vascular Endothelial Cell Regeneration. Front. Cell Dev. Biol. 2020, 7, 353. [Google Scholar] [CrossRef] [PubMed]
- Moncrieff, L.; Mozdziak, P.; Jeseta, M.; Machatkova, M.; Kranc, W.; Kempisty, B. Ovarian Follicular Cells—Living in the Shadow of Stemness Cellular Competence. Med. J. Cell Biol. 2019, 7, 134–140. [Google Scholar] [CrossRef]
- Stefańska, K.; Sibiak, R.; Hutchings, G.; Dompe, C.; Moncrieff, L.; Janowicz, K.; Jeseta, M.; Kempisty, B.; Machatkova, M.; Mozdziak, P. Evidence for Existence of Molecular Stemness Markers in Porcine Ovarian Follicular Granulosa Cells. Med. J. Cell Biol. 2019, 7, 183–188. [Google Scholar] [CrossRef]
- Hade, M.D.; Suire, C.N.; Suo, Z. Mesenchymal Stem Cell-Derived Exosomes: Applications in Regenerative Medicine. Cells 2021, 10, 1959. [Google Scholar] [CrossRef] [PubMed]
- Sergé, A. The Molecular Architecture of Cell Adhesion: Dynamic Remodeling Revealed by Videonanoscopy. Front. Cell Dev. Biol. 2016, 4, 36. [Google Scholar] [CrossRef] [PubMed]
- Martínez-Moro, Á.; González-Brusi, L.; Lamas-Toranzo, I.; O’callaghan, E.; Esteve-Codina, A.; Lonergan, P.; Bermejo-Álvarez, P. RNA-Sequencing Reveals Genes Linked with Oocyte Developmental Potential in Bovine Cumulus Cells. Mol. Reprod. Dev. 2022, 89, 399–412. [Google Scholar] [CrossRef]
- Dinh, D.T.; Breen, J.; Akison, L.K.; DeMayo, F.J.; Brown, H.M.; Robker, R.L.; Russell, D.L. Tissue-Specific Progesterone Receptor-Chromatin Binding and the Regulation of Progesterone-Dependent Gene Expression. Sci. Rep. 2019, 9, 11966. [Google Scholar] [CrossRef]
- Gurung, S.; Perocheau, D.; Touramanidou, L.; Baruteau, J. The Exosome Journey: From Biogenesis to Uptake and Intracellular Signalling. Cell Commun. Signal. 2021, 19, 47. [Google Scholar] [CrossRef]
- Lenzini, S.; Bargi, R.; Chung, G.; Shin, J.W. Matrix Mechanics and Water Permeation Regulate Extracellular Vesicle Transport. Nat. Nanotechnol. 2020, 15, 217–223. [Google Scholar] [CrossRef]
- Prada, I.; Meldolesi, J. Binding and Fusion of Extracellular Vesicles to the Plasma Membrane of Their Cell Targets. Int. J. Mol. Sci. 2016, 17, 1296. [Google Scholar] [CrossRef]
- Mulcahy, L.A.; Pink, R.C.; Carter, D.R.F. Routes and Mechanisms of Extracellular Vesicle Uptake. J. Extracell. Vesicles 2014, 3, 1–14. [Google Scholar] [CrossRef]
- Guan, S.; Li, Q.; Liu, P.; Xuan, X.; Du, Y. Experimental Immunology Umbilical Cord Blood-Derived Dendritic Cells Loaded with BGC823 Tumor Antigens and DC-Derived Exosomes Stimulate Efficient Cytotoxic T-Lymphocyte Responses and Antitumor Immunity in Vitro and in Vivo. Cent. Eur. J. Immunol. 2014, 39, 142–151. [Google Scholar] [CrossRef]
- Kiss, A.L.; Botos, E. Endocytosis via Caveolae: Alternative Pathway with Distinct Cellular Compartments to Avoid Lysosomal Degradation? J. Cell. Mol. Med. 2009, 13, 1228–1237. [Google Scholar] [CrossRef]
- Svensson, K.J.; Christianson, H.C.; Wittrup, A.; Bourseau-Guilmain, E.; Lindqvist, E.; Svensson, L.M.; Mörgelin, M.; Belting, M. Exosome Uptake Depends on ERK1/2-Heat Shock Protein 27 Signaling and Lipid Raft-Mediated Endocytosis Negatively Regulated by Caveolin-1. J. Biol. Chem. 2013, 288, 17713. [Google Scholar] [CrossRef] [PubMed]
- Patel, N.J.; Ashraf, A.; Chung, E.J. Extracellular Vesicles as Regulators of the Extracellular Matrix. Bioengineering 2023, 10, 136. [Google Scholar] [CrossRef] [PubMed]
- Brigstock, D.R. Extracellular Vesicles in Organ Fibrosis: Mechanisms, Therapies, and Diagnostics. Cells 2021, 10, 1596. [Google Scholar] [CrossRef]
- Albacete-Albacete, L.; Navarro-Lérida, I.; López, J.A.; Martín-Padura, I.; Astudillo, A.M.; Ferrarini, A.; Van-Der-Heyden, M.; Balsinde, J.; Orend, G.; Vázquez, J.; et al. ECM Deposition Is Driven by Caveolin-1–Dependent Regulation of Exosomal Biogenesis and Cargo Sorting. J. Cell Biol. 2020, 219, e202006178. [Google Scholar] [CrossRef] [PubMed]
- Zhang, Y.; Liu, Y.; Liu, H.; Tang, W.H. Exosomes: Biogenesis, Biologic Function and Clinical Potential. Cell Biosci. 2019, 9, 19. [Google Scholar] [CrossRef]
- Walker, M.G.; Volkmuth, W. Cell Adhesion and Matrix Remodeling Genes Identified by Co-Expression Analysis. Gene Funct. Dis. 2002, 3, 109–112. [Google Scholar] [CrossRef]
- Peng, S.; Zhu, X.; Zhao, M.; Zhang, Y.; Wang, A.; Chen, M.; Ye, Z. Identification of Matrix-Remodeling Associated 5 as a Possible Molecular Oncotarget of Pancreatic Cancer. Cell Death Dis. 2023, 14, 157. [Google Scholar] [CrossRef]
- Laczko, R.; Csiszar, K. Lysyl Oxidase (LOX): Functional Contributions to Signaling Pathways. Biomolecules 2020, 10, 1093. [Google Scholar] [CrossRef]
- Oleggini, R.; Biology, A.D.D.-B. Lysyl Oxidase Regulates MMTV Promoter: Indirect Evidence of Histone H1 Involvement. Biochem. Cell Biol. 2011, 89, 522–532. [Google Scholar] [CrossRef]
- Iturbide, A.; de Herreros, A.G.; Peiró, S. A New Role for LOX and LOXL 2 Proteins in Transcription Regulation. Wiley Online Libr. 2015, 282, 1768–1773. [Google Scholar] [CrossRef]
- Gao, A.E.; Sullivan, K.E.; Black, L.D. Lysyl Oxidase Expression in Cardiac Fibroblasts Is Regulated by A2β1 Integrin Interactions with the Cellular Microenvironment. Biochem. Biophys. Res. Commun. 2016, 475, 70–75. [Google Scholar] [CrossRef]
- Alcudia, J.F.; Martinez-Gonzalez, J.; Guadall, A.; Gonzalez-Diez, M.; Badimon, L.; Rodriguez, C. Lysyl Oxidase and Endothelial Dysfunction: Mechanisms of Lysyl Oxidase down-Regulation by pro-Inflammatory Cytokines. Front. Biosci. 2008, 13, 2721–2727. [Google Scholar] [CrossRef]
- Harlow, C.R.; Rae, M.; Davidson, L.; Trackman, P.C.; Hillier, S.G. Lysyl Oxidase Gene Expression and Enzyme Activity in the Rat Ovary: Regulation by Follicle-Stimulating Hormone, Androgen, and Transforming Growth Factor-β Superfamily Members in Vitro. Endocrinology 2003, 144, 154–162. [Google Scholar] [CrossRef] [PubMed]
- Zhang, C.; Ma, J.; Wang, W.; Sun, Y.; Sun, K. Lysyl Oxidase Blockade Ameliorates Anovulation in Polycystic Ovary Syndrome. Hum. Reprod. 2018, 33, 2096–2106. [Google Scholar] [CrossRef] [PubMed]
- Yu, J.E.; Han, S.Y.; Wolfson, B.; Zhou, Q. The Role of Endothelial Lipase in Lipid Metabolism, Inflammation, and Cancer. Histol. Histopathol. 2018, 33, 1–10. [Google Scholar] [CrossRef] [PubMed]
- Miller, W.L.; Bose, H.S. Early Steps in Steroidogenesis: Intracellular Cholesterol Trafficking: Thematic Review Series: Genetics of Human Lipid Diseases. J. Lipid Res. 2011, 52, 2111. [Google Scholar] [CrossRef] [PubMed]
- Bassi, G.; Sidhu, S.K.; Mishra, S. The Expanding Role of Mitochondria, Autophagy and Lipophagy in Steroidogenesis. Cells 2021, 10, 1851. [Google Scholar] [CrossRef]
- Wang, W.; Zhu, N.; Yan, T.; Shi, Y.N.; Chen, J.; Zhang, C.J.; Xie, X.J.; Liao, D.F.; Qin, L. The Crosstalk: Exosomes and Lipid Metabolism. Cell Commun. Signal. 2020, 18, 119. [Google Scholar] [CrossRef]
- Mikłosz, A.; Łukaszuk, B.; Chabowski, A.; Górski, J. Treadmill Running Changes Endothelial Lipase Expression: Insights from Gene and Protein Analysis in Various Striated Muscle Tissues and Serum. Biomolecules 2021, 11, 906. [Google Scholar] [CrossRef]
- Wang, C.; Niimi, M.; Kitajima, S.; Matsuhisa, F.; Yan, H.; Dong, S.; Liang, J.; Fan, J. Sex Hormones Affect Endothelial Lipase-Mediated Lipid Metabolism and Atherosclerosis. Lipids Health Dis. 2019, 18, 226. [Google Scholar] [CrossRef] [PubMed]
- Mourikes, V.E.; Santacruz Márquez, R.; Deviney, A.; Neff, A.M.; Laws, M.J.; Flaws, J.A. Imidacloprid and Its Bioactive Metabolite, Desnitro-Imidacloprid, Differentially Affect Ovarian Antral Follicle Growth, Morphology, and Hormone Synthesis In Vitro. Toxics 2023, 11, 349. [Google Scholar] [CrossRef] [PubMed]
- Samardzija Nenadov, D.; Pogrmic-Majkic, K.; Fa, S.; Stanic, B.; Tubic, A.; Andric, N. Environmental Mixture with Estrogenic Activity Increases Hsd3b1 Expression through Estrogen Receptors in Immature Rat Granulosa Cells. J. Appl. Toxicol. 2018, 38, 879–887. [Google Scholar] [CrossRef] [PubMed]
- Munich, S.; Sobo-Vujanovic, A.; Buchser, W.J.; Beer-Stolz, D.; Vujanovic, N.L. Dendritic Cell Exosomes Directly Kill Tumor Cells and Activate Natural Killer Cells via TNF Superfamily Ligands. Oncoimmunology 2012, 1, 1074–1083. [Google Scholar] [CrossRef]
- Yi, X.; Wu, P.; Fan, Y.; Gong, Y.; Liu, J.; Xiong, J.; Xu, X. Identification of Candidate Genes Simultaneously Shared by Adipogenesis and Osteoblastogenesis from Human Mesenchymal Stem Cells. Folia Histochem. Cytobiol. 2022, 60, 179–190. [Google Scholar] [CrossRef] [PubMed]
- Lei, Y.; Henderson, B.R.; Emmanuel, C.; Harnett, P.R.; Defazio, A. Inhibition of ANKRD1 Sensitizes Human Ovarian Cancer Cells to Endoplasmic Reticulum Stress-Induced Apoptosis. Oncogene 2015, 34, 485–495. [Google Scholar] [CrossRef]
- Elsafadi, M.; Manikandan, M.; Dawud, R.A.; Alajez, N.M.; Hamam, R.; Alfayez, M.; Kassem, M.; Aldahmash, A.; Mahmood, A. Transgelin Is a TGFβ-Inducible Gene That Regulates Osteoblastic and Adipogenic Differentiation of Human Skeletal Stem Cells through Actin Cytoskeleston Organization. Cell Death Dis. 2016, 7, e2321. [Google Scholar] [CrossRef]
- Lim, M.; Thompson, J.G.; Dunning, K.R. HYPOXIA AND REPRODUCTIVE HEALTH: Hypoxia and Ovarian Function: Follicle Development, Ovulation, Oocyte Maturation. Reproduction 2021, 161, F33–F40. [Google Scholar] [CrossRef]
- Baddela, V.S.; Sharma, A.; Michaelis, M.; Vanselow, J. HIF1 Driven Transcriptional Activity Regulates Steroidogenesis and Proliferation of Bovine Granulosa Cells. Sci. Rep. 2020, 10, 3906. [Google Scholar] [CrossRef]
- He, G.; Peng, X.; Wei, S.; Yang, S.; Li, X.; Huang, M.; Tang, S.; Jin, H.; Liu, J.; Zhang, S.; et al. Exosomes in the Hypoxic TME: From Release, Uptake and Biofunctions to Clinical Applications. Mol. Cancer 2022, 21, 19. [Google Scholar] [CrossRef]
- Li, L.; Mu, J.; Zhang, Y.; Zhang, C.; Ma, T.; Chen, L.; Huang, T.; Wu, J.; Cao, J.; Feng, S.; et al. Stimulation by Exosomes from Hypoxia Preconditioned Human Umbilical Vein Endothelial Cells Facilitates Mesenchymal Stem Cells Angiogenic Function for Spinal Cord Repair. ACS Nano 2022, 16, 10811–10823. [Google Scholar] [CrossRef] [PubMed]
- Nishimura, R.; Okuda, K. Multiple Roles of Hypoxia in Ovarian Function: Roles of Hypoxia-Inducible Factor-Related and-Unrelated Signals during the Luteal Phase. Reprod. Fertil. Dev. 2015, 28, 1479–1486. [Google Scholar] [CrossRef] [PubMed]
- Dompe, C.; Kulus, M.; Stefańska, K.; Kranc, W.; Chermuła, B.; Bryl, R.; Pieńkowski, W.; Nawrocki, M.J.; Petitte, J.N.; Stelmach, B.; et al. Human Granulosa Cells—Stemness Properties, Molecular Cross-Talk and Follicular Angiogenesis. Cells 2021, 10, 1396. [Google Scholar] [CrossRef] [PubMed]
- Xu, X.; Mu, L.; Li, L.; Liang, J.; Zhang, S.; Jia, L.; Yang, X.; Dai, Y.; Zhang, J.; Wang, Y.; et al. Imaging and Tracing the Pattern of Adult Ovarian Angiogenesis Implies a Strategy against Female Reproductive Aging. Sci. Adv. 2022, 8, 8683. [Google Scholar] [CrossRef] [PubMed]
- Olejarz, W.; Kubiak-Tomaszewska, G.; Chrzanowska, A.; Lorenc, T. Exosomes in Angiogenesis and Anti-Angiogenic Therapy in Cancers. Int. J. Mol. Sci. 2020, 21, 5840. [Google Scholar] [CrossRef]
- Chen, S.; Chen, X.; Luo, Q.; Liu, X.; Wang, X.; Cui, Z.; He, A.; He, S.; Jiang, Z.; Wu, N.; et al. Retinoblastoma Cell-Derived Exosomes Promote Angiogenesis of Human Vesicle Endothelial Cells through MicroRNA-92a-3p. Cell Death Dis. 2021, 12, 695. [Google Scholar] [CrossRef]
- Hettich, B.F.; Ben-Yehuda Greenwald, M.; Werner, S.; Leroux, J.C. Exosomes for Wound Healing: Purification Optimization and Identification of Bioactive Components. Adv. Sci. 2020, 7, 2002596. [Google Scholar] [CrossRef]
- Zhou, C.; Zhang, B.; Yang, Y.; Jiang, Q.; Li, T.; Gong, J.; Tang, H.; Zhang, Q. Stem Cell-Derived Exosomes: Emerging Therapeutic Opportunities for Wound Healing. Stem Cell Res. Ther. 2023, 14, 107. [Google Scholar] [CrossRef]
- Bo, Y.; Yang, L.; Liu, B.; Tian, G.; Li, C.; Zhang, L.; Yan, Y. Exosomes from Human Induced Pluripotent Stem Cells-Derived Keratinocytes Accelerate Burn Wound Healing through MiR-762 Mediated Promotion of Keratinocytes and Endothelial Cells Migration. J. Nanobiotechnol. 2022, 20, 291. [Google Scholar] [CrossRef]
- Li, D.; Wu, N. Mechanism and Application of Exosomes in the Wound Healing Process in Diabetes Mellitus. Diabetes Res. Clin. Pract. 2022, 187, 109882. [Google Scholar] [CrossRef]
- Samaras, S.E.; Almodóvar-García, K.; Wu, N.; Yu, F.; Davidson, J.M. Global Deletion of Ankrd1 Results in a Wound-Healing Phenotype Associated with Dermal Fibroblast Dysfunction. Am. J. Pathol. 2015, 185, 96. [Google Scholar] [CrossRef]
- Cai, L.; Xiong, X.; Kong, X.; Xie, J. The Role of the Lysyl Oxidases in Tissue Repair and Remodeling: A Concise Review. Tissue Eng. Regen. Med. 2017, 14, 15. [Google Scholar] [CrossRef] [PubMed]
- Yung, Y.; Ophir, L.; Yerushalmi, G.M.; Baum, M.; Hourvitz, A.; Maman, E. HAS2-AS1 Is a Novel LH/HCG Target Gene Regulating HAS2 Expression and Enhancing Cumulus Cells Migration. J. Ovarian Res. 2019, 12, 21. [Google Scholar] [CrossRef]
- Tan, J.X.; Wang, X.Y.; Li, H.Y.; Su, X.L.; Wang, L.; Ran, L.; Zheng, K.; Ren, G.S. HYAL1 Overexpression Is Correlated with the Malignant Behavior of Human Breast Cancer. Int. J. Cancer 2011, 128, 1303–1315. [Google Scholar] [CrossRef]
- Deng, H.; Wang, J.; An, R. Hyaluronic Acid-Based Hydrogels: As an Exosome Delivery System in Bone Regeneration. Front. Pharmacol. 2023, 14, 1131001. [Google Scholar] [CrossRef]
- Kimura, N.; Totsukawa, K.; Sato, E. Significance of Mammalian Cumulus-Oocyte Complex Matrix in Oocyte Meiotic Maturation: Review of the Synthetic Control and Possible Roles of Hyaluronan (HA) and HA-Binding Protein. J. Mamm. Ova Res. 2006, 23, 36–51. [Google Scholar] [CrossRef]
- Ahn, J.; Han, K.S.; Heo, J.H.; Bang, D.; Kang, Y.H.; Jin, H.A.; Hong, S.J.; Lee, J.H.; Ham, W.S. FOXC2 and CLIP4: A Potential Biomarker for Synchronous Metastasis of ≤7-Cm Clear Cell Renal Cell Carcinomas. Oncotarget 2016, 7, 51423. [Google Scholar] [CrossRef] [PubMed]
- Liu, Y.; Su, C.Y.; Yan, Y.Y.; Wang, J.; Li, J.J.; Fu, J.J.; Wang, Y.Q.; Zhang, J.Y. Exosomes of A549 Cells Induced Migration, Invasion, and EMT of BEAS-2B Cells Related to Let-7c-5p and MiR-181b-5p. Front. Endocrinol. 2022, 13, 1395. [Google Scholar] [CrossRef]
- Ma, S.; Song, L.; Bai, Y.; Wang, S.; Wang, J.; Zhang, H.; Wang, F.; He, Y.; Tian, C.; Qin, G. Improved Intracellular Delivery of Exosomes by Surface Modification with Fluorinated Peptide Dendrimers for Promoting Angiogenesis and Migration of HUVECs. RSC Adv. 2023, 13, 11269–11277. [Google Scholar] [CrossRef]
- Sung, B.H.; Ketova, T.; Hoshino, D.; Zijlstra, A.; Weaver, A.M. Directional Cell Movement through Tissues Is Controlled by Exosome Secretion. Nat. Commun. 2015, 6, 7164. [Google Scholar] [CrossRef]
- Jimenez, L.; Yu, H.; McKenzie, A.J.; Franklin, J.L.; Patton, J.G.; Liu, Q.; Weaver, A.M. Quantitative Proteomic Analysis of Small and Large Extracellular Vesicles (EVs) Reveals Enrichment of Adhesion Proteins in Small EVs. J. Proteome Res. 2019, 18, 947–959. [Google Scholar] [CrossRef] [PubMed]
- Yuan, X.; Zhou, X.; Qiao, X.; Wu, Q.; Yao, Z.; Jiang, Y.; Zhang, H.; Zhang, Z.; Wang, X.; Li, J. FoxA2 and P53 Regulate the Transcription of HSD17B1 in Ovarian Granulosa Cells of Pigs. Reprod. Domest. Anim. 2021, 56, 74–82. [Google Scholar] [CrossRef] [PubMed]
- Yu, L.; Liu, M.; Wang, Z.; Liu, T.; Liu, S.; Wang, B.; Pan, B.; Dong, X.; Guo, W. Correlation between Steroid Levels in Follicular Fluid and Hormone Synthesis Related Substances in Its Exosomes and Embryo Quality in Patients with Polycystic Ovary Syndrome. Reprod. Biol. Endocrinol. 2021, 19, 74. [Google Scholar] [CrossRef] [PubMed]
- Karman, B.N.; Basavarajappa, M.S.; Hannon, P.; Flaws, J.A. Dioxin Exposure Reduces the Steroidogenic Capacity of Mouse Antral Follicles Mainly at the Level of HSD17B1 without Altering Atresia. Toxicol. Appl. Pharmacol. 2012, 264, 1–12. [Google Scholar] [CrossRef]
- Wang, C.; Zhao, Y.; Yuan, Z.Y.; Wu, Y.; Zhao, Z.; Wu, C.; Hou, J.; Zhang, M. Genome-Wide Identification of MRNAs, LncRNAs, and Proteins, and Their Relationship with Sheep Fecundity. Front. Genet. 2022, 12, 2667. [Google Scholar] [CrossRef]
- Zhou, Q.Y.; Wan, M.C.; Wei, Q.P.; Song, Q.L.; Xiong, L.G.; Huo, J.H.; Huang, J.N. Expression, Regulation, and Functional Characterization of FST Gene in Porcine Granulosa Cells. Anim. Biotechnol. 2016, 27, 295–302. [Google Scholar] [CrossRef]
- Patton, B.K.; Madadi, S.; Pangas, S.A. Control of Ovarian Follicle Development by TGF-β Family Signaling. Curr. Opin. Endocr. Metab. Res. 2021, 18, 102–110. [Google Scholar] [CrossRef]
- Bai, X.; Wang, S. Signaling Pathway Intervention in Premature Ovarian Failure. Front. Med. 2022, 9, 3545. [Google Scholar] [CrossRef]
- Wang, C.; Sun, Y. Induction of Collagen I by CXCL10 in Ovarian Theca–Stroma Cells via the JNK Pathway. Front. Endocrinol. 2022, 13, 823740. [Google Scholar] [CrossRef]
- Budna, J.; Chachuła, A.; Kaźmierczak, D.; Rybska, M.; Ciesiółka, S.; Bryja, A.; Kranc, W.; Borys, S.; Zok, A.; Bukowska, D.; et al. Morphogenesis-Related Gene-Expression Profile in Porcine Oocytes before and after in Vitro Maturation. Zygote 2017, 25, 331–340. [Google Scholar] [CrossRef]
- Stelcer, E.; Komarowska, H.; Jopek, K.; Żok, A.; Iżycki, D.; Malińska, A.; Szczepaniak, B.; Komekbai, Z.; Karczewski, M.; Wierzbicki, T.; et al. Biological Response of Adrenal Carcinoma and Melanoma Cells to Mitotane Treatment. Oncol. Lett. 2022, 23, 120. [Google Scholar] [CrossRef]
- Dennis, G.; Sherman, B.T.; Hosack, D.A.; Yang, J.; Gao, W.; Lane, H.C.; Lempicki, R.A. DAVID: Database for Annotation, Visualization, and Integrated Discovery. Genome Biol. 2003, 4, P3. [Google Scholar] [CrossRef] [PubMed]
- Extract and Visualize the Results of Multivariate Data Analyses [R Package Factoextra Version 1.0.7] | Semantic Scholar. Available online: https://www.semanticscholar.org/paper/Extract-and-Visualize-the-Results-of-Multivariate-Kassambara-Mundt/5cb503e3db8609405d9f286fadc2a8bb867e5b6e (accessed on 5 March 2023).
- Golkar-Narenji, A.; Antosik, P.; Nolin, S.; Rucinski, M.; Jopek, K.; Zok, A.; Sobolewski, J.; Jankowski, M.; Zdun, M.; Bukowska, D.; et al. Gene Ontology Groups and Signaling Pathways Regulating the Process of Avian Satellite Cell Differentiation. Genes 2022, 13, 242. [Google Scholar] [CrossRef] [PubMed]
- Benjamini, Y.; Cohen, R. Weighted False Discovery Rate Controlling Procedures for Clinical Trials. Biostatistics 2017, 18, 91–104. [Google Scholar] [CrossRef] [PubMed]
- Gu, Z.; Eils, R.; Schlesner, M. Complex Heatmaps Reveal Patterns and Correlations in Multidimensional Genomic Data. Bioinformatics 2016, 32, 2847–2849. [Google Scholar] [CrossRef] [PubMed]
- Yu, G.; Wang, L.G.; Han, Y.; He, Q.Y. ClusterProfiler: An R Package for Comparing Biological Themes among Gene Clusters. Omics 2012, 16, 284–287. [Google Scholar] [CrossRef]


| Gene | Primer Sequence (5′-3′) | Product Size (bp) | |
|---|---|---|---|
| HSD17B1 | F | GTGTCAGAGGCTTGCTAGGG | 200 |
| R | CAGCACAATCTCAAGGCTGA | ||
| MAL2 | F | ATCCTCGTCATGGAAAGGTG | 202 |
| R | TGCCACTCATTCATGGTTGT | ||
| SNX31 | F | AGGTGACCTTCCTTGGGACT | 222 |
| R | CCGGAACTTCAATCTGCATT | ||
| DAPL | F | CCTGCTCTGGAGAAGGTCAC | 151 |
| R | GGGCCTAAGGAAAGTTTTGG | ||
| ANKRD1 | F | CTGCTTGAGGTGGGGAAGTA | 178 |
| R | GTGTCTCACTGTCTGGGGAA | ||
| NEXN | F | GAAGCAAGGAGAAGCATGGC | 151 |
| R | CCTCCTCTGTTCGTCGTCTT | ||
| MXRA5 | F | TGCTGGCACTGTTTTCTCAC | 212 |
| R | TCGGAGAGGATTCATGAGGC | ||
| TAGLN | F | TTAAAGGCCGCTGAGGACTA | 233 |
| R | ATGACATGCTTTCCCTCCTG | ||
| SHAS2 | F | ATCGCGGCCTATCAAGAAGA | 204 |
| R | GCCCTTTTCGTGGAAGTTGT | ||
| CLIP4 | F | CCCTTAGAAATGGCCGATGC | 162 |
| R | ATCTCCCAACTTCAGGCCAA | ||
| HSD3B1 | F | TCCACACCAGCAGCATAGAG | 245 |
| R | CATGTGGGCAAAGATGAATG | ||
Disclaimer/Publisher’s Note: The statements, opinions and data contained in all publications are solely those of the individual author(s) and contributor(s) and not of MDPI and/or the editor(s). MDPI and/or the editor(s) disclaim responsibility for any injury to people or property resulting from any ideas, methods, instructions or products referred to in the content. |
© 2023 by the authors. Licensee MDPI, Basel, Switzerland. This article is an open access article distributed under the terms and conditions of the Creative Commons Attribution (CC BY) license (https://creativecommons.org/licenses/by/4.0/).
Share and Cite
Kulus, J.; Kranc, W.; Kulus, M.; Bukowska, D.; Piotrowska-Kempisty, H.; Mozdziak, P.; Kempisty, B.; Antosik, P. New Gene Markers of Exosomal Regulation Are Involved in Porcine Granulosa Cell Adhesion, Migration, and Proliferation. Int. J. Mol. Sci. 2023, 24, 11873. https://doi.org/10.3390/ijms241411873
Kulus J, Kranc W, Kulus M, Bukowska D, Piotrowska-Kempisty H, Mozdziak P, Kempisty B, Antosik P. New Gene Markers of Exosomal Regulation Are Involved in Porcine Granulosa Cell Adhesion, Migration, and Proliferation. International Journal of Molecular Sciences. 2023; 24(14):11873. https://doi.org/10.3390/ijms241411873
Chicago/Turabian StyleKulus, Jakub, Wiesława Kranc, Magdalena Kulus, Dorota Bukowska, Hanna Piotrowska-Kempisty, Paul Mozdziak, Bartosz Kempisty, and Paweł Antosik. 2023. "New Gene Markers of Exosomal Regulation Are Involved in Porcine Granulosa Cell Adhesion, Migration, and Proliferation" International Journal of Molecular Sciences 24, no. 14: 11873. https://doi.org/10.3390/ijms241411873
APA StyleKulus, J., Kranc, W., Kulus, M., Bukowska, D., Piotrowska-Kempisty, H., Mozdziak, P., Kempisty, B., & Antosik, P. (2023). New Gene Markers of Exosomal Regulation Are Involved in Porcine Granulosa Cell Adhesion, Migration, and Proliferation. International Journal of Molecular Sciences, 24(14), 11873. https://doi.org/10.3390/ijms241411873