
Targeted MicroRNA Profiling Reveals That Exendin-4 Modulates the Expression of Several MicroRNAs to Reduce Steatosis in HepG2 Cells

 , and
, and
Abstract
1. Introduction
2. Results
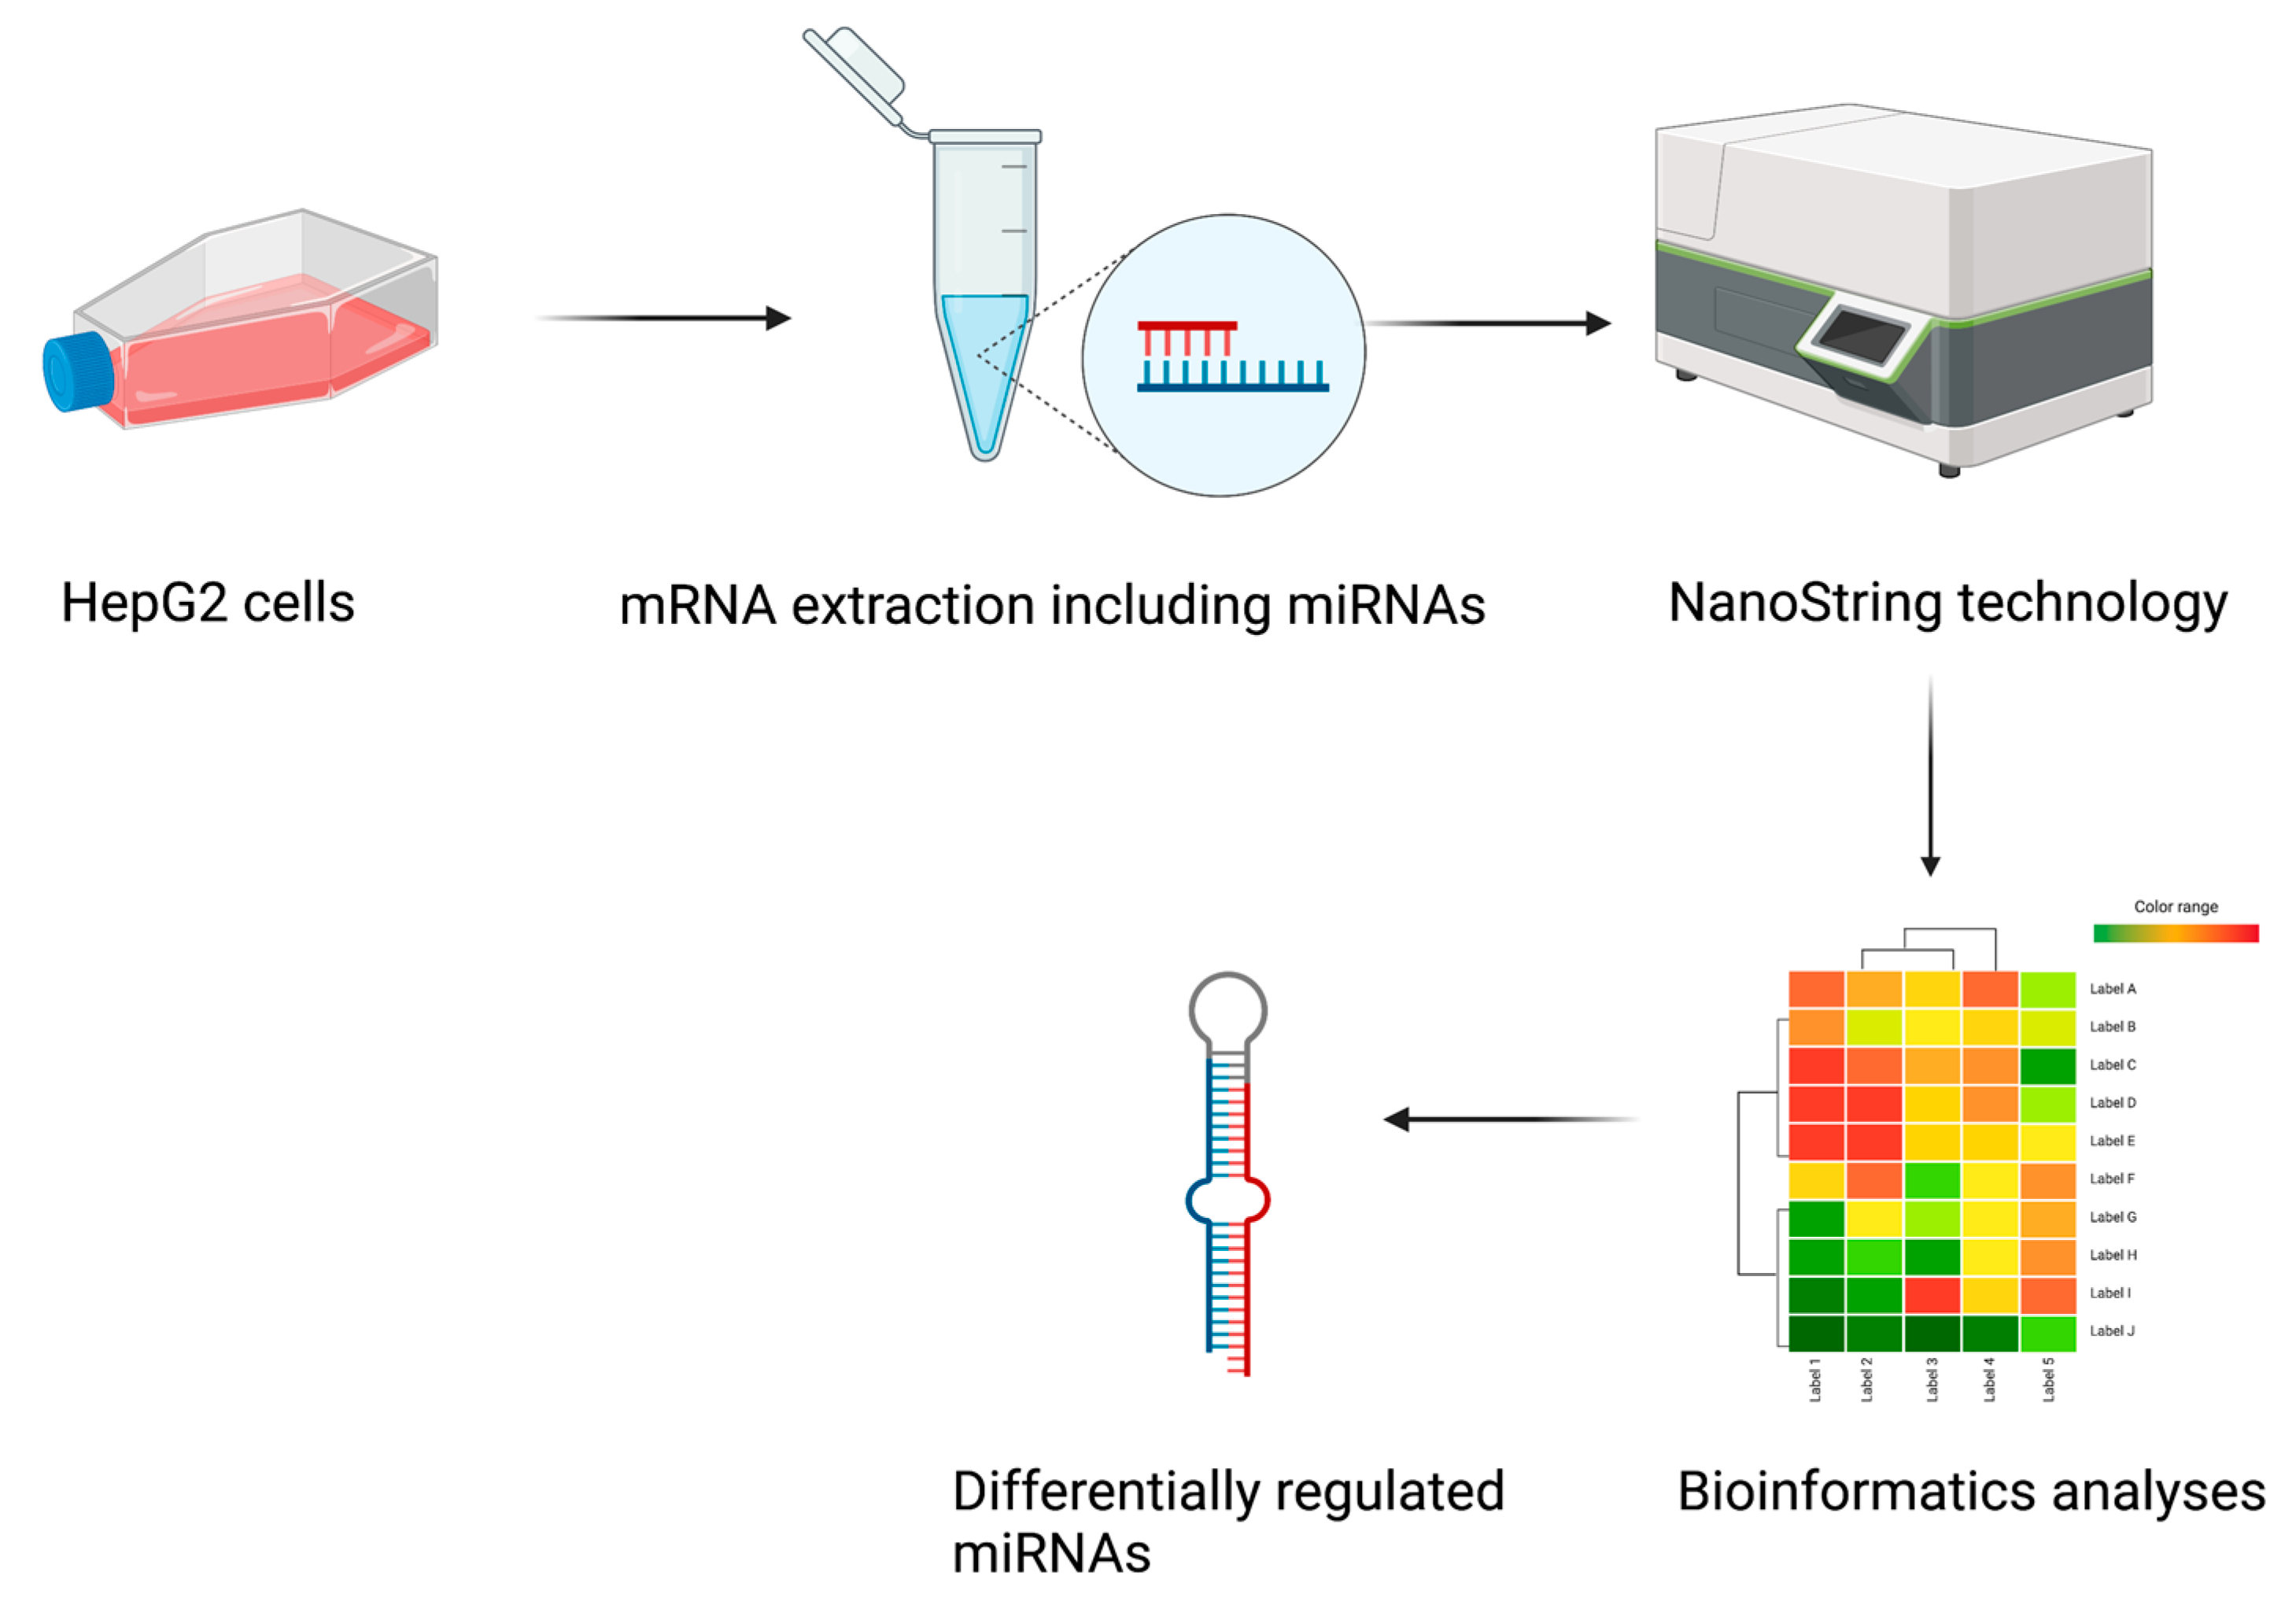
2.1. Study Design
2.2. Exendin-4 Reduces OA-Induced Lipid Accumulation in HepG2
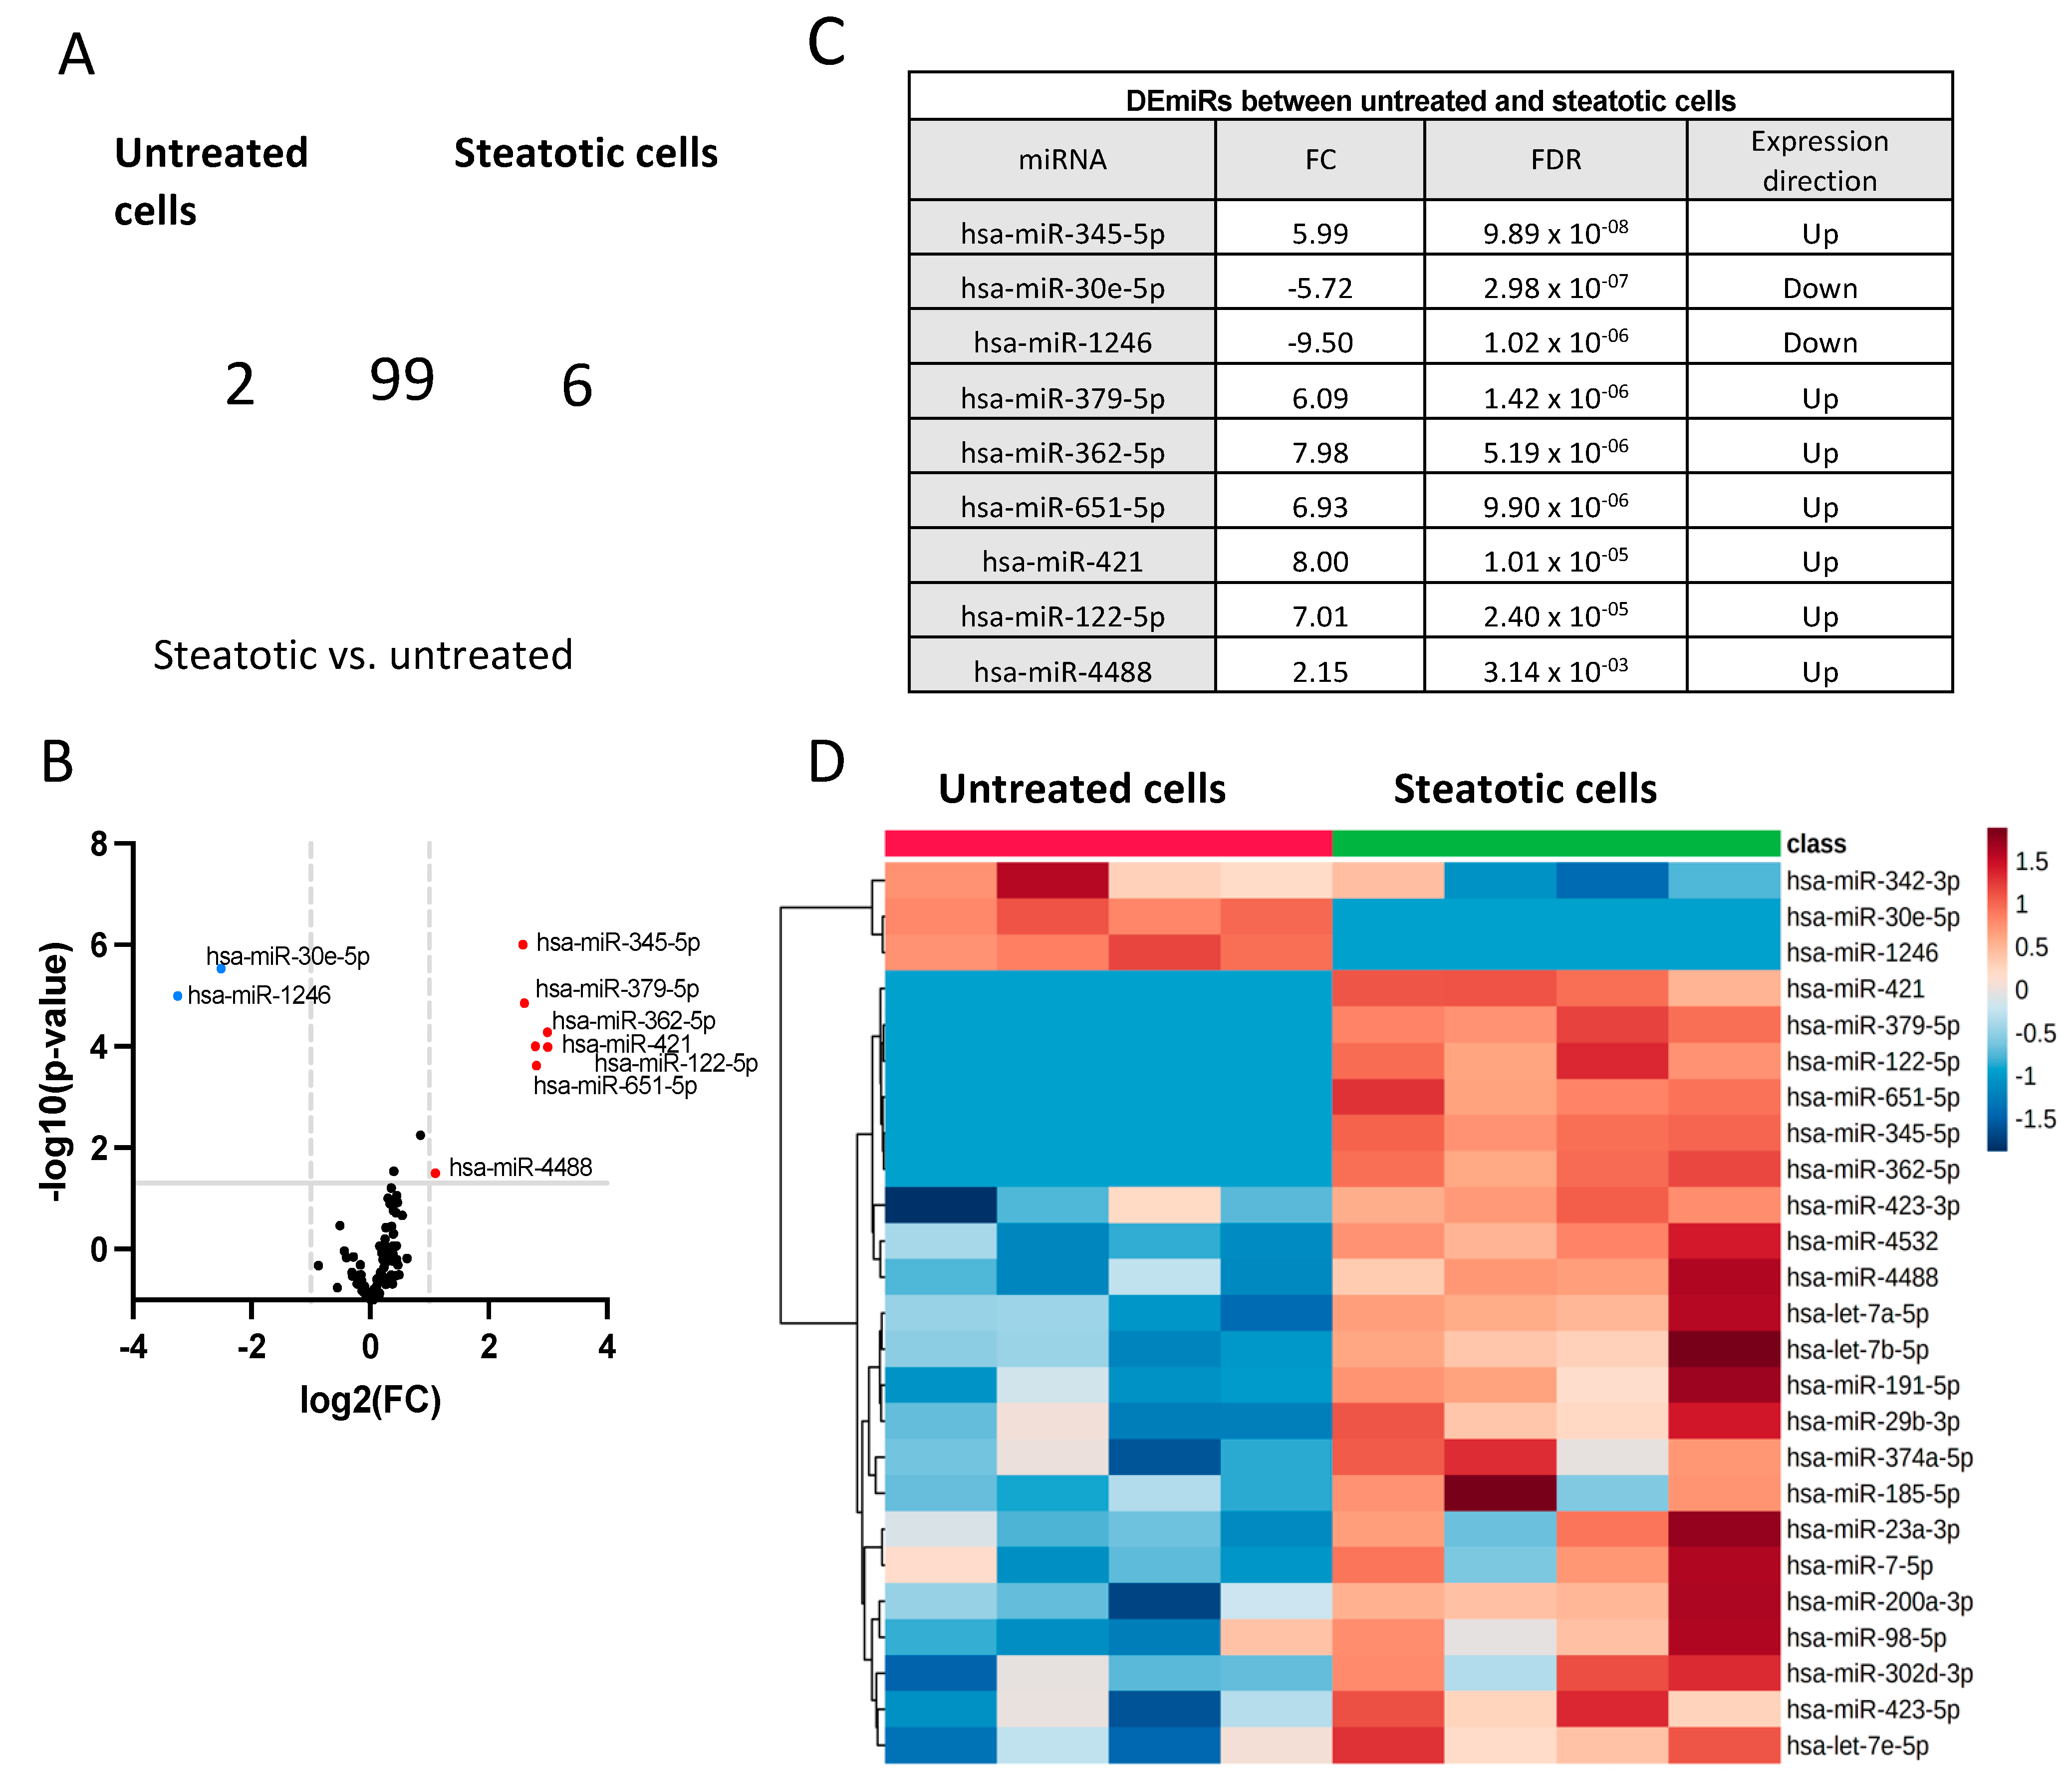
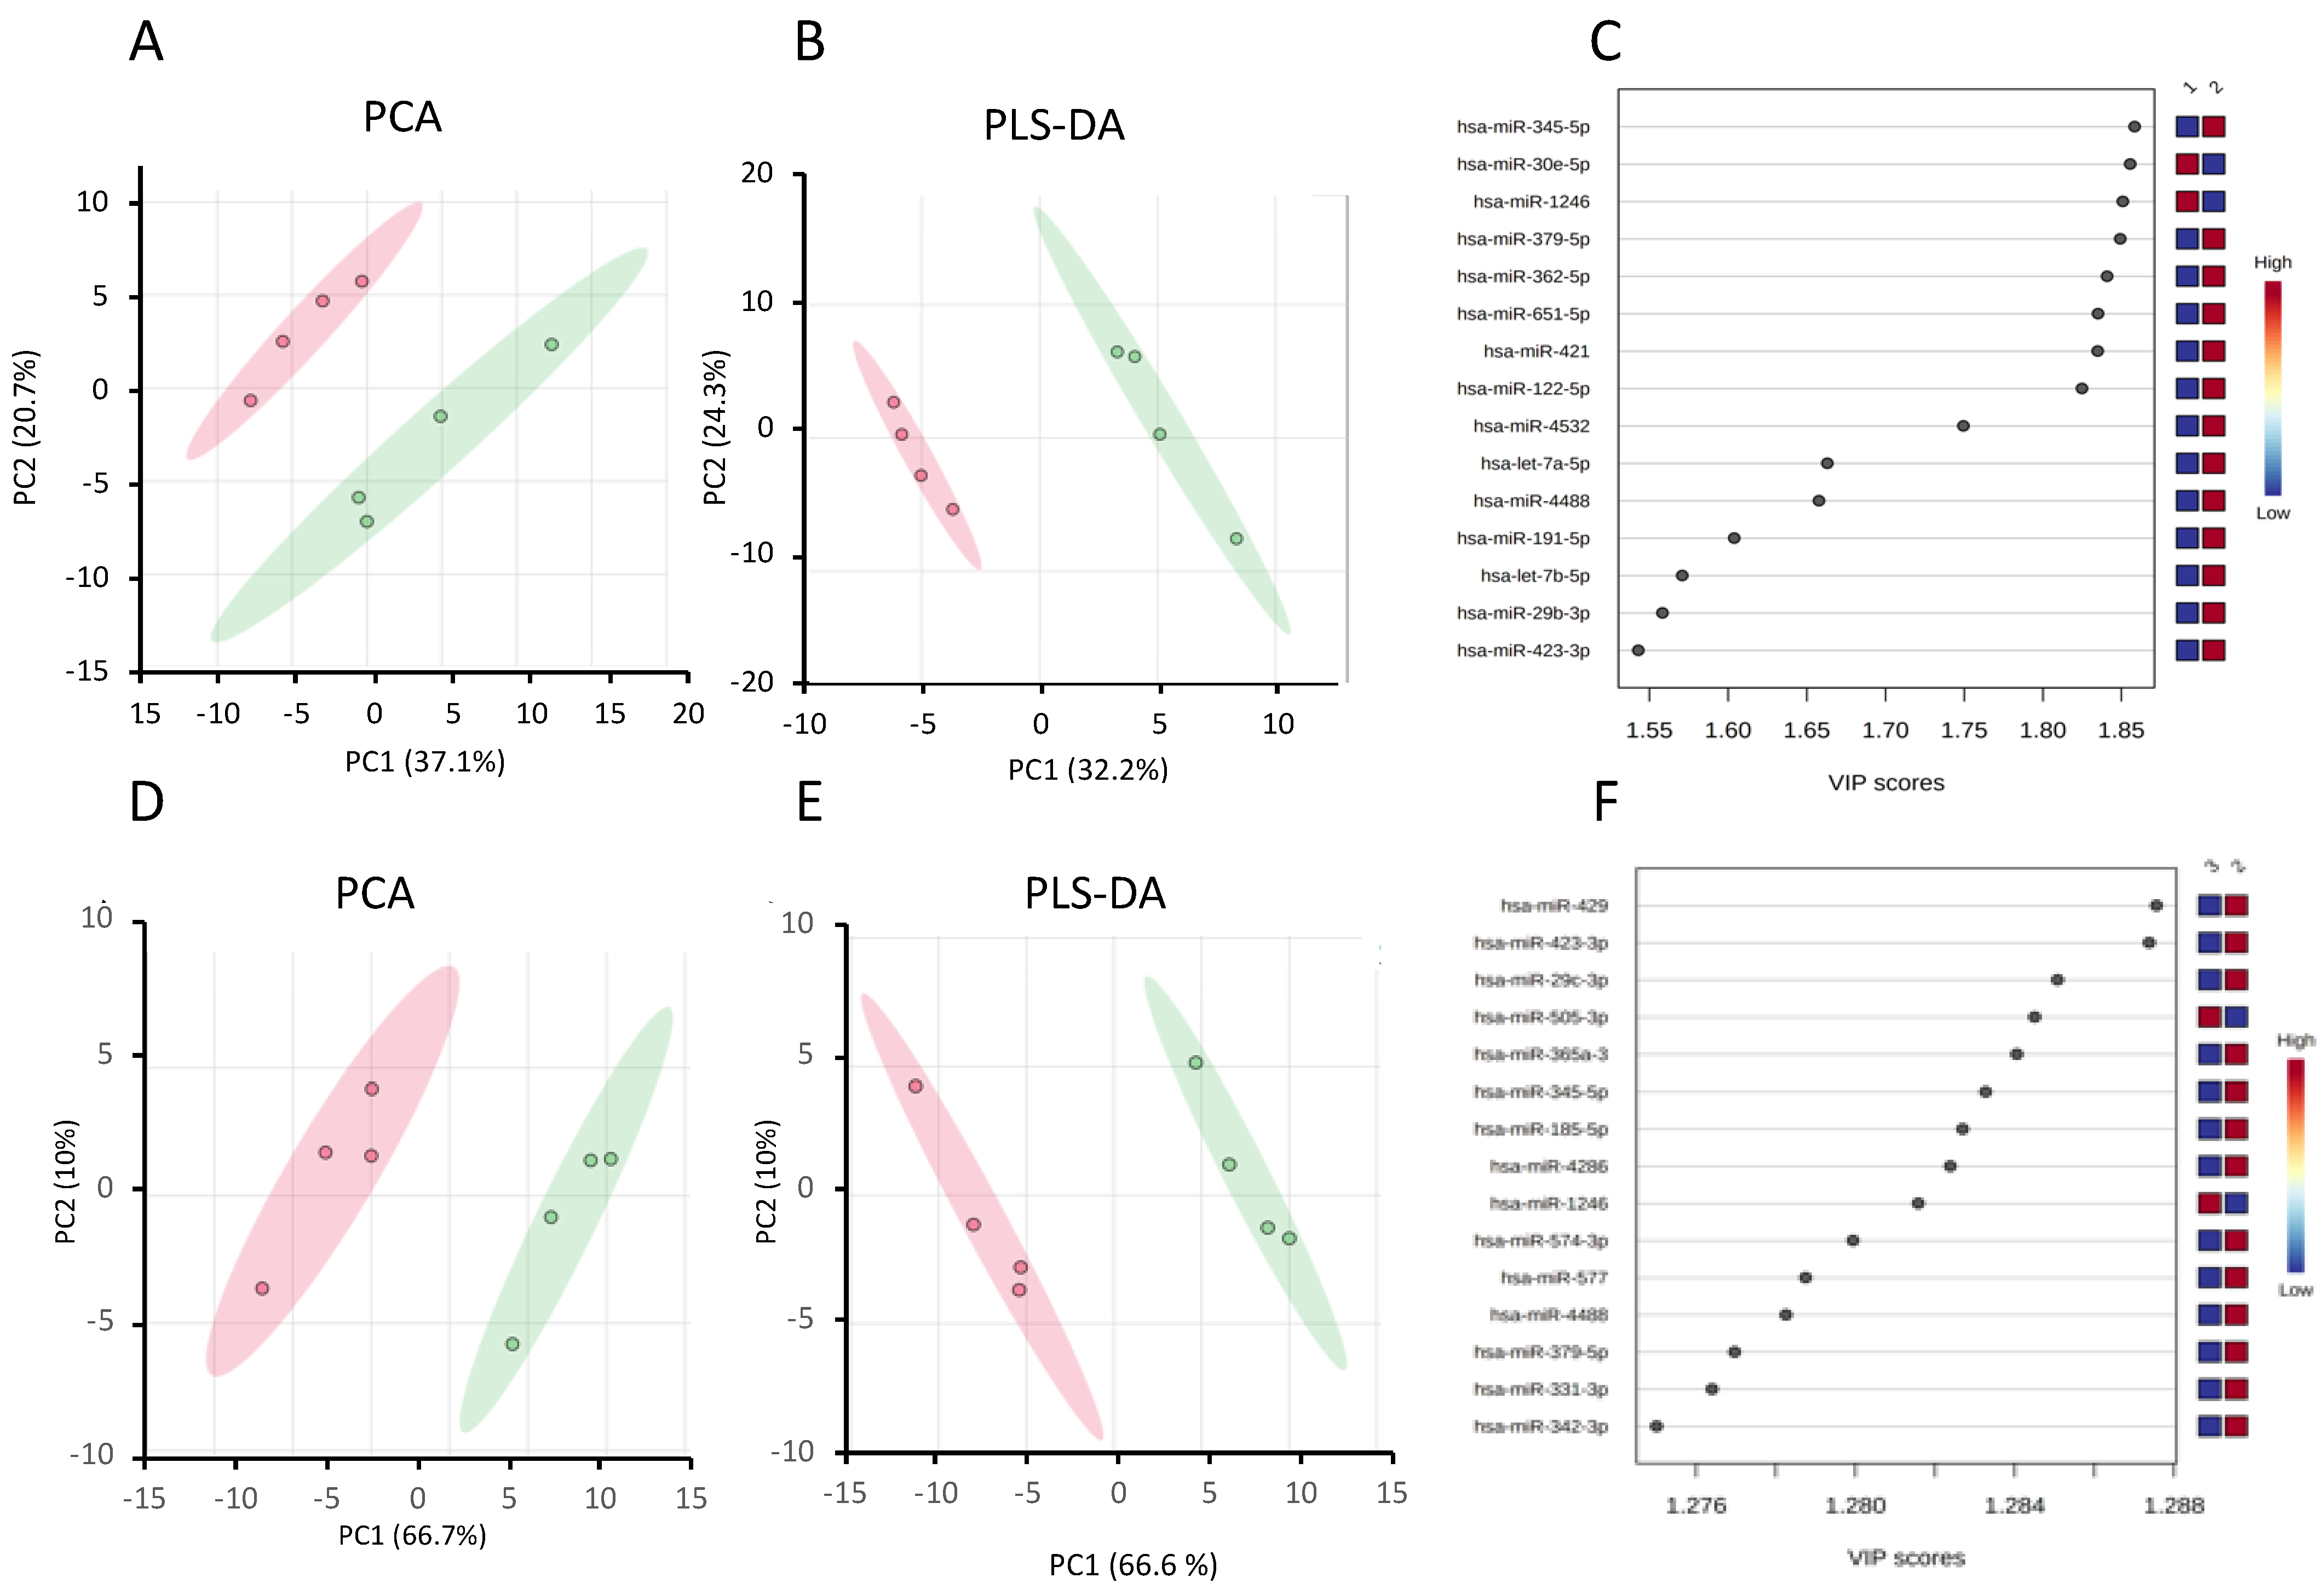
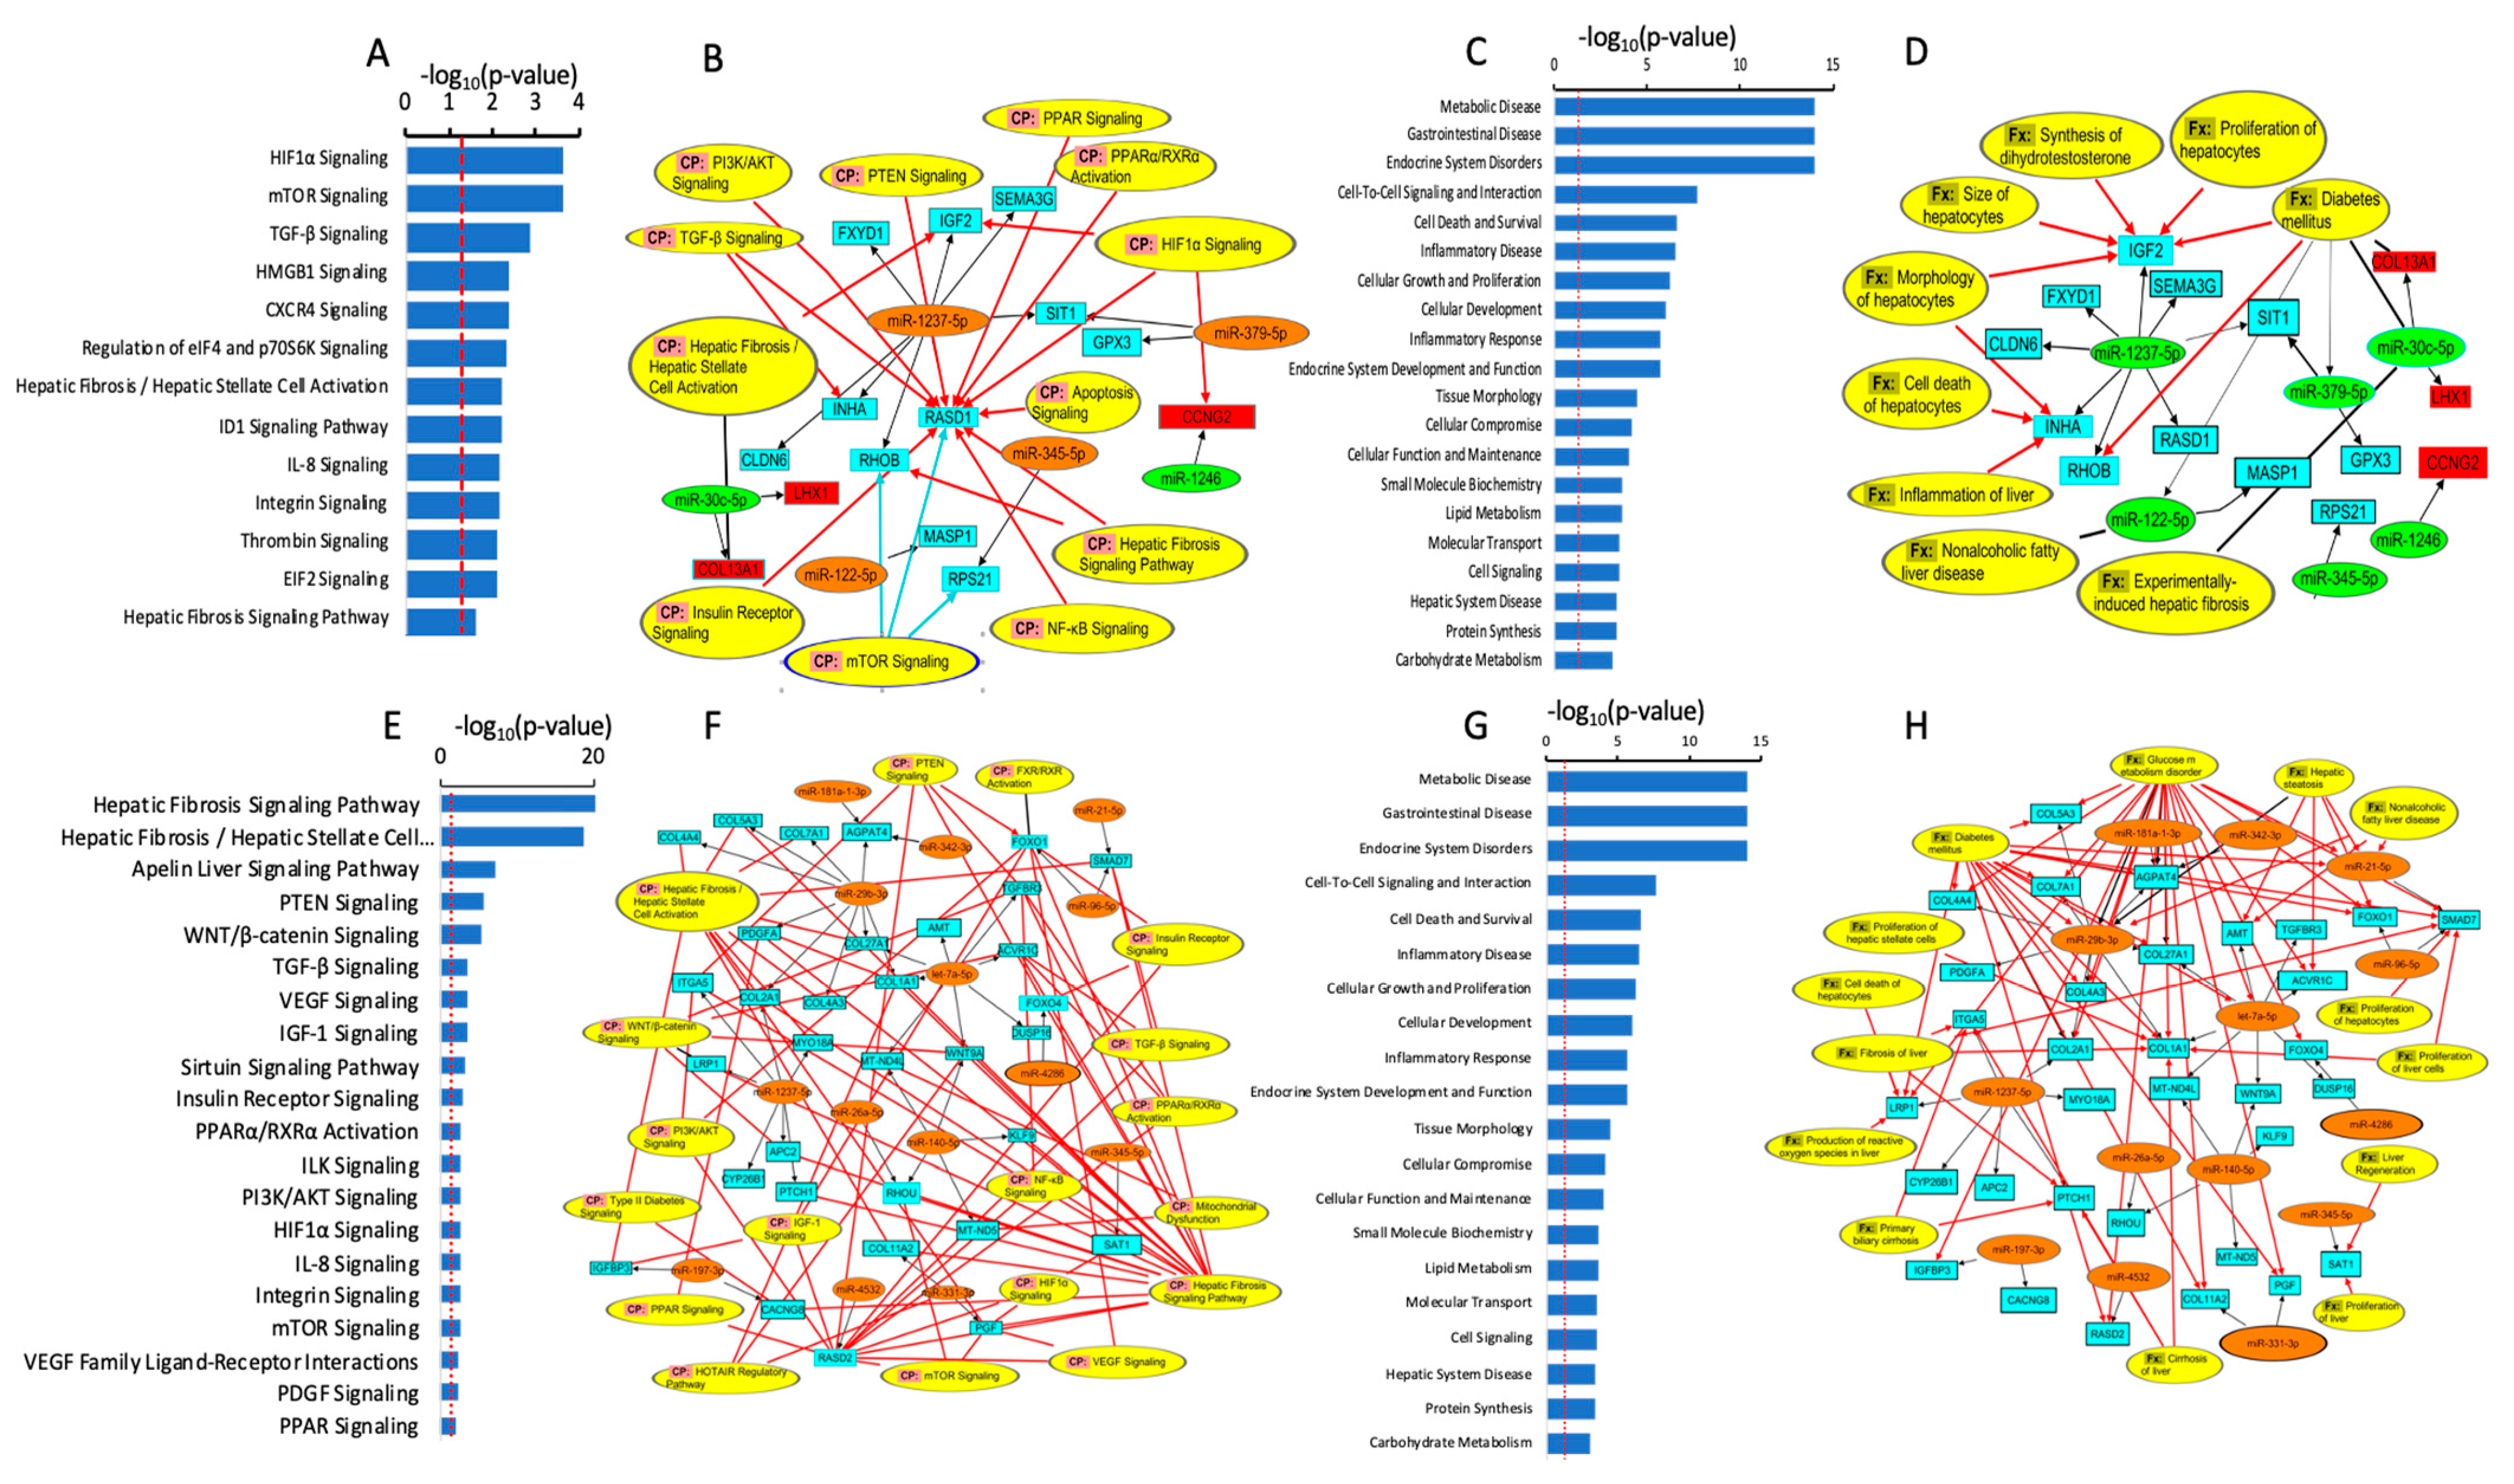
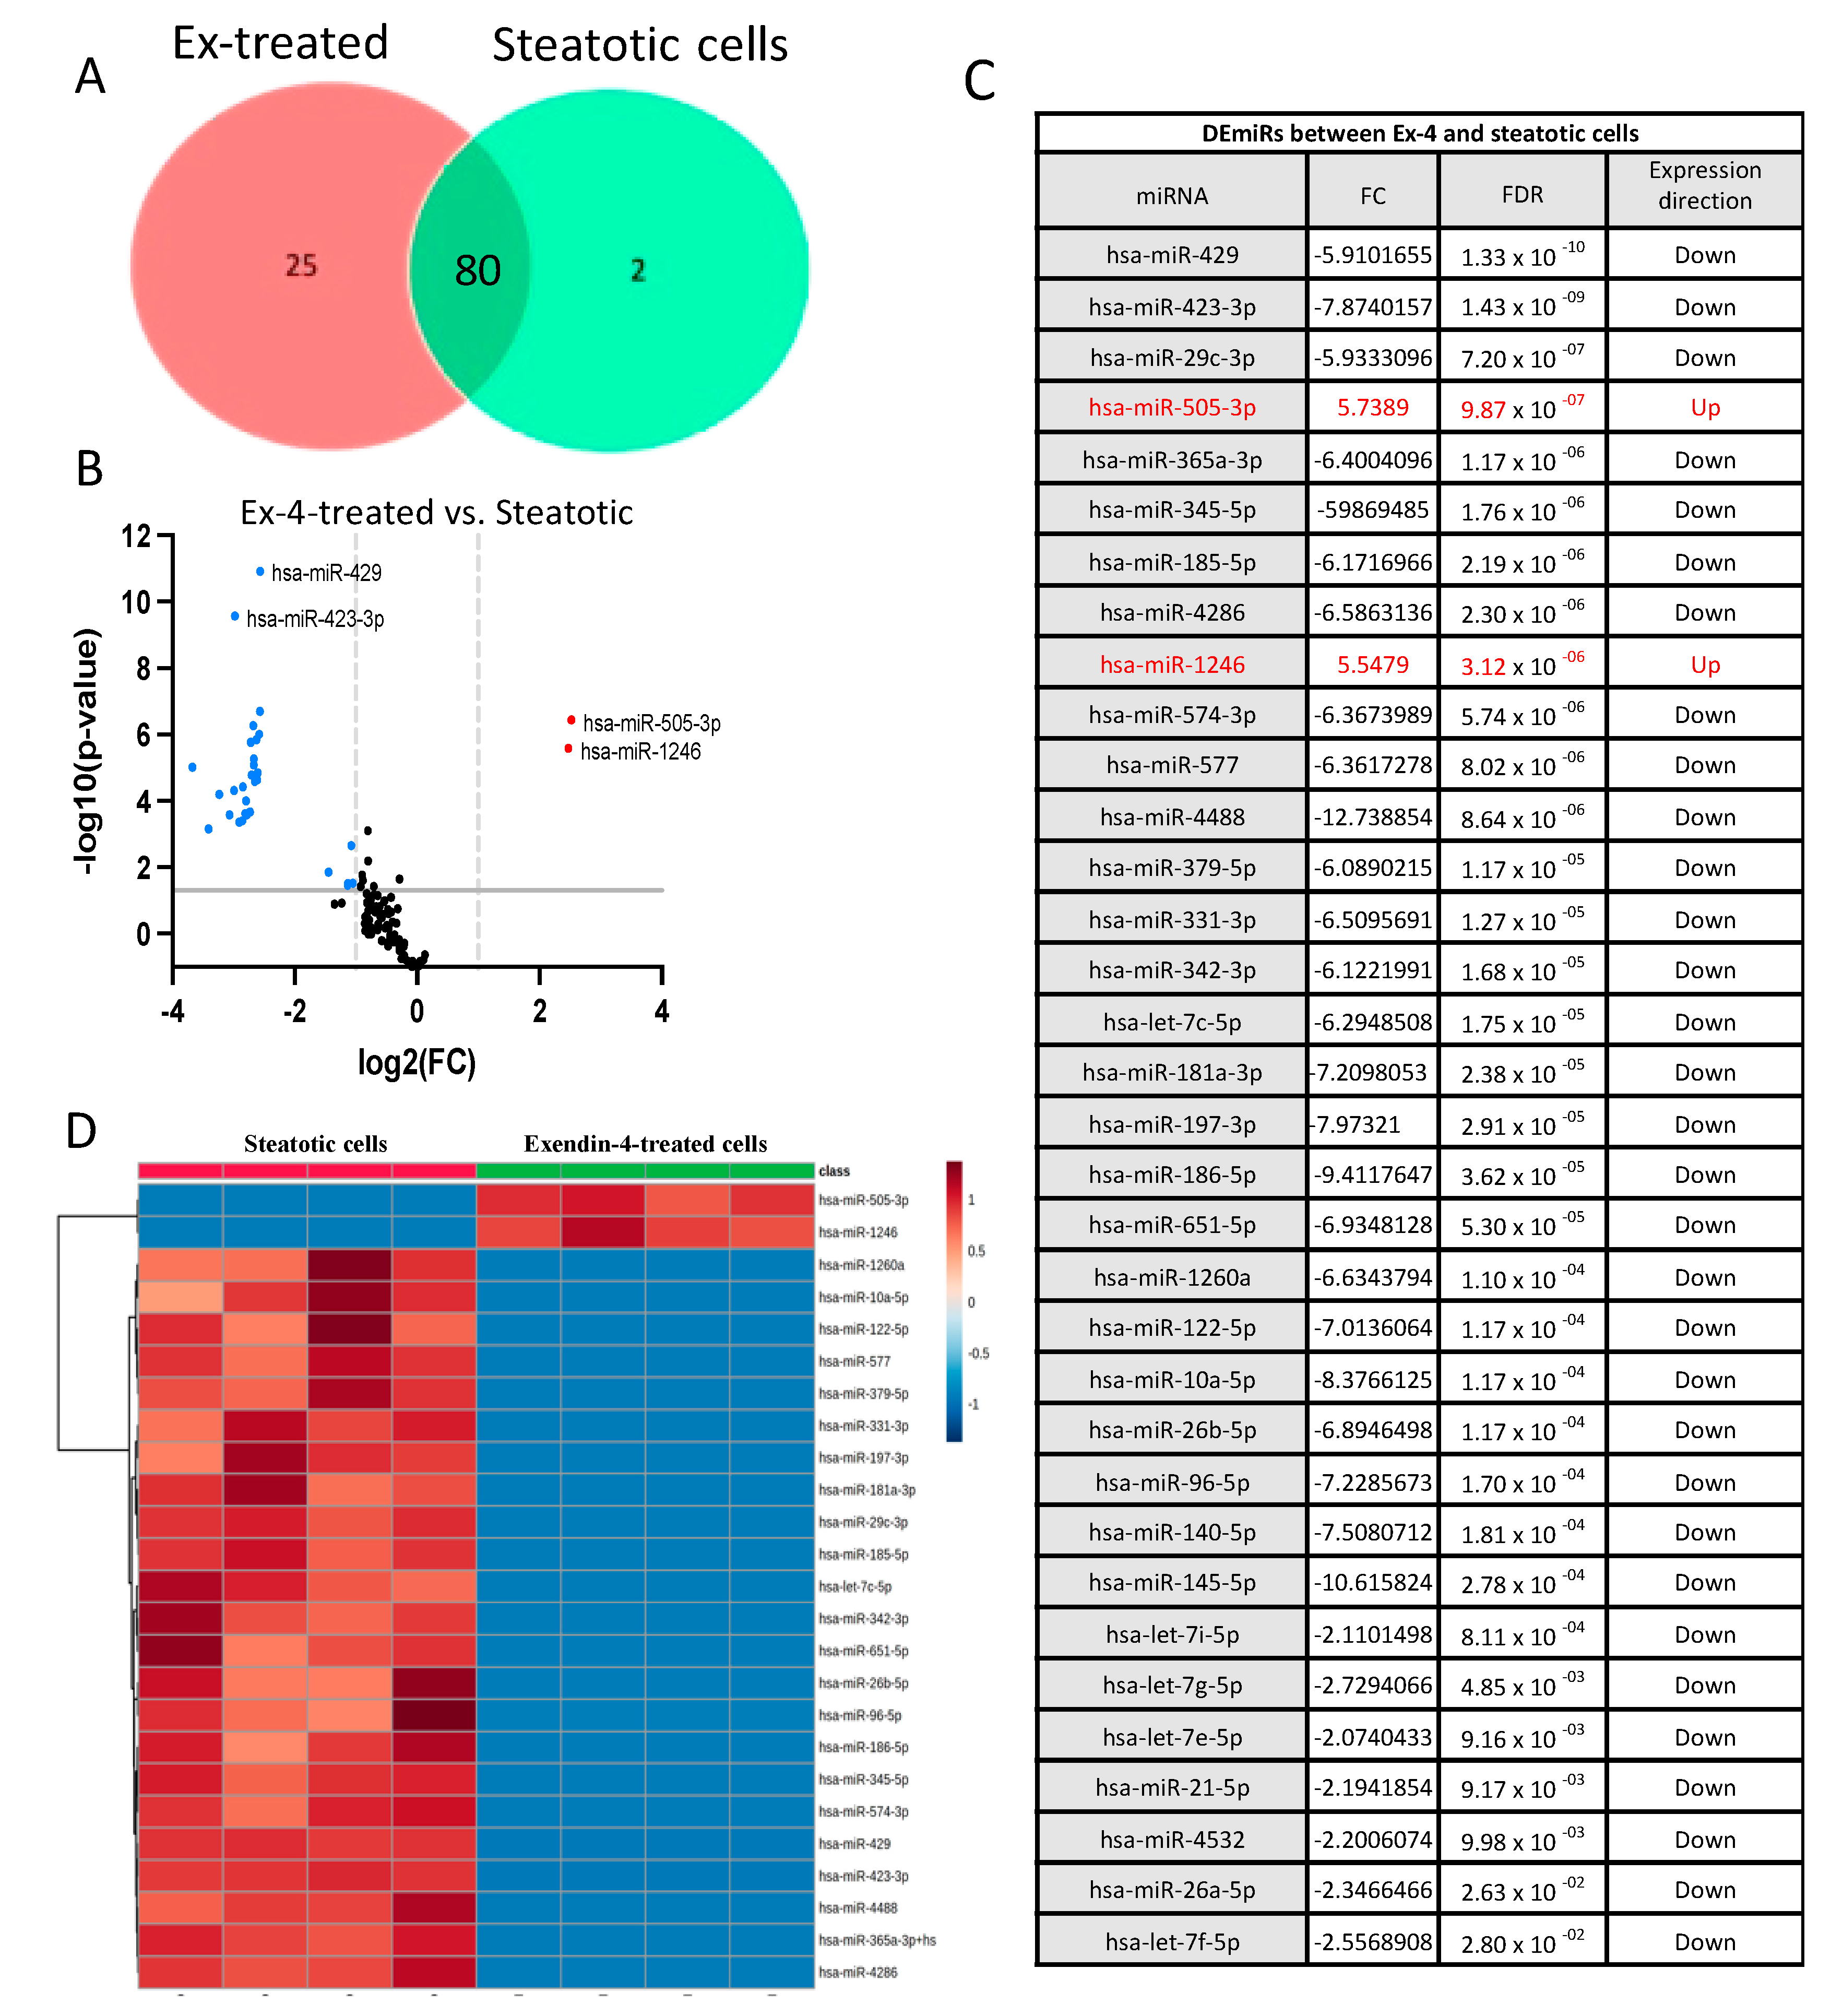
2.3. Identification of Differentially Expressed miRNAs
- (a)
- Differentially expressed miRNAs in steatotic versus control cells
- (b)
- The differentially expressed miRNAs in Ex-4-treated versus steatotic cells
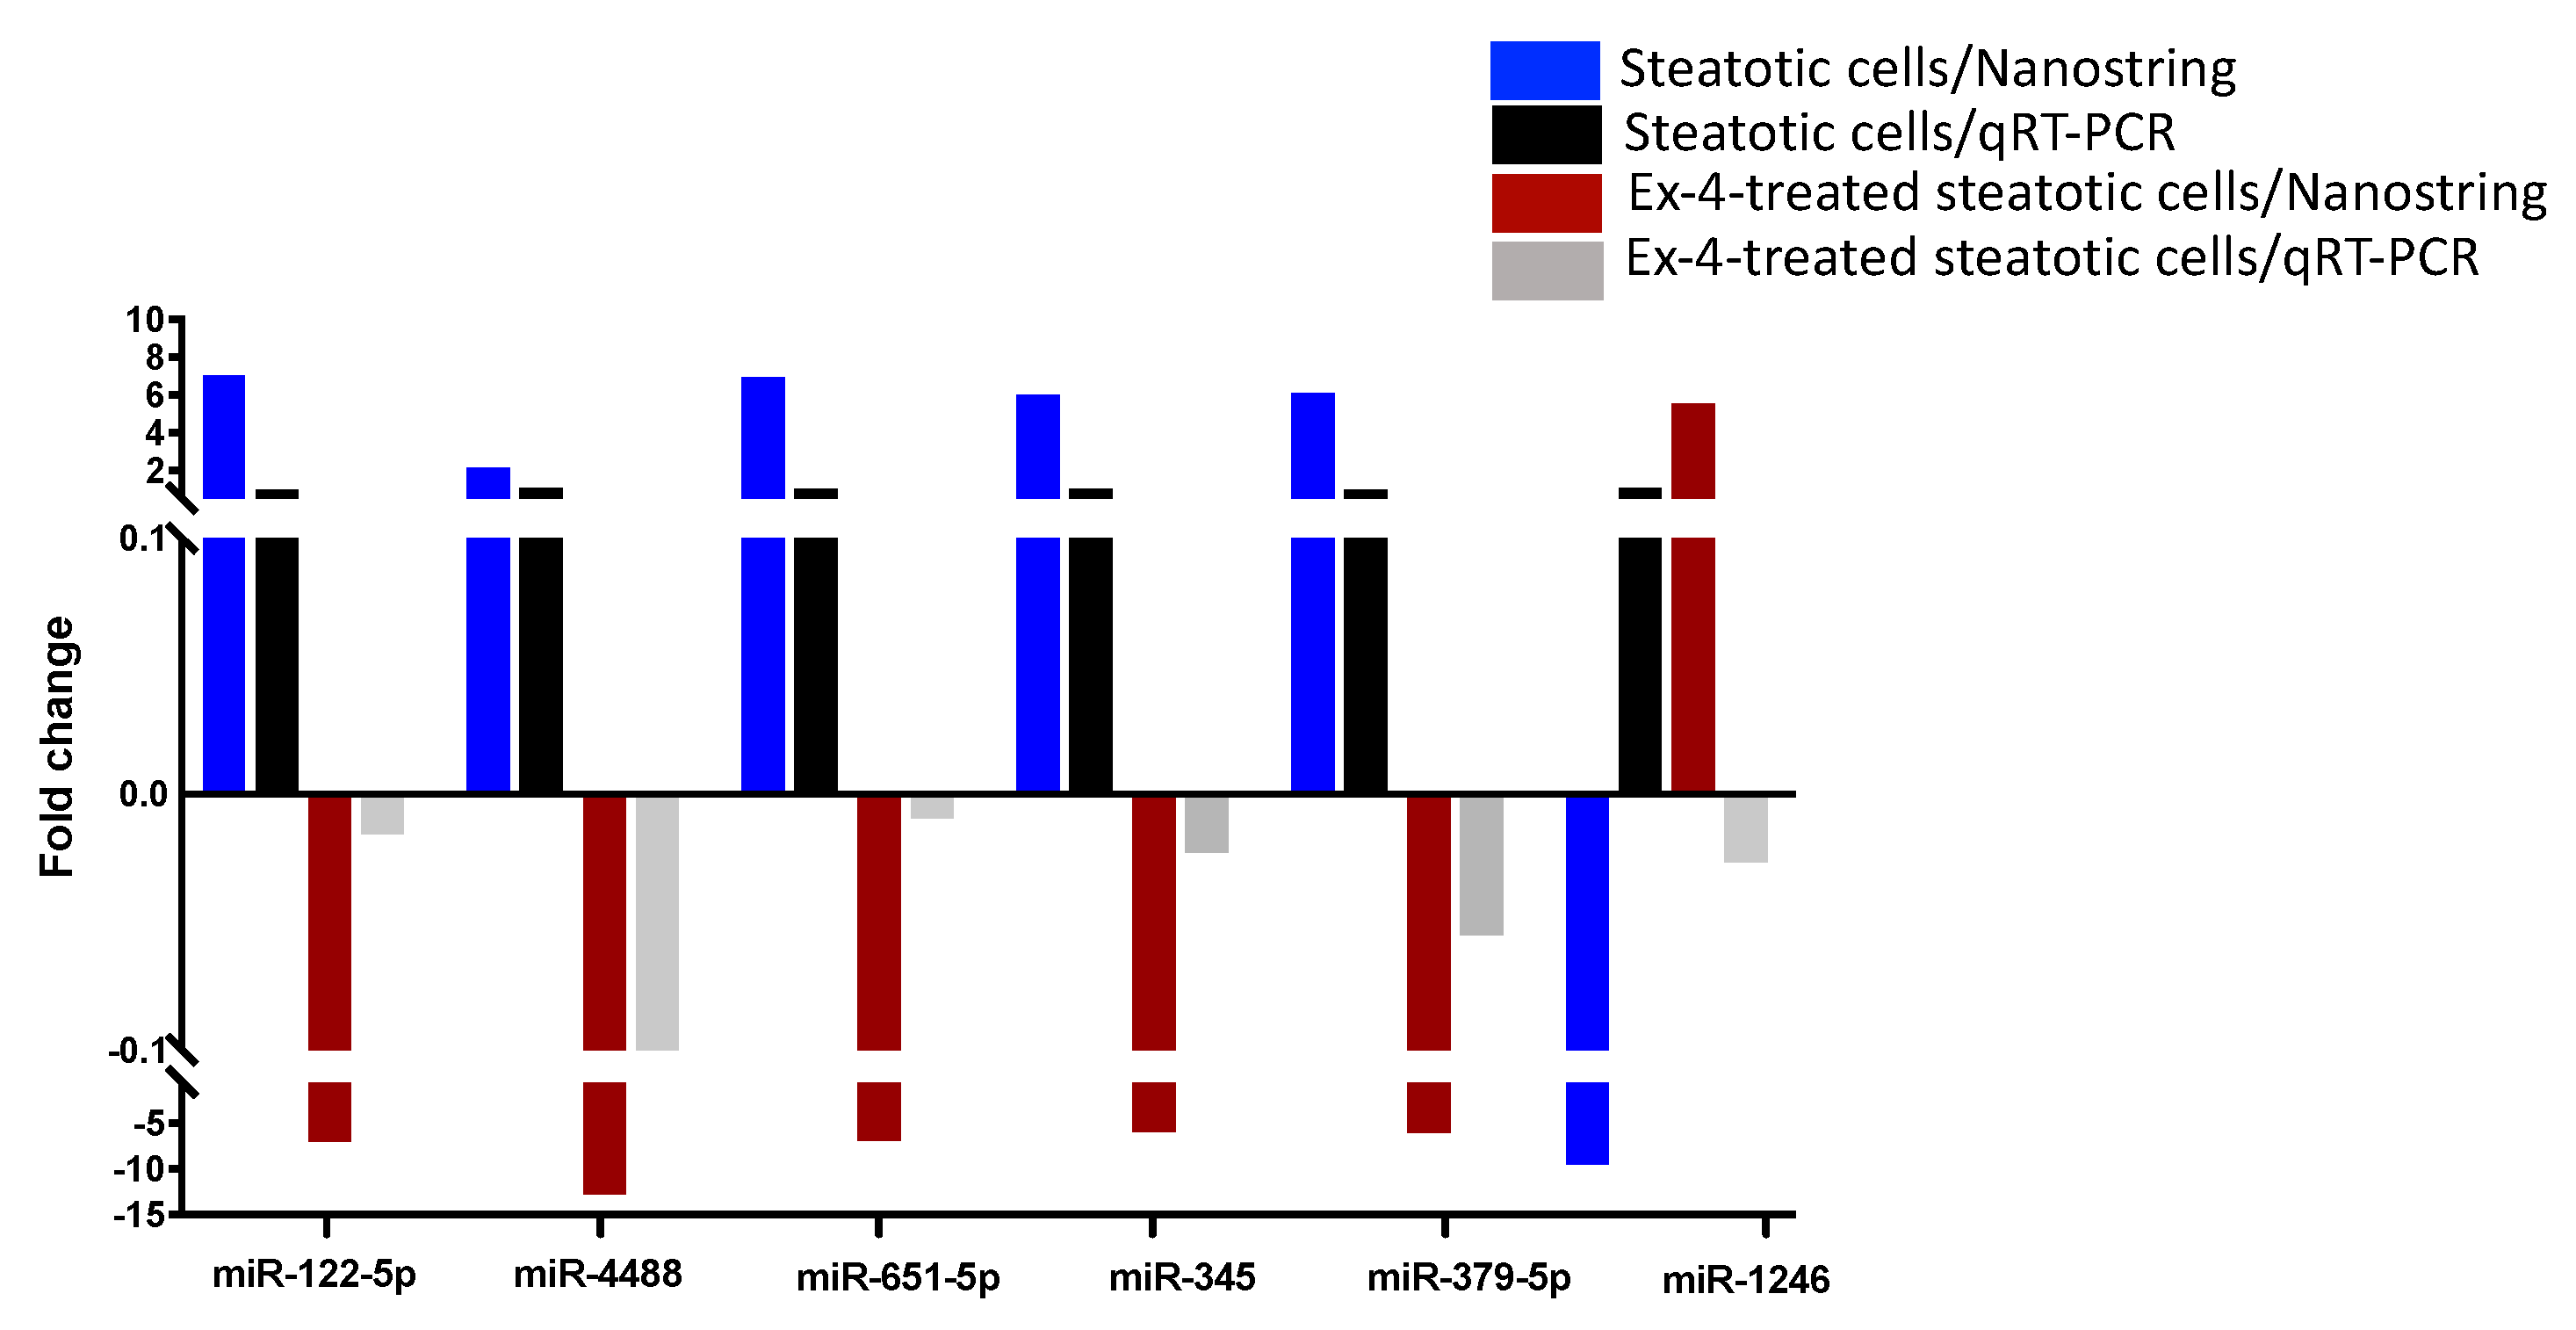
2.4. Validation of miRNA Differential Expression with qRT-PCR
3. Discussion
4. Material and Methods
4.1. HepG2 Culture and OA Preparation
4.2. Induction of Steatosis and Treatment with Exendin-4
4.3. Quantification of Steatosis
4.4. Total RNA Isolation
4.5. NanoString Analysis Platform and miRNA Profiling
4.6. Quantification Reverse Transcriptase PCR (qRT-PCR)
4.7. Statistical Analyses
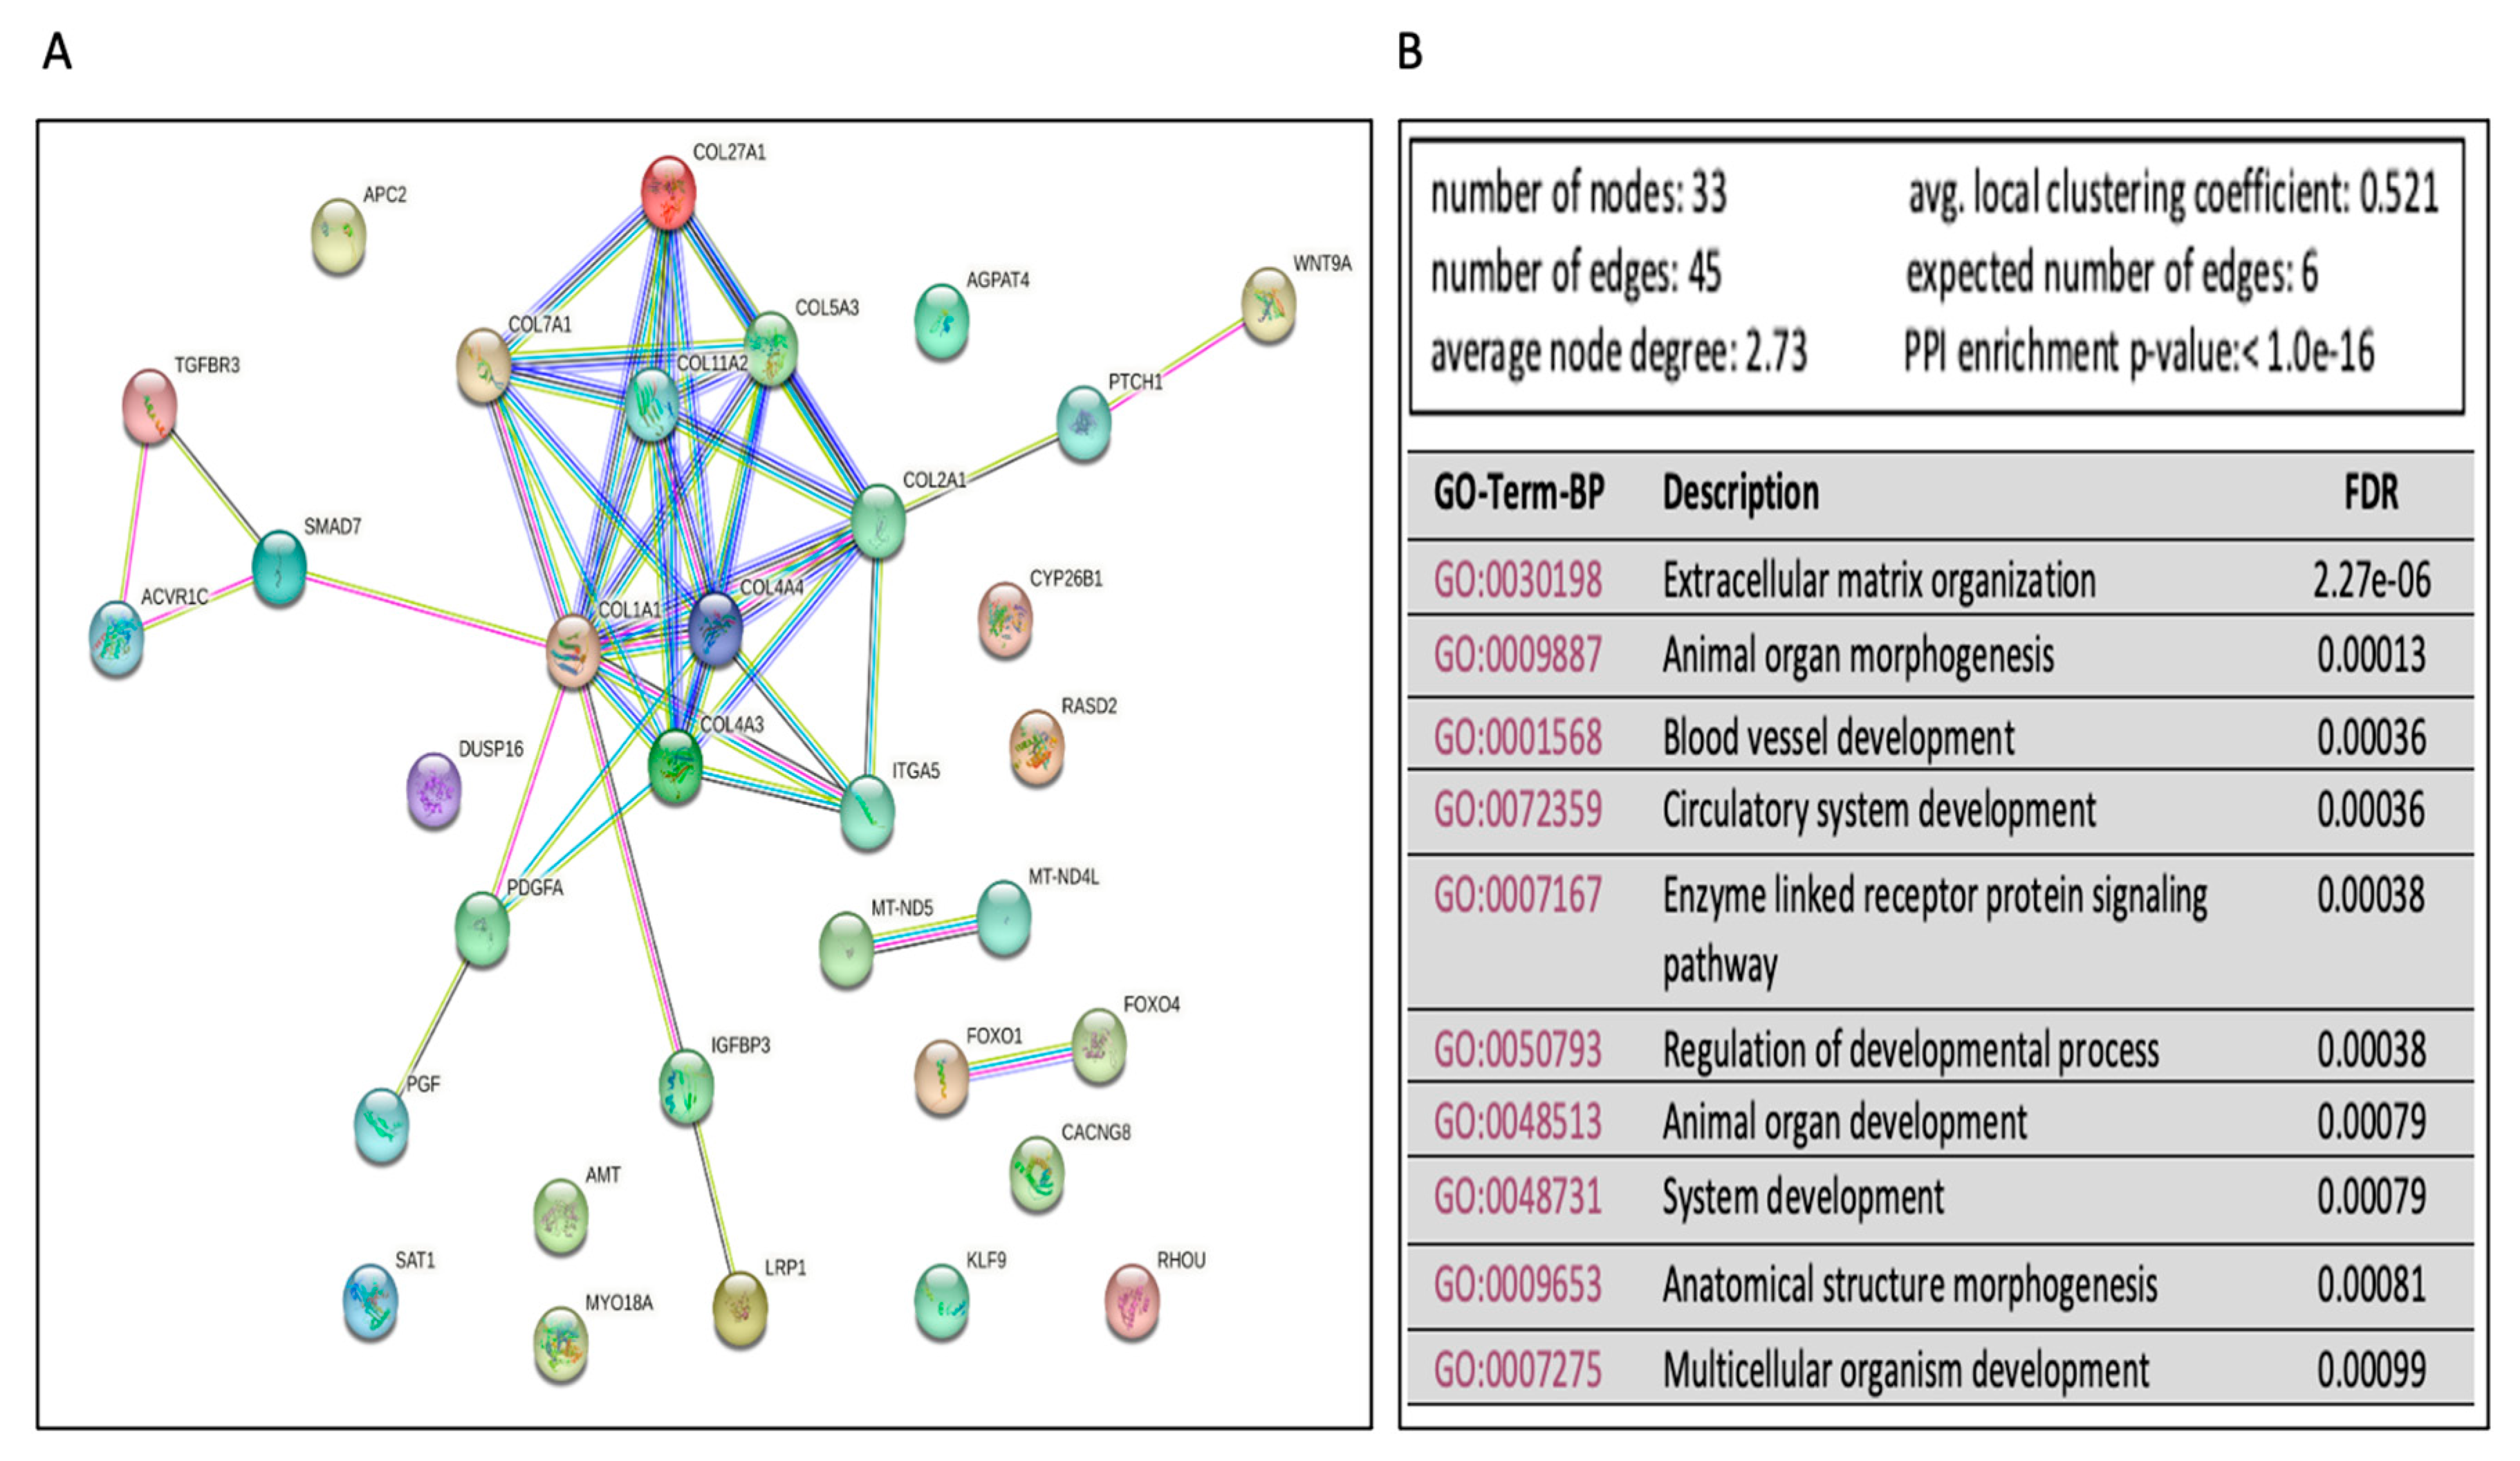
4.8. Functional, Biological Pathway, and Statistical Analysis
5. Conclusions
Supplementary Materials
Author Contributions
Funding
Institutional Review Board Statement
Informed Consent Statement
Data Availability Statement
Acknowledgments
Conflicts of Interest
References
- Perumpail, B.J.; Khan, M.A.; Yoo, E.R.; Cholankeril, G.; Kim, D.; Ahmed, A. Clinical epidemiology and disease burden of nonalcoholic fatty liver disease. World J. Gastroenterol. 2017, 23, 8263–8276. [Google Scholar] [CrossRef] [PubMed]
- Pouwels, S.; Sakran, N.; Graham, Y.; Leal, A.; Pintar, T.; Yang, W.; Kassir, R.; Singhal, R.; Mahawar, K.; Ramnarain, D. Non-alcoholic fatty liver disease (NAFLD): A review of pathophysiology, clinical management and effects of weight loss. BMC Endocr. Disord. 2022, 22, 63. [Google Scholar] [CrossRef] [PubMed]
- Vieira Barbosa, J.; Lai, M. Nonalcoholic Fatty Liver Disease Screening in Type 2 Diabetes Mellitus Patients in the Primary Care Setting. Hepatol. Commun. 2021, 5, 158–167. [Google Scholar] [CrossRef]
- Kitade, H.; Chen, G.; Ni, Y.; Ota, T. Nonalcoholic Fatty Liver Disease and Insulin Resistance: New Insights and Potential New Treatments. Nutrients 2017, 9, 387. [Google Scholar] [CrossRef]
- Noureddin, M.; Vipani, A.; Bresee, C.; Todo, T.; Kim, I.K.; Alkhouri, N.; Setiawan, V.W.; Tran, T.; Ayoub, W.S.; Lu, S.C.; et al. NASH Leading Cause of Liver Transplant in Women: Updated Analysis of Indications For Liver Transplant and Ethnic and Gender Variances. Am. J. Gastroenterol. 2018, 113, 1649–1659. [Google Scholar] [CrossRef]
- Francque, S.M.; Marchesini, G.; Kautz, A.; Walmsley, M.; Dorner, R.; Lazarus, J.V.; Zelber-Sagi, S.; Hallsworth, K.; Busetto, L.; Frühbeck, G.; et al. Non-alcoholic fatty liver disease: A patient guideline. JHEP Rep. 2021, 3, 100322. [Google Scholar] [CrossRef] [PubMed]
- Shaker, M.; Tabbaa, A.; Albeldawi, M.; Alkhouri, N. Liver transplantation for nonalcoholic fatty liver disease: New challenges and new opportunities. World J. Gastroenterol. 2014, 20, 5320–5330. [Google Scholar] [CrossRef]
- Pais, R.; Barritt, A.S.t.; Calmus, Y.; Scatton, O.; Runge, T.; Lebray, P.; Poynard, T.; Ratziu, V.; Conti, F. NAFLD and liver transplantation: Current burden and expected challenges. J. Hepatol. 2016, 65, 1245–1257. [Google Scholar] [CrossRef]
- Lazarus, J.V.; Mark, H.E.; Anstee, Q.M.; Arab, J.P.; Batterham, R.L.; Castera, L.; Cortez-Pinto, H.; Crespo, J.; Cusi, K.; Dirac, M.A.; et al. Advancing the global public health agenda for NAFLD: A consensus statement. Nat. Rev. Gastroenterol. Hepatol. 2022, 19, 60–78. [Google Scholar] [CrossRef]
- Yoo, E.R.; Sallam, S.; Perumpail, B.J.; Iqbal, U.; Shah, N.D.; Kwong, W.; Cholankeril, G.; Kim, D.; Ahmed, A. When to Initiate Weight Loss Medications in the NAFLD Population. Diseases 2018, 6, 91. [Google Scholar] [CrossRef]
- Hsu, C.C.; Ness, E.; Kowdley, K.V. Nutritional Approaches to Achieve Weight Loss in Nonalcoholic Fatty Liver Disease. Adv. Nutr. 2017, 8, 253–265. [Google Scholar] [CrossRef] [PubMed]
- Mantovani, A.; Dalbeni, A. Treatments for NAFLD: State of Art. Int. J. Mol. Sci. 2021, 22, 2350. [Google Scholar] [CrossRef] [PubMed]
- van der Windt, D.J.; Sud, V.; Zhang, H.; Tsung, A.; Huang, H. The Effects of Physical Exercise on Fatty Liver Disease. Gene Expr. J. Liver Res. 2018, 18, 89–101. [Google Scholar] [CrossRef] [PubMed]
- Hung, C.K.; Bodenheimer, H.C., Jr. Current Treatment of Nonalcoholic Fatty Liver Disease/Nonalcoholic Steatohepatitis. Clin. Liver Dis. 2018, 22, 175–187. [Google Scholar] [CrossRef]
- Vilar-Gomez, E.; Martinez-Perez, Y.; Calzadilla-Bertot, L.; Torres-Gonzalez, A.; Gra-Oramas, B.; Gonzalez-Fabian, L.; Friedman, S.L.; Diago, M.; Romero-Gomez, M. Weight Loss Through Lifestyle Modification Significantly Reduces Features of Nonalcoholic Steatohepatitis. Gastroenterology 2015, 149, 367–378.e365; quiz e314–365. [Google Scholar] [CrossRef]
- Brunner, K.T.; Henneberg, C.J.; Wilechansky, R.M.; Long, M.T. Nonalcoholic Fatty Liver Disease and Obesity Treatment. Curr. Obes. Rep. 2019, 8, 220–228. [Google Scholar] [CrossRef]
- Nauck, M.A.; Quast, D.R.; Wefers, J.; Meier, J.J. GLP-1 receptor agonists in the treatment of type 2 diabetes—State-of-the-art. Mol. Metab. 2021, 46, 101102. [Google Scholar] [CrossRef]
- Khalifa, O.; Al-Akl, N.S.; Errafii, K.; Arredouani, A. Exendin-4 alleviates steatosis in an in vitro cell model by lowering FABP1 and FOXA1 expression via the Wnt/-catenin signaling pathway. Sci. Rep. 2022, 12, 2226. [Google Scholar] [CrossRef]
- Zhang, F.; Chen, Z.; Wu, D.; Tian, L.; Chen, Q.; Ye, Y.; Chen, W.; Wu, X.; Wu, P.; Yuan, W.; et al. Recombinant human GLP-1 beinaglutide regulates lipid metabolism of adipose tissues in diet-induced obese mice. iScience 2021, 24, 103382. [Google Scholar] [CrossRef]
- Lee, R.C.; Feinbaum, R.L.; Ambros, V. The C. elegans heterochronic gene lin-4 encodes small RNAs with antisense complementarity to lin-14. Cell 1993, 75, 843–854. [Google Scholar] [CrossRef]
- Smith-Vikos, T.; Slack, F.J. MicroRNAs and their roles in aging. J. Cell Sci. 2012, 125, 7–17. [Google Scholar] [CrossRef]
- Aryal, B.; Singh, A.K.; Rotllan, N.; Price, N.; Fernandez-Hernando, C. MicroRNAs and lipid metabolism. Curr. Opin. Lipidol. 2017, 28, 273–280. [Google Scholar] [CrossRef] [PubMed]
- Fang, Z.; Dou, G.; Wang, L. MicroRNAs in the Pathogenesis of Nonalcoholic Fatty Liver Disease. Int. J. Biol. Sci. 2021, 17, 1851–1863. [Google Scholar] [CrossRef] [PubMed]
- Leti, F.; Malenica, I.; Doshi, M.; Courtright, A.; Van Keuren-Jensen, K.; Legendre, C.; Still, C.D.; Gerhard, G.S.; DiStefano, J.K. High-throughput sequencing reveals altered expression of hepatic microRNAs in nonalcoholic fatty liver disease-related fibrosis. Transl. Res. 2015, 166, 304–314. [Google Scholar] [CrossRef] [PubMed]
- Di Mauro, S.; Ragusa, M.; Urbano, F.; Filippello, A.; Di Pino, A.; Scamporrino, A.; Pulvirenti, A.; Ferro, A.; Rabuazzo, A.M.; Purrello, M.; et al. Intracellular and extracellular miRNome deregulation in cellular models of NAFLD or NASH: Clinical implications. Nutr. Metab. Cardiovasc. Dis. 2016, 26, 1129–1139. [Google Scholar] [CrossRef] [PubMed]
- Okamoto, K.; Koda, M.; Okamoto, T.; Onoyama, T.; Miyoshi, K.; Kishina, M.; Kato, J.; Tokunaga, S.; Sugihara, T.A.; Hara, Y.; et al. A Series of microRNA in the Chromosome 14q32.2 Maternally Imprinted Region Related to Progression of Non-Alcoholic Fatty Liver Disease in a Mouse Model. PLoS ONE 2016, 11, e0154676. [Google Scholar] [CrossRef]
- Okamoto, Y.; Tanaka, S.; Haga, Y. Enhanced GLUT2 gene expression in an oleic acid-induced in vitro fatty liver model. Hepatol. Res. 2002, 23, 138–144. [Google Scholar] [CrossRef]
- Errafii, K.; Khalifa, O.; Al-Akl, N.S.; Arredouani, A. Comparative Transcriptome Analysis Reveals That Exendin-4 Improves Steatosis in HepG2 Cells by Modulating Signaling Pathways Related to Lipid Metabolism. Biomedicines 2022, 10, 1020. [Google Scholar] [CrossRef]
- Khalifa, O.; HMroue, K.; Mall, R.; Ullah, E.; SAl-Akl, N.; Arredouani, A. Investigation of the Effect of Exendin-4 on Oleic Acid-Induced Steatosis in HepG2 Cells Using Fourier Transform Infrared Spectroscopy. Biomedicines 2022, 10, 2652. [Google Scholar] [CrossRef]
- Szklarczyk, D.; Gable, A.L.; Nastou, K.C.; Lyon, D.; Kirsch, R.; Pyysalo, S.; Doncheva, N.T.; Legeay, M.; Fang, T.; Bork, P.; et al. The STRING database in 2021: Customizable protein-protein networks, and functional characterization of user-uploaded gene/measurement sets. Nucleic Acids Res. 2021, 49, D605–D612. [Google Scholar] [CrossRef]
- Sarwar, R.; Pierce, N.; Koppe, S. Obesity and nonalcoholic fatty liver disease: Current perspectives. Diabetes Metab. Syndr. Obes. 2018, 11, 533–542. [Google Scholar] [CrossRef]
- Seghieri, M.; Christensen, A.S.; Andersen, A.; Solini, A.; Knop, F.K.; Vilsbøll, T. Future Perspectives on GLP-1 Receptor Agonists and GLP-1/glucagon Receptor Co-agonists in the Treatment of NAFLD. Front. Endocrinol. 2018, 9, 649. [Google Scholar] [CrossRef] [PubMed]
- Wong, C.; Lee, M.H.; Yaow, C.Y.L.; Chin, Y.H.; Goh, X.L.; Ng, C.H.; Lim, A.Y.L.; Muthiah, M.D.; Khoo, C.M. Glucagon-Like Peptide-1 Receptor Agonists for Non-Alcoholic Fatty Liver Disease in Type 2 Diabetes: A Meta-Analysis. Front. Endocrinol. 2021, 12, 609110. [Google Scholar] [CrossRef] [PubMed]
- Patel Chavez, C.; Cusi, K.; Kadiyala, S. The Emerging Role of Glucagon-like Peptide-1 Receptor Agonists for the Management of NAFLD. J. Clin. Endocrinol. Metab. 2022, 107, 29–38. [Google Scholar] [CrossRef]
- Dougherty, J.A.; Guirguis, E.; Thornby, K.A. A Systematic Review of Newer Antidiabetic Agents in the Treatment of Nonalcoholic Fatty Liver Disease. Ann. Pharmacother. 2021, 55, 65–79. [Google Scholar] [CrossRef] [PubMed]
- Zafar, Y.; Rashid, A.M.; Siddiqi, A.K.; Ellahi, A.; Ahmed, A.; Hussain, H.U.; Ahmed, F.; Menezes, R.G.; Siddiqi, T.J.; Maniya, M.T. Effect of novel glucose lowering agents on non-alcoholic fatty liver disease: A systematic review and meta-analysis. Clin. Res. Hepatol. Gastroenterol. 2022, 46, 101970. [Google Scholar] [CrossRef]
- Rowlands, J.; Heng, J.; Newsholme, P.; Carlessi, R. Pleiotropic Effects of GLP-1 and Analogs on Cell Signaling, Metabolism, and Function. Front. Endocrinol. 2018, 9, 672. [Google Scholar] [CrossRef]
- Gupta, N.A.; Mells, J.; Dunham, R.M.; Grakoui, A.; Handy, J.; Saxena, N.K.; Anania, F.A. Glucagon-like peptide-1 receptor is present on human hepatocytes and has a direct role in decreasing hepatic steatosis in vitro by modulating elements of the insulin signaling pathway. Hepatology 2010, 51, 1584–1592. [Google Scholar] [CrossRef]
- Yokomori, H.; Ando, W. Spatial expression of glucagon-like peptide 1 receptor and caveolin-1 in hepatocytes with macrovesicular steatosis in non-alcoholic steatohepatitis. BMJ Open Gastroenterol. 2020, 7, e000370. [Google Scholar] [CrossRef]
- Körner, M.; Stöckli, M.; Waser, B.; Reubi, J.C. GLP-1 receptor expression in human tumors and human normal tissues: Potential for in vivo targeting. J. Nucl. Med. 2007, 48, 736–743. [Google Scholar] [CrossRef]
- López-Pastor, A.R.; Infante-Menéndez, J.; Escribano, Ó.; Gómez-Hernández, A. miRNA Dysregulation in the Development of Non-Alcoholic Fatty Liver Disease and the Related Disorders Type 2 Diabetes Mellitus and Cardiovascular Disease. Front. Med. 2020, 7, 527059. [Google Scholar] [CrossRef] [PubMed]
- Lin, H.Y.; Yang, Y.L.; Wang, P.W.; Wang, F.S.; Huang, Y.H. The Emerging Role of MicroRNAs in NAFLD: Highlight of MicroRNA-29a in Modulating Oxidative Stress, Inflammation, and Beyond. Cells 2020, 9, 1041. [Google Scholar] [CrossRef] [PubMed]
- Gjorgjieva, M.; Sobolewski, C.; Dolicka, D.; Correia de Sousa, M.; Foti, M. miRNAs and NAFLD: From pathophysiology to therapy. Gut 2019, 68, 2065–2079. [Google Scholar] [CrossRef] [PubMed]
- Kazeminasab, F.; Baharlooie, M.; Ghaedi, K. Noncoding RNAs Associated with PPARs in Etiology of MAFLD as a Novel Approach for Therapeutics Targets. PPAR Res. 2022, 2022, 6161694. [Google Scholar] [CrossRef]
- Jansson, M.D.; Lund, A.H. MicroRNA and cancer. Mol. Oncol. 2012, 6, 590–610. [Google Scholar] [CrossRef]
- Khalifa, O.; Errafii, K.; Al-Akl, N.S.; Arredouani, A. Noncoding RNAs in Nonalcoholic Fatty Liver Disease: Potential Diagnosis and Prognosis Biomarkers. Dis. Markers 2020, 2020, 8822859. [Google Scholar] [CrossRef]
- Long, J.K.; Dai, W.; Zheng, Y.W.; Zhao, S.P. miR-122 promotes hepatic lipogenesis via inhibiting the LKB1/AMPK pathway by targeting Sirt1 in non-alcoholic fatty liver disease. Mol. Med. 2019, 25, 26. [Google Scholar] [CrossRef]
- Inomata, Y.; Oh, J.W.; Taniguchi, K.; Sugito, N.; Kawaguchi, N.; Hirokawa, F.; Lee, S.W.; Akao, Y.; Takai, S.; Kim, K.P.; et al. Downregulation of miR-122-5p Activates Glycolysis via PKM2 in Kupffer Cells of Rat and Mouse Models of Non-Alcoholic Steatohepatitis. Int. J. Mol. Sci. 2022, 23, 5230. [Google Scholar] [CrossRef]
- Hu, Y.; Peng, X.; Du, G.; Zhang, Z.; Zhai, Y.; Xiong, X.; Luo, X. MicroRNA-122-5p Inhibition Improves Inflammation and Oxidative Stress Damage in Dietary-Induced Non-alcoholic Fatty Liver Disease Through Targeting FOXO3. Front. Physiol. 2022, 13, 803445. [Google Scholar] [CrossRef]
- Yamada, H.; Suzuki, K.; Ichino, N.; Ando, Y.; Sawada, A.; Osakabe, K.; Sugimoto, K.; Ohashi, K.; Teradaira, R.; Inoue, T.; et al. Associations between circulating microRNAs (miR-21, miR-34a, miR-122 and miR-451) and non-alcoholic fatty liver. Clin. Chim. Acta 2013, 424, 99–103. [Google Scholar] [CrossRef]
- Nakao, K.; Miyaaki, H.; Ichikawa, T. Antitumor function of microRNA-122 against hepatocellular carcinoma. J. Gastroenterol. 2014, 49, 589–593. [Google Scholar] [CrossRef]
- Lin, C.J.; Hu, Z.G.; Yuan, G.D.; Lei, B.; He, S.Q. Complements are involved in alcoholic fatty liver disease, hepatitis and fibrosis. World J. Hepatol. 2018, 10, 662–669. [Google Scholar] [CrossRef] [PubMed]
- Wang, P.; Fang, Y.; Qiu, J.; Zhou, Y.; Wang, Z.; Jiang, C. miR-345-5p curbs hepatic stellate cell activation and liver fibrosis progression by suppressing hypoxia-inducible factor-1alpha expression. Toxicol. Lett. 2022, 370, 42–52. [Google Scholar] [CrossRef] [PubMed]
- Feng, J.; Qiu, S.; Zhou, S.; Tan, Y.; Bai, Y.; Cao, H.; Guo, J.; Su, Z. mTOR: A Potential New Target in Nonalcoholic Fatty Liver Disease. Int. J. Mol. Sci. 2022, 23, 9196. [Google Scholar] [CrossRef] [PubMed]
- Arora, M.; Kutinová Canová, N.; Farghali, H. mTOR as an eligible molecular target for possible pharmacological treatment of nonalcoholic steatohepatitis. Eur. J. Pharmacol. 2022, 921, 174857. [Google Scholar] [CrossRef]
- Mesarwi, O.A.; Shin, M.K.; Bevans-Fonti, S.; Schlesinger, C.; Shaw, J.; Polotsky, V.Y. Hepatocyte Hypoxia Inducible Factor-1 Mediates the Development of Liver Fibrosis in a Mouse Model of Nonalcoholic Fatty Liver Disease. PLoS ONE 2016, 11, e0168572. [Google Scholar] [CrossRef]
- Han, J.; He, Y.; Zhao, H.; Xu, X. Hypoxia inducible factor-1 promotes liver fibrosis in nonalcoholic fatty liver disease by activating PTEN/p65 signaling pathway. J. Cell Biochem. 2019, 120, 14735–14744. [Google Scholar] [CrossRef]
- Holzner, L.M.W.; Murray, A.J. Hypoxia-Inducible Factors as Key Players in the Pathogenesis of Non-alcoholic Fatty Liver Disease and Non-alcoholic Steatohepatitis. Front. Med. 2021, 8, 753268. [Google Scholar] [CrossRef]
- Okamoto, K.; Koda, M.; Okamoto, T.; Onoyama, T.; Miyoshi, K.; Kishina, M.; Matono, T.; Kato, J.; Tokunaga, S.; Sugihara, T.; et al. Serum miR-379 expression is related to the development and progression of hypercholesterolemia in non-alcoholic fatty liver disease. PLoS ONE 2020, 15, e0219412. [Google Scholar] [CrossRef]
- de Guia, R.M.; Rose, A.J.; Sommerfeld, A.; Seibert, O.; Strzoda, D.; Zota, A.; Feuchter, Y.; Krones-Herzig, A.; Sijmonsma, T.; Kirilov, M.; et al. microRNA-379 couples glucocorticoid hormones to dysfunctional lipid homeostasis. EMBO J. 2015, 34, 344–360. [Google Scholar] [CrossRef]
- Cao, C.; Duan, P.; Li, W.; Guo, Y.; Zhang, J.; Gui, Y.; Yuan, S. Lack of miR-379/miR-544 Cluster Resists High-Fat Diet-Induced Obesity and Prevents Hepatic Triglyceride Accumulation in Mice. Front. Cell Dev. Biol. 2021, 9, 720900. [Google Scholar] [CrossRef] [PubMed]
- Dong, Y.; Yu, C.; Ma, N.; Xu, X.; Wu, Q.; Lu, H.; Gong, L.; Chen, J.; Ren, J. MicroRNA-379-5p regulates free cholesterol accumulation and relieves diet induced-liver damage in db/db mice via STAT1/HMGCS1 axis. Mol. Biomed. 2022, 3, 25. [Google Scholar] [CrossRef]
- Wang, C.H.; Liu, H.M.; Chang, Z.Y.; Huang, T.H.; Lee, T.Y. Losartan Prevents Hepatic Steatosis and Macrophage Polarization by Inhibiting HIF-1α in a Murine Model of NAFLD. Int. J. Mol. Sci. 2021, 22, 7841. [Google Scholar] [CrossRef] [PubMed]
- Mesarwi, O.A.; Moya, E.A.; Zhen, X.; Gautane, M.; Zhao, H.; Wegbrans Giró, P.; Alshebli, M.; McCarley, K.E.; Breen, E.C.; Malhotra, A. Hepatocyte HIF-1 and Intermittent Hypoxia Independently Impact Liver Fibrosis in Murine Nonalcoholic Fatty Liver Disease. Am. J. Respir. Cell Mol. Biol. 2021, 65, 390–402. [Google Scholar] [CrossRef]
- He, Y.; Yang, W.; Gan, L.; Liu, S.; Ni, Q.; Bi, Y.; Han, T.; Liu, Q.; Chen, H.; Hu, Y.; et al. Silencing HIF-1α aggravates non-alcoholic fatty liver disease in vitro through inhibiting PPAR-α/ANGPTL4 singling pathway. Gastroenterol. Hepatol. 2021, 44, 355–365. [Google Scholar] [CrossRef]
- Seo, M.H.; Lee, J.; Hong, S.W.; Rhee, E.J.; Park, S.E.; Park, C.Y.; Oh, K.W.; Park, S.W.; Lee, W.Y. Exendin-4 Inhibits Hepatic Lipogenesis by Increasing β-Catenin Signaling. PLoS ONE 2016, 11, e0166913. [Google Scholar] [CrossRef]
- Meyer, G.; Leipprandt, J.; Xie, J.; Aupperlee, M.D.; Haslam, S.Z. A potential role of progestin-induced laminin-5/α6-integrin signaling in the formation of side branches in the mammary gland. Endocrinology 2012, 153, 4990–5001. [Google Scholar] [CrossRef]
- Nair, B.; Nath, L.R. Inevitable role of TGF-β1 in progression of nonalcoholic fatty liver disease. J. Recept. Signal Transduct. Res. 2020, 40, 195–200. [Google Scholar] [CrossRef]
- Fougerat, A.; Montagner, A.; Loiseau, N.; Guillou, H.; Wahli, W. Peroxisome Proliferator-Activated Receptors and Their Novel Ligands as Candidates for the Treatment of Non-Alcoholic Fatty Liver Disease. Cells 2020, 9, 1638. [Google Scholar] [CrossRef] [PubMed]
- Hardwick, J.P.; Osei-Hyiaman, D.; Wiland, H.; Abdelmegeed, M.A.; Song, B.J. PPAR/RXR Regulation of Fatty Acid Metabolism and Fatty Acid omega-Hydroxylase (CYP4) Isozymes: Implications for Prevention of Lipotoxicity in Fatty Liver Disease. PPAR Res. 2009, 2009, 952734. [Google Scholar] [CrossRef]
- Daniel, P.V.; Dogra, S.; Rawat, P.; Choubey, A.; Khan, A.S.; Rajak, S.; Kamthan, M.; Mondal, P. NF-κB p65 regulates hepatic lipogenesis by promoting nuclear entry of ChREBP in response to a high carbohydrate diet. J. Biol. Chem. 2021, 296, 100714. [Google Scholar] [CrossRef] [PubMed]
- Dongiovanni, P.; Valenti, L.; Rametta, R.; Daly, A.K.; Nobili, V.; Mozzi, E.; Leathart, J.B.; Pietrobattista, A.; Burt, A.D.; Maggioni, M.; et al. Genetic variants regulating insulin receptor signalling are associated with the severity of liver damage in patients with non-alcoholic fatty liver disease. Gut 2010, 59, 267–273. [Google Scholar] [CrossRef] [PubMed]
- Matsuda, S.; Kobayashi, M.; Kitagishi, Y. Roles for PI3K/AKT/PTEN Pathway in Cell Signaling of Nonalcoholic Fatty Liver Disease. ISRN Endocrinol. 2013, 2013, 472432. [Google Scholar] [CrossRef] [PubMed]
- Yang, P.; Liang, Y.; Luo, Y.; Li, Z.; Wen, Y.; Shen, J.; Li, R.; Zheng, H.; Gu, H.F.; Xia, N. Liraglutide ameliorates nonalcoholic fatty liver disease in diabetic mice via the IRS2/PI3K/Akt signaling pathway. Diabetes Metab. Syndr. Obes. 2019, 12, 1013–1021. [Google Scholar] [CrossRef]
- Vinciguerra, M.; Veyrat-Durebex, C.; Moukil, M.A.; Rubbia-Brandt, L.; Rohner-Jeanrenaud, F.; Foti, M. PTEN down-regulation by unsaturated fatty acids triggers hepatic steatosis via an NF-kappaBp65/mTOR-dependent mechanism. Gastroenterology 2008, 134, 268–280. [Google Scholar] [CrossRef]
- Dattaroy, D.; Pourhoseini, S.; Das, S.; Alhasson, F.; Seth, R.K.; Nagarkatti, M.; Michelotti, G.A.; Diehl, A.M.; Chatterjee, S. Micro-RNA 21 inhibition of SMAD7 enhances fibrogenesis via leptin-mediated NADPH oxidase in experimental and human nonalcoholic steatohepatitis. Am. J. Physiol. Gastrointest. Liver Physiol. 2015, 308, G298–G312. [Google Scholar] [CrossRef]
- Wree, A.; Eguchi, A.; McGeough, M.D.; Pena, C.A.; Johnson, C.D.; Canbay, A.; Hoffman, H.M.; Feldstein, A.E. NLRP3 inflammasome activation results in hepatocyte pyroptosis, liver inflammation, and fibrosis in mice. Hepatology 2014, 59, 898–910. [Google Scholar] [CrossRef]
- Hernandez-Gea, V.; Friedman, S.L. Pathogenesis of liver fibrosis. Annu. Rev. Pathol. 2011, 6, 425–456. [Google Scholar] [CrossRef]
- Miura, K.; Yang, L.; van Rooijen, N.; Ohnishi, H.; Seki, E. Hepatic recruitment of macrophages promotes nonalcoholic steatohepatitis through CCR2. Am. J. Physiol. Gastrointest. Liver Physiol. 2012, 302, G1310–G1321. [Google Scholar] [CrossRef]
- Marra, F.; Svegliati-Baroni, G. Lipotoxicity and the gut-liver axis in NASH pathogenesis. J. Hepatol. 2018, 68, 280–295. [Google Scholar] [CrossRef]
- Alkhatatbeh, M.J.; Lincz, L.F.; Thorne, R.F. Low simvastatin concentrations reduce oleic acid-induced steatosis in HepG(2) cells: An in vitro model of non-alcoholic fatty liver disease. Exp. Ther. Med. 2016, 11, 1487–1492. [Google Scholar] [CrossRef] [PubMed]


| miRNAs | Expression Direction in OA | Target mRNA * | Expression Direction in OA |
|---|---|---|---|
| hsa-miR-122-5p | Up | MASP1 | Down |
| hsa-miR-4488 | Up | CLDN6, FXYD1, IGF2, INHA, RASD1, RHOB, SEMA3G, SIT1 | Down |
| hsa-miR-1246 | Down | CCNG2 | Up |
| hsa-miR-30e-5p | Down | COL13A1, LHX1 | Up |
| hsa-miR-345-5p | Up | RPS21 | Down |
| hsa-miR-379-5p | Up | GPX3, SIT1 | Down |
| miRNAs | Expression Direction in Ex-4 | Target mRNA * | Expression Direction in Ex-4 |
|---|---|---|---|
| hsa-let-7c-5p | Down | ACVR1C, AMT, COL1A1, COL27A1, DUSP16, MT-ND4L, TGFBR3, WNT9A | Up |
| hsa-miR-4488 | Down | APC2, COL2A1, CYP26B1, ITGA5, LRP1, TIAF1, PTCH1 | Up |
| hsa-miR-140-5p | Down | KLF9, MT-ND4L, MT-ND5, RHOU, WNT9A | Up |
| hsa-miR-181a-3p | Down | AGPAT4 | Up |
| hsa-miR-197-3p | Down | CACNG8, IGFBP3 | Up |
| hsa-miR-21-5p | Down | SMAD7 | Up |
| hsa-miR-26b-5p | Down | RHOU | Up |
| hsa-miR-29c-3p | Down | AGPAT4, COL1A1, COL27A1, COL2A1, COL1A1, OL1A27A1, COL2A1, COL4A3, COL4A4, COL5A5, COL7A1, PDGFA | Up |
| hsa-miR-331-3p | Down | COL11A2, PGF | Up |
| hsa-miR-342-3p | Down | AGPAT4 | Up |
| hsa-miR-345-5p | Down | SAT1 | Up |
| hsa-miR-4286 | Down | FOXO4 | Up |
| hsa-miR-4532 | Down | RASD2 | Up |
| hsa-miR-96-5p | Down | FOXO1, SMAD7 | Up |
Disclaimer/Publisher’s Note: The statements, opinions and data contained in all publications are solely those of the individual author(s) and contributor(s) and not of MDPI and/or the editor(s). MDPI and/or the editor(s) disclaim responsibility for any injury to people or property resulting from any ideas, methods, instructions or products referred to in the content. |
© 2023 by the authors. Licensee MDPI, Basel, Switzerland. This article is an open access article distributed under the terms and conditions of the Creative Commons Attribution (CC BY) license (https://creativecommons.org/licenses/by/4.0/).
Share and Cite
Khalifa, O.; Ouararhni, K.; Errafii, K.; Alajez, N.M.; Arredouani, A. Targeted MicroRNA Profiling Reveals That Exendin-4 Modulates the Expression of Several MicroRNAs to Reduce Steatosis in HepG2 Cells. Int. J. Mol. Sci. 2023, 24, 11606. https://doi.org/10.3390/ijms241411606
Khalifa O, Ouararhni K, Errafii K, Alajez NM, Arredouani A. Targeted MicroRNA Profiling Reveals That Exendin-4 Modulates the Expression of Several MicroRNAs to Reduce Steatosis in HepG2 Cells. International Journal of Molecular Sciences. 2023; 24(14):11606. https://doi.org/10.3390/ijms241411606
Chicago/Turabian StyleKhalifa, Olfa, Khalid Ouararhni, Khaoula Errafii, Nehad M. Alajez, and Abdelilah Arredouani. 2023. "Targeted MicroRNA Profiling Reveals That Exendin-4 Modulates the Expression of Several MicroRNAs to Reduce Steatosis in HepG2 Cells" International Journal of Molecular Sciences 24, no. 14: 11606. https://doi.org/10.3390/ijms241411606
APA StyleKhalifa, O., Ouararhni, K., Errafii, K., Alajez, N. M., & Arredouani, A. (2023). Targeted MicroRNA Profiling Reveals That Exendin-4 Modulates the Expression of Several MicroRNAs to Reduce Steatosis in HepG2 Cells. International Journal of Molecular Sciences, 24(14), 11606. https://doi.org/10.3390/ijms241411606