
Tumor-Suppressive and Immunomodulating Activity of miR-30a-3p and miR-30e-3p in HNSCC Cells and Tumoroids
 , , , , , and
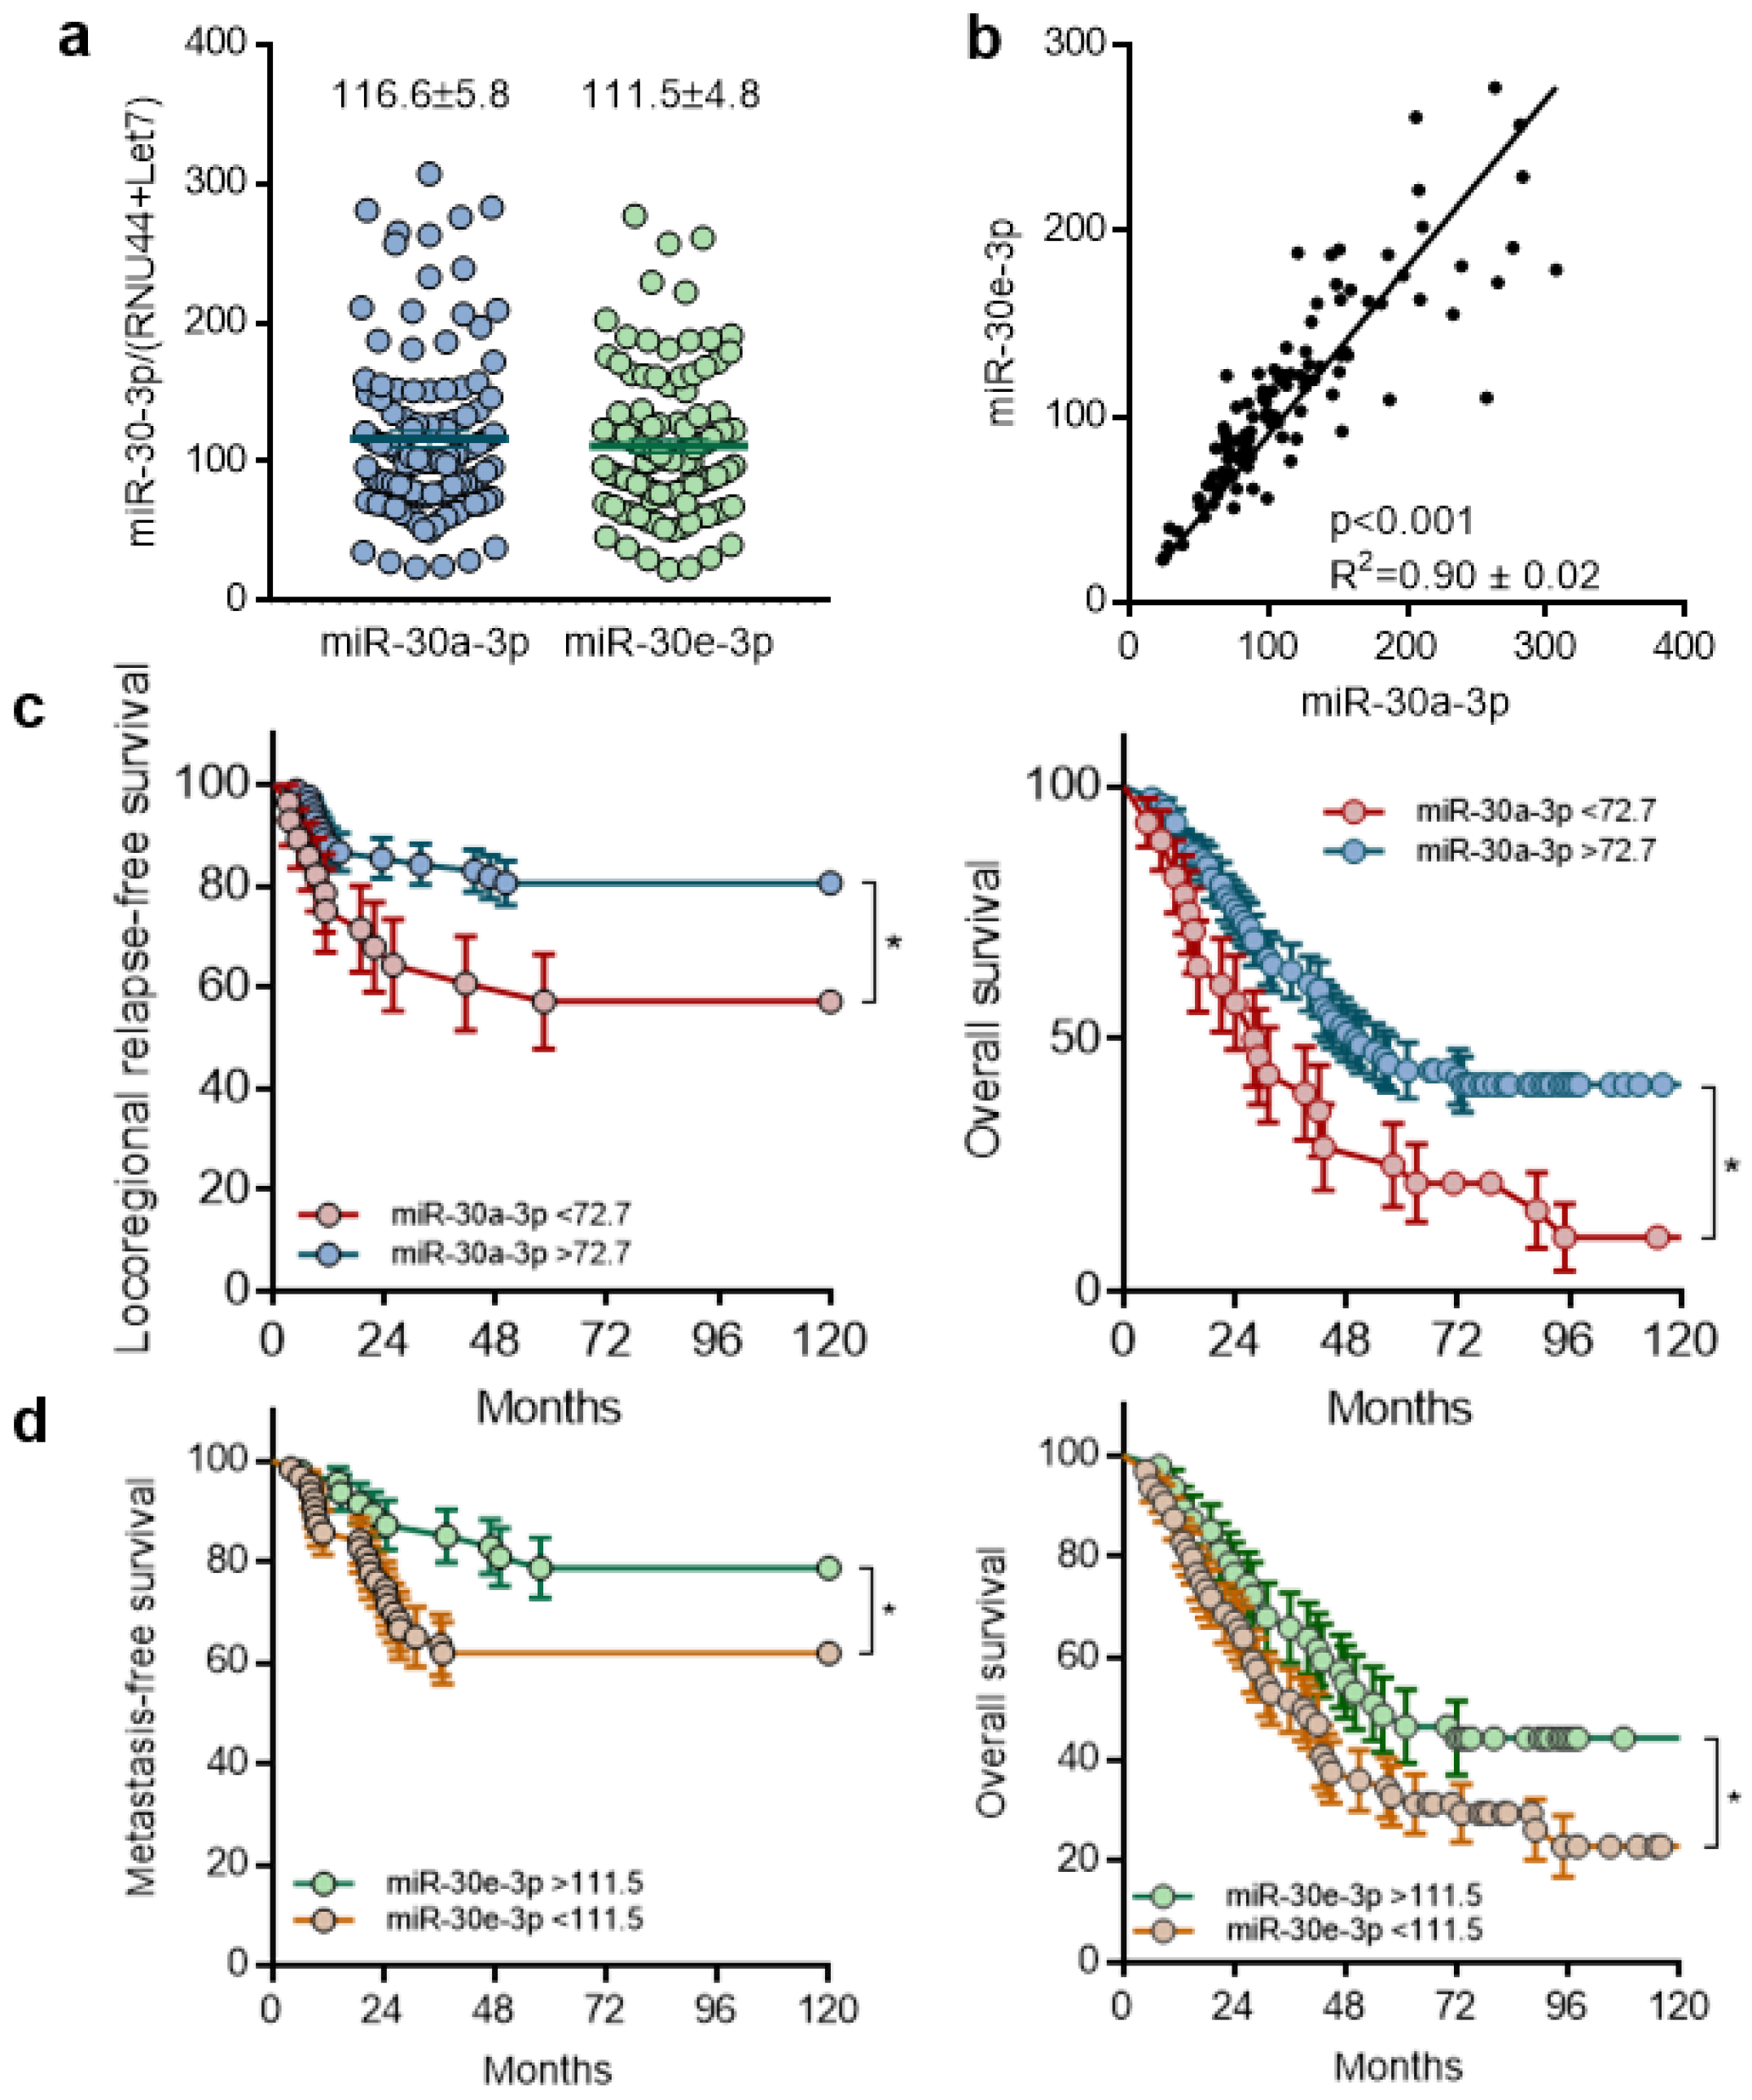
Abstract
1. Introduction
2. Results
2.1. Expression of miR-30-3p in HNSCC Tumors Is Correlated with Good Prognosis and Is Associated with Increased Overall Survival
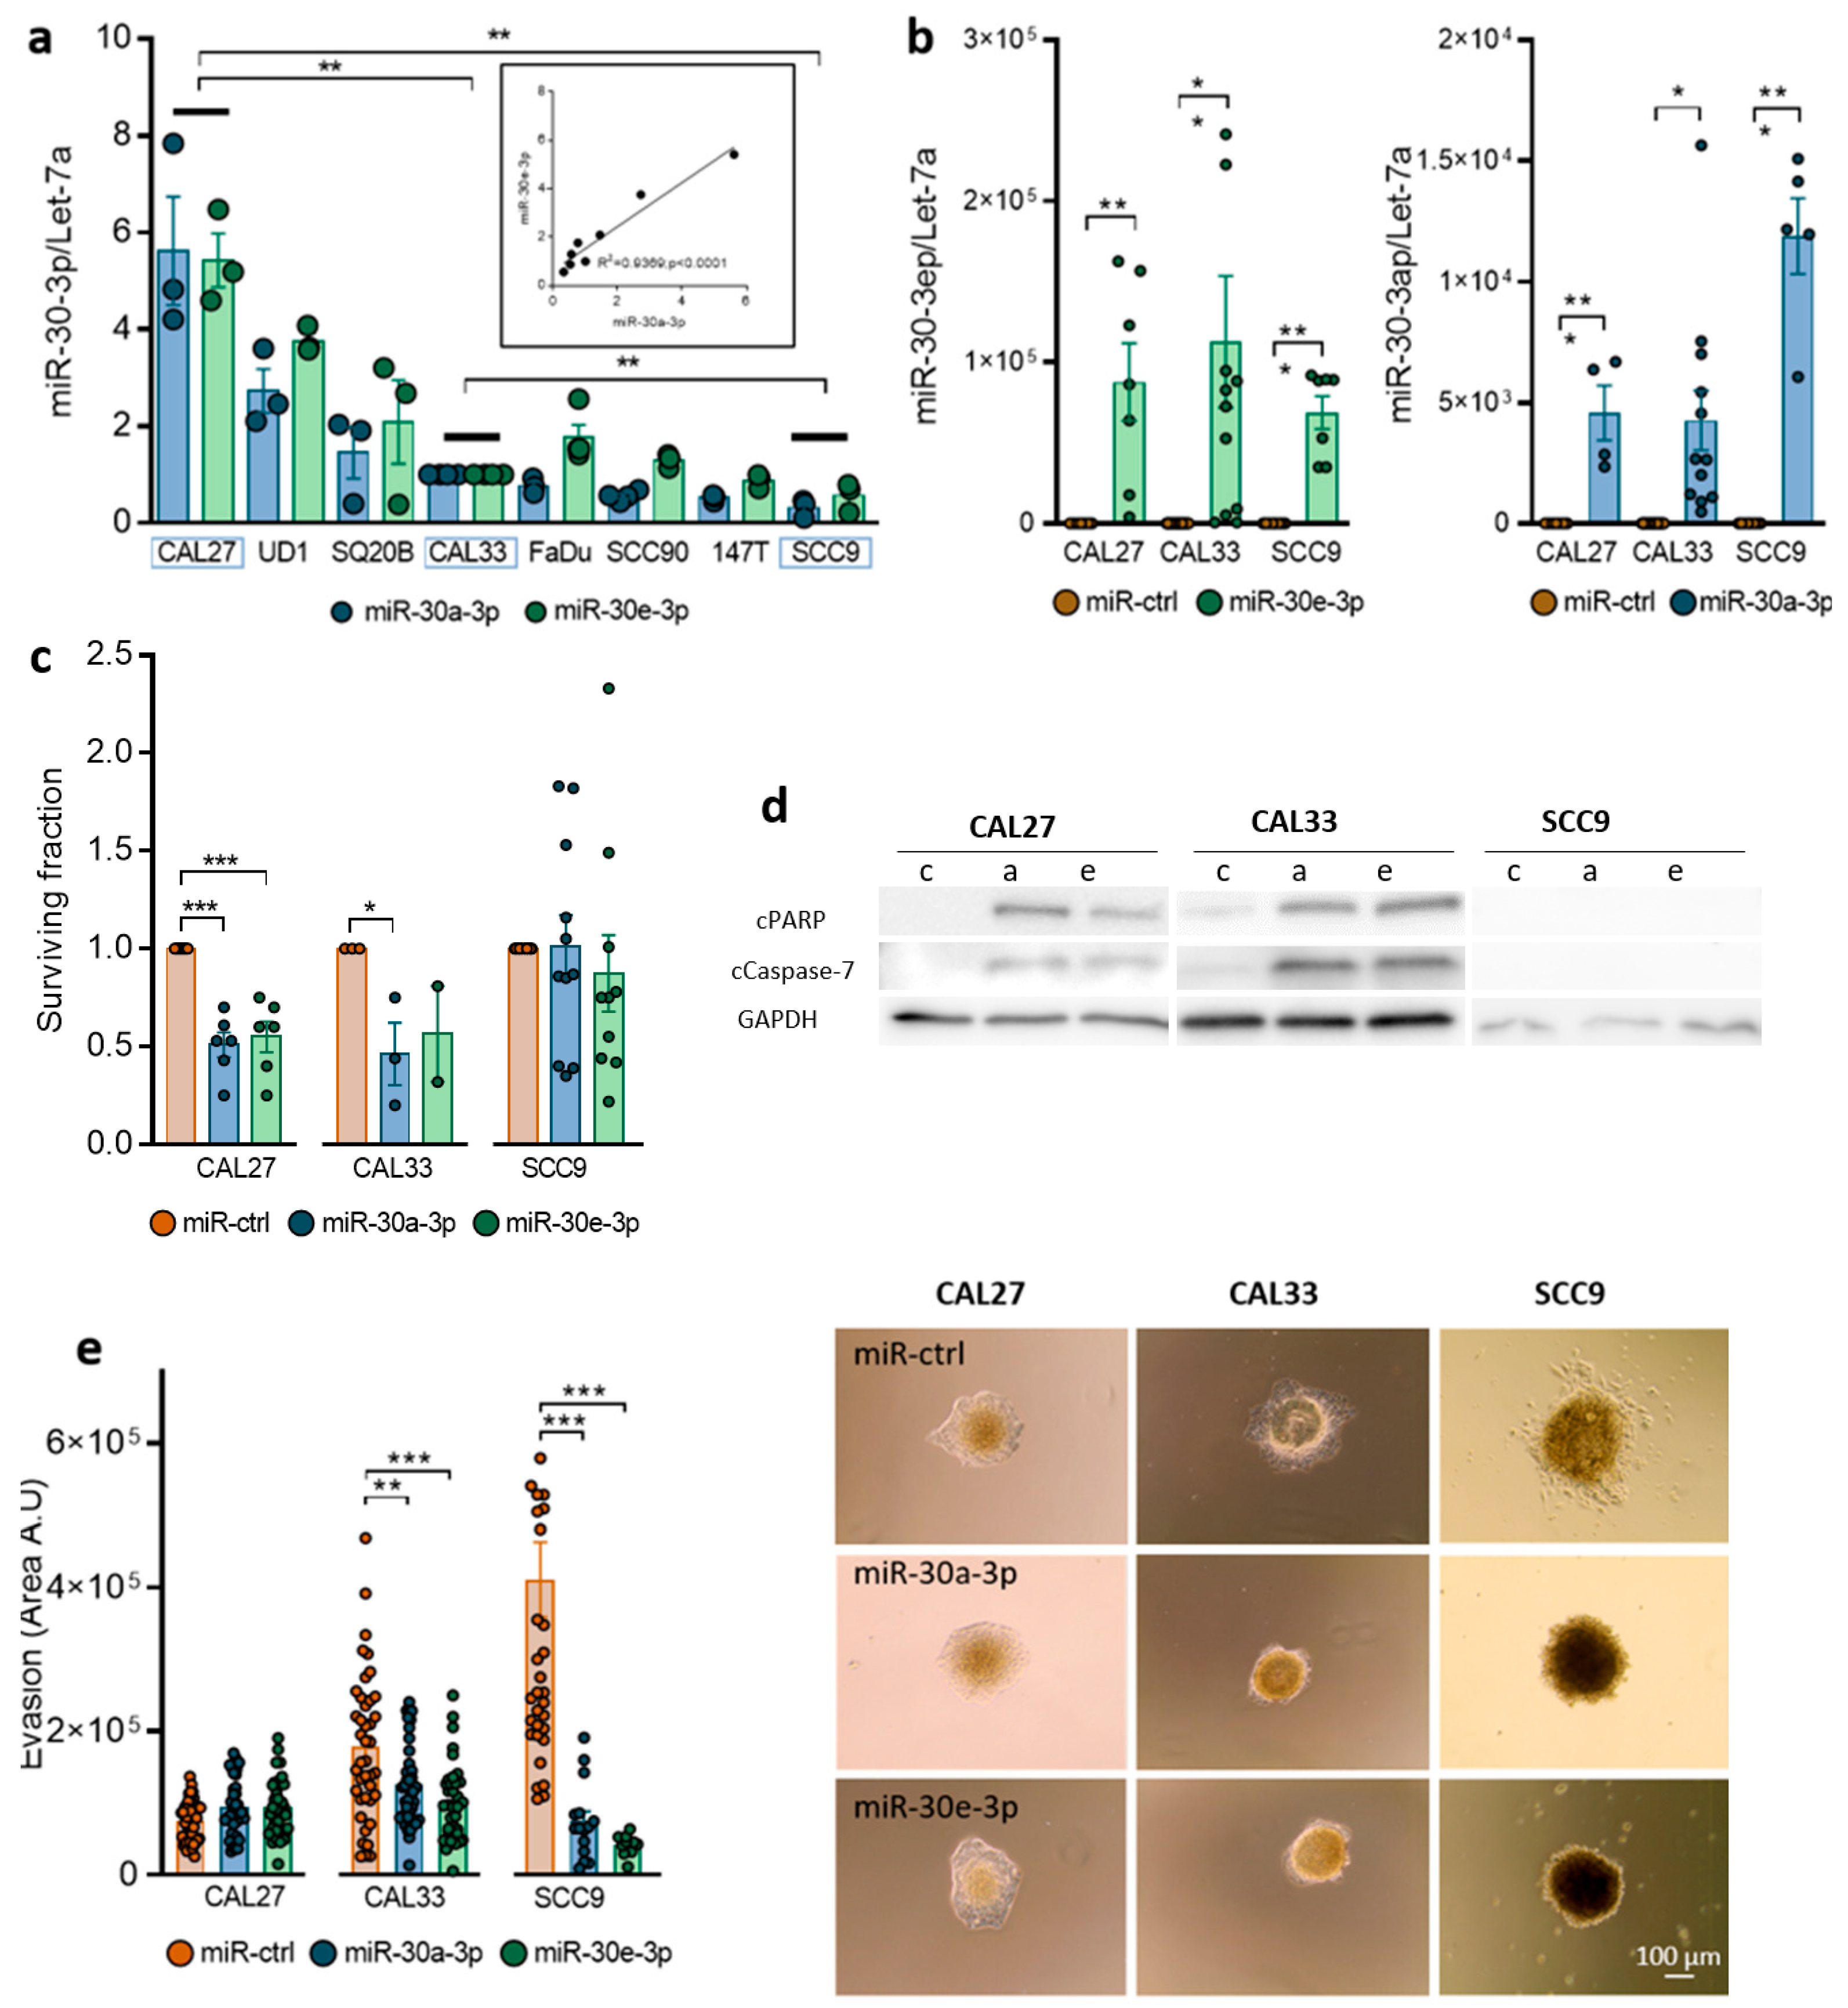
2.2. Expression of miR-30-3p in HNSCC Cells Reduces Survival and Slows down Evasion
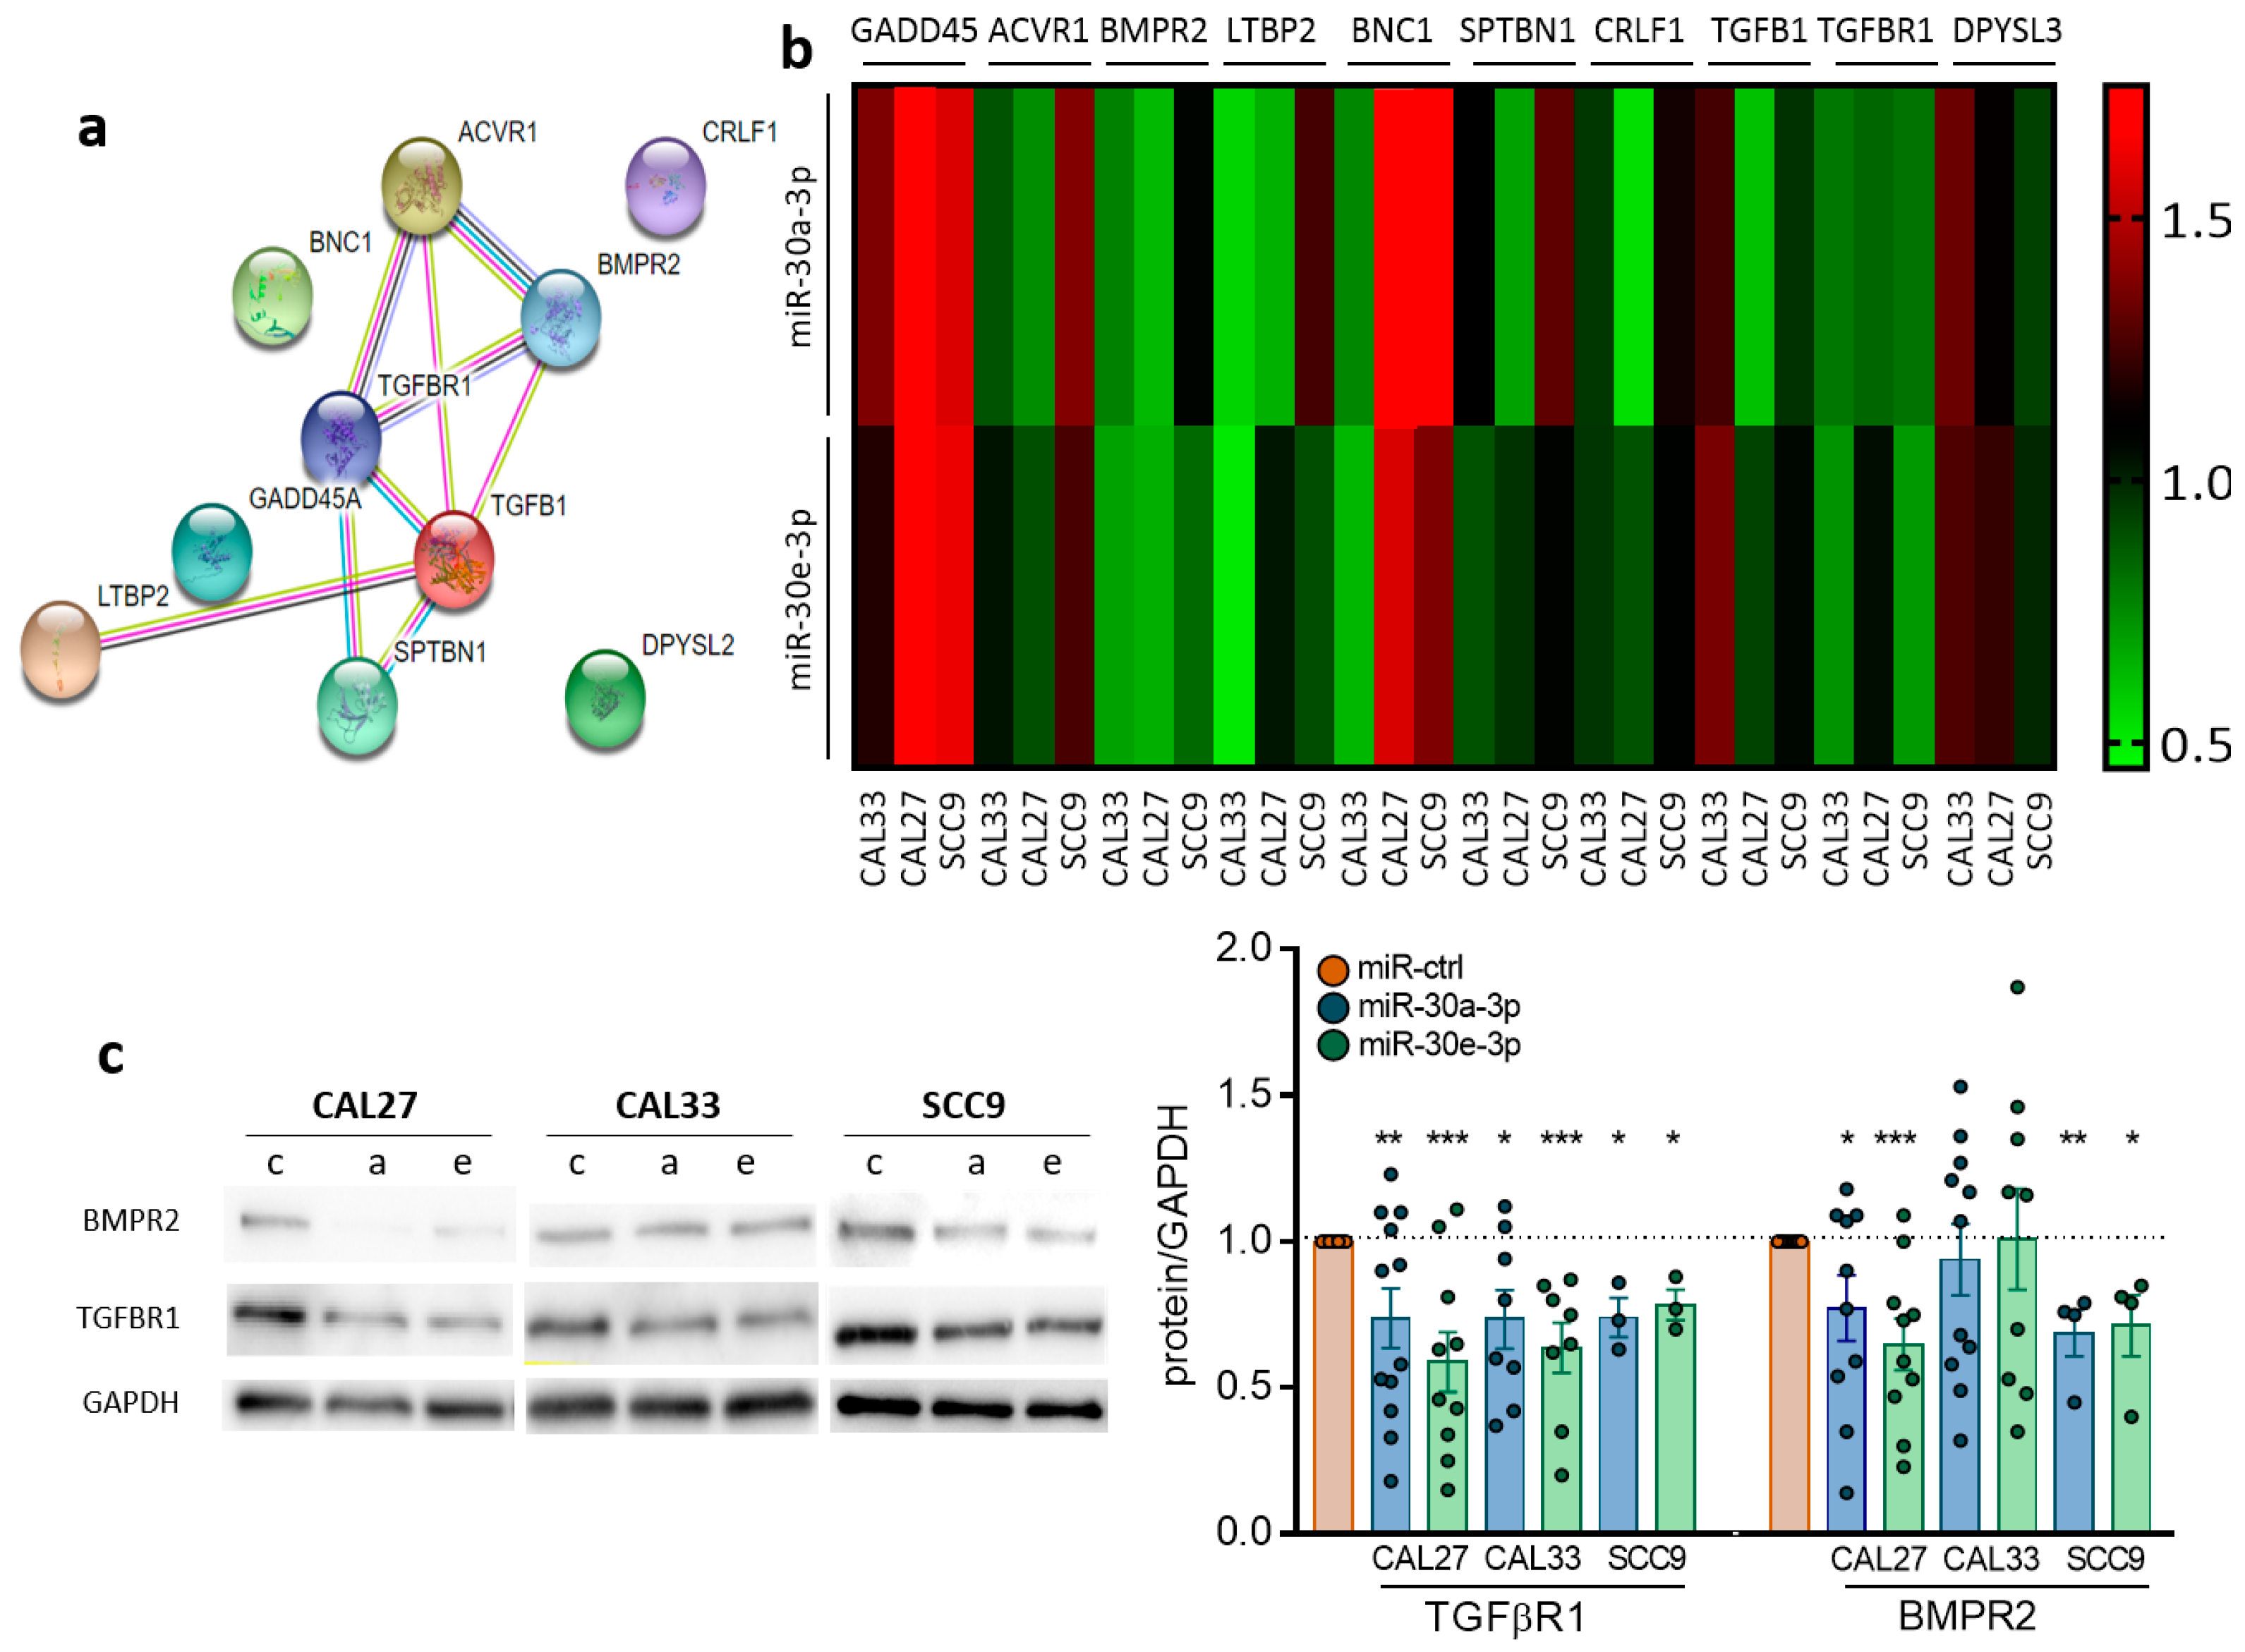
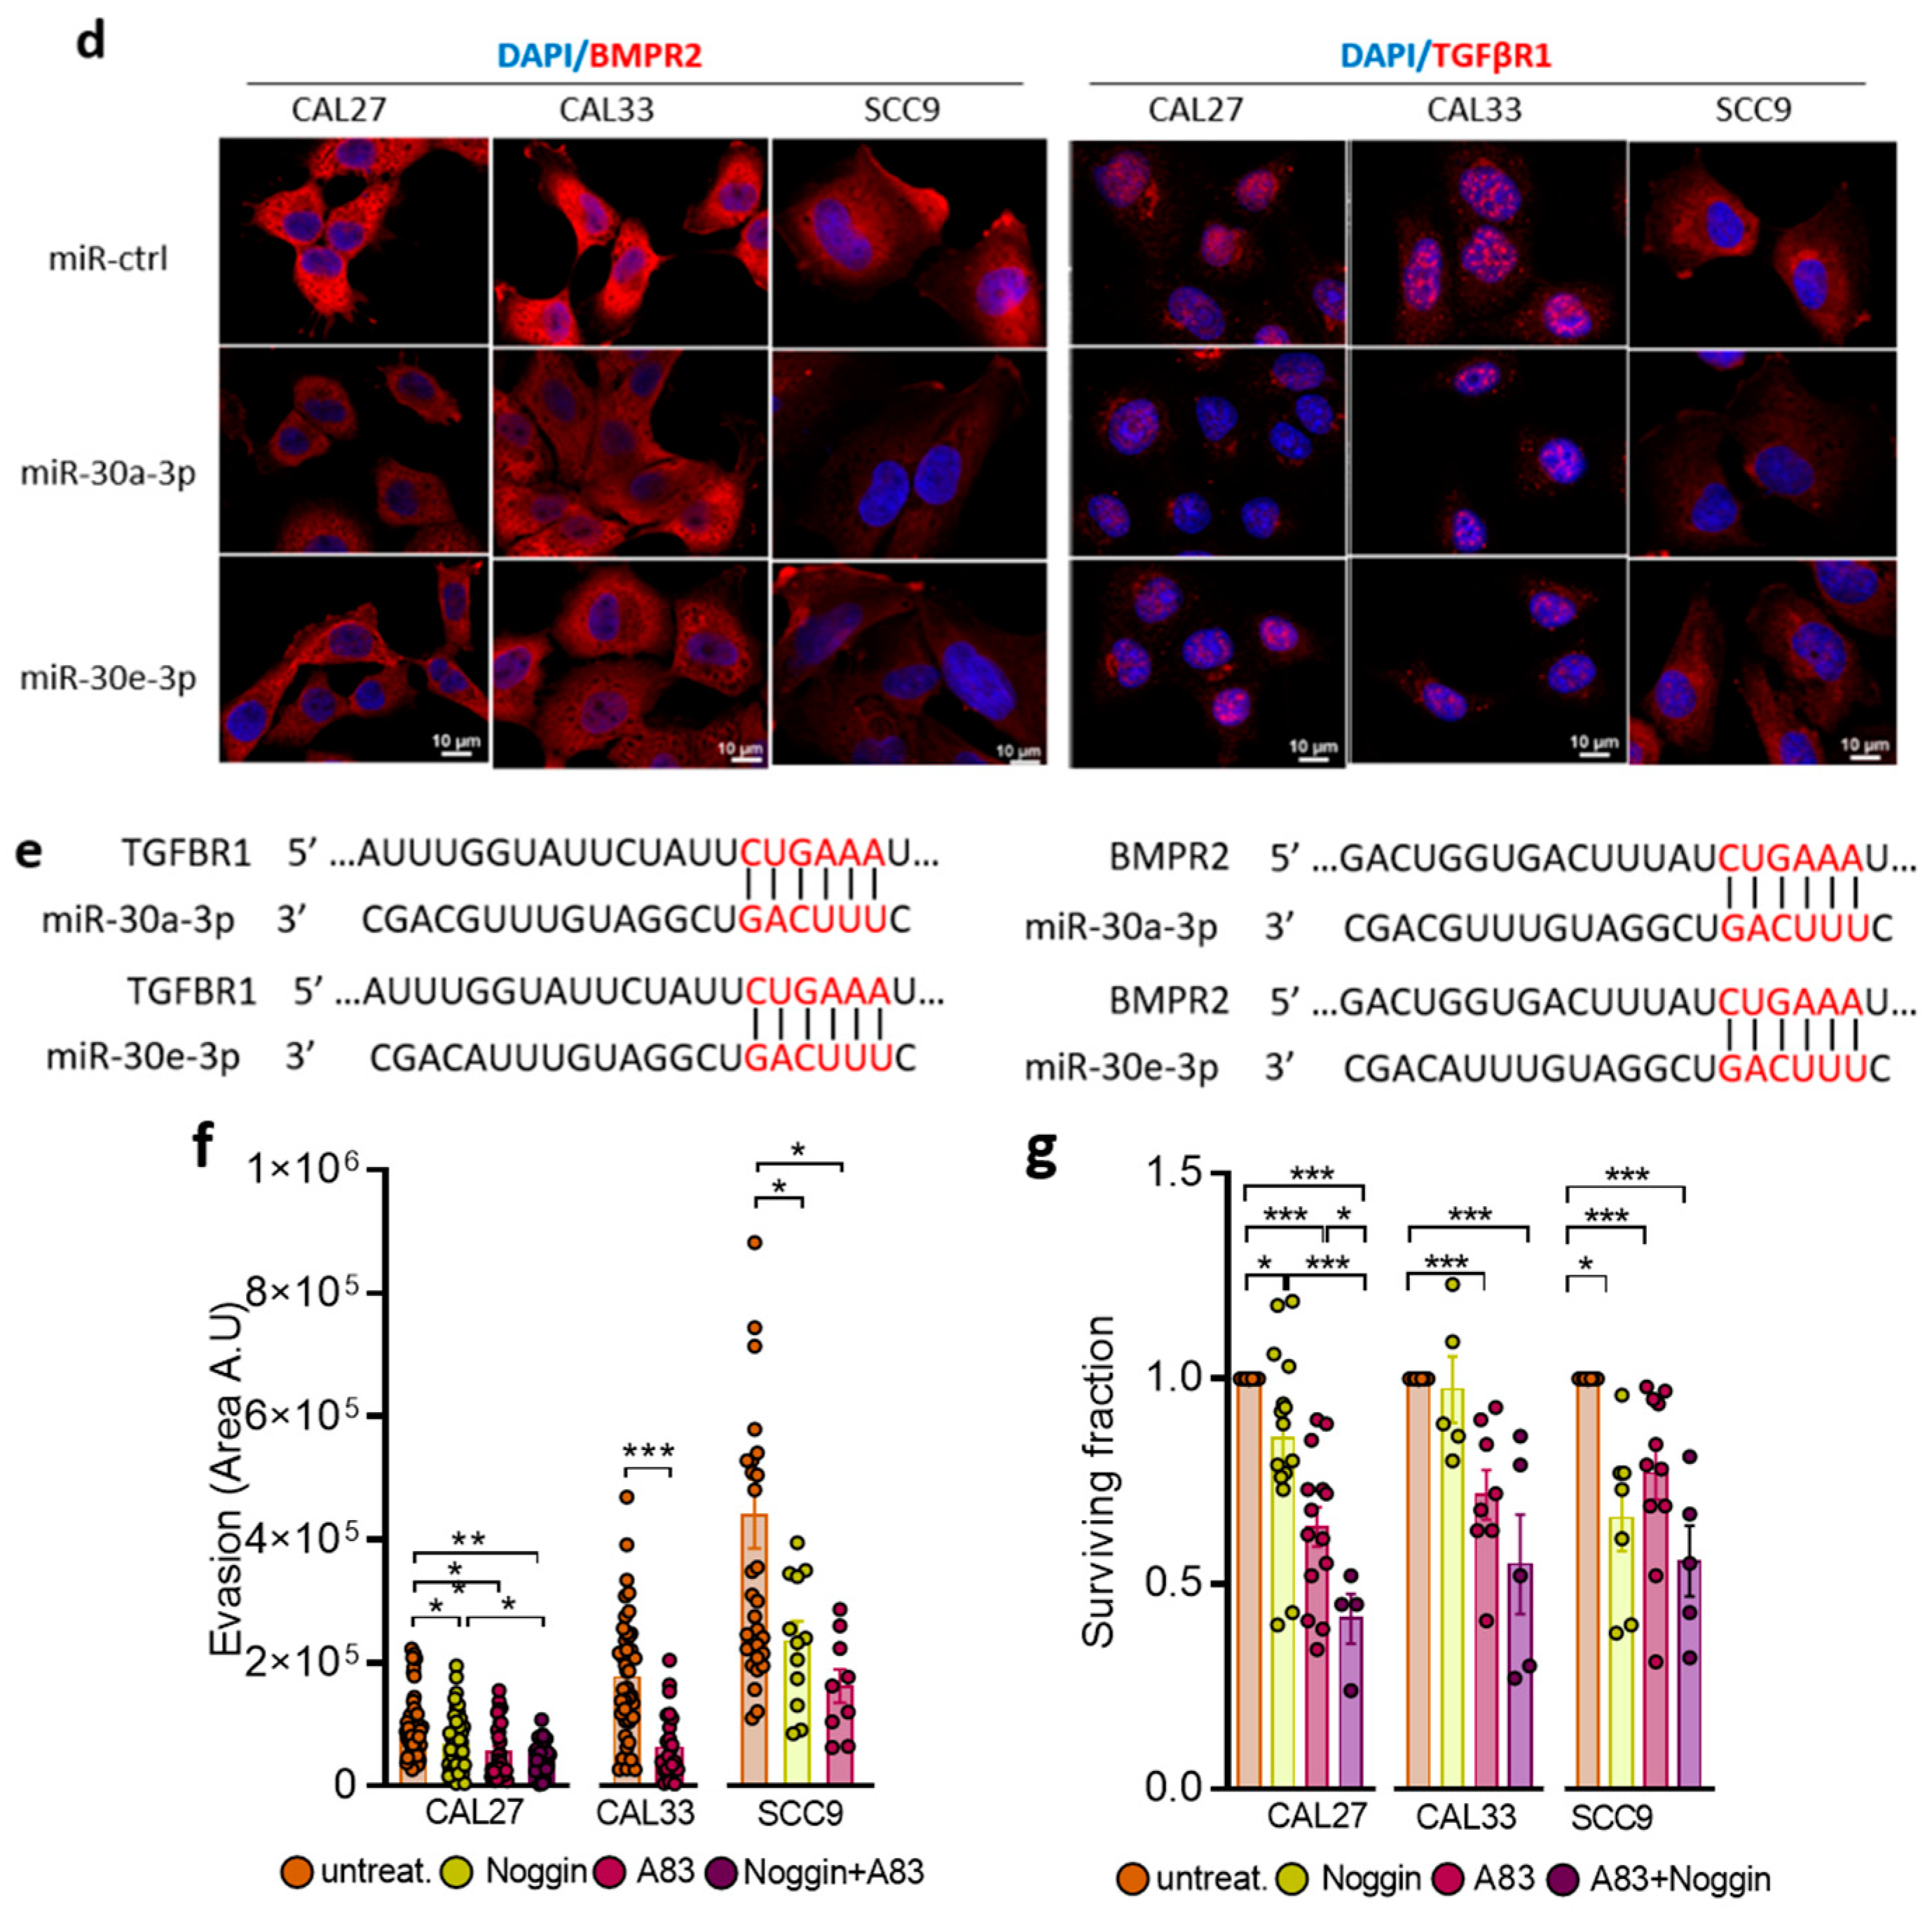
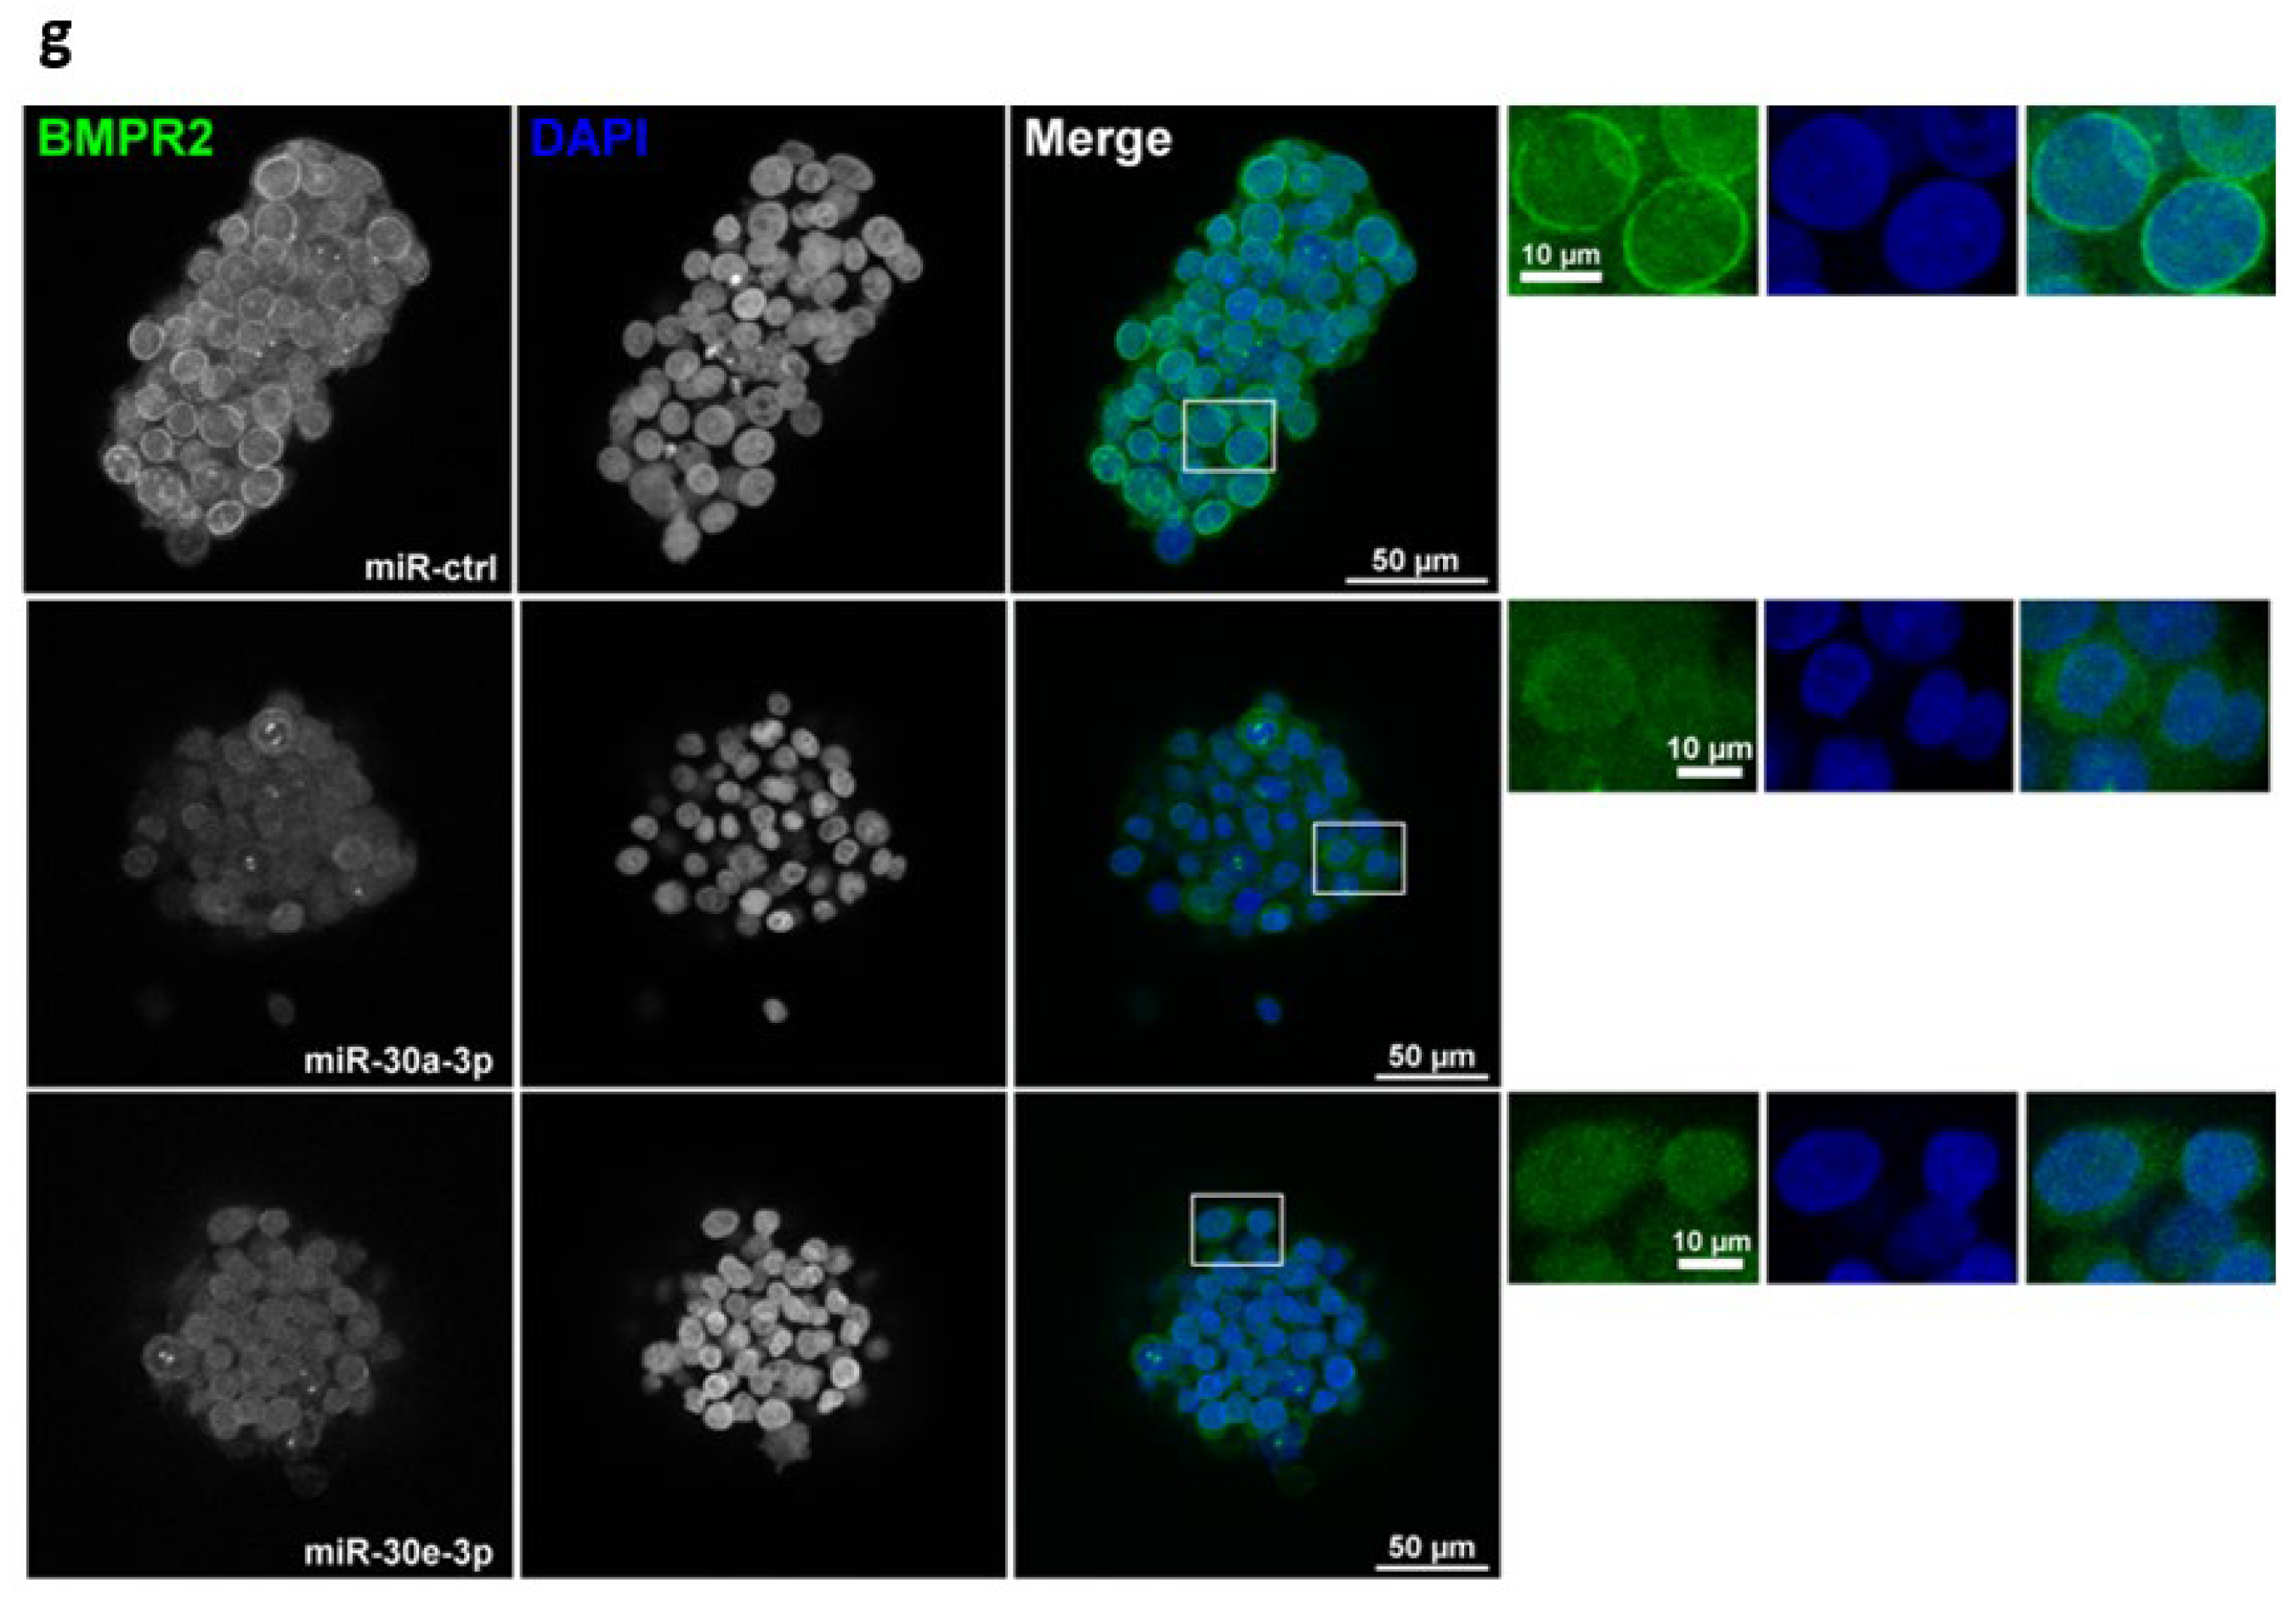
2.3. TGFBR1 and BMPR2 Are the Main Effector Targets of miR-30-3p in HNSCC
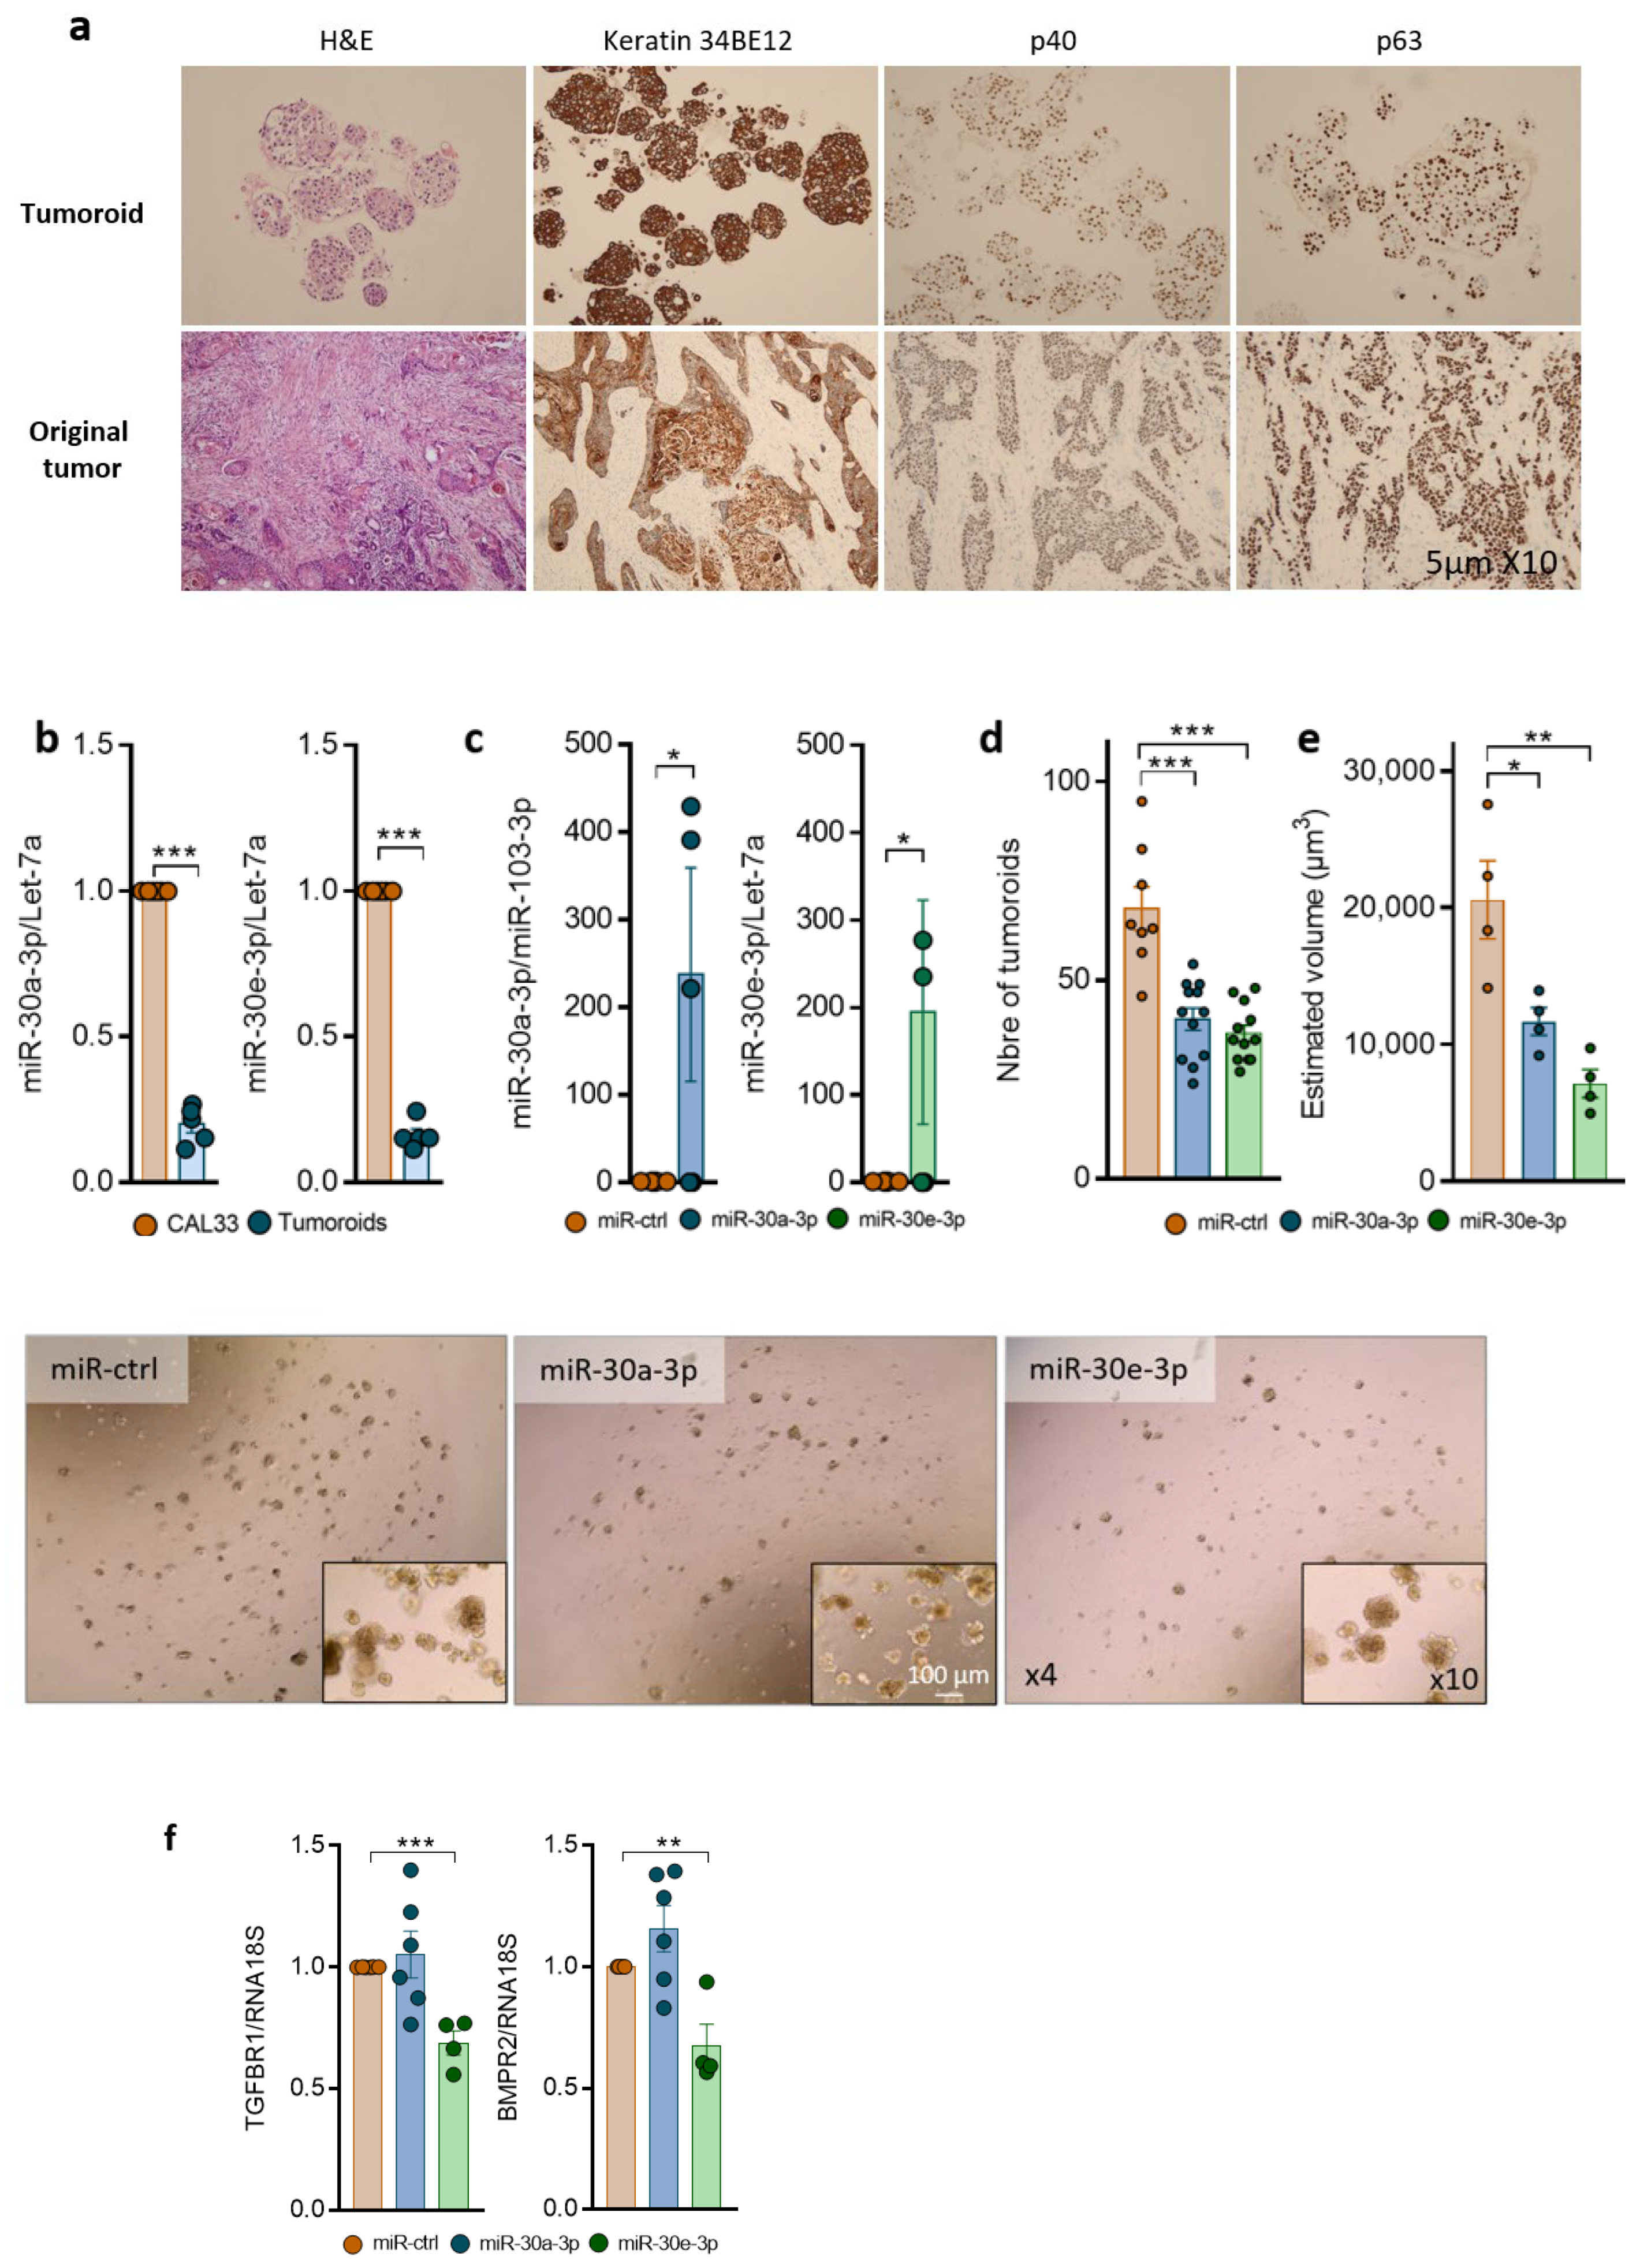
2.4. Overexpression of miR-30-3p Slows down HNSCC Patient-Derived Tumoroid Growth and Development
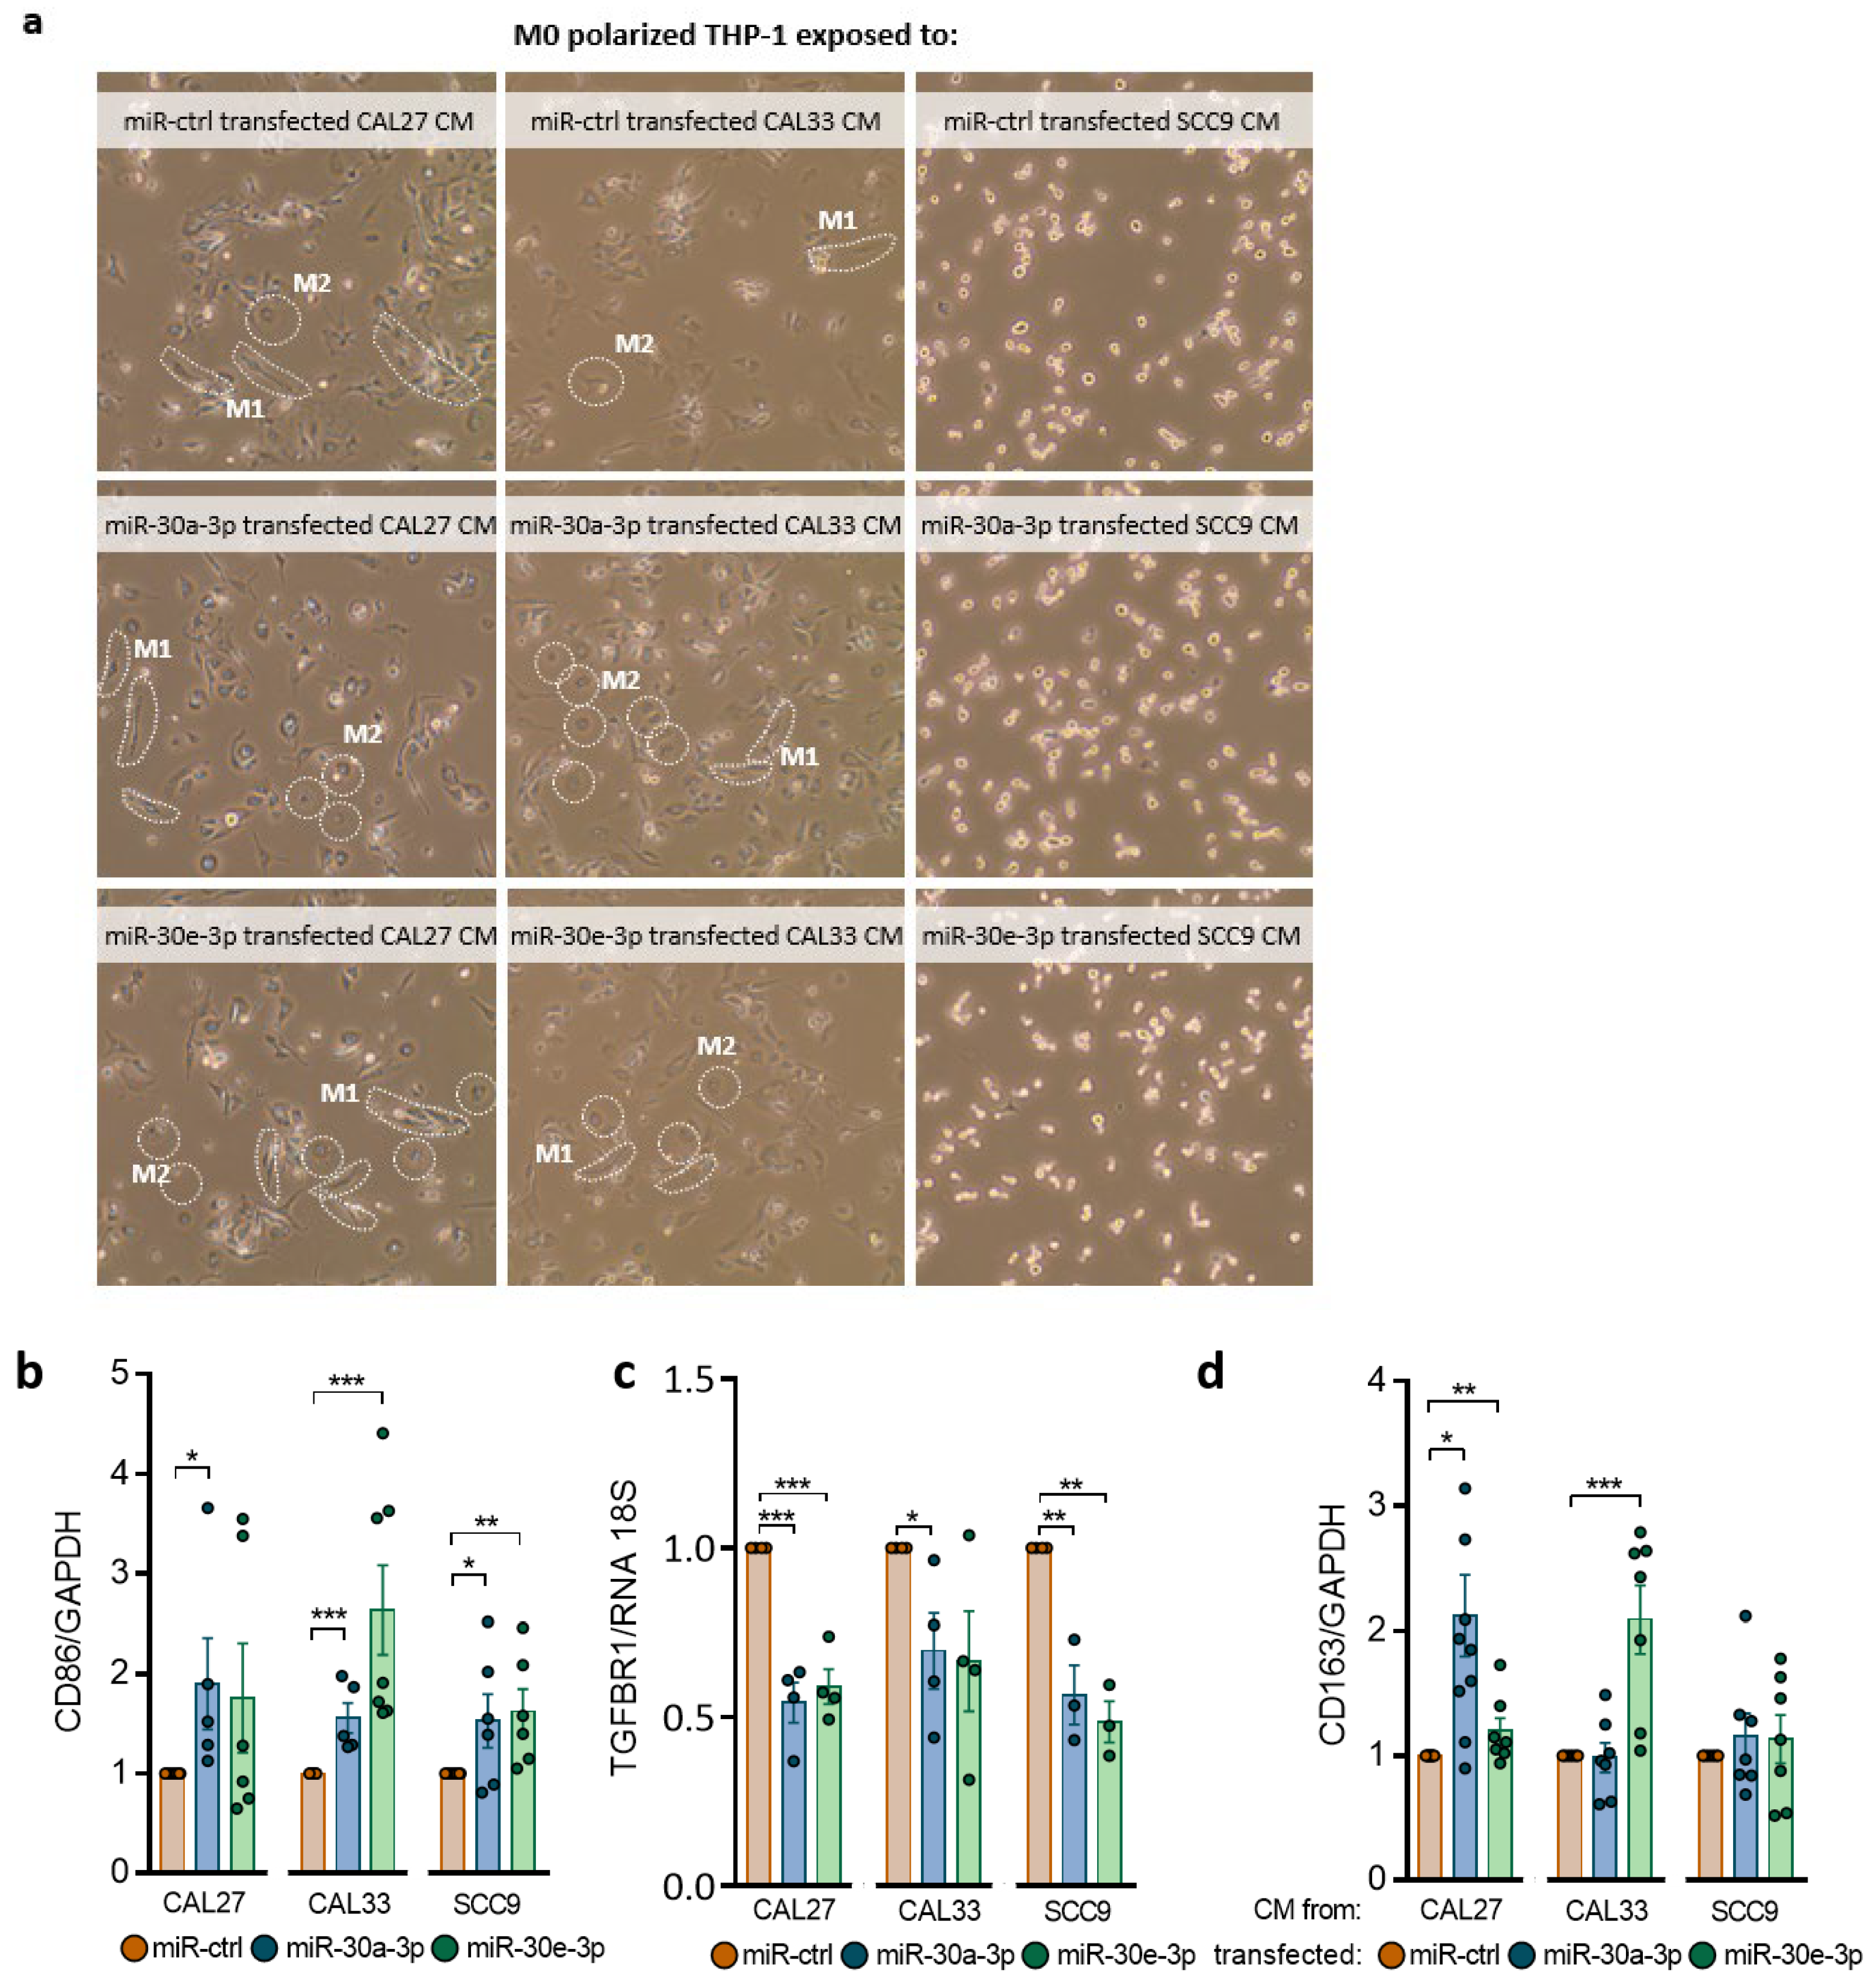
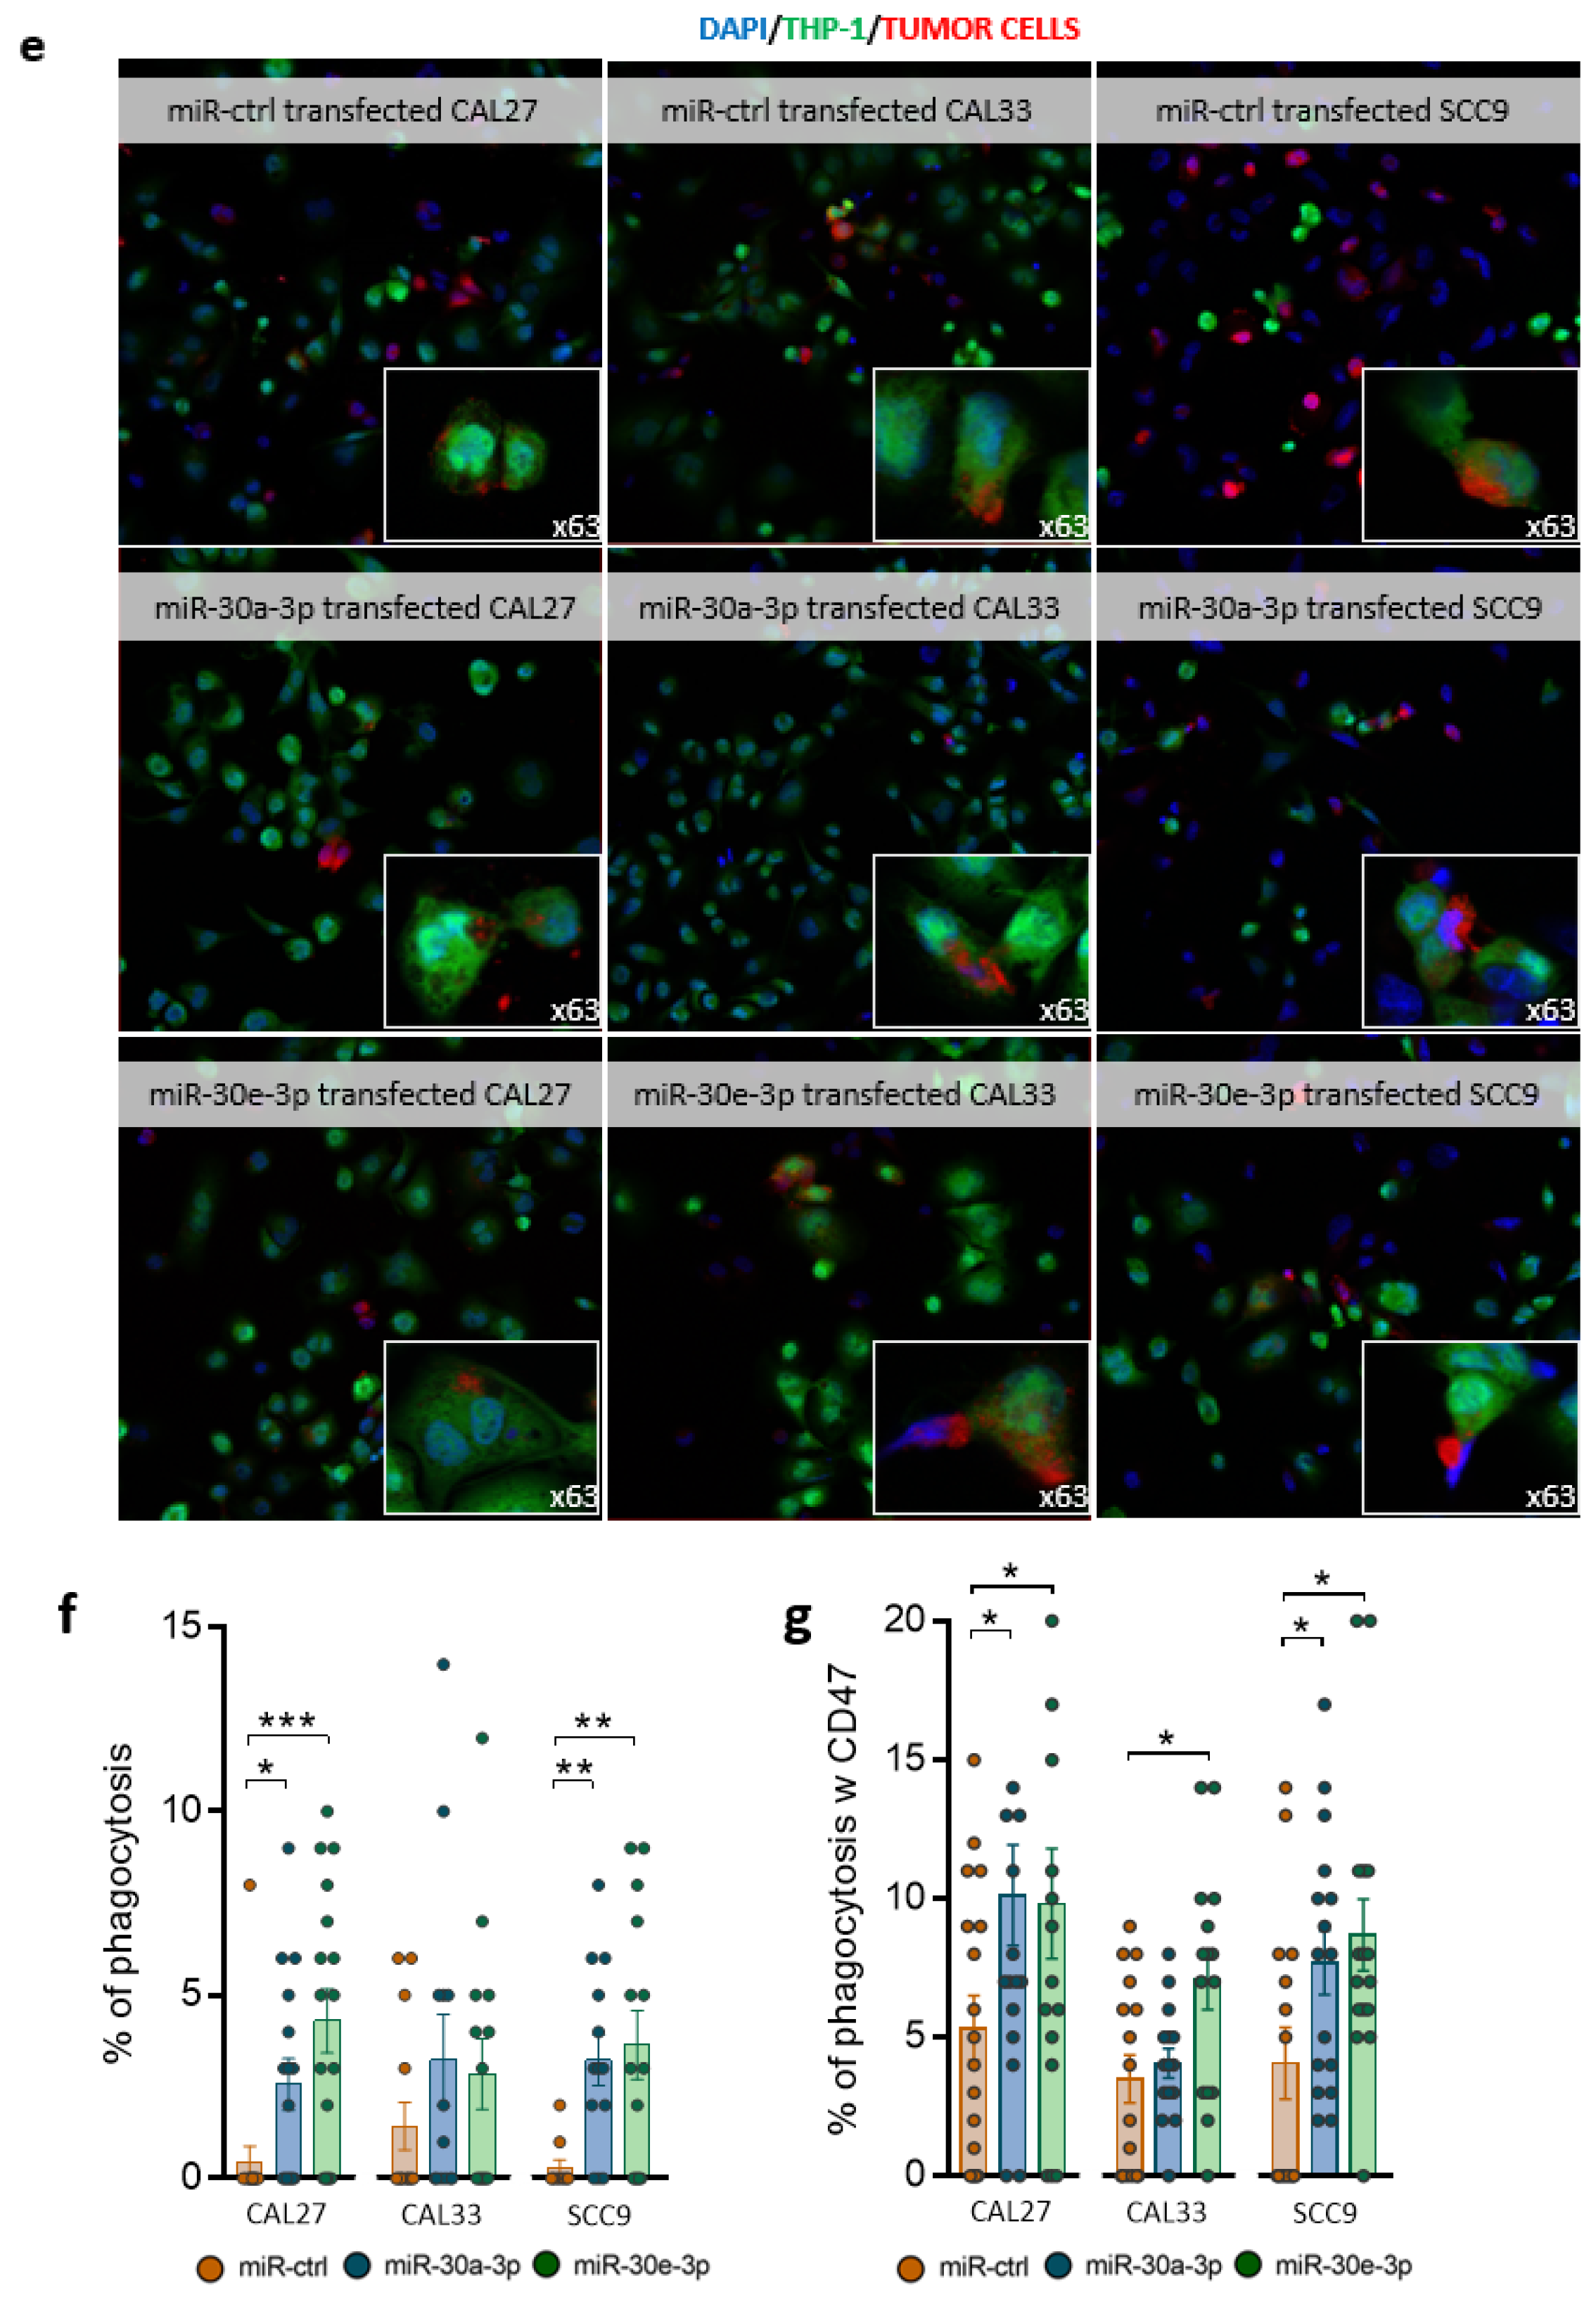
2.5. miR-30a-3p and miR-30e-3p Influence Macrophages’ Immune Response to HNSCC Cells
3. Discussion
4. Materials and Methods
4.1. Human Tissue Samples
4.2. Cell Culture, Transfection, and Drugs
4.3. Patient-Derived Tumoroid Culture and Transfection
4.4. Real-Time Quantitative PCR of miRNA on Human Samples
4.5. Real-Time Quantitative PCR of miRNA and mRNA on Cell Lines and Tumoroids
4.6. Western Blot on Cell Lines and Tumoroids
4.7. Spheres Evasion Assay
4.8. Clonogenic Survival Assay
4.9. Immunohistochemistry on Tumoroids
4.10. Immunofluorescence of Cells
4.11. Immunofluorescence on Tumoroids
4.12. Phagocytosis Assay
4.13. Bioinformatics Analyses of Target Genes
4.14. Statistical Analysis
5. Conclusions
Supplementary Materials
Author Contributions
Funding
Institutional Review Board Statement
Informed Consent Statement
Data Availability Statement
Acknowledgments
Conflicts of Interest
References
- Bray, F.; Ferlay, J.; Soerjomataram, I.; Siegel, R.L.; Torre, L.A.; Jemal, A. Global cancer statistics 2018: GLOBOCAN estimates of incidence and mortality worldwide for 36 cancers in 185 countries. CA Cancer J. Clin. 2018, 68, 394–424. [Google Scholar] [CrossRef]
- Muzio, L.L.; Ballini, A.; Cantore, S.; Bottalico, L.; Charitos, I.A.; Ambrosino, M.; Nocini, R.; Malcangi, A.; Dioguardi, M.; Cazzolla, A.P.; et al. Overview of Candida albicans and Human Papillomavirus (HPV) Infection Agents and their Biomolecular Mechanisms in Promoting Oral Cancer in Pediatric Patients. BioMed Res. Int. 2021, 2021, 7312611. [Google Scholar] [CrossRef]
- Anonymous. Cetuximab approved by FDA for treatment of head and neck squamous cell cancer. Cancer Biol. Ther. 2006, 5, 340–342. [Google Scholar]
- Colevas, A.D.; Yom, S.S.; Pfister, D.G.; Spencer, S.; Adelstein, D.; Adkins, D.; Brizel, D.M.; Burtness, B.; Busse, P.M.; Caudell, J.J.; et al. NCCN Guidelines Insights: Head and Neck Cancers, Version 1.2018. J. Natl. Compr. Cancer Netw. 2018, 16, 479–490. [Google Scholar] [CrossRef]
- Vermorken, J.B.; Mesia, R.; Rivera, F.; Remenar, E.; Kawecki, A.; Rottey, S.; Erfan, J.; Zabolotnyy, D.; Kienzer, H.R.; Cupissol, D.; et al. Platinum-based chemotherapy plus cetuximab in head and neck cancer. N. Engl. J. Med. 2008, 359, 1116–1127. [Google Scholar] [CrossRef]
- Lacas, B.; Carmel, A.; Landais, C.; Wong, S.J.; Licitra, L.; Tobias, J.S.; Burtness, B.; Ghi, M.G.; Cohen, E.E.W.; Grau, C.; et al. Meta-analysis of chemotherapy in head and neck cancer (MACH-NC): An update on 107 randomized trials and 19,805 patients, on behalf of MACH-NC Group. Radiother. Oncol. 2021, 156, 281–293. [Google Scholar] [CrossRef] [PubMed]
- Anfossi, S.; Babayan, A.; Pantel, K.; Calin, G.A. Clinical utility of circulating non-coding RNAs—An update. Nat. Rev. Clin. Oncol. 2018, 15, 541–563. [Google Scholar] [CrossRef] [PubMed]
- Betel, D.; Wilson, M.; Gabow, A.; Marks, D.S.; Sander, C. The microRNA.org resource: Targets and expression. Nucleic Acids Res. 2008, 36, D149–D153. [Google Scholar] [CrossRef]
- Ha, M.; Kim, V.N. Regulation of microRNA biogenesis. Nat. Rev. Mol. Cell Biol. 2014, 15, 509–524. [Google Scholar] [CrossRef]
- Drusco, A.; Croce, C.M. MicroRNAs and Cancer: A Long Story for Short RNAs. Adv. Cancer Res. 2017, 135, 1–24. [Google Scholar] [CrossRef] [PubMed]
- Rupaimoole, R.; Slack, F.J. MicroRNA therapeutics: Towards a new era for the management of cancer and other diseases. Nat. Rev. Drug Discov. 2017, 16, 203–222. [Google Scholar] [CrossRef]
- Minemura, C.; Asai, S.; Koma, A.; Kikkawa, N.; Kato, M.; Kasamatsu, A.; Uzawa, K.; Hanazawa, T.; Seki, N. Identification of Antitumor miR-30e-5p Controlled Genes; Diagnostic and Prognostic Biomarkers for Head and Neck Squamous Cell Carcinoma. Genes 2022, 13, 1225. [Google Scholar] [CrossRef]
- Saleh, A.D.; Cheng, H.; Martin, S.E.; Si, H.; Ormanoglu, P.; Carlson, S.; Clavijo, P.E.; Yang, X.; Das, R.; Cornelius, S.; et al. Integrated Genomic and Functional microRNA Analysis Identifies miR-30-5p as a Tumor Suppressor and Potential Therapeutic Nanomedicine in Head and Neck Cancer. Clin. Cancer Res. Off. J. Am. Assoc. Cancer Res. 2019, 25, 2860–2873. [Google Scholar] [CrossRef] [PubMed]
- Mao, L.; Liu, S.; Hu, L.; Jia, L.; Wang, H.; Guo, M.; Chen, C.; Liu, Y.; Xu, L. miR-30 Family: A Promising Regulator in Development and Disease. BioMed Res. Int. 2018, 2018, 9623412. [Google Scholar] [CrossRef]
- Wei, D.; Yu, G.; Zhao, Y. MicroRNA-30a-3p inhibits the progression of lung cancer via the PI3K/AKT by targeting DNA methyltransferase 3a. OncoTargets Ther. 2019, 12, 7015–7024. [Google Scholar] [CrossRef] [PubMed]
- Zhou, K.; Luo, X.; Wang, Y.; Cao, D.; Sun, G. MicroRNA-30a suppresses tumor progression by blocking Ras/Raf/MEK/ERK signaling pathway in hepatocellular carcinoma. Biomed. Pharmacother. 2017, 93, 1025–1032. [Google Scholar] [CrossRef]
- Fukumoto, I.; Hanazawa, T.; Kinoshita, T.; Kikkawa, N.; Koshizuka, K.; Goto, Y.; Nishikawa, R.; Chiyomaru, T.; Enokida, H.; Nakagawa, M.; et al. MicroRNA expression signature of oral squamous cell carcinoma: Functional role of microRNA-26a/b in the modulation of novel cancer pathways. Br. J. Cancer 2015, 112, 891–900. [Google Scholar] [CrossRef]
- Ganci, F.; Sacconi, A.; Manciocco, V.; Sperduti, I.; Battaglia, P.; Covello, R.; Muti, P.; Strano, S.; Spriano, G.; Fontemaggi, G.; et al. MicroRNA expression as predictor of local recurrence risk in oral squamous cell carcinoma. Head Neck 2016, 38 (Suppl. S1), E189–E197. [Google Scholar] [CrossRef] [PubMed]
- Shiah, S.G.; Hsiao, J.R.; Chang, H.J.; Hsu, Y.M.; Wu, G.H.; Peng, H.Y.; Chou, S.T.; Kuo, C.C.; Chang, J.Y. MiR-30a and miR-379 modulate retinoic acid pathway by targeting DNA methyltransferase 3B in oral cancer. J. Biomed. Sci. 2020, 27, 46. [Google Scholar] [CrossRef]
- Soga, D.; Yoshiba, S.; Shiogama, S.; Miyazaki, H.; Kondo, S.; Shintani, S. microRNA expression profiles in oral squamous cell carcinoma. Oncol. Rep. 2013, 30, 579–583. [Google Scholar] [CrossRef][Green Version]
- Maldonado, L.A.G.; Nascimento, C.R.; Rodrigues Fernandes, N.A.; Silva, A.L.P.; D’Silva, N.J.; Rossa, C., Jr. Influence of tumor cell-derived TGF-beta on macrophage phenotype and macrophage-mediated tumor cell invasion. Int. J. Biochem. Cell Biol. 2022, 153, 106330. [Google Scholar] [CrossRef]
- Ye, X.J.; Yang, J.G.; Tan, Y.Q.; Chen, X.J.; Zhou, G. Targeting CD47 Inhibits Tumor Development and Increases Phagocytosis in Oral Squamous Cell Carcinoma. Anticancer Agents Med. Chem. 2021, 21, 766–774. [Google Scholar] [CrossRef] [PubMed]
- Zeljic, K.; Jovanovic, I.; Jovanovic, J.; Magic, Z.; Stankovic, A.; Supic, G. MicroRNA meta-signature of oral cancer: Evidence from a meta-analysis. Upsala J. Med. Sci. 2018, 123, 43–49. [Google Scholar] [CrossRef] [PubMed]
- Manikandan, M.; Deva Magendhra Rao, A.K.; Arunkumar, G.; Manickavasagam, M.; Rajkumar, K.S.; Rajaraman, R.; Munirajan, A.K. Oral squamous cell carcinoma: microRNA expression profiling and integrative analyses for elucidation of tumourigenesis mechanism. Mol. Cancer 2016, 15, 28. [Google Scholar] [CrossRef]
- Shi, W.; Yang, J.; Li, S.; Shan, X.; Liu, X.; Hua, H.; Zhao, C.; Feng, Z.; Cai, Z.; Zhang, L.; et al. Potential involvement of miR-375 in the premalignant progression of oral squamous cell carcinoma mediated via transcription factor KLF5. Oncotarget 2015, 6, 40172–40185. [Google Scholar] [CrossRef] [PubMed]
- Minemura, C.; Asai, S.; Koma, A.; Kase-Kato, I.; Tanaka, N.; Kikkawa, N.; Kasamatsu, A.; Yokoe, H.; Hanazawa, T.; Uzawa, K.; et al. Identification of Tumor-Suppressive miR-30e-3p Targets: Involvement of SERPINE1 in the Molecular Pathogenesis of Head and Neck Squamous Cell Carcinoma. Int. J. Mol. Sci. 2022, 23, 3808. [Google Scholar] [CrossRef]
- Kim, C.; Jeong, D.E.; Heo, S.; Ji, E.; Rho, J.G.; Jung, M.; Ahn, S.; Kim, Y.J.; Kim, Y.S.; Nam, S.W.; et al. Reduced expression of the RNA-binding protein HuD in pancreatic neuroendocrine tumors correlates with low p27(Kip1) levels and poor prognosis. J. Pathol. 2018, 246, 231–243. [Google Scholar] [CrossRef] [PubMed]
- Song, F.; Xuan, Z.; Yang, X.; Ye, X.; Pan, Z.; Fang, Q. Identification of key microRNAs and hub genes in non-small-cell lung cancer using integrative bioinformatics and functional analyses. J. Cell. Biochem. 2020, 121, 2690–2703. [Google Scholar] [CrossRef]
- Wang, T.; Chen, G.; Ma, X.; Yang, Y.; Chen, Y.; Peng, Y.; Bai, Z.; Zhang, Z.; Pei, H.; Guo, W. MiR-30a regulates cancer cell response to chemotherapy through SNAI1/IRS1/AKT pathway. Cell Death Dis. 2019, 10, 153. [Google Scholar] [CrossRef] [PubMed]
- Li, X.; Jiao, M.; Hu, J.; Qi, M.; Zhang, J.; Zhao, M.; Liu, H.; Xiong, X.; Dong, X.; Han, B. miR-30a inhibits androgen-independent growth of prostate cancer via targeting MYBL2, FOXD1, and SOX4. Prostate 2020, 80, 674–686. [Google Scholar] [CrossRef] [PubMed]
- Chen, F.; Wang, S.; Wei, Y.; Wu, J.; Huang, G.; Chen, J.; Shi, J.; Xia, J. Norcantharidin modulates the miR-30a/Metadherin/AKT signaling axis to suppress proliferation and metastasis of stromal tumor cells in giant cell tumor of bone. Biomed. Pharmacother. 2018, 103, 1092–1100. [Google Scholar] [CrossRef] [PubMed]
- Chen, Q.; Gao, Y.; Yu, Q.; Tang, F.; Zhao, P.W.; Luo, S.K.; Lin, J.S.; Mei, H. miR-30a-3p inhibits the proliferation of liver cancer cells by targeting DNMT3a through the PI3K/AKT signaling pathway. Oncol. Lett. 2020, 19, 606–614. [Google Scholar] [CrossRef] [PubMed]
- Han, X.; Zhen, S.; Ye, Z.; Lu, J.; Wang, L.; Li, P.; Li, J.; Zheng, X.; Li, H.; Chen, W.; et al. A Feedback Loop Between miR-30a/c-5p and DNMT1 Mediates Cisplatin Resistance in Ovarian Cancer Cells. Cell. Physiol. Biochem. 2017, 41, 973–986. [Google Scholar] [CrossRef] [PubMed]
- Chakrabarti, M.; Klionsky, D.J.; Ray, S.K. miR-30e Blocks Autophagy and Acts Synergistically with Proanthocyanidin for Inhibition of AVEN and BIRC6 to Increase Apoptosis in Glioblastoma Stem Cells and Glioblastoma SNB19 Cells. PLoS ONE 2016, 11, e0158537. [Google Scholar] [CrossRef] [PubMed]
- Xu, X.; Jin, S.; Ma, Y.; Fan, Z.; Yan, Z.; Li, W.; Song, Q.; You, W.; Lyu, Z.; Song, Y.; et al. miR-30a-5p enhances paclitaxel sensitivity in non-small cell lung cancer through targeting BCL-2 expression. J. Mol. Med. 2017, 95, 861–871. [Google Scholar] [CrossRef]
- Du, X.; Liu, B.; Luan, X.; Cui, Q.; Li, L. miR-30 decreases multidrug resistance in human gastric cancer cells by modulating cell autophagy. Exp. Ther. Med. 2018, 15, 599–605. [Google Scholar] [CrossRef]
- Mathew, L.K.; Lee, S.S.; Skuli, N.; Rao, S.; Keith, B.; Nathanson, K.L.; Lal, P.; Simon, M.C. Restricted expression of miR-30c-2-3p and miR-30a-3p in clear cell renal cell carcinomas enhances HIF2alpha activity. Cancer Discov. 2014, 4, 53–60. [Google Scholar] [CrossRef]
- Moch, H.; Lukamowicz-Rajska, M. miR-30c-2-3p and miR-30a-3p: New pieces of the jigsaw puzzle in HIF2alpha regulation. Cancer Discov. 2014, 4, 22–24. [Google Scholar] [CrossRef] [PubMed]
- Li, C.; Zou, J.; Zheng, G.; Chu, J. MiR-30a Decreases Multidrug Resistance (MDR) of Gastric Cancer Cells. Med. Sci. Monit. Int. Med. J. Exp. Clin. Res. 2016, 22, 4509–4515. [Google Scholar] [CrossRef]
- Zheng, B.; Zhu, H.; Gu, D.; Pan, X.; Qian, L.; Xue, B.; Yang, D.; Zhou, J.; Shan, Y. MiRNA-30a-mediated autophagy inhibition sensitizes renal cell carcinoma cells to sorafenib. Biochem. Biophys. Res. Commun. 2015, 459, 234–239. [Google Scholar] [CrossRef]
- Chen, W.; Li, Z.; Liu, H.; Jiang, S.; Wang, G.; Sun, L.; Li, J.; Wang, X.; Yu, S.; Huang, J.; et al. MicroRNA-30a targets BECLIN-1 to inactivate autophagy and sensitizes gastrointestinal stromal tumor cells to imatinib. Cell Death Dis. 2020, 11, 198. [Google Scholar] [CrossRef] [PubMed]
- Zhang, Q.; Mao, Z.; Sun, J. NF-kappaB inhibitor, BAY11-7082, suppresses M2 tumor-associated macrophage induced EMT potential via miR-30a/NF-kappaB/Snail signaling in bladder cancer cells. Gene 2019, 710, 91–97. [Google Scholar] [CrossRef] [PubMed]
- Di Gennaro, A.; Damiano, V.; Brisotto, G.; Armellin, M.; Perin, T.; Zucchetto, A.; Guardascione, M.; Spaink, H.P.; Doglioni, C.; Snaar-Jagalska, B.E.; et al. A p53/miR-30a/ZEB2 axis controls triple negative breast cancer aggressiveness. Cell Death Differ. 2018, 25, 2165–2180. [Google Scholar] [CrossRef] [PubMed]
- Noori, J.; Sharifi, M.; Haghjooy Javanmard, S. miR-30a Inhibits Melanoma Tumor Metastasis by Targeting the E-cadherin and Zinc Finger E-box Binding Homeobox 2. Adv. Biomed. Res. 2018, 7, 143. [Google Scholar] [CrossRef] [PubMed]
- Min, J.; Han, T.S.; Sohn, Y.; Shimizu, T.; Choi, B.; Bae, S.W.; Hur, K.; Kong, S.H.; Suh, Y.S.; Lee, H.J.; et al. microRNA-30a arbitrates intestinal-type early gastric carcinogenesis by directly targeting ITGA2. Gastric Cancer 2020, 23, 600–613. [Google Scholar] [CrossRef] [PubMed]
- Croset, M.; Pantano, F.; Kan, C.W.S.; Bonnelye, E.; Descotes, F.; Alix-Panabieres, C.; Lecellier, C.H.; Bachelier, R.; Allioli, N.; Hong, S.S.; et al. miRNA-30 Family Members Inhibit Breast Cancer Invasion, Osteomimicry, and Bone Destruction by Directly Targeting Multiple Bone Metastasis-Associated Genes. Cancer Res. 2018, 78, 5259–5273. [Google Scholar] [CrossRef] [PubMed]
- Dong, L.; Qian, J.; Chen, F.; Fan, Y.; Long, J. LINC00461 promotes cell migration and invasion in breast cancer through miR-30a-5p/integrin beta3 axis. J. Cell. Biochem. 2019, 120, 4851–4862. [Google Scholar] [CrossRef]
- Park, I.; Son, H.K.; Che, Z.M.; Kim, J. A novel gain-of-function mutation of TGF-beta receptor II promotes cancer progression via delayed receptor internalization in oral squamous cell carcinoma. Cancer Lett. 2012, 315, 161–169. [Google Scholar] [CrossRef]
- Guo, Y.; Sun, W.; Gong, T.; Chai, Y.; Wang, J.; Hui, B.; Li, Y.; Song, L.; Gao, Y. miR-30a radiosensitizes non-small cell lung cancer by targeting ATF1 that is involved in the phosphorylation of ATM. Oncol. Rep. 2017, 37, 1980–1988. [Google Scholar] [CrossRef]
- Bach, D.H.; Park, H.J.; Lee, S.K. The Dual Role of Bone Morphogenetic Proteins in Cancer. Mol. Ther. Oncolytics 2018, 8, 1–13. [Google Scholar] [CrossRef]
- Bian, Y.; Terse, A.; Du, J.; Hall, B.; Molinolo, A.; Zhang, P.; Chen, W.; Flanders, K.C.; Gutkind, J.S.; Wakefield, L.M.; et al. Progressive tumor formation in mice with conditional deletion of TGF-beta signaling in head and neck epithelia is associated with activation of the PI3K/Akt pathway. Cancer Res. 2009, 69, 5918–5926. [Google Scholar] [CrossRef] [PubMed]
- De Carvalho, C.H.; Nonaka, C.F.; de Araujo, C.R.; de Souza, L.B.; Pinto, L.P. Immunoexpression of bone morphogenetic protein-2 (BMP-2), BMP receptor type IA, and BMP receptor type II in metastatic and non-metastatic lower lip squamous cell carcinoma. J. Oral Pathol. Med. Off. Publ. Int. Assoc. Oral Pathol. Am. Acad. Oral Pathol. 2011, 40, 181–186. [Google Scholar] [CrossRef] [PubMed]
- Huang, T.; Huang, W.; Lu, H.; Zhang, B.Y.; Ma, J.; Zhao, D.; Wang, Y.J.; Yu, D.H.; He, X. Identification and validation a TGF-beta-associated long non-coding RNA of head and neck squamous cell carcinoma by bioinformatics method. J. Transl. Med. 2018, 16, 46. [Google Scholar] [CrossRef]
- Chen, T.; Yan, W.; Wells, R.G.; Rimm, D.L.; McNiff, J.; Leffell, D.; Reiss, M. Novel inactivating mutations of transforming growth factor-beta type I receptor gene in head-and-neck cancer metastases. Int. J. Cancer 2001, 93, 653–661. [Google Scholar] [CrossRef] [PubMed]
- Wang, Y.; Wu, C.; Zhang, C.; Li, Z.; Zhu, T.; Chen, J.; Ren, Y.; Wang, X.; Zhang, L.; Zhou, X. TGF-beta-induced STAT3 overexpression promotes human head and neck squamous cell carcinoma invasion and metastasis through malat1/miR-30a interactions. Cancer Lett. 2018, 436, 52–62. [Google Scholar] [CrossRef] [PubMed]
- Yin, J.; Jung, J.E.; Choi, S.I.; Kim, S.S.; Oh, Y.T.; Kim, T.H.; Choi, E.; Lee, S.J.; Kim, H.; Kim, E.O.; et al. Inhibition of BMP signaling overcomes acquired resistance to cetuximab in oral squamous cell carcinomas. Cancer Lett. 2018, 414, 181–189. [Google Scholar] [CrossRef] [PubMed]
- Fu, S.; Lv, H.B.; Liu, Y.; Zhao, Y.; He, L.S.; Jin, Y. Transfection of truncated bone morphogenetic protein receptor-II into oral squamous cell carcinoma cell line Tca8113 and inhibitory effect on proliferation and inductive effect on apoptosis. J. Oral Pathol. Med. 2011, 40, 490–496. [Google Scholar] [CrossRef]
- Wang, G.; Zhang, M.; Cheng, M.; Wang, X.; Li, K.; Chen, J.; Chen, Z.; Chen, S.; Chen, J.; Xiong, G.; et al. Tumor microenvironment in head and neck squamous cell carcinoma: Functions and regulatory mechanisms. Cancer Lett. 2021, 507, 55–69. [Google Scholar] [CrossRef] [PubMed]
- Bisheshar, S.K.; van der Kamp, M.F.; de Ruiter, E.J.; Ruiter, L.N.; van der Vegt, B.; Breimer, G.E.; Willems, S.M. The prognostic role of tumor associated macrophages in squamous cell carcinoma of the head and neck: A systematic review and meta-analysis. Oral Oncol. 2022, 135, 106227. [Google Scholar] [CrossRef]
- Cho, B.C.; Daste, A.; Ravaud, A.; Salas, S.; Isambert, N.; McClay, E.F.; Awada, A.; Borel, C.; Helwig, C.; Rolfe, P.A.; et al. Long-term follow-up of bintrafusp alfa, a bifunctional fusion protein targeting TGF-β and PD-L1, in advanced squamous cell carcinoma of the head and neck (SCCHN). J. Clin. Oncol. 2021, 39, 6020. [Google Scholar] [CrossRef]
- Hanna, G.J.; Kaczmar, J.M.; Zandberg, D.P.; Wong, D.J.; Yilmaz, E.; Sherman, E.J.; Hernando-Calvo, A.; Sacco, A.G.; Chung, C.H.; Bohr, D.; et al. Dose expansion results of the bifunctional EGFR/TGFβ inhibitor BCA101 with pembrolizumab in patients with recurrent, metastatic head and neck squamous cell carcinoma. J. Clin. Oncol. 2023, 41, 6005. [Google Scholar] [CrossRef]
- Feng, J.; Tang, D.; Wang, J.; Zhou, Q.; Peng, J.; Lou, H.; Sun, Y.; Cai, Y.; Chen, H.; Yang, J.; et al. SHR-1701, a Bifunctional Fusion Protein Targeting PD-L1 and TGFbeta, for Recurrent or Metastatic Cervical Cancer: A Clinical Expansion Cohort of a Phase I Study. Clin. Cancer Res. 2022, 28, 5297–5305. [Google Scholar] [CrossRef] [PubMed]
- Driehuis, E.; Kolders, S.; Spelier, S.; Lohmussaar, K.; Willems, S.M.; Devriese, L.A.; de Bree, R.; de Ruiter, E.J.; Korving, J.; Begthel, H.; et al. Oral Mucosal Organoids as a Potential Platform for Personalized Cancer Therapy. Cancer Discov. 2019, 9, 852–871. [Google Scholar] [CrossRef] [PubMed]
- Driehuis, E.; Kretzschmar, K.; Clevers, H. Establishment of patient-derived cancer organoids for drug-screening applications. Nat. Protoc. 2020, 15, 3380–3409. [Google Scholar] [CrossRef]
- Burgy, M.; Jehl, A.; Conrad, O.; Foppolo, S.; Bruban, V.; Etienne-Selloum, N.; Jung, A.C.; Masson, M.; Macabre, C.; Ledrappier, S.; et al. Cav1/EREG/YAP Axis in the Treatment Resistance of Cav1-Expressing Head and Neck Squamous Cell Carcinoma. Cancers 2021, 13, 3038. [Google Scholar] [CrossRef] [PubMed]


Disclaimer/Publisher’s Note: The statements, opinions and data contained in all publications are solely those of the individual author(s) and contributor(s) and not of MDPI and/or the editor(s). MDPI and/or the editor(s) disclaim responsibility for any injury to people or property resulting from any ideas, methods, instructions or products referred to in the content. |
© 2023 by the authors. Licensee MDPI, Basel, Switzerland. This article is an open access article distributed under the terms and conditions of the Creative Commons Attribution (CC BY) license (https://creativecommons.org/licenses/by/4.0/).
Share and Cite
Conrad, O.; Burgy, M.; Foppolo, S.; Jehl, A.; Thiéry, A.; Guihard, S.; Vauchelles, R.; Jung, A.C.; Mourtada, J.; Macabre, C.; et al. Tumor-Suppressive and Immunomodulating Activity of miR-30a-3p and miR-30e-3p in HNSCC Cells and Tumoroids. Int. J. Mol. Sci. 2023, 24, 11178. https://doi.org/10.3390/ijms241311178
Conrad O, Burgy M, Foppolo S, Jehl A, Thiéry A, Guihard S, Vauchelles R, Jung AC, Mourtada J, Macabre C, et al. Tumor-Suppressive and Immunomodulating Activity of miR-30a-3p and miR-30e-3p in HNSCC Cells and Tumoroids. International Journal of Molecular Sciences. 2023; 24(13):11178. https://doi.org/10.3390/ijms241311178
Chicago/Turabian StyleConrad, Ombline, Mickaël Burgy, Sophie Foppolo, Aude Jehl, Alicia Thiéry, Sébastien Guihard, Romain Vauchelles, Alain C. Jung, Jana Mourtada, Christine Macabre, and et al. 2023. "Tumor-Suppressive and Immunomodulating Activity of miR-30a-3p and miR-30e-3p in HNSCC Cells and Tumoroids" International Journal of Molecular Sciences 24, no. 13: 11178. https://doi.org/10.3390/ijms241311178
APA StyleConrad, O., Burgy, M., Foppolo, S., Jehl, A., Thiéry, A., Guihard, S., Vauchelles, R., Jung, A. C., Mourtada, J., Macabre, C., Ledrappier, S., Chenard, M.-P., Onea, M.-A., Danic, A., Dourlhes, T., Thibault, C., Schultz, P., Dontenwill, M., & Martin, S. (2023). Tumor-Suppressive and Immunomodulating Activity of miR-30a-3p and miR-30e-3p in HNSCC Cells and Tumoroids. International Journal of Molecular Sciences, 24(13), 11178. https://doi.org/10.3390/ijms241311178