
Biodiesel Production Using Palm Oil with a MOF-Lipase B Biocatalyst from Candida Antarctica: A Kinetic and Thermodynamic Study


Abstract
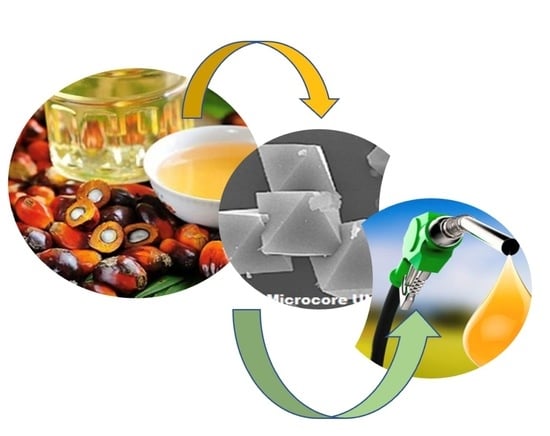
1. Introduction
2. Results and Discussion
2.1. MOFs Characterization
2.1.1. Analysis of FTIR Results
2.1.2. Analysis of X-ray Diffraction Analysis (XRD) Results
2.1.3. Analysis of the Porosity and Surface Area Results
2.1.4. Surface Morphology
2.2. Lipase Adsorption Isotherms
2.3. Adsorption Kinetics
2.4. Transesterification Reaction and Operational Stability
3. Materials and Methods
3.1. Reagents
3.2. Batch Adsorption of Lipase onto Activated MOFs
3.2.1. Adsorption Models
3.2.2. Adsorption Kinetics Models
3.3. Biodiesel Production
3.4. Gas Chromatography Analysis
3.5. MOF Characterization
4. Conclusions
Author Contributions
Funding
Informed Consent Statement
Acknowledgments
Conflicts of Interest
References
- Bajaj, A.; Lohan, P.; Jha, P.N.; Mehrotra, R. Biodiesel production through lipase catalyzed transesterification: An overview. J. Mol. Catal. B Enzym. 2010, 62, 9–14. [Google Scholar] [CrossRef]
- Knothe, G. Biodiesel and renewable diesel: A comparison. Prog. Energy Combust. Sci. 2010, 36, 364–373. [Google Scholar] [CrossRef]
- Kamaraj, R.; Rao, Y.K.S.S. Biodiesel blends: A comprehensive systematic review on various constraints. Environ Sci. Pollut. Res. 2022, 29, 43770–43785. [Google Scholar] [CrossRef]
- Bommarius, A.S.; Riebel, B.R. Biocatalysis: Fundamentals and Applications; Wiley-VCH: Weinheim, Germany, 2004; ISBN 3-527-30344-8. [Google Scholar]
- Ashoka, B.; Naresh Kumarb, A.; Jacoba, A.; Vignesh, D.R. Chapter 1—Emission training in IC engines. In NOx Emission Control Technologies in Stationary and Automotive Internal Combustion Engines; Elsevier: Amsterdam, The Netherlands, 2022; pp. 1–38. [Google Scholar] [CrossRef]
- Jeswani, H.K.; Chilvers, A.; Azapagic, A. Environmental sustainability of biofuels: A review. Proc. R. Soc. Math. Phys. Eng. Sci. 2020, 476, 20200351. [Google Scholar] [CrossRef]
- Mandari, V.; Devarai, S.K. Biodiesel production using homogeneous, heterogeneous, and enzyme catalysts via transesterification and esterification reactions: A critical review. BioEnergy Res. 2022, 15, 935–961. [Google Scholar] [CrossRef] [PubMed]
- Uppenberg, J.; Hansen, M.T.; Patkar, S.; Jones, A. The sequence, crystal structure determination and refinement of two crystal forms of lipase B from Candida antarctica. Structure 1994, 2, 293–308. [Google Scholar] [CrossRef] [PubMed]
- Granjo, J.F.O.; Duarte, B.P.M.; Oliveira, N.M.C. Integrated production of biodiesel in a soy-bean biorefinery: Modeling, simulation and economic assessment. Energy 2017, 129, 273–291. [Google Scholar] [CrossRef]
- Aderibigbe, F.A.; Mustapha, S.I.; Adewoye, T.L.; Mohammed, I.; Gbadegesin, A.B.; Niyi, F.E.; Olowu, O.I.; Soretire, A.G.; Saka, H.B. Qualitative role of heterogeneous catalysts in biodiesel production from Jatropha curcas oil. Biofuel Res. J. 2020, 7, 1159–1169. [Google Scholar] [CrossRef]
- Bhatia, S.K.; Gurav, R.; Choi, T.-R.; Kim, H.J.; Yang, S.-Y.; Song, H.-S.; Park, J.Y.; Park, Y.-L.; Han, Y.-H.; Choi, Y.-K.; et al. Conversion of waste cooking oil into biodiesel using heterogenous catalyst derived from cork biochar. Bioresour. Technol. 2020, 302, 122872. [Google Scholar] [CrossRef]
- Meloni, D.; Perra, D.; Monaci, R.; Cutrufello, M.G.; Rombi, E.; Ferino, I. Transesterification of Jatropha curcas oil and soybean oil on Al-SBA-15 catalysts. Appl. Catal. B Environ. 2016, 184, 163–173. [Google Scholar] [CrossRef]
- Sahar, J.; Farooq, M.; Ramli, A.; Naeem, A.; Khattak, N.S.; Ghazi, Z.A. Highly efficient heteropoly acid decorated SnO2@Co-ZIF nanocatalyst for sustainable biodiesel production from Nannorrhops ritchiana seeds oil. Renew. Energy 2022, 198, 306–318. [Google Scholar] [CrossRef]
- Tan, Q.; Cao, Y.; Li, J. Prepared multifunctional catalyst Ni2P/Zr-SBA-15 and catalyzed Jatropha Oil to produce bio-aviation fuel. Renew. Energy 2020, 150, 370–381. [Google Scholar] [CrossRef]
- Liu, W.-L.; Lo, S.-H.; Singco, B.; Yang, C.-C.; Huang, H.-Y.; Lin, C.-H. Novel trypsin–FITC@MOF bioreactor efficiently catalyzes protein digestion. J. Mater. Chem. B 2013, 1, 928–932. [Google Scholar] [CrossRef]
- Narasimhan, M.; Chandrasekaran, M.; Govindasamy, S.; Aravamudhan, A. Heterogeneous nanocatalysts for Sustainable Biodiesel production: A review. J. Environ. Chem. Eng. 2021, 9, 104876. [Google Scholar] [CrossRef]
- Salis, A.; Casula, M.F.; Bhattacharyya, M.S.; Pinna, M.; Solinas, V.; Monduzzi, M. Physical and Chemical Lipase Adsorption on SBA-15: Effect of Different Interactions on Enzyme Loading and Catalytic Performance. Chemcatchem 2010, 2, 322–329. [Google Scholar] [CrossRef]
- Adnan, M.; Li, K.; Wang, J.; Xu, L.; Yan, Y. Hierarchical ZIF-8 toward Immobilizing Burkholderia cepacia Lipase for Application in Biodiesel Preparation. Int. J. Mol. Sci. 2018, 19, 1424. [Google Scholar] [CrossRef]
- Gascón-Pérez, V.; Jiménez, M.B.; Molina, A.; Blanco, R.M.; Sánchez-Sánchez, M. Efficient One-Step Immobilization of CaLB Lipase over MOF Support NH2-MIL-53(Al). Catalysts 2020, 10, 918. [Google Scholar] [CrossRef]
- Zdarta, J.; Meyer, A.; Jesionowski, T.; Pinelo, M. A general overview of support materials for enzyme immobilization: Characteristics, properties, practical utility. Catalysts 2018, 8, 92. [Google Scholar] [CrossRef]
- Fernandez-Lorente, G.; Rocha-Martín, J.; Guisan, J.M. Immobilization of Lipases by Adsorption on Hydrophobic Supports: Modulation of Enzyme Properties in Biotransformations in Anhydrous Media. Methods Mol. Biol. 2020, 2100, 143–158. [Google Scholar] [CrossRef] [PubMed]
- Nobakht, N.; Faramarzi, M.A.; Shafiee, A.; Khoobi, M.; Rafiee, E. Polyoxometalate-metal organic framework-lipase: An efficient green catalyst for synthesis of benzyl cinnamate by enzymatic esterification of cinnamic acid. Int. J. Biol. Macromol. 2018, 113, 8–19. [Google Scholar] [CrossRef]
- Nadar, S.S.; Rathod, V.K. Encapsulation of Lipase within the metal-organic framework (MOF) with enhanced activity intensified under ultrasound. Enzym. Microb. Technol. 2018, 108, 11–20. [Google Scholar] [CrossRef] [PubMed]
- Huo, J.; Aguilera-Sigalat, J.; El-Hankari, S.; Bradshaw, D. Magnetic MOF microreactors for recyclable size-selective biocatalysis. Chem. Sci. 2015, 6, 1938–1943. [Google Scholar] [CrossRef] [PubMed]
- Rafiei, S.; Tangestaninejad, S.; Horcajada, P.; Moghadam, M.; Mirkhani, V.; Mohammadpoor-Baltork, I.; Kardanpour, R.; Zadehahmadi, F. Efficient biodiesel production using a lipase@ZIF-67 nanobioreactor. Chem. Eng. J. 2018, 334, 1233–1241. [Google Scholar] [CrossRef]
- Al-Mansouri, R.; Du, W.; Al-Zuhair, S. Reaction-diffusion model to describe biodiesel production using lipase encapsulated in ZIF-8. Fuel 2022, 311, 122630. [Google Scholar] [CrossRef]
- Zhang, Q.; Lei, D.; Luo, Q.; Wang, J.; Deng, T.; Zhang, Y.; Ma, P. Efficient biodiesel production from oleic acid using metal-organic framework encapsulated Zr-doped polyoxometalate nano-hybrids. RSC Adv. 2020, 10, 8766–8772. [Google Scholar] [CrossRef] [PubMed]
- Shomal, R.; Du, W.; Al-Zuhair, S. Immobilization of Lipase on Metal-Organic frameworks for biodiesel production. J. Environ. Chem. Eng. 2022, 10, 107265. [Google Scholar] [CrossRef]
- Xia, H.; Li, N.; Zhong, X.; Jiang, Y. Metal-Organic Frameworks: A Potential Platform for Enzyme Immobilization and Related Applications. Front. Bioeng. Biotechnol. 2020, 8, 695. [Google Scholar] [CrossRef]
- Yin, H.; Kim, H.; Choi, J.; Yip, A.C. Thermal stability of ZIF-8 under oxidative and inert environments: A practical perspective on using ZIF-8 as a catalyst support. Chem. Eng. J. 2015, 278, 293–300. [Google Scholar] [CrossRef]
- Feng, X.; Carreon, M.A. Kinetics of transformation on ZIF-67 crystals. J. Cryst. Growth 2015, 418, 158–162. [Google Scholar] [CrossRef]
- El-Naas, M.H.; Al-Zuhair, S.; Abu Alhaija, M. Reduction of COD in refinery wastewater through adsorption on date-pit activated carbon. J. Hazard. Mater. 2010, 173, 750–757. [Google Scholar] [CrossRef]
- Shi, Q.; Chen, Z.; Song, Z.; Li, J.; Dong, J. Synthesis of ZIF-8 and ZIF-67 by Steam-Assisted Conversion and an Investigation of Their Tribological Behaviors. Angew. Chem. 2010, 123, 698–701. [Google Scholar] [CrossRef]
- Hu, Y.; Zhou, H.; Dai, L.; Liu, D.; Al-Zuhair, S.; Du, W. Lipase Immobilization on Macroporous ZIF-8 for Enhanced Enzymatic Biodiesel Production. ACS Omega 2021, 6, 2143–2148. [Google Scholar] [CrossRef] [PubMed]
- Thommes, M.; Kaneko, K.; Neimark, A.V.; Olivier, J.P.; Rodriguez-Reinoso, F.; Rouquerol, J.; Sing, K.S.W. Physisorption of gases, with special reference to the evaluation of surface area and pore size distribution (IUPAC Technical Report). Pure Appl. Chem. 2015, 87, 1051–1069. [Google Scholar] [CrossRef]
- Egbosiuba, T.; Abdulkareem, A.; Kovo, A.; Afolabi, E.; Tijani, J.; Auta, M.; Roos, W. Ultrasonic enhanced adsorption of methylene blue onto the optimized surface area of activated carbon: Adsorption isotherm, kinetics and thermodynamics. Chem. Eng. Res. Des. 2019, 153, 315–336. [Google Scholar] [CrossRef]
- Karam, E.A.; Wahab, W.A.A.; Saleh, S.A.; Hassan, M.E.; Kansoh, A.L.; Esawy, M.A. Production, immobilization and thermodynamic studies of free and immobilized Aspergillus awamori amylase. Int. J. Biol. Macromol. 2017, 102, 694–703. [Google Scholar] [CrossRef] [PubMed]
- Fu, Y.; Guan, E.; Liang, J.; Ren, G.; Chen, L. Probing the Effect of Ag2S Quantum Dots on Human Serum Albumin Using Spectral Techniques. J. Nanomater. 2017, 2017, 7209489. [Google Scholar] [CrossRef]
- Taher, H.; Nashef, E.; Anvar, N.; Al-Zuhair, S. Enzymatic production of biodiesel from waste oil in ionic liquid medium. Biofuels 2017, 10, 463–472. [Google Scholar] [CrossRef]
- Ou, J.; Yuan, X.; Liu, Y.; Zhang, P.; Xu, W.; Tang, K. Lipase from pseudomonas Cepacia immobilized into ZIF-8 as biocatalyst for enantioselective hydrolysis and transesterification. Process Biochem. 2021, 102, 132–140. [Google Scholar] [CrossRef]
- Chuanbin, F.; Lulu, W.; Cungang, X.; Jinmiao, W.; Bin, Z.; Wenbo, L.; Xia, Z.; Ziao, Z.; Yuhua, F. High-Efficiency Organic Contaminants Remover Based on Modulated Self-Assembly of Cobalt Metal-Organic Frameworks. Cryst. Growth Des. 2021, 21, 4305–4317. [Google Scholar]
- Pooja, S.; Anbarasan, B.; Ponnusami, V.; Arumugam, A. Efficient production and optimization of biodiesel from kapok (Ceiba pentandra) oil by lipase transesterification process: Addressing positive environmental impact. Renew. Energy 2020, 165, 619–631. [Google Scholar] [CrossRef]
- Nguyen, H.C.; Liang, S.-H.; Doan, T.T.; Su, C.-H.; Yang, P.-C. Lipase-catalyzed syn-thesis of biodiesel from black soldier fly (Hermetica illucens): Optimization by using response surface methodology. Energy Convers. Manag. 2017, 145, 335–342. [Google Scholar] [CrossRef]
- Langmuir, I. The constitution and fundamental properties of solids and liquids II liquids. J. Am. Chem. Soc. 1917, 39, 1848–1906. [Google Scholar] [CrossRef]
- Langmuir, I. The adsorption of gases on plane surfaces of glass, mica and platinum. J. Am. Chem. Soc. 1918, 40, 1361–1403. [Google Scholar] [CrossRef]
- Freundlich, H.M.F. Über die Adsorption in Lösungen. Z. Phys. Chem. 1906, 57, 385–470. [Google Scholar] [CrossRef]
- Freundlich, H.M.F.; Hatfield, H.S. Colloid and Capillary Chemistry; ACS Publications: Washington, DC, USA, 1926. [Google Scholar]
- Freundlich, H.M.F. Of the adsorption of gases. Section II. Kinetics and energetics of gas adsorption. Introductory paper to section II. Trans. Faraday Soc. 1932, 28, 195–201. [Google Scholar] [CrossRef]
- Freundlich, H.M.F. Kapillarchemie, Eine Darstellung der Chemie der Kolloide und verwandter Gebiete; Akademische Verlagsgesellschaft: Leipzig, Germany, 1922; Available online: https://openlibrary.org/books/OL15094083M/Kapillarchemie (accessed on 16 May 2023).
- Bradford, M.M. A rapid and sensitive method for the quantitation of microgram quantities of protein utilizing the principle of protein-dye binding. Anal. Biochem. 1976, 72, 248–254. [Google Scholar] [CrossRef]
- Rudziński, W.; Tóth, J.; Jaroniec, M. Graphical estimation of adsorbent heterogeneity. Phys. Lett. A 1972, 449–450. [Google Scholar] [CrossRef]
- Tóth, J. Uniform interpretation of gas/solid adsorption. Adv. Colloid Interface Sci. 1995, 55, 1–239. [Google Scholar] [CrossRef]
- Toth, J. State equation of the solid gas interface layer. Acta Chim. Acad. Sci. Hung. 1971, 69, 311–317. [Google Scholar]
- Redlich, O.; Peterson, D.L. A Useful Adsorption Isotherm. J. Phys. Chem. 1959, 63, 1024. [Google Scholar] [CrossRef]
- Sips, R. On the Structure of a Catalyst Surface. J. Chem. Phys. 1948, 16, 490–495. [Google Scholar] [CrossRef]
- Monteiro, R.R.; de Oliveira, A.L.B.; de Menezes, F.L.; de Souza, M.C.M.; Fechine, P.B.; dos Santos, J.C. Improvement of enzymatic activity and stability of lipase A from Candida antartica onto halloysite nanotubes with Taguchi method for optimized immobilization. Appl. Clay Sci. 2022, 228, 106634. [Google Scholar] [CrossRef]
- Radke, C.J.; Prausnitz, J.M. Thermodynamics of multi-solute adsorption from dilute liquid solutions. AIChE J. 1972, 18, 761–768. [Google Scholar] [CrossRef]
- Lagergren, S. Zur theorie der sogenannten adsorption gelöster stuffe, Bihang till K. Svenska Vet. Akad. Handlingar 1898, 24, 1–39. [Google Scholar]
- Ho, Y.; Mckay, G. Kinetic Models for the Sorption of Dye from Aqueous Solution by Wood. Process Saf. Environ. Prot. 1998, 76, 183–191. [Google Scholar] [CrossRef]
- Weber, W.J.; Morris, J.C. Kinetics of Adsorption on Carbon from Solution. J. Sanit. Eng. Div. Am. Soc. Civ. Eng. 1963, 89, 31–59. [Google Scholar] [CrossRef]
- Elovich, S.Y.; Zhabrova, G. Mechanism of the catalytic hydrogenation of ethylene on nickel: I. Kinetics of the process. J. Phys. Chem. 1939, 13, 1761–1764. [Google Scholar]
- Yingli, H.; Lingmei, D.; Dehua, L.; Wei, D.; Yujun, W. Progress & prospect of met-al-organic frameworks (MOFs) for enzyme immobilization (enzyme/MOFs). Renew. Sustain. Energy Rev. 2018, 91, 793–801. [Google Scholar]


| Samples | SBET [m2·g−1] | DA (P/P0 < 0.1) | DFT (P/P0 10−7 − 1) | ||||
|---|---|---|---|---|---|---|---|
| Vmic [cm3·g−1] | Eo [kJ·mol−1] | n | Pore Radius [Å] | VP [cm3·g−1] | Half PoreWidth [Å] | ||
| MOF-199 | 1750 | 0.66 | 8.47 | 3.4 | 7.0 | 0.69 | 3.52 |
| CAL-MOF-199 | 1400 | 0.54 | 8.21 | 3.1 | 5.5 | 0.55 | 2.70 |
| ZIF-8 | 1733 | 0.88 | 4.47 | 3.4 | 8.6 | 0.65 | 4.63 |
| CALB-ZIF-8 | 1350 | 0.73 | 4.12 | 2.9 | 7.2 | 0.59 | 4.00 |
| Model | Parameters | CALB-ZIF-8 | ||
|---|---|---|---|---|
| 25 °C | 30 °C | 40 °C | ||
| Langmuir | qmax (mg·g−1) | 27.64 | 32.12 | 36.78 |
| KL (mg−1·g−1) | 7875 | 8034 | 8934 | |
| R2 | 0.9789 | 0.9789 | 0.9834 | |
| RL | 0.015 | 0.019 | 0.021 | |
| Freundlich | KF (mg·g−1) (L·mg−1) 1/n | 6845 | 7987 | 8005 |
| 1/n | 0.301 | 0.312 | 0.379 | |
| R2 | 0.9843 | 0.9834 | 0.9856 | |
| Sips | qmax (mg·g−1) | 30.79 | 38.57 | 41.07 |
| Ks (L·mg−1) | 0.3487 | 0.2394 | 0.2065 | |
| ns | 0.8943 | 0.8631 | 0.8304 | |
| R2 | 0.9993 | 0.9989 | 0.9985 | |
| Redlich-Peterson (RP) | KR (L·g−1) | 0.894 | 1765 | 1898 |
| aR (L·mg−1) | 0.398 | 0.299 | 0.272 | |
| β | 0.865 | 0.887 | 0.898 | |
| R2 | 0.9587 | 0.9698 | 0.9456 | |
| Radke Prausnitz | qmRP (mg·g−1) | 27.98 | 29.67 | 30.73 |
| KRP (L·mg−1) | 0.078 | 0.086 | 0.094 | |
| mRP | 1087 | 1435 | 1754 | |
| R2 | 0.9876 | 0.9798 | 0.9895 | |
| Toth | qmT (mg·g−1) | 28.54 | 33.88 | 35.67 |
| KT | 0.354 | 0.185 | 0.234 | |
| mT | 0.786 | 0.804 | 0.847 | |
| R2 | 0.9876 | 0.9910 | 0.9854 | |
| T (°C) | Co | qe (mg·g−1) | Pseudo-First Order | Pseudo-Second Order | Elovich Model | ||||
|---|---|---|---|---|---|---|---|---|---|
| k1 (min−1) | R2 | k2 (g/mg·min) | R2 | α (m/g/min) | 1/β (mg/g) | R2 | |||
| CALB-MOF-199 | |||||||||
| 25 | 1.2 | 21.34 | 0.0165 | 0.865 | 0.0087 | 0.916 | 3.456 | 2.154 | 0.967 |
| 0.9 | 18.89 | 0.0189 | 0.856 | 0.0122 | 0.903 | 3.165 | 2.078 | 0.974 | |
| 0.6 | 16.56 | 0.0216 | 0.810 | 0.0146 | 0.892 | 2.678 | 1.896 | 0.962 | |
| 0.3 | 15.74 | 0.0365 | 0.845 | 0.0245 | 0.898 | 2.345 | 1.654 | 0.981 | |
| 30 | 1.2 | 23.34 | 0.0254 | 0.798 | 0.0076 | 0.912 | 3.765 | 3.154 | 0.943 |
| 0.9 | 19.65 | 0.0278 | 0.795 | 0.0116 | 0.943 | 3.376 | 2.986 | 0.967 | |
| 0.6 | 18.67 | 0.0306 | 0.795 | 0.0116 | 0.943 | 3.376 | 2.986 | 0.967 | |
| 0.3 | 17.56 | 0.0389 | 0.812 | 0.0213 | 0.904 | 2.896 | 1.967 | 0.987 | |
| 40 | 1.2 | 26.34 | 0.0345 | 0.797 | 0.0063 | 0.934 | 5.875 | 4.034 | 0.978 |
| 0.9 | 21.96 | 0.0374 | 0.807 | 0.0104 | 0.921 | 4.965 | 3.871 | 0.985 | |
| 0.6 | 18.26 | 0.0387 | 0.804 | 0.0124 | 0.912 | 4.762 | 2.987 | 0.976 | |
| 0.3 | 17.32 | 0.0402 | 0.808 | 0.0202 | 0.899 | 3.986 | 2.487 | 0.956 | |
| CALB-ZIF-8 | |||||||||
| 25 | 1.2 | 19.45 | 0.0168 | 0.832 | 0.0058 | 0.934 | 3.876 | 2.376 | 0.919 |
| 0.9 | 17.87 | 0.0176 | 0.834 | 0.158 | 0.925 | 3.653 | 2.267 | 0.921 | |
| 0.6 | 15.12 | 0.0201 | 0.810 | 0.0187 | 0.932 | 3.521 | 2.056 | 0.937 | |
| 0.3 | 14.76 | 0.0304 | 0.786 | 0.0289 | 0.912 | 3.312 | 1.965 | 0.934 | |
| 30 | 1.2 | 22.52 | 0.0215 | 0.734 | 0.0046 | 0.906 | 3.985 | 3.452 | 0.923 |
| 0.9 | 18.31 | 0.0287 | 0.782 | 0.0164 | 0.909 | 4.763 | 3.296 | 0.965 | |
| 0.6 | 17.10 | 0.0300 | 0.796 | 0.0174 | 0.934 | 4.965 | 3.038 | 0.965 | |
| 0.3 | 16.23 | 0.0321 | 0.895 | 0.0265 | 0.901 | 5.098 | 2.896 | 0.976 | |
| 40 | 1.2 | 23.33 | 0.275 | 0.876 | 0.0032 | 0.921 | 6.231 | 4.342 | 0.934 |
| 0.9 | 20.05 | 0.0295 | 0.854 | 0.0153 | 0.902 | 5.865 | 4.106 | 0.976 | |
| 0.6 | 19.56 | 0.0312 | 0.845 | 0.0166 | 0.943 | 5.321 | 3.892 | 0.947 | |
| 0.3 | 18.45 | 0.0355 | 0.807 | 0.0243 | 0.931 | 5.031 | 3.753 | 0.967 | |
| T (°C) | Co | qe (mg·g−1) | Intraparticle Diffusion (IPD) | |||
|---|---|---|---|---|---|---|
| Kpi1 | Kpi2 | Ci (nm2·min−1) | R2 | |||
| CALB-MOF-199 | ||||||
| 25 | 1.2 | 21.34 | 12.98 | 10.67 | 0.0076 | 0.997 |
| 0.9 | 18.89 | 10.64 | 9.65 | 0.0087 | 0.994 | |
| 0.6 | 16.56 | 9.96 | 8.45 | 0.0245 | 0.998 | |
| 0.3 | 15.74 | 9.65 | 7.85 | 0.0287 | 0.994 | |
| 30 | 1.2 | 23.34 | 13.98 | 12.92 | 0.0121 | 0.992 |
| 0.9 | 19.65 | 11.43 | 11.65 | 0.0189 | 0.998 | |
| 0.6 | 18.67 | 10.07 | 9.87 | 0.0256 | 0.998 | |
| 0.3 | 17.56 | 9.87 | 8.94 | 0.0298 | 0.999 | |
| 40 | 1.2 | 22.76 | 14.43 | 13.32 | 0.0132 | 0.994 |
| 0.9 | 21.96 | 13.21 | 12.02 | 0.0143 | 0.992 | |
| 0.6 | 18.26 | 12.76 | 11.98 | 0.0321 | 0.997 | |
| 0.3 | 17.56 | 11.07 | 10.65 | 0.0346 | 0.998 | |
| CALB-ZIF-8 | ||||||
| 25 | 1.2 | 19.45 | 13.12 | 12.34 | 0.0084 | 0.997 |
| 0.9 | 17.87 | 12.32 | 11.64 | 0.0097 | 0.996 | |
| 0.6 | 15.12 | 11.45 | 10.65 | 0.0256 | 0.994 | |
| 0.3 | 14.76 | 11.02 | 9.87 | 0.0297 | 0.993 | |
| 30 | 1.2 | 22.52 | 14.21 | 13.76 | 0.0136 | 0.997 |
| 0.9 | 18.31 | 13.77 | 12.86 | 0.0198 | 0.994 | |
| 0.6 | 17.10 | 12.87 | 11.98 | 0.0287 | 0.993 | |
| 0.3 | 16.23 | 12.22 | 10.76 | 0.0318 | 0.996 | |
| 40 | 1.2 | 23.33 | 14.87 | 14.34 | 0.0146 | 0.997 |
| 0.9 | 20.05 | 13.03 | 13.21 | 0.0177 | 0.993 | |
| 0.6 | 19.56 | 11.82 | 12.54 | 0.0443 | 0.996 | |
| 0.3 | 18.45 | 11.02 | 11.43 | 0.0487 | 0.997 | |
| Adsorption Models | Description |
|---|---|
| Langmuir | This isotherm is based on three assumptions: adsorption is limited to the monolayer coverage, all surface sites are equal, and the ability of a molecule to be adsorbed at a given site is independent of its occupancy of neighboring sites [44,45,46]. |
| Freundilch | The Freundlich Isotherm is a widely used empirical equation for describing adsorption equilibrium. The plot of log qe against log Ce has a slope with the value of 1/n, and the intercept is KF. log KF is equivalent to log qe when Ce = 1. However, in another case, when 1/n, the KF value depends on the units in which qe and Ce are expressed . On average, a favorable adsorption Freundlich constant, n, is between 1 and 10. Increasing n implies a greater interaction between adsorbate and adsorbent, while 1/n = 1 indicates linear adsorption leading to higher adsorption energies, identical for all sites [47,48,49]. |
| Toth | This isotherm is derived from the potential theory. The Toth equation has proven to be a valuable tool in describing adsorption for heterogeneous systems. A quasi-Gaussian asymmetric energy distribution with the left side broadened is assumed, i.e., most adsorption sites have less energy than the mean value [50,51,52,53]. |
| Redlich-Peterson | Redlich-Paterson is an empirical equation, designated as the “three parameter equation”, capable of representing adsorption at equilibrium over a wide range of concentrations. Redlich and Peterson incorporate the features of the Langmuir and Freundlich isotherms into a single equation. Frequently applied in homogeneous or heterogeneous adsorption processes. There are two limiting behaviors, i.e., the Langmuir form and Henry’s law form [54]. |
| Sips | The Sips isotherm combines the Langmuir and Freundlich isotherms and is given the above general equation (left-hand side). Here Ks is the constant of the Sips isotherm model (L·g−1), 𝛽𝑠 is the Sips isotherm exponent, and 𝑎𝑠 is the constant of the Sips isotherm model (L·g−1). The above right-hand paragraph also gives the linearized form [55]. This model is suitable for predicting adsorption on heterogeneous surfaces, thus avoiding the limitation that normally occurs during increasing adsorbate concentration, normally associated with the Freundlich model [55]. Therefore, this model reduces to the Freundlich model at low adsorbate concentrations, but at high adsorbate concentrations it predicts the Langmuir model (monolayer adsorption). The parameters of the Sips isotherm are a function of the pH, temperature, and concentration +, and isotherm constants differ by linearization and non-linear regression [55]. |
| Radke Prausnitz | The Radke-Prausnitz isotherm model has several important properties that make it very useful in adsorption at low adsorbate concentrations [56]. The previous expression gives the isotherm. In this equation, qmrp is the maximum Radke-Prausnitz adsorption capacity (mg·g−1), KPR is the Radke-Prausnitz equilibrium constant, and MRP is the exponent of the Radke-Prausnitz model. At a low adsorbate concentration, this model isotherm reduces to a linear isotherm, while at a high adsorbate concentration, it becomes the Freundlich isotherm, and when MPR = 0, it becomes the Langmuir isotherm. Another important feature of this isotherm is that it fits a wide range of adsorbate concentrations well. In this Radke-Prausnitz model, the model parameters are obtained by non-linear statistical fitting of experimental data [57]. |
| Kinetic Models | Description |
|---|---|
| Pseudo-First Order (Lagergren’s model) | The model given by Langergren is defined as Integrating the equation concerning the boundary conditions q = 0 at = 0 and q = qe at = t, we obtain where k1 is the Lagergren adsorption rate constant (min−1); qt and qe are the amounts adsorbed at a time t and equilibrium, respectively, t in (min). The plot of log(qe − qt) as a function of time; the intercept is log qe and the slope is k1 [58]. |
| Pseudo-Second Order | The pseudo second order equation based on equilibrium adsorption is expressed as: Separating the variables in the above equation, we obtain Integrating this equation with respect to the boundary conditions q = 0 at = 0 and q = qe at = t, we obtain: where k2 is the pseudo second order rate constant (g·mg−1·min−1); qt and qe are the amounts adsorbed at time t and equilibrium, respectively. The line graph of t/qt as a function of time has 1/qe as the slope and 1/k2 as the intercept. This rate constant is used to calculate the initial adsorption rate, h (mg·g−1·min−1), where qe is the equilibrium adsorption capacity, k2 (mg·g−1·min−1) is determined experimentally from the slope e intercept of the t/q plot versus t [59]. |
| Intraparticle model (Weber-Morris) | Kinetic models do not identify the diffusion mechanism. The intraparticle diffusion model based on the theory proposed by Weber and Morris establishes a common empirical relationship in most adsorption processes since it varies proportionally with t1/2 more than with the contact time t. According to this theory, we have: where kpi (mg·g−1·min−1/2), the speed parameter for each stage, is obtained from the line qt versus t1/2 slope. Ci is the intercept of stage i, giving an idea of the thickness of the boundary layer. If intraparticle diffusion occurs, qt versus t1/2 will be linear; if the graph passes through the origin, then the rate-limiting process is only due to intraparticle diffusion. Otherwise, another mechanism is involved along with intraparticle diffusion. In intraparticle diffusion plots, stage I is due to flash adsorption or external surface adsorption, where the adsorbate travels to the external surface of the adsorbent. In stage II, a gradual adsorption occurs where intraparticle diffusion is the rate limiting; that is, the adsorbate travels inside the pores of the adsorbent. In some cases, a stage III represents the final equilibrium where the intraparticle diffusion begins to decrease due to the low concentration of adsorbate; adsorption occurs inside the adsorbent [60]. |
| Elovich model | This model is useful to understand chemisorption in an adsorption process (developed by Zeldowitsch). It makes it possible to predict the diffusion of mass and surface, a system’s activation, and deactivation energy. Although this model was initially used only for gaseous systems, its use was later extended to processes in aqueous solutions. The model assumes that the solute adsorption rate decreases exponentially as the amount of solute adsorbed increases. Since qt ≈ 0, ≈ α is the initial adsorption rate (mg/g·min), and β is the desorption constant. Integrating and applying the limits for t (0, t) and qt 0; qt, the Elovich model can be linearized as: when the system approaches equilibrium, t ≫ 1/αβ, the previous equation becomes: The graph of qt versus at will help to establish the nature of the adsorption on the heterogeneous surface of the adsorbent, whether it is chemisorption or not [61]. |
Disclaimer/Publisher’s Note: The statements, opinions and data contained in all publications are solely those of the individual author(s) and contributor(s) and not of MDPI and/or the editor(s). MDPI and/or the editor(s) disclaim responsibility for any injury to people or property resulting from any ideas, methods, instructions or products referred to in the content. |
© 2023 by the authors. Licensee MDPI, Basel, Switzerland. This article is an open access article distributed under the terms and conditions of the Creative Commons Attribution (CC BY) license (https://creativecommons.org/licenses/by/4.0/).
Share and Cite
Giraldo, L.; Gómez-Granados, F.; Moreno-Piraján, J.C. Biodiesel Production Using Palm Oil with a MOF-Lipase B Biocatalyst from Candida Antarctica: A Kinetic and Thermodynamic Study. Int. J. Mol. Sci. 2023, 24, 10741. https://doi.org/10.3390/ijms241310741
Giraldo L, Gómez-Granados F, Moreno-Piraján JC. Biodiesel Production Using Palm Oil with a MOF-Lipase B Biocatalyst from Candida Antarctica: A Kinetic and Thermodynamic Study. International Journal of Molecular Sciences. 2023; 24(13):10741. https://doi.org/10.3390/ijms241310741
Chicago/Turabian StyleGiraldo, Liliana, Fernando Gómez-Granados, and Juan Carlos Moreno-Piraján. 2023. "Biodiesel Production Using Palm Oil with a MOF-Lipase B Biocatalyst from Candida Antarctica: A Kinetic and Thermodynamic Study" International Journal of Molecular Sciences 24, no. 13: 10741. https://doi.org/10.3390/ijms241310741
APA StyleGiraldo, L., Gómez-Granados, F., & Moreno-Piraján, J. C. (2023). Biodiesel Production Using Palm Oil with a MOF-Lipase B Biocatalyst from Candida Antarctica: A Kinetic and Thermodynamic Study. International Journal of Molecular Sciences, 24(13), 10741. https://doi.org/10.3390/ijms241310741