1. Introduction
Plants are exposed to various abiotic and biotic stress factors in their natural environment [
1]. The effects of multiple stressors frequently occur simultaneously or sequentially. Therefore, as reported by Simmons et al. [
2], the impacts of stress factors can combine additively or, as a result, synergistic or antagonistic effects occur. According to the deliberations of Piggott and co-authors [
3], in the ecological multiple stressor context, it most commonly relates to an additive effects model. In light of the above, synergism is being defined as a cumulative effect of multiple stressors that is bigger than the additive sum of the effects triggered by the stress factors acting independently [
4]. In turn, the term “antagonism” is defined as a cumulative effect that is less than additive. Moreover, it is suggested that when the two stress factors act together, they synergistically alleviate or inhibit their individual visual effects even more than under controlled conditions [
3], but this is not a rule in every experimental setting.
Numerous studies have revealed that phytohormones such as jasmonic acid, ethylene and abscisic acid are components of plant defense responses [
5]. The signaling pathways regulated by these molecules play key roles in the crosstalk between biotic and abiotic stress signaling [
1,
6,
7]. It is known that jasmonates are fatty-acid-derived hormones that are structurally similar to animal prostaglandins and ubiquitous in the plant kingdom [
8]. The best known compounds belonging to jasmonates are jasmonic acid (JA) and its methyl ester—methyl jasmonate (MJ) [
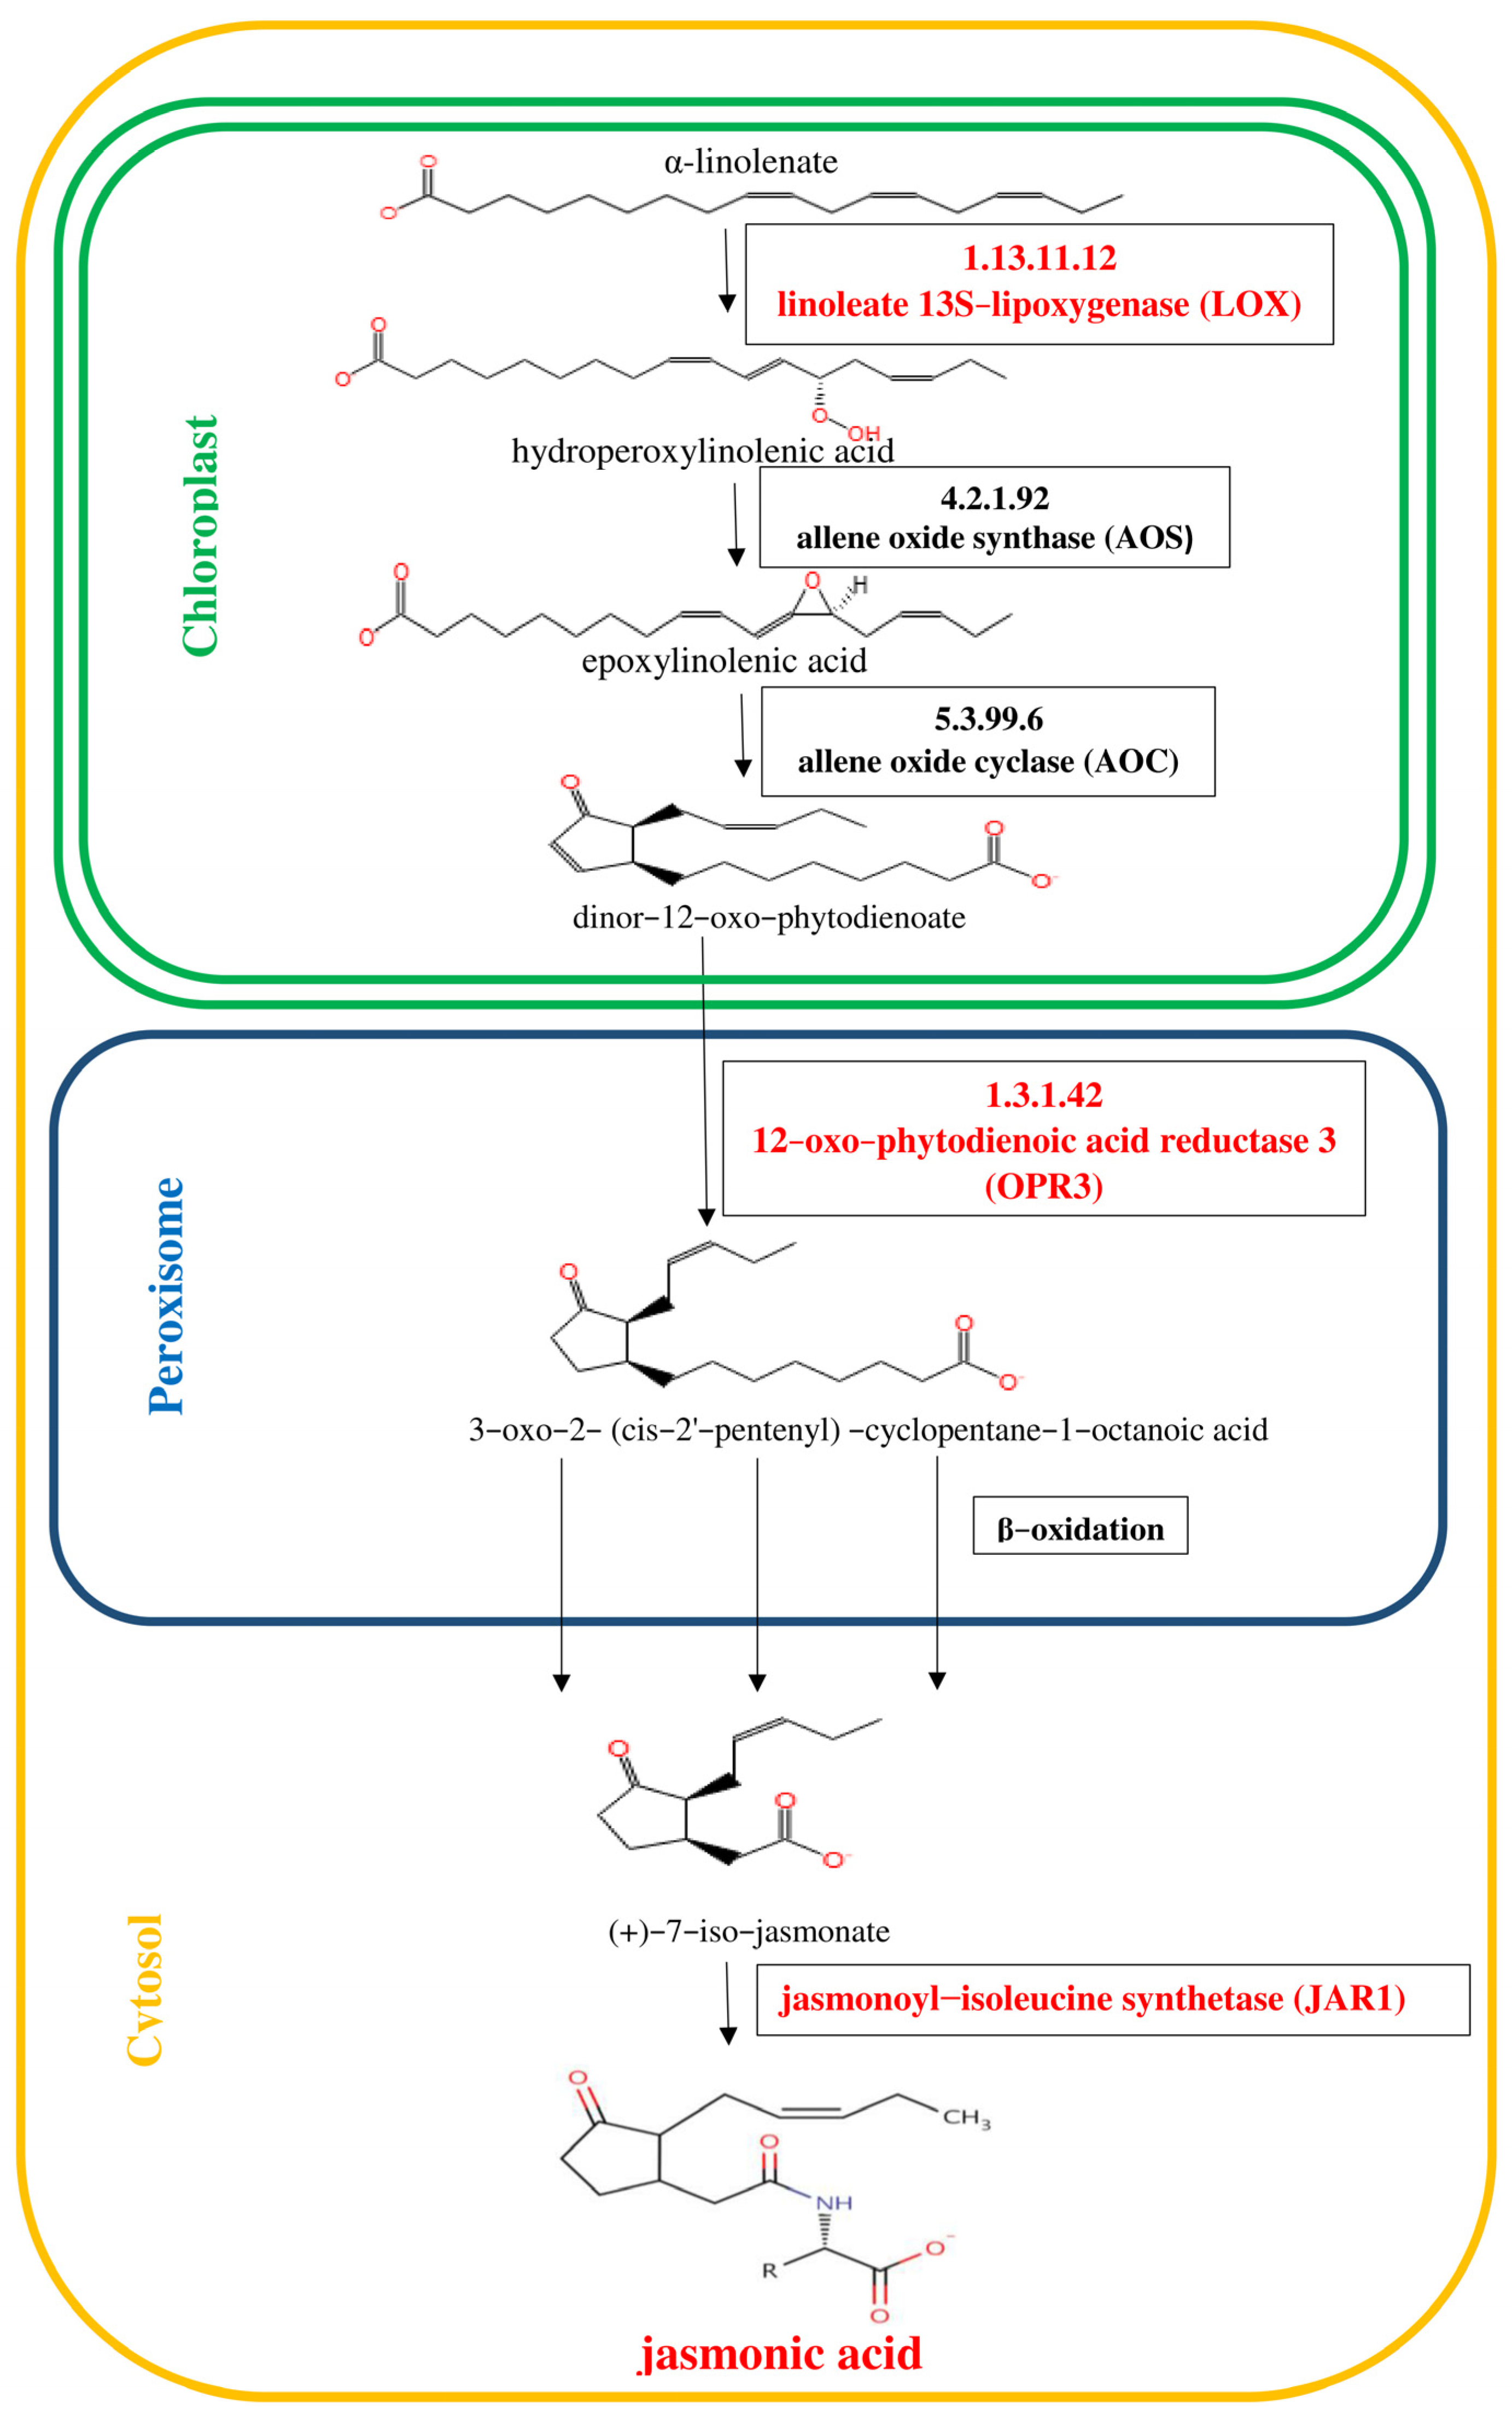
9]. Jasmonates act not only as powerful signals activating plant defenses against herbivores, pathogens, wounding and abiotic stress but also as regulatory molecules in many developmental processes. The octadecanoid pathway of jasmonic acid (JA) biosynthesis is shown in
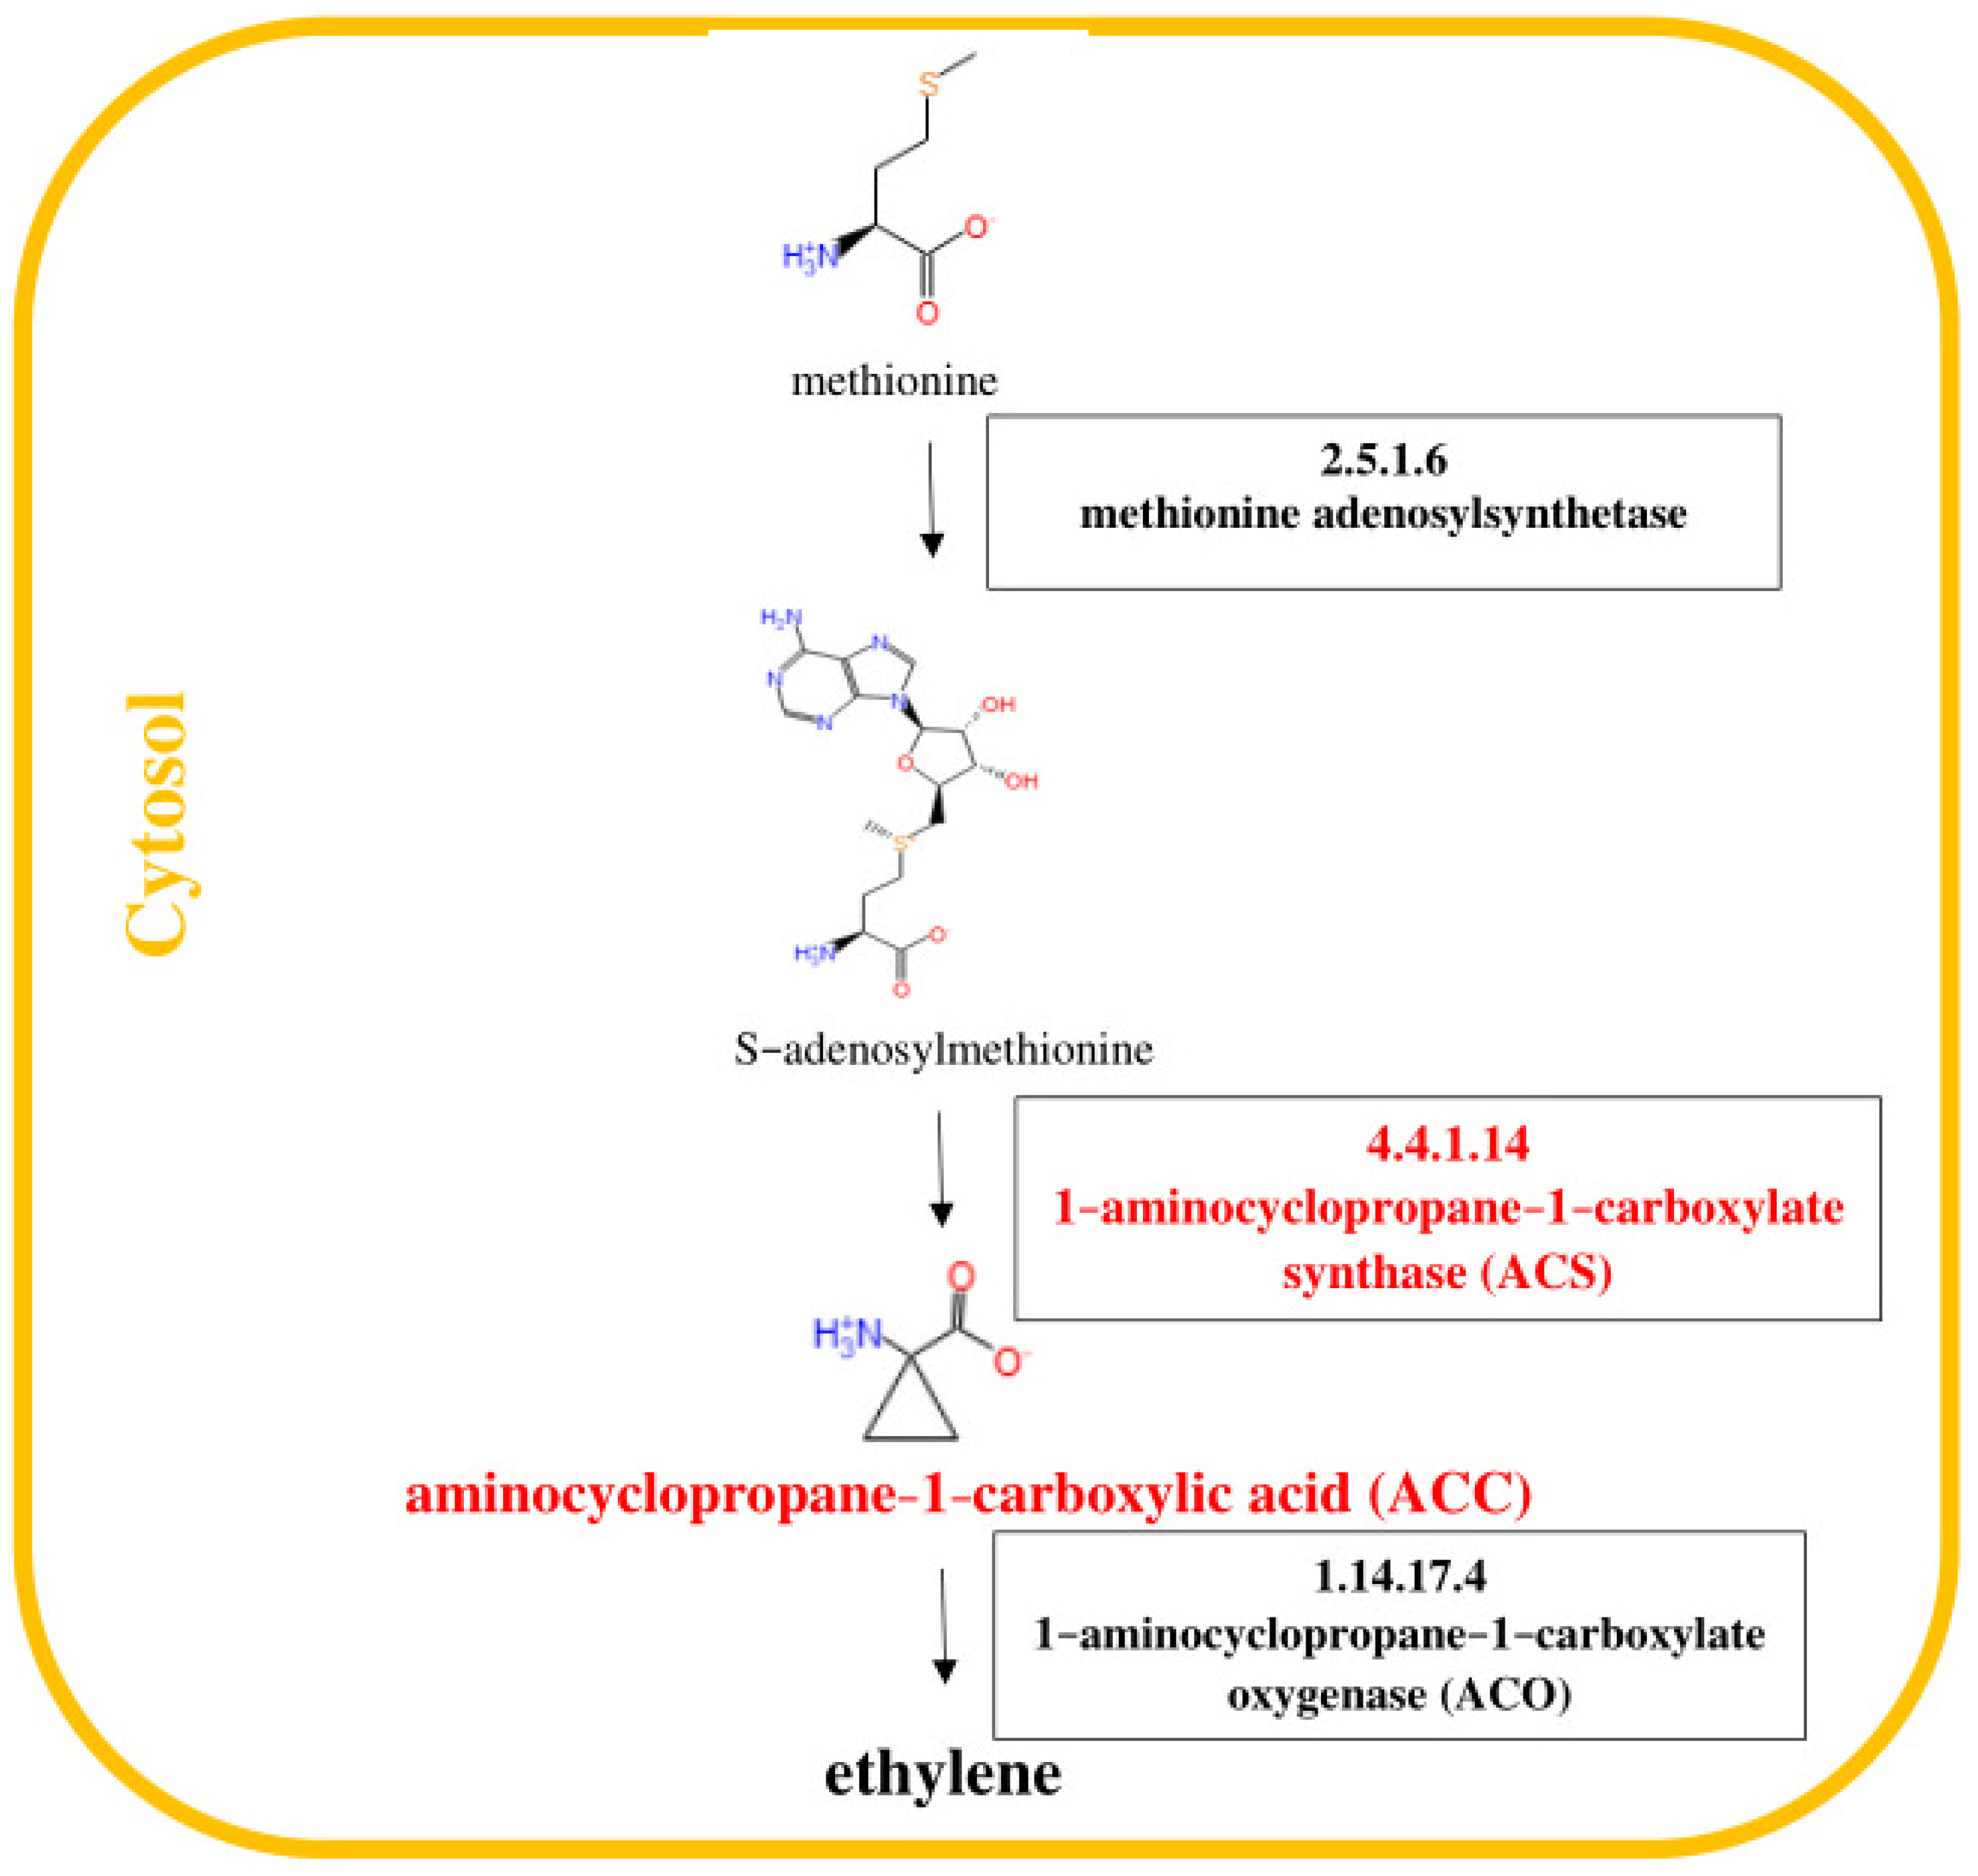
Figure 1. In turn, ethylene is synthesized from L-methionine through the intermediates
S-adenosyl-L-methionine (SAM) and 1-aminocyclopropane-1-carboxylate (ACC) as shown in
Figure 2. Cloning and analysis of 1-aminocyclopropane-1-carboxylate synthase (ACC synthase, EC 4.4.1.14) genes from numerous plants indicated that they form a multigene family that is differentially regulated. The ABA hormone has been associated with plant tolerance to adverse environmental conditions [
10,
11,
12]. The scheme of the biosynthesis of the sesquiterpenoid hormone abscisic acid (ABA) is displayed in
Figure 3. ABA is derived from C40 epoxycarotenoid precursors through oxidative cleavage taking place in plastids [
13]. Then, the C15 intermediate xanthoxin is converted to ABA by a two-step reaction via ABA-aldehyde in the cytosol.
In the present experimental work, we focus on the impact of the heavy metal lead at hormetic (0.075 mM Pb(NO
3)
2) and sublethal (0.5 mM Pb(NO
3)
2) doses and of the crosstalk between lead and a biotic stressor—i.e., pea aphid (
Acyrthosiphon pisum (Harris)), a phytophagous insect with a piercing-sucking mouthpart—on the expression of genes encoding enzymes of the biosynthesis of phytohormones such as jasmonates (JA/MeJA), ethylene (ET) and abscisic acid (ABA). This is the first report revealing the effect of an abiotic stress factor, lead (Pb), at hormetic and sublethal doses and during the combination of Pb stress and pea aphid
A. pisum acting as a biotic factor on the expression of genes encoding enzymes of the biosynthesis of JA/MeJA, ET and ABA. The second objective of this work is to study the effect of Pb on the concentrations of JA/MeJA and ACC-ET precursor, and then to determine cross-interactions of both stresses. The same experimental model, including the application of Pb at hormetic and sublethal doses and the combination of Pb and
A. pisum, was applied in our previous research [
6,
14]. In the referred study, the growth of pea seedlings in the context of the above Pb doses, selected changes in the metabolome and the effect of lead on behavioral responses of
A. pisum during probing in plant tissues were shown. The present study is a continuation of our experimental work performed on the same model of
Pisum sativum L.cv. Cysterski–
A. pisum in order to investigate the defense mechanisms of pea against hormetic and sublethal Pb doses and during the cross-talk between Pb and pea aphids. It should be emphasized that the phenomenon of hormesis is extremely interesting in certain research on the responses of plants to insects at hormetic doses of heavy metals. The toxic effects of heavy metals on plants are generally well documented in the literature [
15,
16,
17,
17,
18,
19,
20,
21].
Hormesis was described by Calabrese and Agathokleous [
22] as a fundamental evolutionary adaptive strategy. Moreover, the above authors reported that hormesis has emerged as a fundamental dose–response phenomenon occurring from local to global scales [
23,
24]. Additionally, questions have also been raised regarding the ecological and evolutionary consequences that hormesis may have [
25,
26,
27]. Furthermore, our previous review paper discussed the impact of heavy metals on the growth of plants at different concentrations, paying particular attention to the hormesis effect [
18]. Study of the hormesis phenomenon has been considered not only in the framework of plant growth stimulation but also as an adaptive response of plants to a low level of stress, which in turn can play an important role in their responses to biotic stressors.
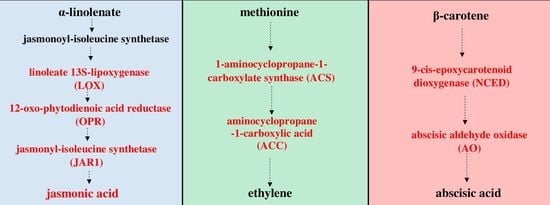
Figure 1.
Octadecanoid pathway of jasmonic acid (JA) biosynthesis [
28]. The initial steps of JA biosynthesis including lipoxygenase (LOX), allene oxide synthase (AOS) and allene oxide cyclase (AOC) lead to the production of 12-oxo-phytodienoic acid (12-OPDA). 12-OPDA is then transported to the peroxisome and reduced to 3-oxo-2-(2′(Z)-pentenyl)-cyclopentane-1-octanoic acid (OPC-8:0), which undergoes three rounds of β-oxidation to yield JA. Genes encoding enzymes involved in the biosynthesis of JA, whose expression was studied, are highlighted in red in the scheme.
Figure 2.
Pathway of ethylene (ET) biosynthesis [
29]. Genes encoding enzymes involved in the biosynthesis of ET, whose expression was studied, are highlighted in red in the scheme.
Figure 2.
Pathway of ethylene (ET) biosynthesis [
29]. Genes encoding enzymes involved in the biosynthesis of ET, whose expression was studied, are highlighted in red in the scheme.
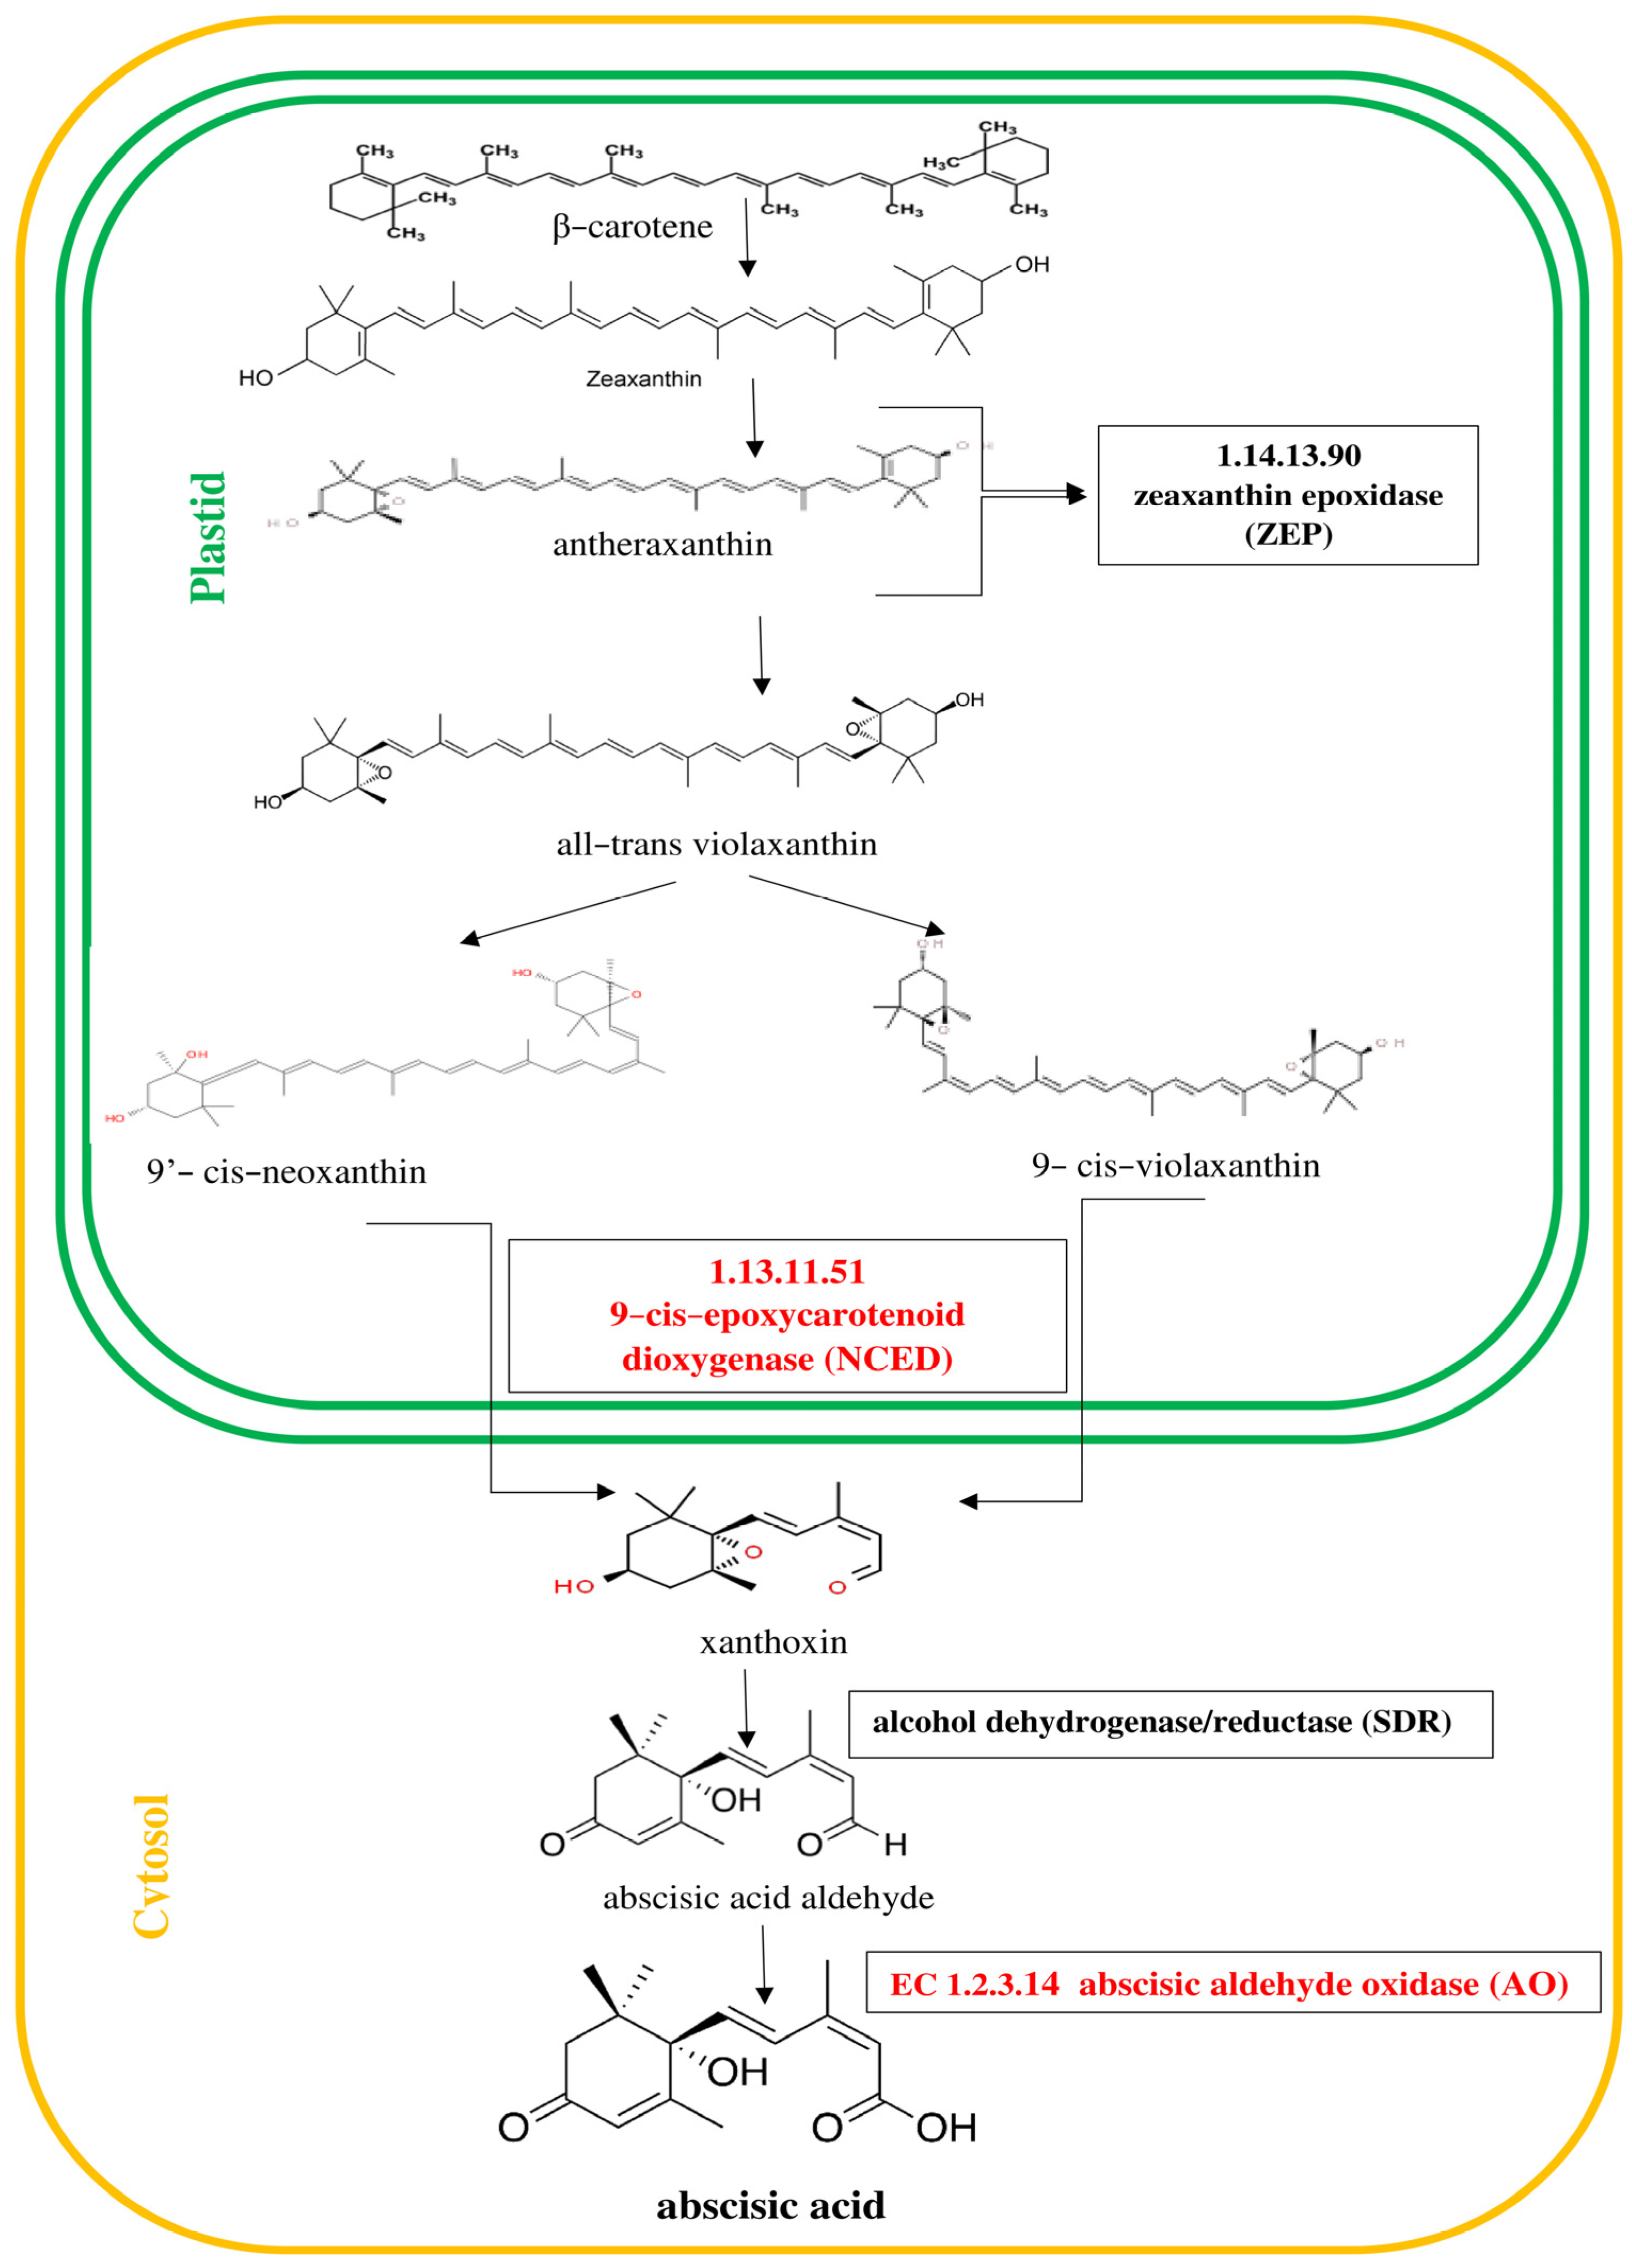
Figure 3.
Pathway of abscisic acid (ABA) biosynthesis [
30]. Genes encoding enzymes involved in the biosynthesis of ABA, whose expression was studied, are highlighted in red in the scheme.
Figure 3.
Pathway of abscisic acid (ABA) biosynthesis [
30]. Genes encoding enzymes involved in the biosynthesis of ABA, whose expression was studied, are highlighted in red in the scheme.
2. Results
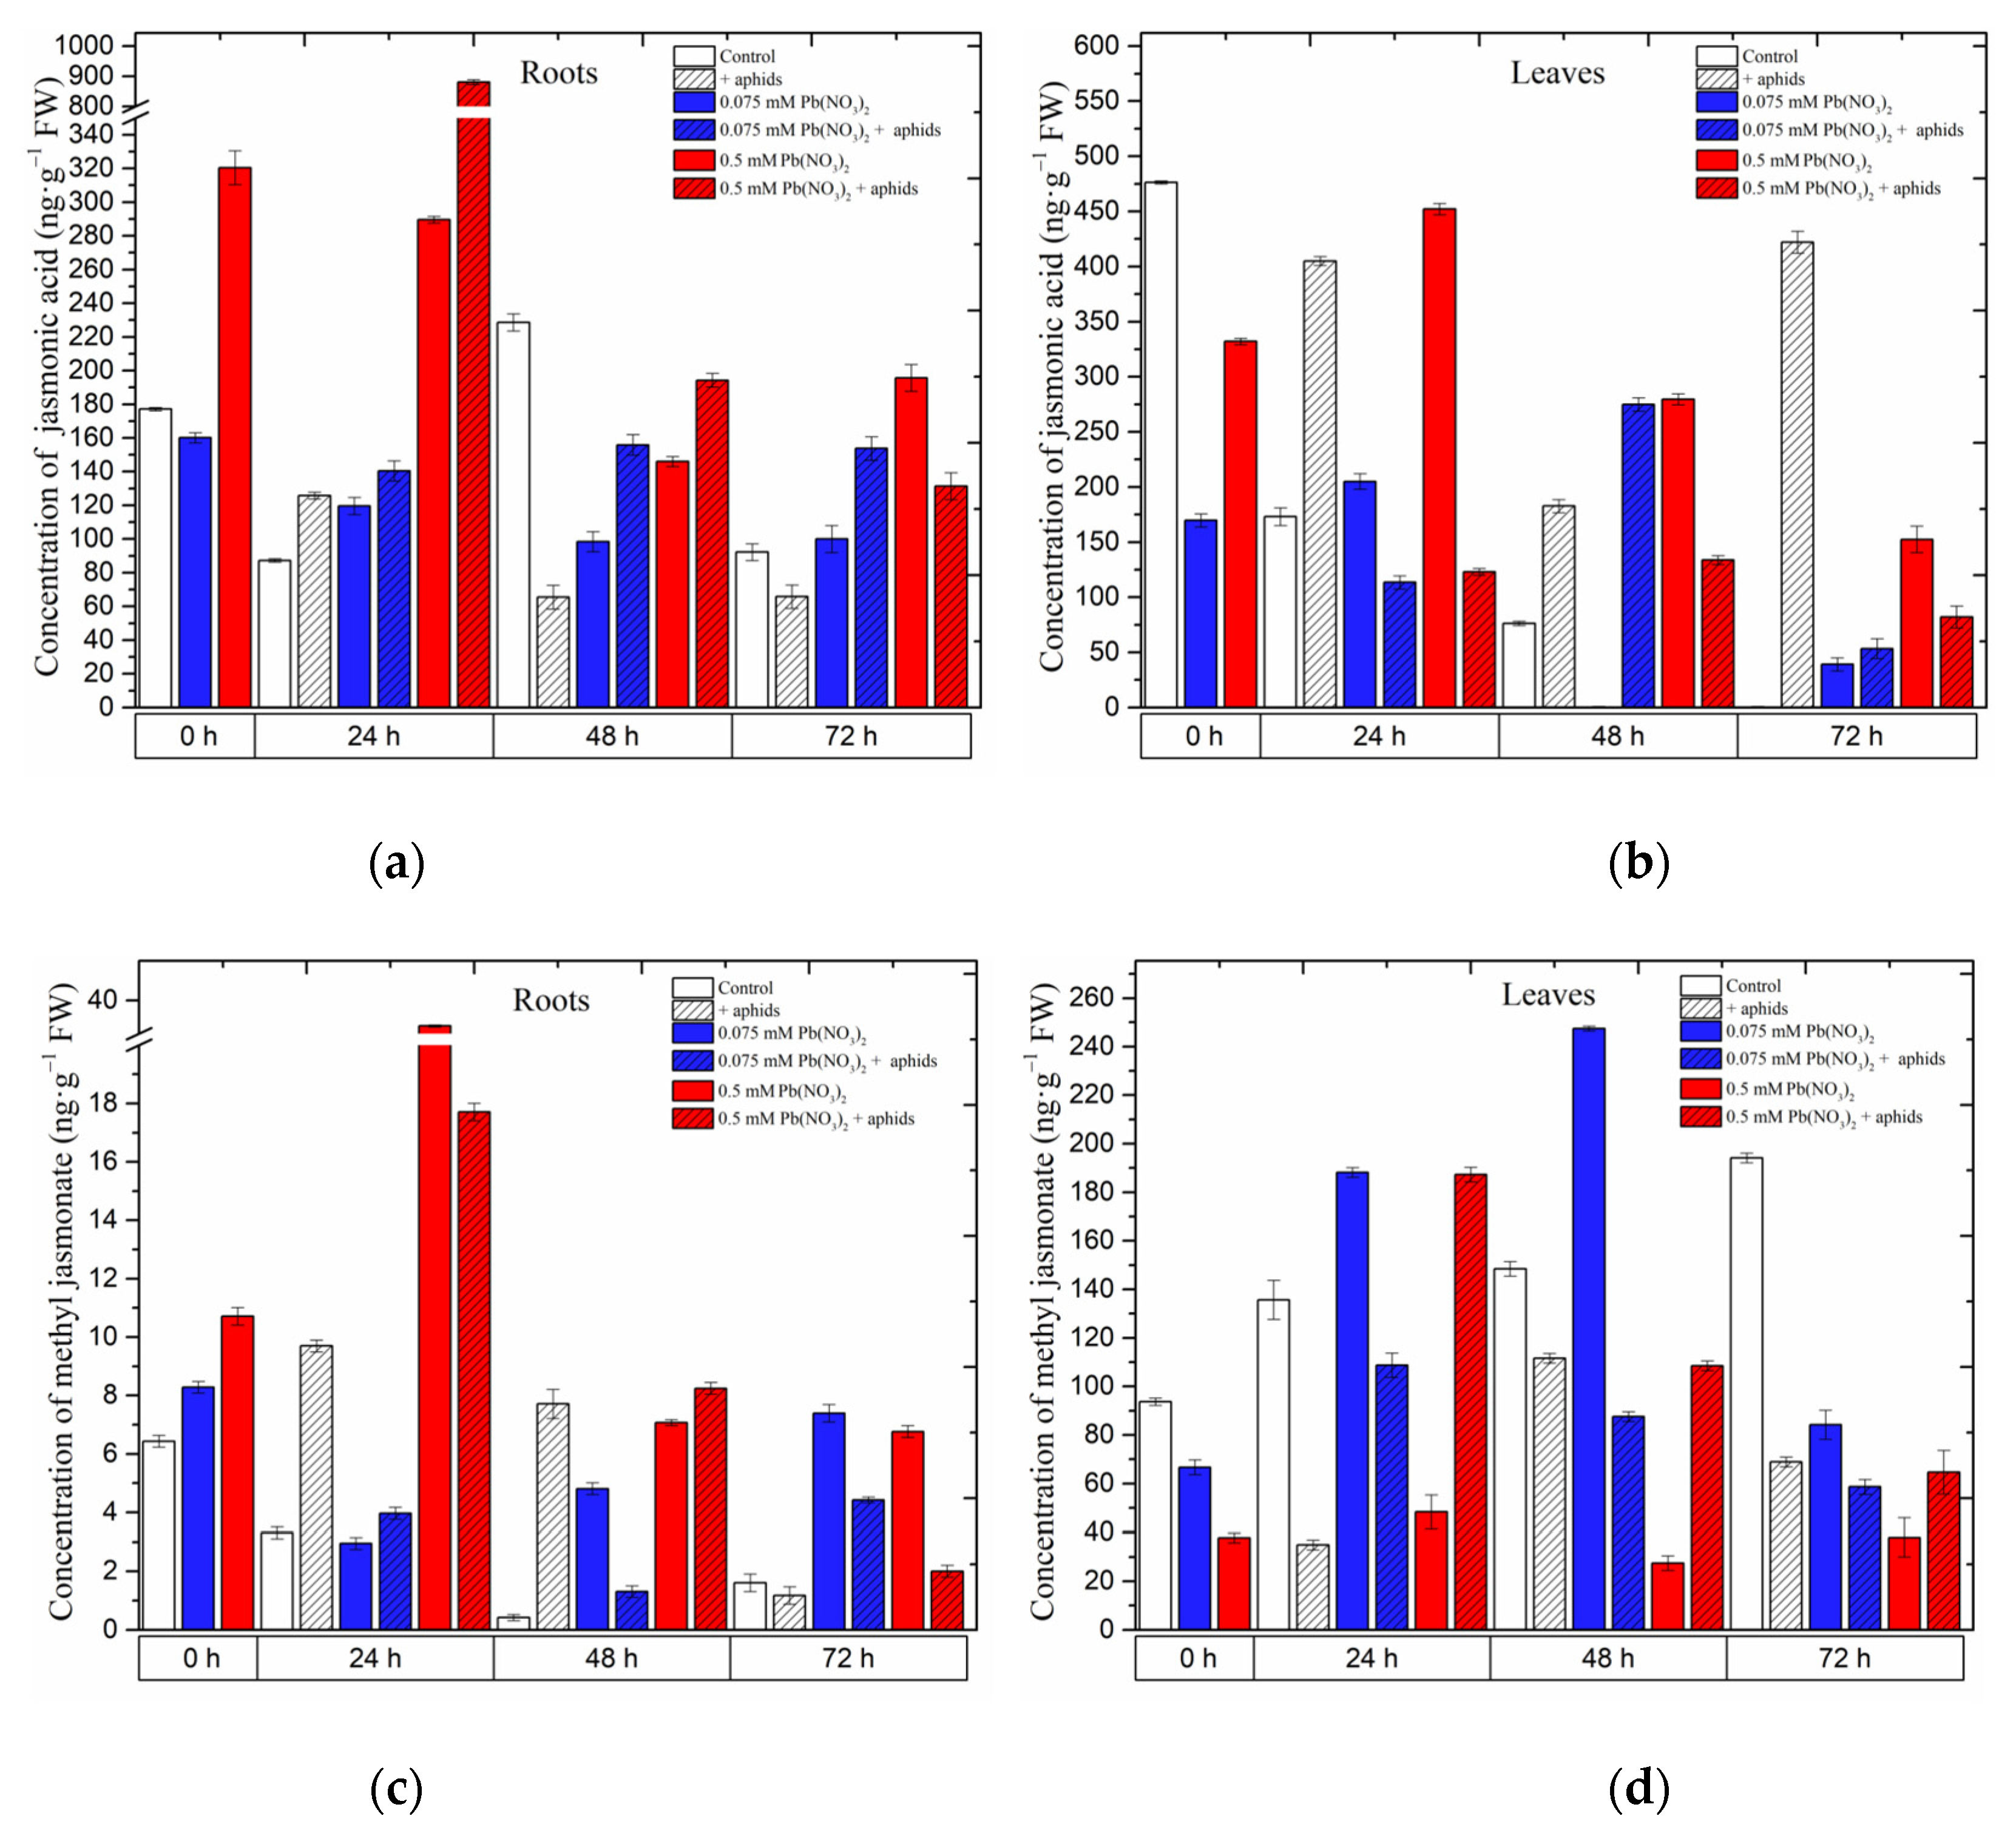
2.1. The Effect of Lead and A. pisum on Jasmonates Accumulation in Pea Seedlings
Already at the beginning of the experiment, i.e., 4 days after the administration of lead and before aphid transfer to pea seedlings, a significant accumulation of jasmonates, namely jasmonic acid (JA) and methyl jasmonate (MeJA), was recorded (
Figure 4) in the roots of pea seedlings growing on the Hoagland medium with 0.075 and 0.5 mM Pb(NO
3)
2. The concentrations of JA and MeJA in the roots of pea seedlings, particularly those growing with the sublethal dose of Pb, were more than 1.5 times higher than in the control. In turn, the concentration of MeJA in the roots of pea seedlings growing at the hormetic (0.075 mM Pb(NO
3)
2) dose was 1.3 times higher than in the control. Statistical analysis confirmed the significance of the differences in these results (
Table 1). Moreover, the highest JA level was recorded in 24-h roots (900 ng g
−1 FW) of pea seedlings growing at the sublethal (0.5 mM Pb(NO
3)
2) dose and colonized by pea aphids
A. pisum. The content of JA was higher than that in the roots of the seedlings treated only with the sublethal dose of Pb and not infested with aphids and other experimental variants. At the subsequent time point, i.e., at 48 h, higher levels of MeJA were recorded in the roots of pea seedlings infested by aphids and exposed to hormetic (0.075 mM Pb(NO
3)
2) and sublethal (0.5 mM Pb(NO
3)
2) doses and during the cross-talk interaction compared to the control. In turn, in 24-h and 48-h leaves of pea seedlings growing on the medium with the hormetic (0.075 mM Pb(NO
3)
2) dose, a significant increase in MeJA in relation to the control was noted. Additionally, the concentration of MeJA in the 0.5 mM Pb(NO
3)
2 + aphids variant was higher than that in the control and comparable to the 0.075 mM Pb(NO
3)
2) variant.
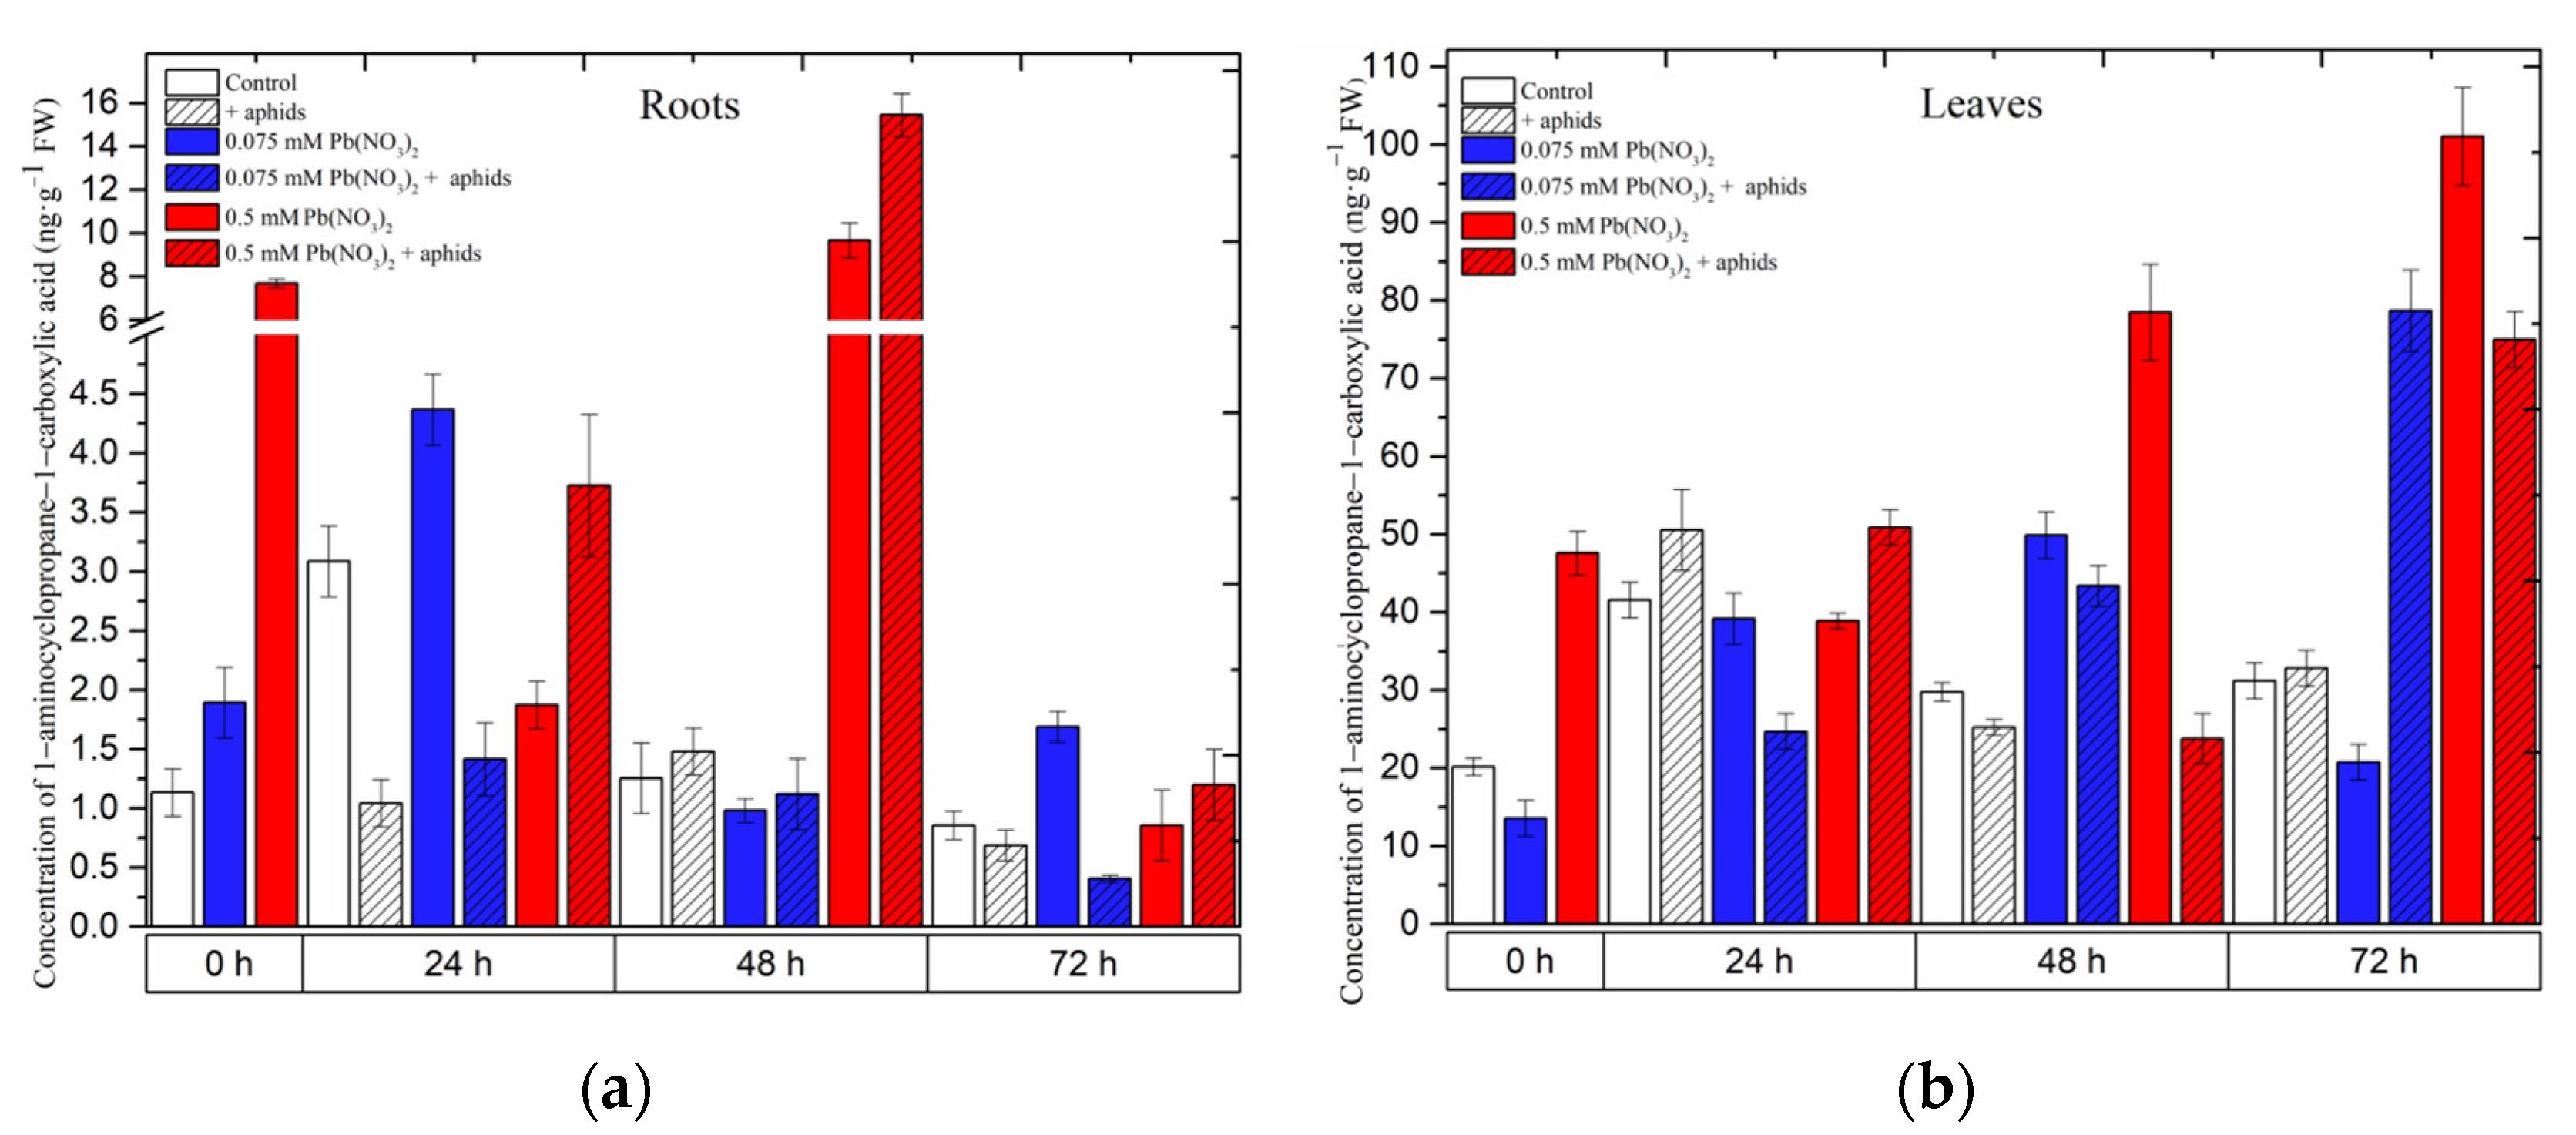
2.2. The Effect of Lead and A. pisum on 1-Aminocyclopropane-1-carboxylate (ACC)—Ethylene Precursor Accumulation in Pea Seedlings
Hormetic (0.075 mM Pb(NO
3)
2) and sublethal (0.5 mM Pb(NO
3)
2) doses and cross-talk of lead and pea aphid interaction caused accumulation of 1-aminocyclopropane-1-carboxylate (ACC) in the organs of pea seedlings (
Figure 5). A significant accumulation was recorded for ACC in the roots and leaves of pea seedlings growing on the Hoagland medium, especially with the sublethal dose (i.e., 0.5 mM Pb(NO
3)
2) variant or/and the 0.5 mM Pb(NO
3)
2 + aphids variant. The hormetic dose (solution of 0.075 mM Pb(NO
3)
2) induced ACC accumulation in the roots of 24-h pea seedlings after treatment, and then ACC concentrations were reduced to lower levels; however, the solution of 0.5 mM Pb(NO
3)
2 enhanced the ACC content, peaking at 48 h. The combined effect of lead and aphid infestation (0.5 mM Pb(NO
3)
2 + aphids variant) caused an increase in ACC levels from 24 h to 48 h, then declined at 72 h after treatment (
Figure 5a).
Meanwhile, in the leaves of pea seedlings, the ACC content increased continuously along the experiment: at the dose of 0.5 mM Pb(NO
3)
2, the highest recorded level of ACC was 101.0709 ng.g
−1 FW at 72 h, which is 3.24-fold higher than in the control. This changing trend in ACC levels was also noted in the combination between aphid impact and 0.075 mM Pb(NO
3)
2: the highest level of ACC in this case was 75.0047 ng.g
−1 FW at 72 h, which is 2.40-fold higher than in the control (
Figure 5b). ANOVA results showed that the differences in the ACC contents in lead- and aphid-treated leaves and the control plants were highly statistically significant at 72 h. However, no statistical difference was recorded between ACC levels in variants of aphid infestation and the control at that time point.
Figure 5.
Effect of lead and A. pisum on the accumulation of 1-aminocyclopropane-1-carboxylate (ACC) (a,b) in the organs of pea seedlings. The data were obtained from three independent experiments and were statistically analyzed using ANOVA (p < 0.001).
Figure 5.
Effect of lead and A. pisum on the accumulation of 1-aminocyclopropane-1-carboxylate (ACC) (a,b) in the organs of pea seedlings. The data were obtained from three independent experiments and were statistically analyzed using ANOVA (p < 0.001).
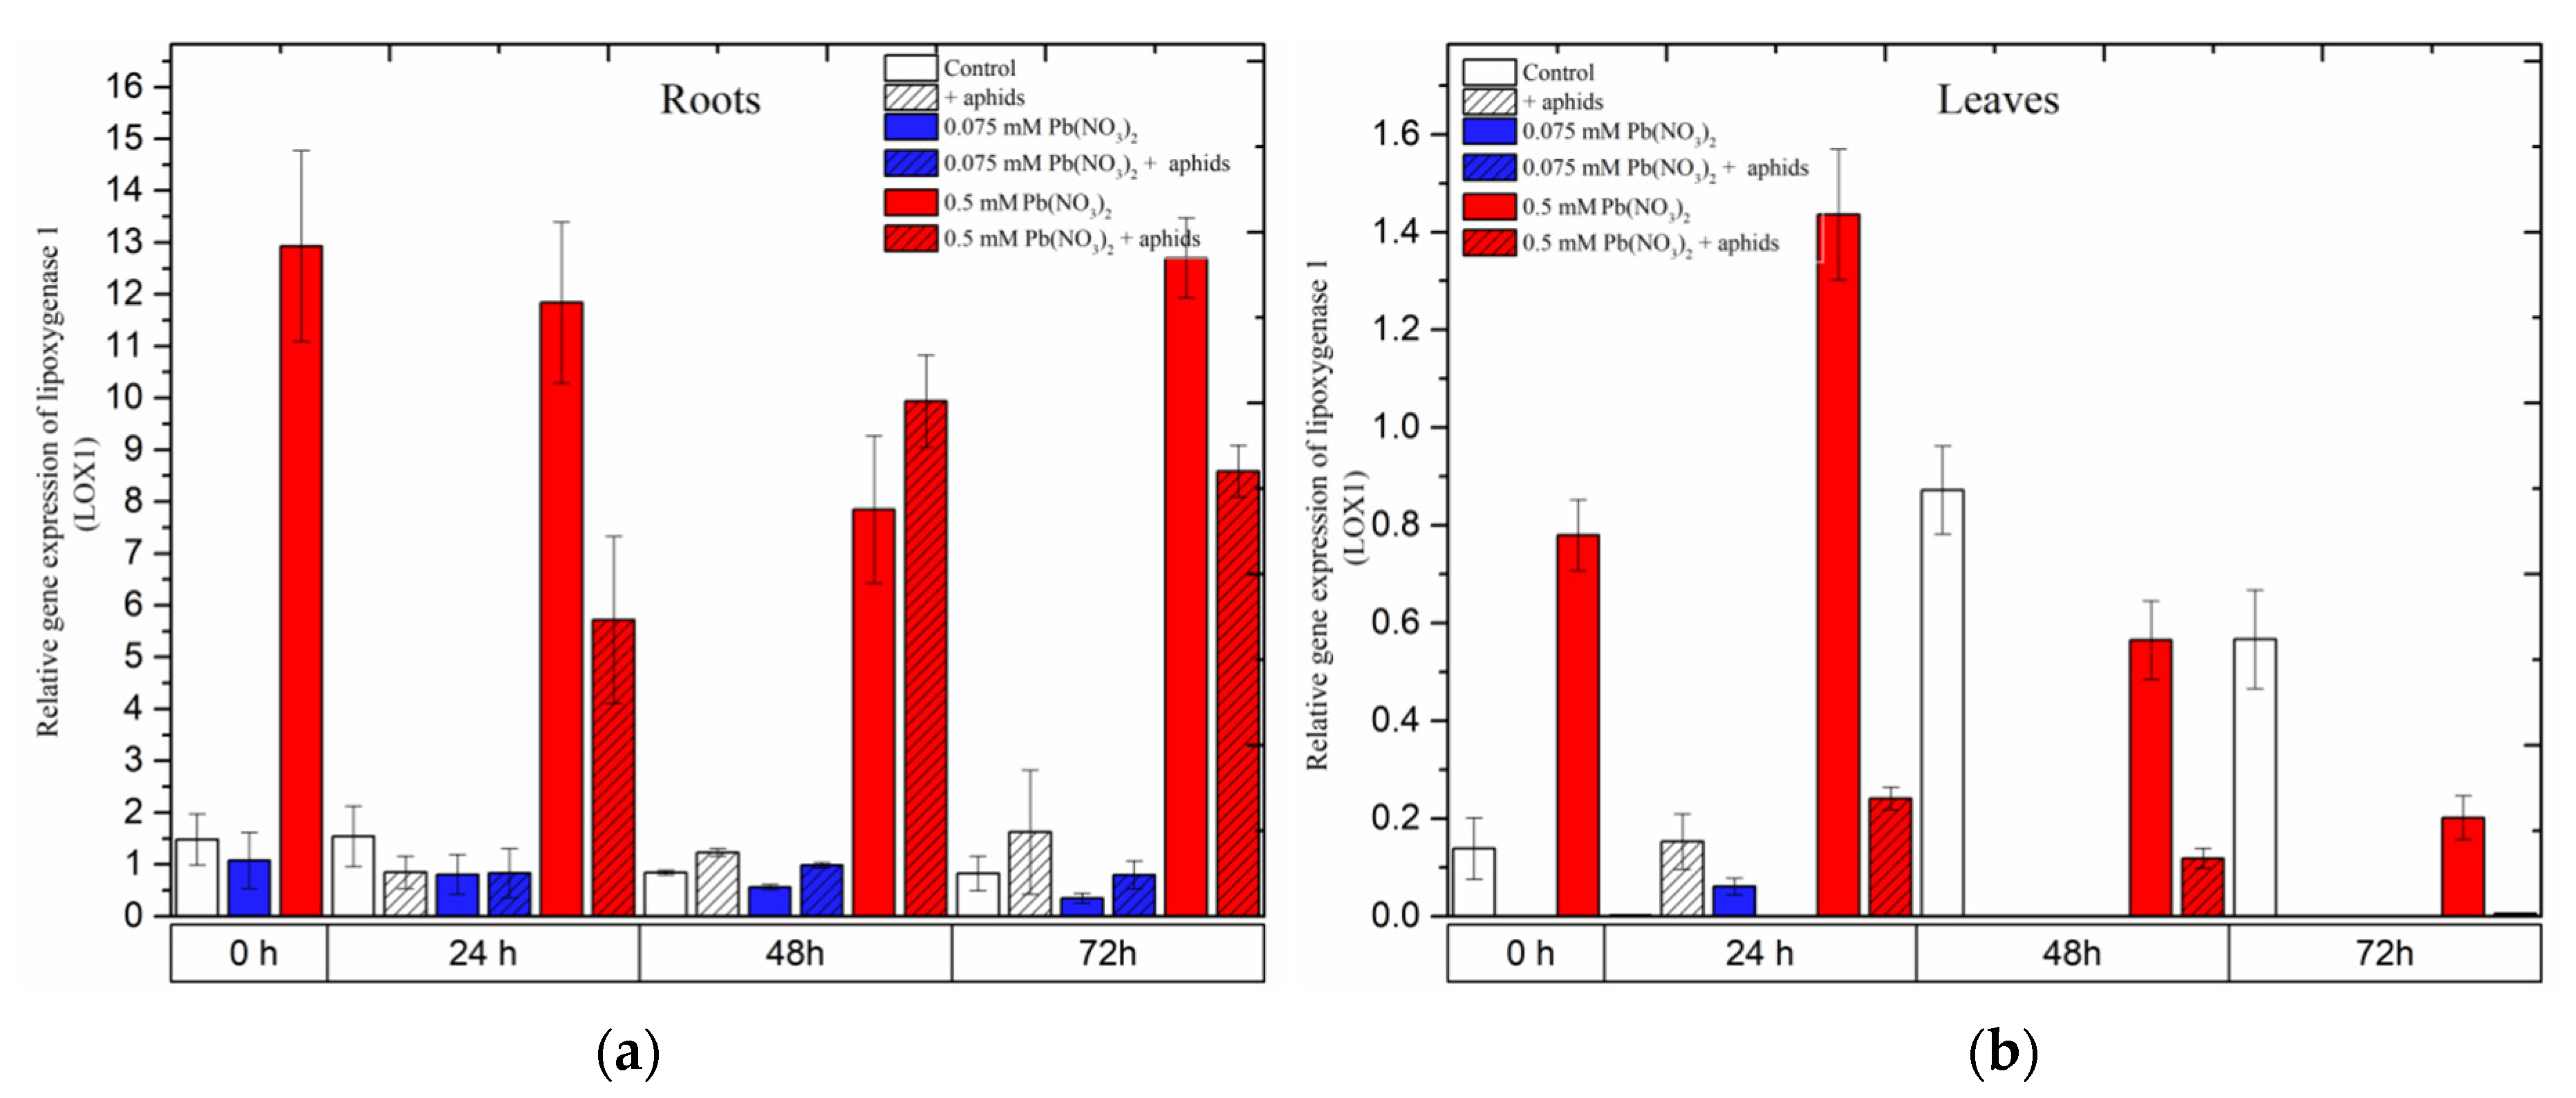
2.3. The Effect of Lead and A. pisum on Expression Levels of Lipoxygenase (LOX1)
Remarkable differences in the expression of Lipoxygenase 1 (LOX1), a gene encoding lipoxygenase, an important enzyme in the JA biosynthesis pathway, were observed during the experiments.
The hormetic (0.075 mM Pb(NO
3)
2) dose and cross-talk of 0.075 mM Pb(NO
3)
2 and aphids did not cause any increase in
LOX1 gene expression. The expression of
LOX1 in the roots of seedlings remained at a low level in the control and all the treated variants during the experiments, while there was a lack of expression of this gene in the leaves of pea seedlings at almost all time points (
Figure 6). Furthermore, it should be emphasized that the sublethal (0.5 mM Pb(NO
3)
2) dose considerably induced the expression of
LOX1 in the roots of the seedlings, and more strongly than that in the leaves. A very high level of
LOX1 transcripts in roots from 0.5 mM Pb(NO
3)
2 variants was maintained at all time points, i.e., from the starting of the experiments to 72 h. Additionally, the expression of
LOX1 in roots from the 0.5 mM Pb(NO
3)
2 + aphids variants was also high, and significantly higher than in the control and other variants, but lower than in roots from the 0.5 mM Pb(NO
3)
2 variants (24 h and 72 h). The statistical analysis confirmed the significance of the differences in these results.
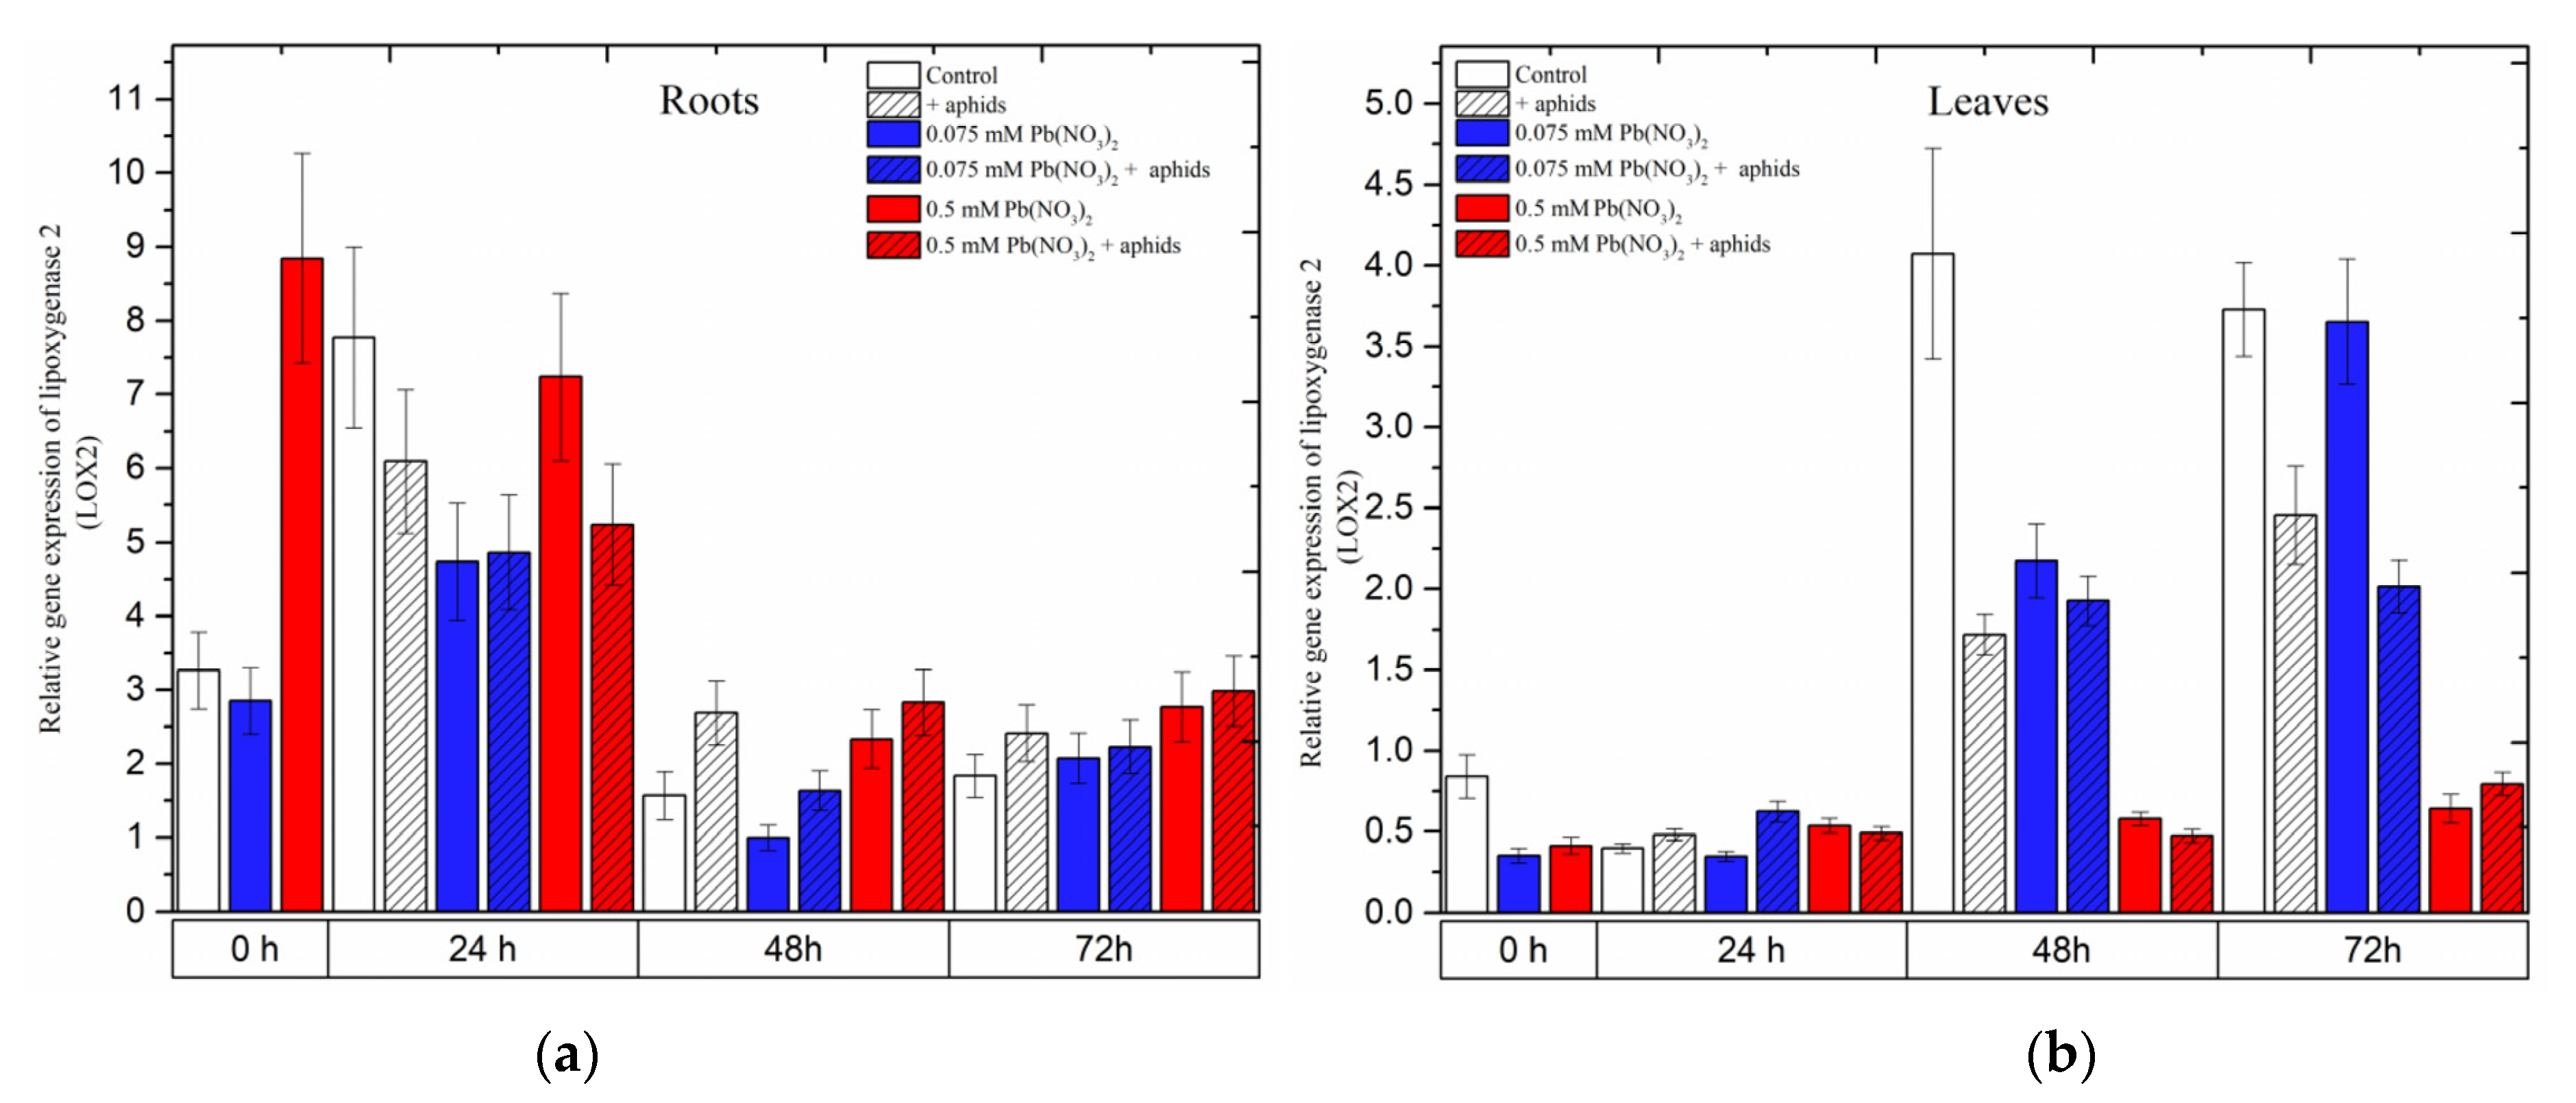
2.4. The Effect of Lead and A. pisum on Expression Levels of Lipoxygenase 2 (LOX2)
Already at the beginning of the experiment, i.e., 4 days after the administration of lead and before aphid transfer to pea seedlings, a significant increase in the expression level of
LOX2 was noted; it was 2.5 times higher than in the control and 0.075 mM Pb(NO
3)
2 variant (
Figure 7). Then, at 24 h, exposure of the pea seedlings to stress factors was associated with downregulation of the
LOX2 gene in the roots
(Figure 7a). At the next time points (48 h), the expression of
LOX2 decreased. However, it remained higher in the roots of pea seedlings infested by aphids (+aphids variant) and the roots of pea seedlings of the 0.5 mM Pb(NO
3)
2 variant and the 0.5 mM Pb
2+ + aphids variant than in the control.
In turn, at the beginning of the experiment, the level of LOX2 transcripts was two times lower in pea seedling leaves from hormetic and sublethal variants than in the control. At later time points, the expression levels of LOX2 in pea seedling leaves increased continuously as a function of time, both in the control and the hormetic variants (0.075 mM Pb(NO3)2 variant and 0.075 mM Pb2+ + aphids). Furthermore, at 48 h, downregulation of the LOX2 gene was observed in the leaves of pea seedlings from all stress variants compared to the control. A similar trend was observed in 72-h leaves, with the exception of 72-h leaves from the 0.075 mM Pb(NO3)2 variant.
Figure 7.
Expression of lipoxygenase (LOX2) in roots (a) and leaves (b) of pea seedlings exposed to lead and A. pisum. Gene expression level was assessed by RT-qPCR. Phosphoprotein phosphatase 2A (PP2A) was used as a reference gene. The data were obtained from three independent experiments and statistically analyzed using ANOVA (p < 0.001).
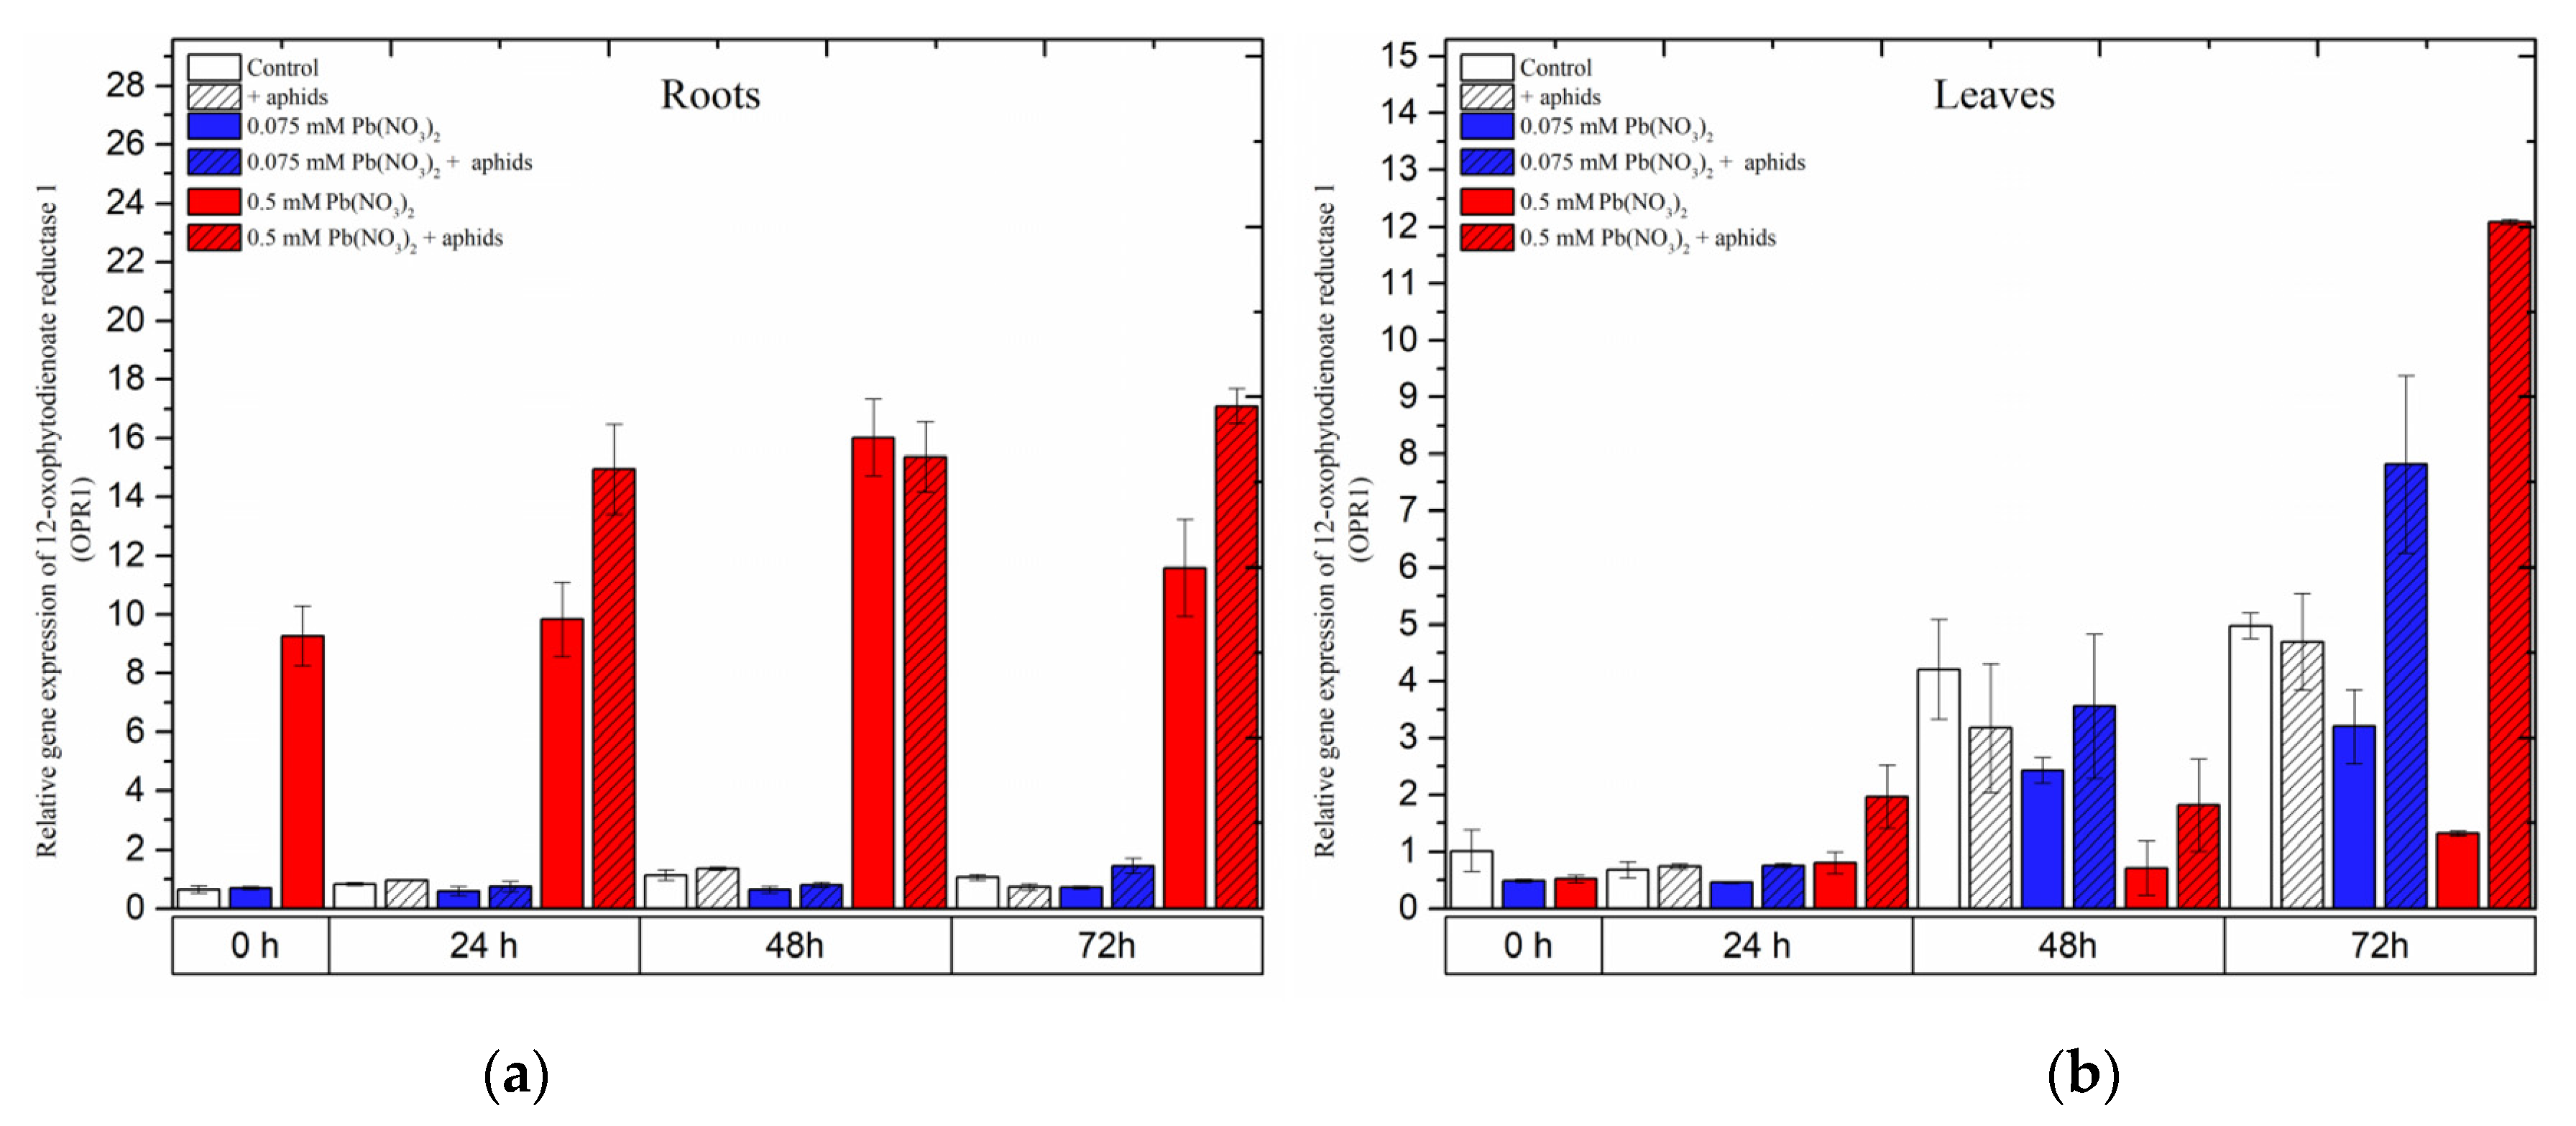
2.5. The Effect of Lead and A. pisum on Expression Levels of 12-Oxophytodienoate Reductase 1 (OPR1)
A remarkable difference in the expression of the
12-oxophytodienoate reductases (
OPR1) gene, the gene encoding 12-oxophytodienoate reductase 1, another important enzyme in the JA biosynthesis pathway, was recorded in the organs of the pea seedlings. Treatment of pea seedling roots with the hormetic dose of 0.075 mM Pb(NO
3)
2 or cross-talk between the hormetic dose of 0.075 mM Pb(NO
3)
2 and aphids did not induce
OPR1 gene expression.
OPR1 expression in the roots of the seedlings remained at low levels in the control variant and all treated variants during the experimental times (
Figure 8a). Meanwhile, treating pea seedlings with the sublethal dose, i.e., 0.5 mM Pb(NO
3)
2 or 0.5 mM Pb(NO
3)
2 and aphids, strongly induced expression of the
OPR1 gene during the experiments. The highest expression level of
OPR1 was recorded at 48 h as a result of treatment with 0.5 mM Pb(NO
3)
2 and at 72 h during 0.5 mM Pb(NO
3)
2 and aphid combination. ANOVA results showed that the differences in the expression levels of the
OPR1 gene in pea seedling roots from the 0.5 mM Pb(NO
3)
2 and 0.5 mM Pb(NO
3)
2 + aphids variants and the control were highly statistically significant at all time points.
In leaves, the expression levels of OPR1 in all variants seemed to continuously increase from the start of the experiments until 72 h. The combined effect of the sublethal dose of lead and aphids caused the highest expression levels of the OPR1 gene at 72 h after treatment. In parallel, an upregulation of OPR1 in pea seedling leaves from the hormetic (0.075 mM Pb(NO3)2) dose and infestation by aphids was noted. The expression level of OPR1 in the above variant was 1.5 times higher than in the control. At that time point, ANOVA recorded differences in the expression levels of OPR1 in the 0.075 mM Pb(NO3)2 and aphid and 0.5 mM Pb(NO3)2+ aphids variants and the control, which were statistically significant.
Figure 8.
Expression of 12-oxophytodienoate reductase 1 (OPR1) in roots (a) and leaves (b) of pea seedlings exposed to lead and A. pisum. Gene expression level was assessed by RT-qPCR. Phosphoprotein phosphatase 2A (PP2A) was used as the reference gene. The data were obtained from three independent experiments and statistically analyzed using ANOVA (p < 0.001).
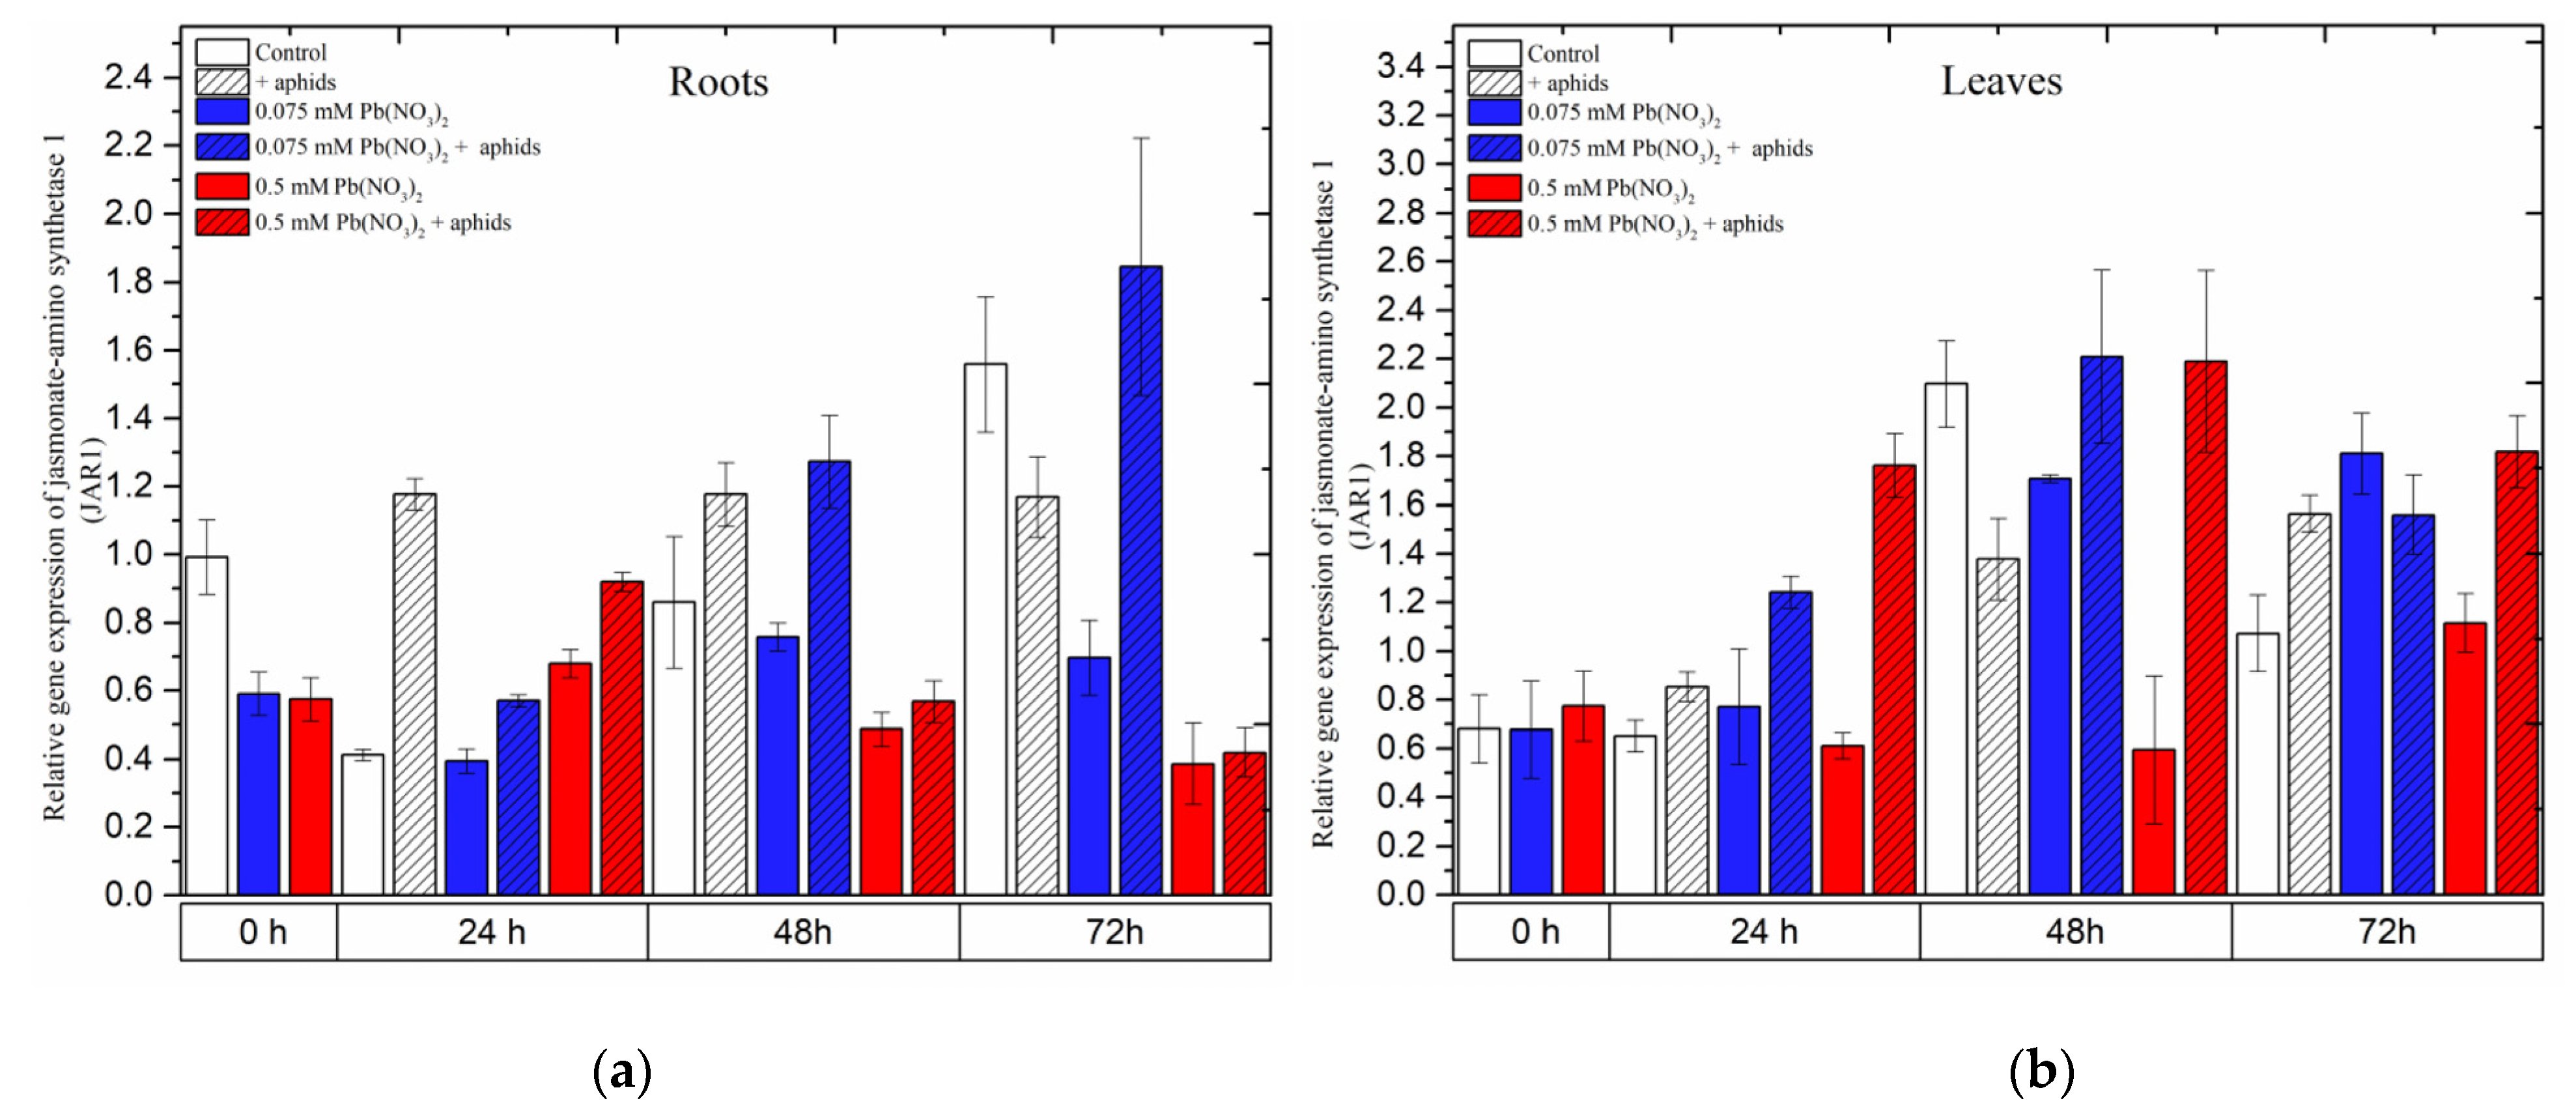
2.6. The Effect of Lead and A. pisum on Expression Levels of Jasmonic Acid-Amido Synthetase (JAR1)
In the organs of pea seedlings, the expression levels of JAR1 in most of the variants seemed to continuously increase from the beginning of the experiments until 48 h and then declined at 72 h.
In the roots, aphid infestation induced
JAR1 expression 24 h after treatment, which remained at high levels at all experimental time points. The combined effect of aphid and a low lead concentration (in 0.075 mM Pb(NO
3)
2 solution) yielded a continuous increase in
JAR1 expression from 24 to 72 h, with relative gene expression increasing from 0.57 to 1.85. However, only a high concentration of lead (0.5 mM Pb(NO
3)
2 solution) displayed an effect without and with aphid at 24 h after treatment; in those cases, the relative expression of
JAR1 was higher than that in the control (
Figure 9a).
In the leaves of pea seedlings, lead (at both doses) and aphids induced differential expression of
JAR1 in most of the experimental variants. Regarding the individual effect of aphids or lead, the expression of
JAR1 increased over the course of the experiment and reached the highest level at 72 h, with relative gene expressions of 1.6 under aphid infestation, 1.8 with the 0.075 mM Pb(NO
3)
2 solution and 1.1 with the 0.5 mM Pb(NO
3)
2 solution. However, the combined effect of aphids with the two lead concentrations enhanced
JAR1 expression, strongly increasing from 24 h to 48 h and then slightly declining at 72 h. The highest levels of
JAR1 expression at 48 h were 2.2 following aphid infestation with the 0.075 mM Pb(NO
3)
2 solution and 2.2 following aphid infestation with the 0.5 mM Pb(NO
3)
2 solution (
Figure 9a). The ANOVA recorded differences in the expression levels of
JAR1 in most of the treated variants and the control, which were highly statistically significant at all tested time points.
Figure 9.
Expression of jasmonic acid-amido synthetase (JAR1) in roots (a) and leaves (b) of pea seedlings exposed to lead and A. pisum. Gene expression level was assessed by RT-qPCR. Phosphoprotein phosphatase 2A (PP2A) was used as the reference gene. The data were obtained from three independent experiments and statistically analyzed using ANOVA (p < 0.001).
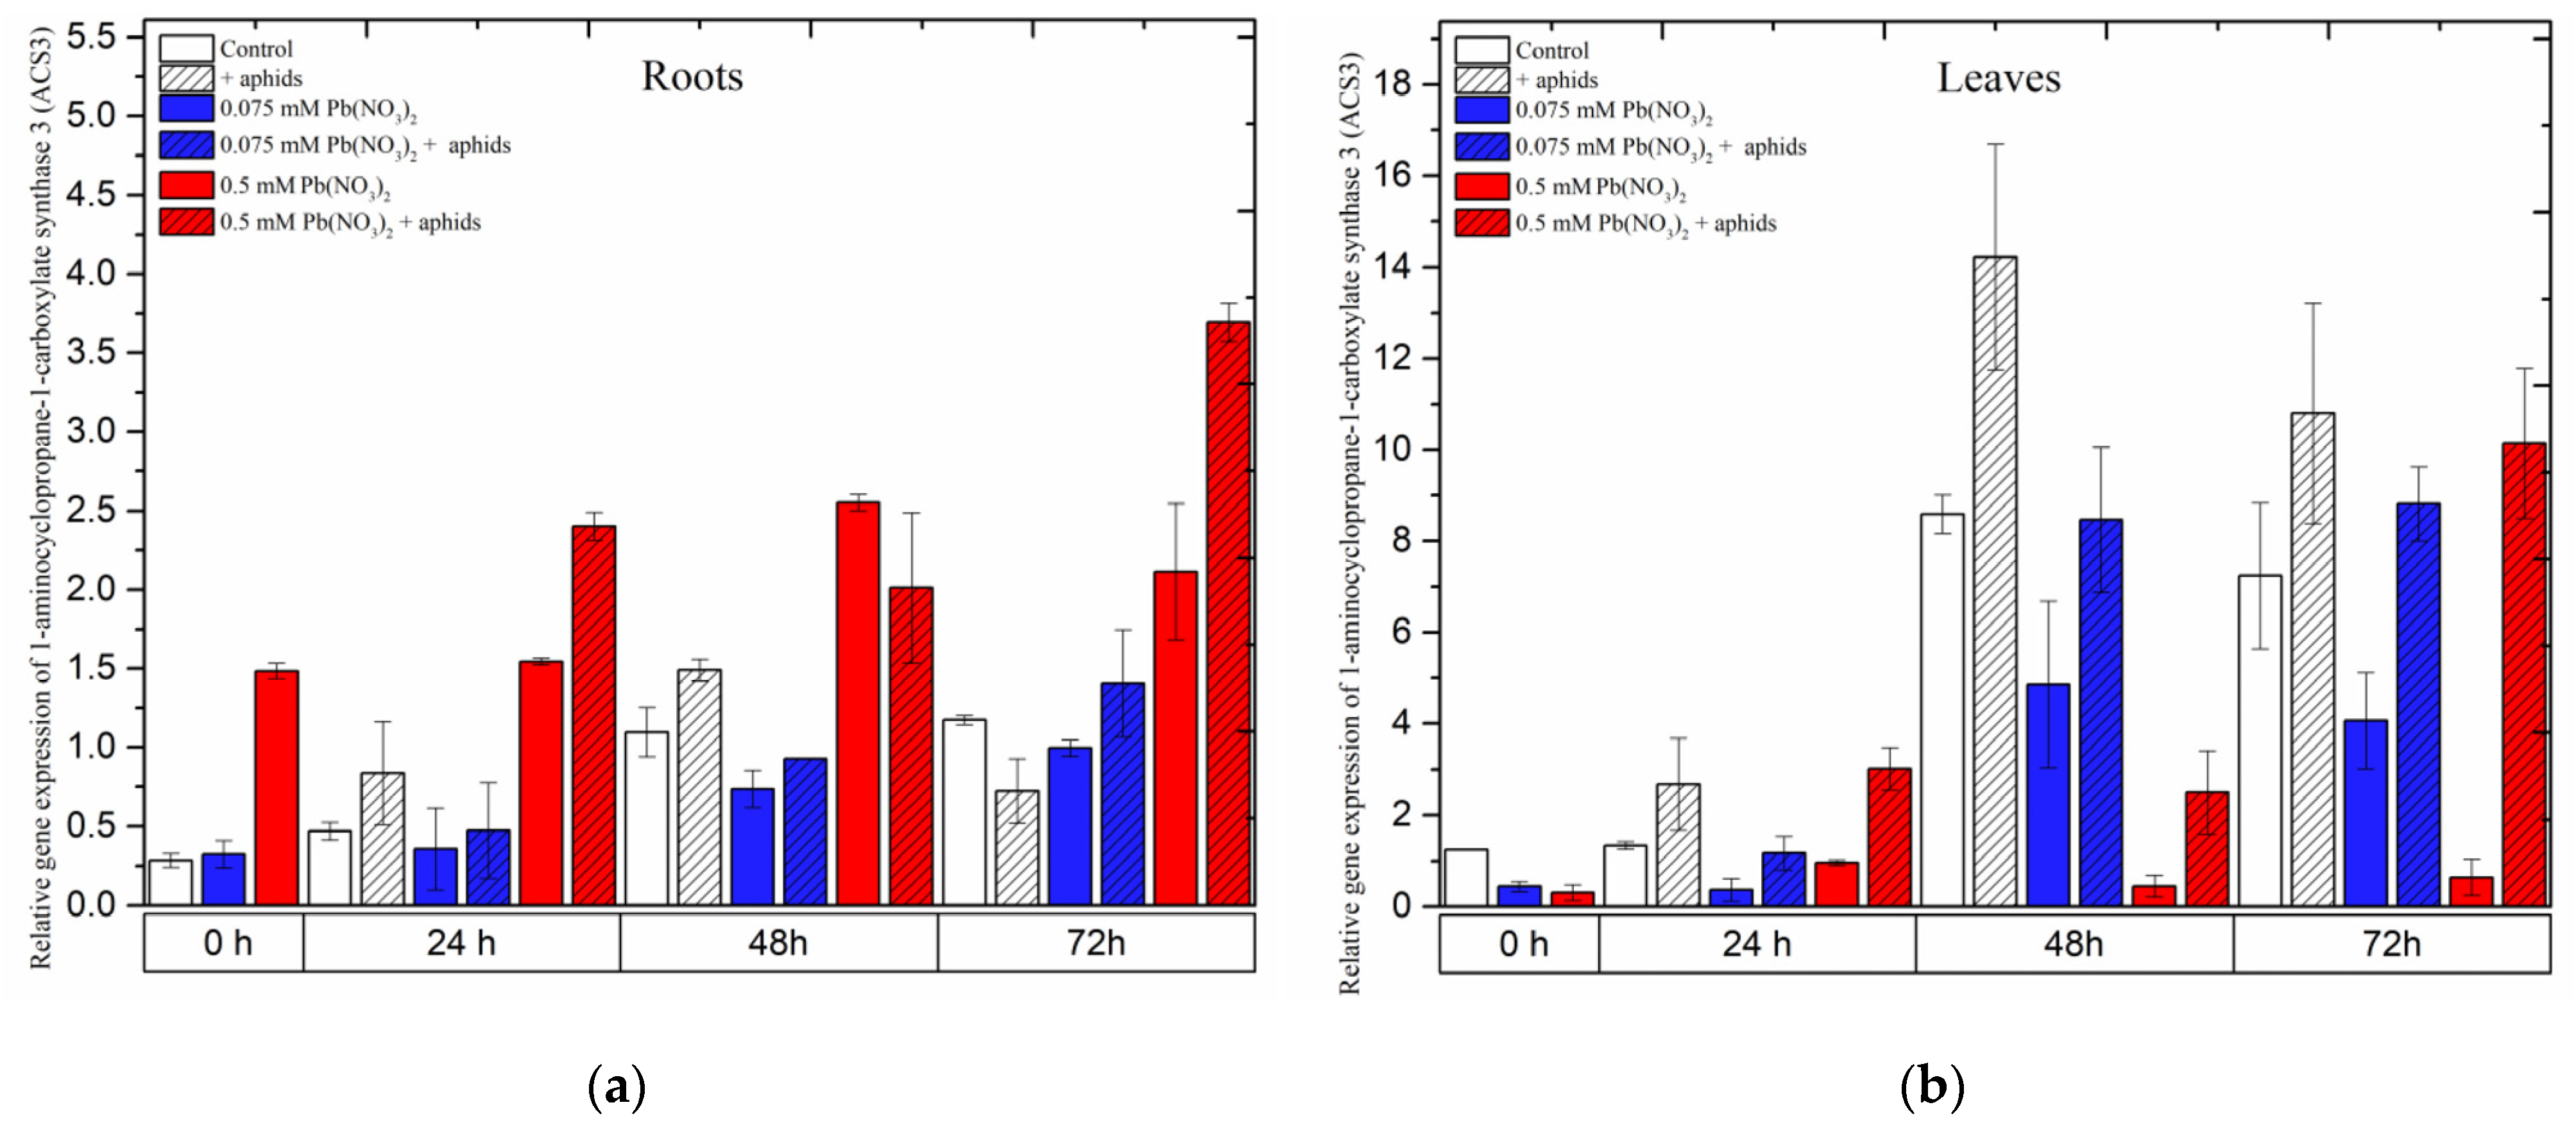
2.7. The Effect of Lead and A. pisum on Expression Levels of 1-Aminocyclopropane-1-carboxylate Synthase 3 (ACS3)
Expression of the
1-aminocyclopropane-1-carboxylate synthase 3 (ACS3) gene was strongly induced in pea seedling roots growing in the medium with a high concentration of lead, i.e., 0.5 mM Pb(NO
3)
2. Following treatment with a sublethal dose of lead,
ACS3 demonstrated a remarkably high expression, increasing from the beginning of the experiment until 48 h and slightly declining at 72 h. However, its expression always remained higher than that in the control at all time points. Moreover, the combined effect of lead (0.5 mM Pb(NO
3)
2 solution) and aphids induced a higher expression of
ACS3. The effect of these two factors caused an increase in the relative expression of
ACS3 to the highest level at 72 h after treatment (
Figure 10a).
Contrary to the expression of ACS1 in pea seedling roots, the expression of this gene in leaves was enhanced more strongly by aphids than by other stressors. Pea aphid induced rapid relative expression of ACS3, reaching the highest levels at 48 h and then slightly declining at 72 h.
When treating pea seedlings with both aphids and lead,
ACS3 was upregulated from the beginning of the experiment until 72 h, but its expression was always lower than in leaves infested by aphids only (
Figure 10b). In 72-h leaves of pea seedlings from the 0.075 mM Pb(NO
3)
2 +aphids variant, the relative expression of
ACS3 was about 0.82 times higher than in the control. ANOVA results recorded differences in the expression levels of
ACS3 in variants treated by aphids without/with lead and the control, and these differences were statistically significant at all tested time points.
Figure 10.
Expression of 1-aminocyclopropane-1-carboxylate synthase 3 (ACS3) in roots (a) and leaves (b) of pea seedlings exposed to lead and A. pisum. Gene expression level was assessed by RT-qPCR. Phosphoprotein phosphatase 2A (PP2A) was used as the reference gene. The data were obtained from three independent experiments and statistically analyzed using ANOVA (p < 0.001).
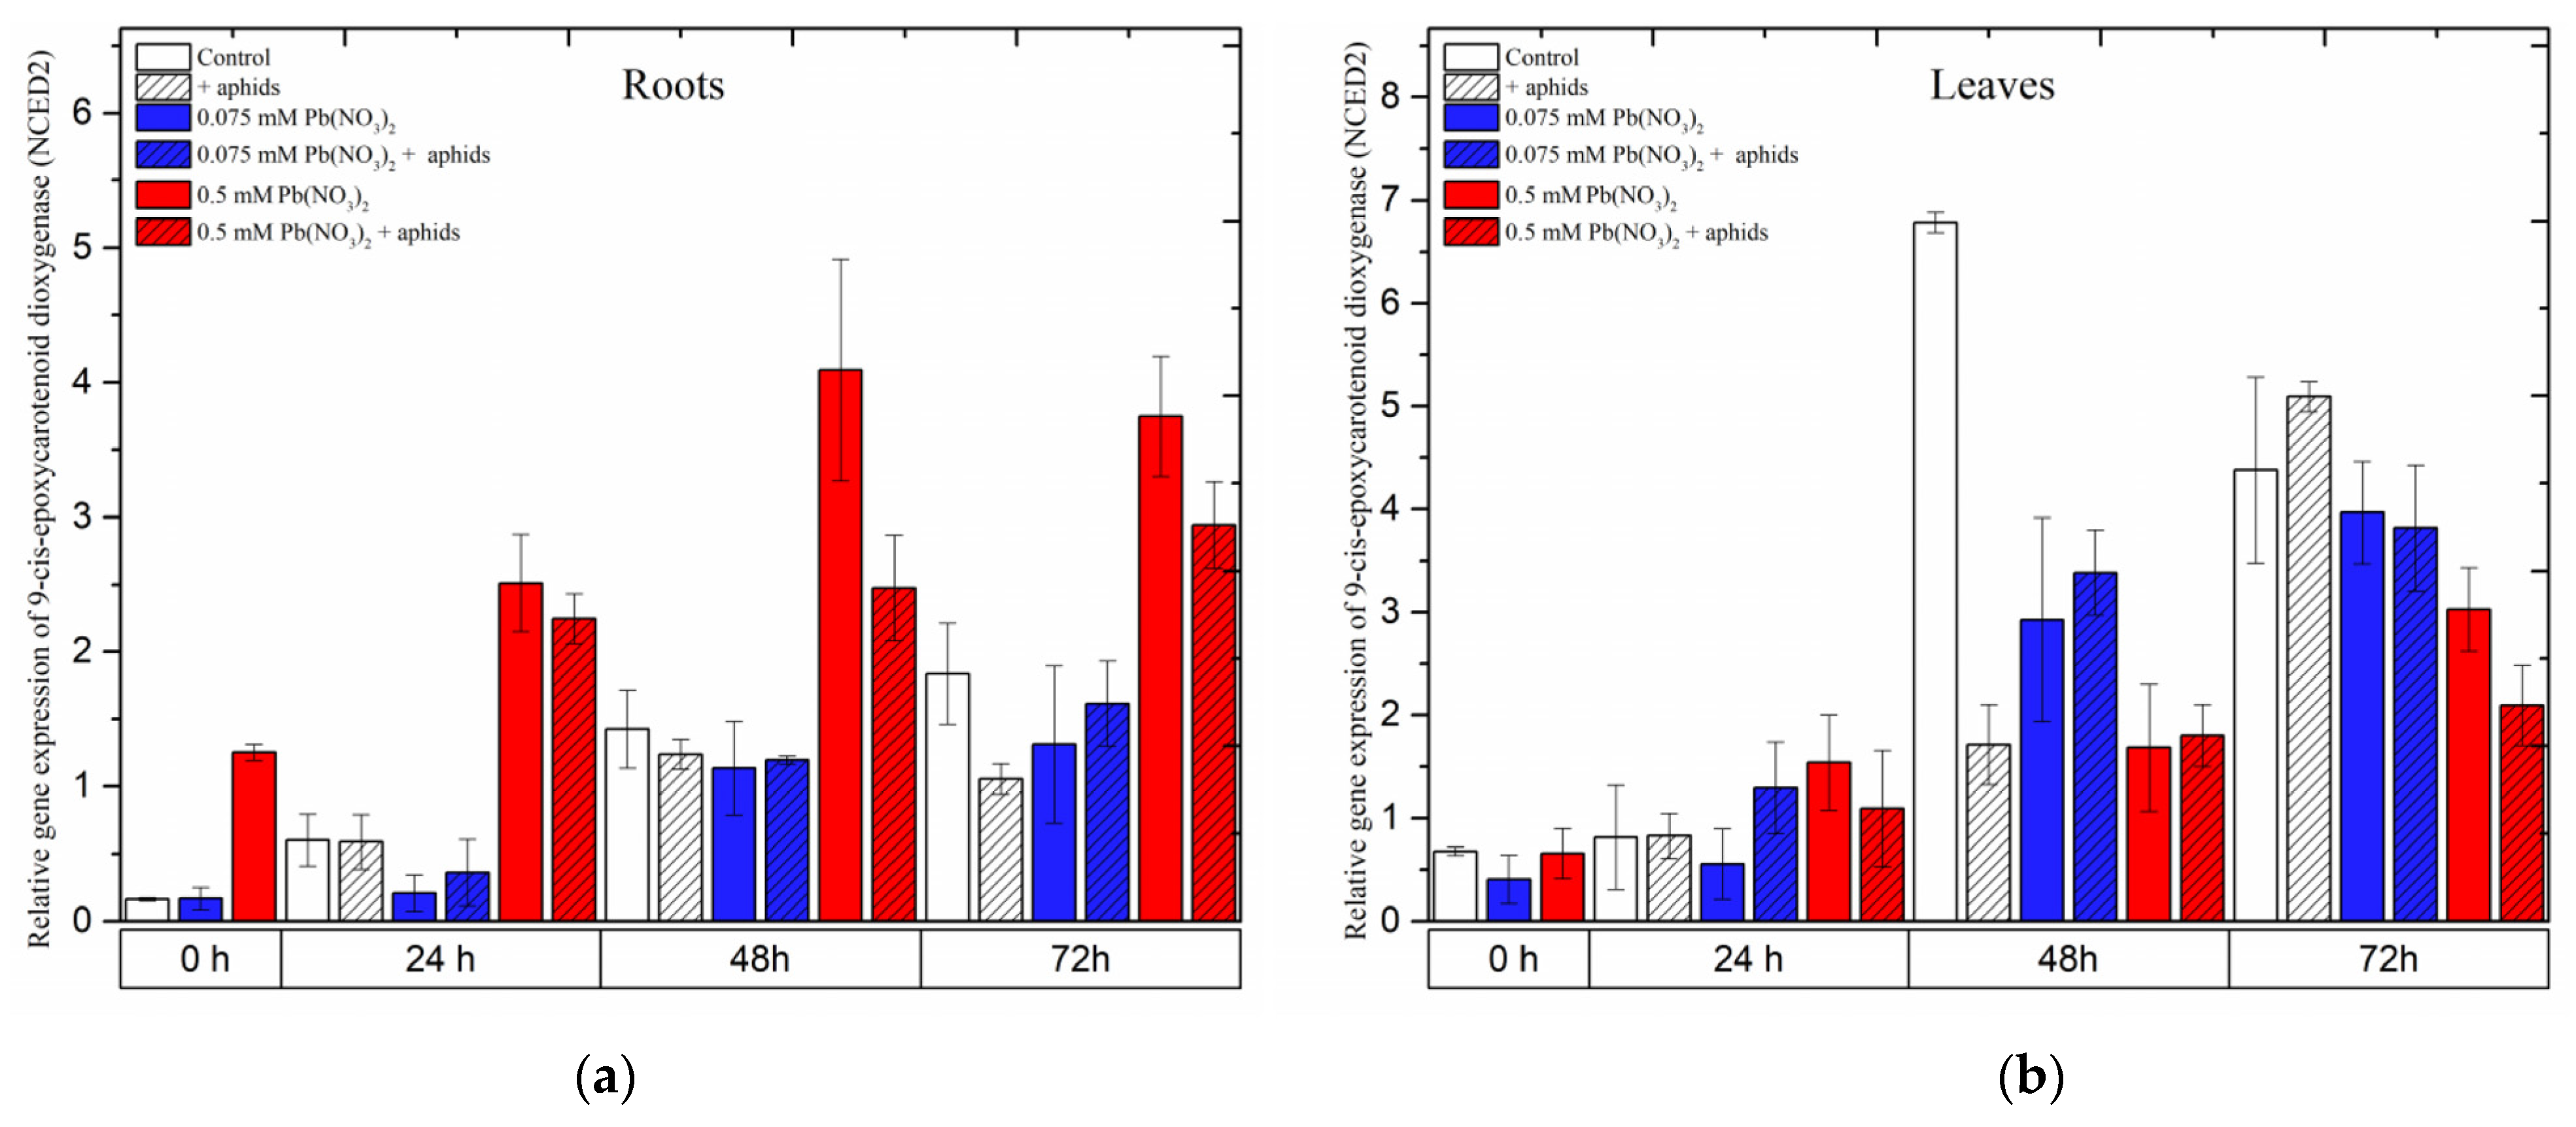
2.8. The Effect of Lead and A. pisum on Expression Levels of 9-cis-Epoxycarotenoid Dioxygenase (NCED)
The gene encoding 9-cis-epoxycarotenoid dioxygenase 2 (NCED2), an important enzyme in the biosynthesis of abscisic acid (ABA), showed different expression levels in the roots and leaves of pea seedlings as a response to different stress factors, including lead, aphids and both lead and aphids combined.
In roots, it was noted that a high concentration of lead (sublethal dose of 0.5 mM Pb(NO
3)
2) strongly induced the expression of
NCED2. Under the sole effect of lead,
NCED2 expression was remarkably induced after treatment with a sublethal dose, increasing from the starting of the experiment until 48 h and slightly reducing at 72 h; however, its expression was always higher than that of the control at all time points. Furthermore, the combined effect of lead (0.5 mM Pb(NO
3)
2 solution) and aphids induced relatively high expression levels of
NCED2, increasing continuously from the beginning of the experiment until 72 h after treatment. The expression of
NCED2 in roots from the 0.5 mM Pb(NO
3)
2 + aphids variant was lower than that in the 0.5 mM Pb(NO
3)
2 variant. ANOVA results recorded differences in the expression levels of
NCED2 in variants treated with the sublethal dose of lead (0.5 mM Pb(NO
3)
2 variants) without aphids/with aphids (0.5 mM Pb(NO
3)
2 +aphids variant) and the control, which were highly statistically significant at all tested time points. However, a low concentration of lead (hormetic 0.075 mM Pb(NO
3)
2 dose) without and/or with aphid infestation (0.075 mM Pb(NO
3)
2 + aphids) downregulated
NCED2 gene expression when compared with the control group; the expression of this gene in the treated variants was not significantly different from that in control (
Figure 11a).
Contrary to the expression of
NCED2 in the roots of the pea seedlings, this gene was differently expressed in leaves affected by lead and aphids. The relative expression of
NCED2 in all treated variants continuously increased from the beginning of the experiment until 72 h after treatment; however, the expression trends in the levels of the
NCED2 gene were different among the variants. At 24 h after treatment,
NCED2 was upregulated by the sublethal dose of lead (0.5 mM Pb(NO
3)
2) and the combined effect of lead and aphids (at both concentrations of 0.075 mM Pb(NO
3)
2 and 0.5 mM Pb(NO
3)
2); its expression was higher than that in the control. However, the relative expression of
NCED2 in most of the treated variants (except for aphid infestation at 72 h) was always lower than that in the control (
Figure 11b).
Figure 11.
The effect of lead and A. pisum on expression levels of 9-cis-epoxycarotenoid dioxygenase (NCED) in the organs of pea seedlings. (a) roots, (b) leaves. The data were obtained from three independent experiments and statistically analyzed using ANOVA (p < 0.001).
Figure 11.
The effect of lead and A. pisum on expression levels of 9-cis-epoxycarotenoid dioxygenase (NCED) in the organs of pea seedlings. (a) roots, (b) leaves. The data were obtained from three independent experiments and statistically analyzed using ANOVA (p < 0.001).
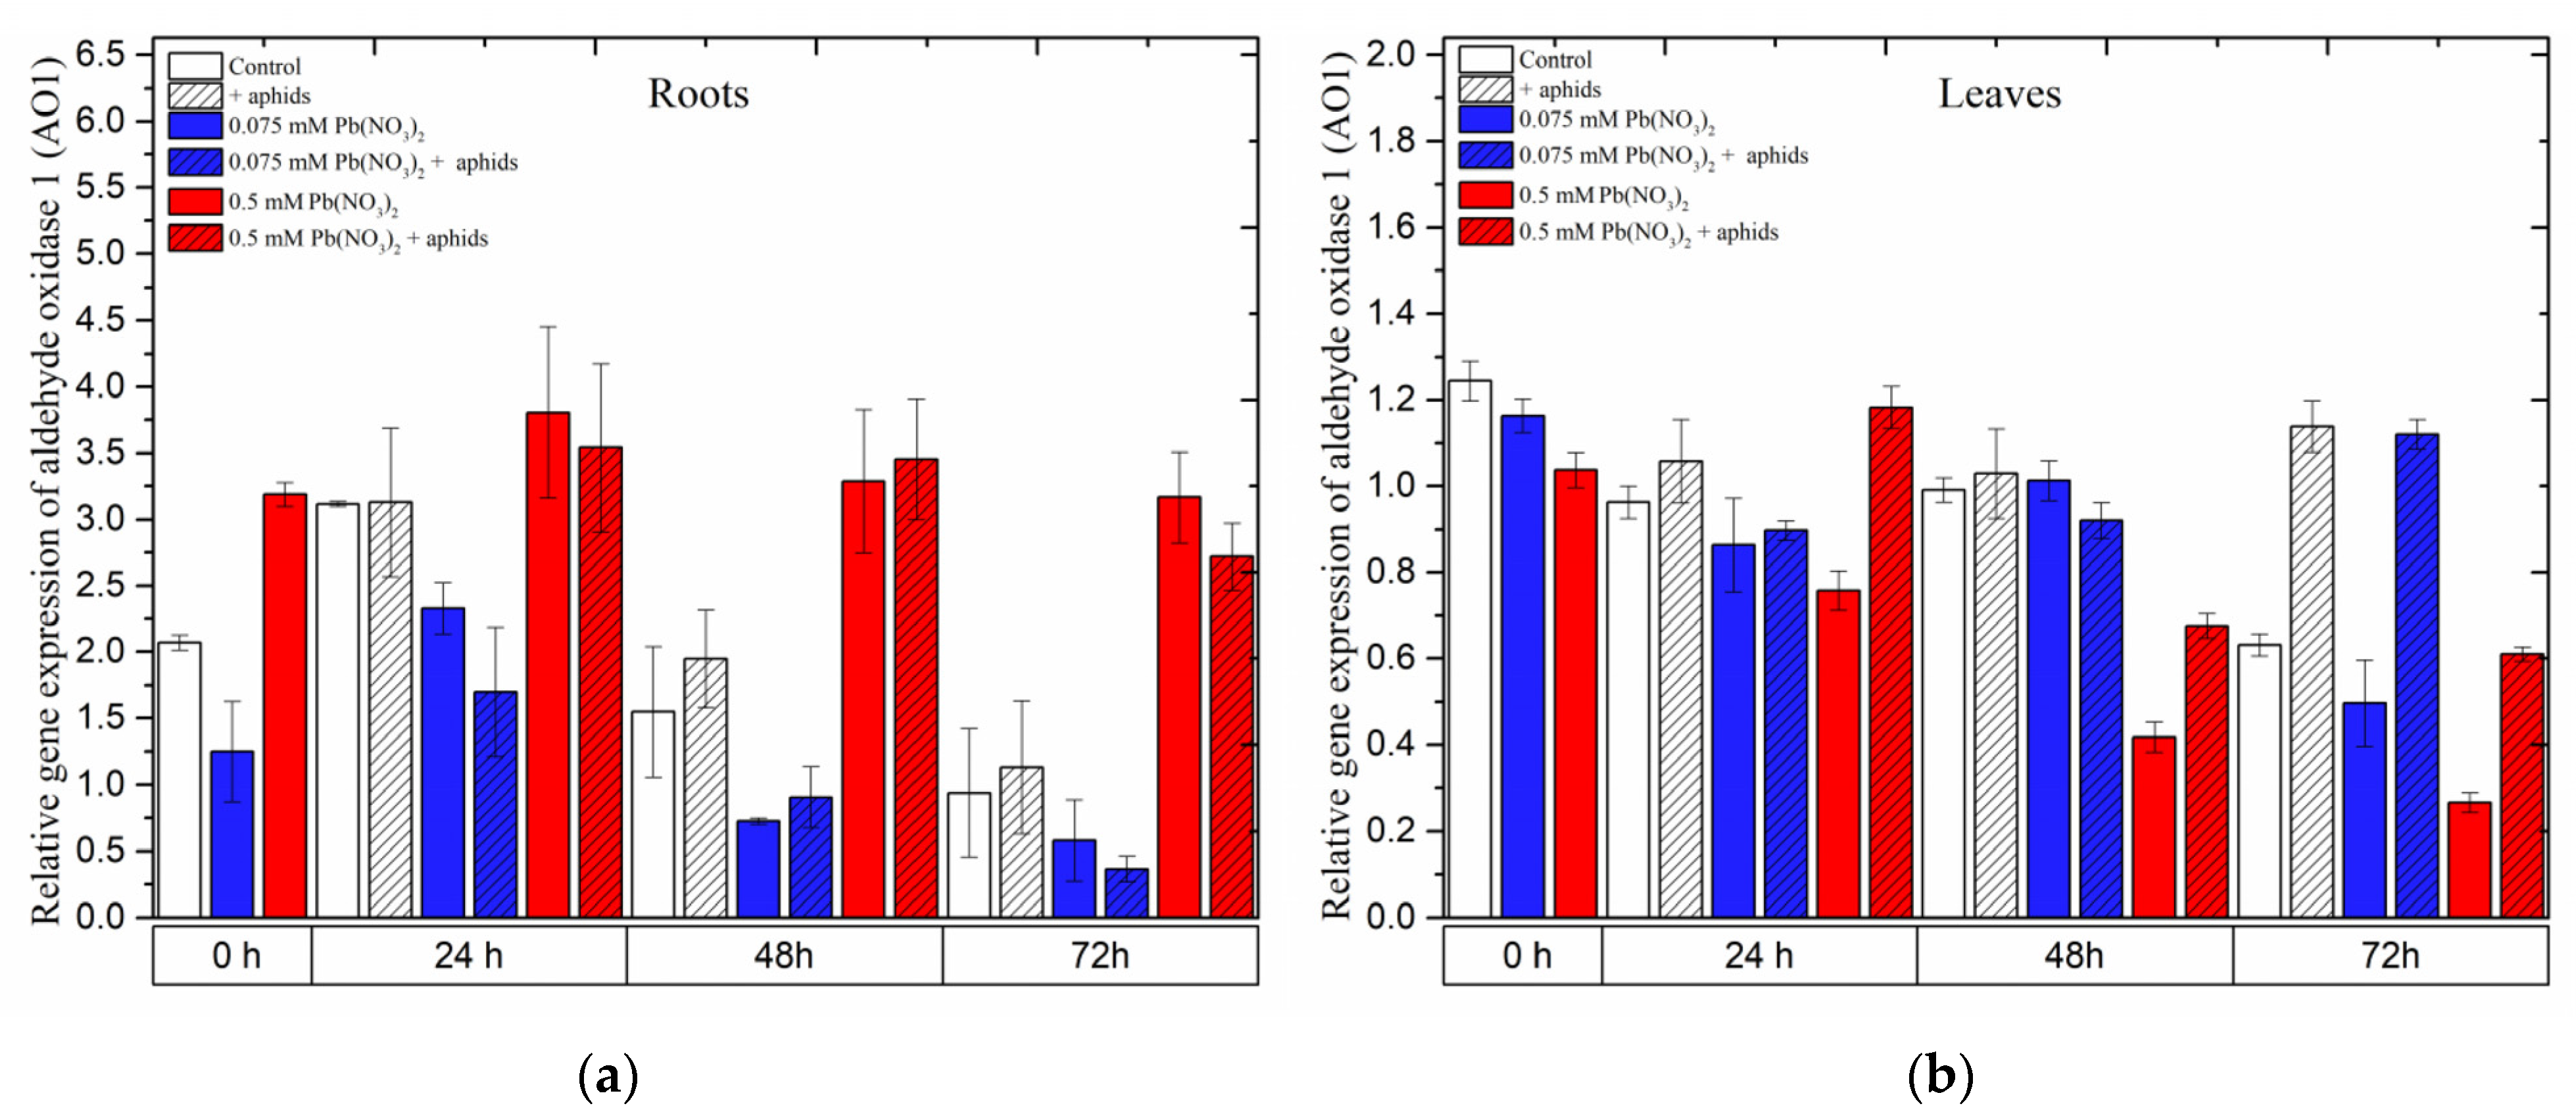
2.9. The Effect of Lead and A. pisum on Expression Levels of Aldehyde Oxidase 1 (AO1)
In the roots of pea seedlings, a high concentration of lead (0.5 mM Pb(NO
3)
2 solution) strongly induced the expression of the
AO1 gene, which encodes aldehyde oxidase 1 (AO1), an important enzyme in the biosynthesis of ABA. Under the sole effect of lead,
AO1 was remarkably upregulated by the sublethal dose of lead (0.5 mM Pb(NO
3)
2, rapidly increasing to high levels at 24 h and slightly declining at 48–72 h; however, its expression was always higher than that in the control at all time points. Similar to this evolution trend, the relative expression of
AO1 in roots of the pea seedlings was noted as a result of the combined effect of lead and aphids (0.5 mM Pb(NO
3)
2 + aphids variants). ANOVA results did not record any differences in the expression levels of
AO1 in variants of pea seedling roots treated with lead (in 0.5 mM Pb(NO
3)
2 solution) without/with aphids; however, the different expression levels of
AO1 in those variants were highly statistically significant compared to the control at all tested time points (
Figure 12a).
In contrast, the expression of
AO1 in the leaves of pea seedlings was mainly upregulated by aphids. The expression levels of
AO1 in the aphid-infested variants were higher than those in the control at all time points. Increased expression of the
AO1 gene was also observed in pea seedling leaves under the effect of aphids, upon application of a sublethal dose of lead with aphid interactions (0.5 mM Pb(NO
3)
2 + aphids variant) at 24 h and under the effect of aphids alone or the hormetic dose and aphids (0.075 mM Pb(NO
3)
2 + aphids variant) at 72 h. The relative expression of
AO1 in the other experimental variants showed lower levels or no significant differences compared to the control (
Figure 12b).
Figure 12.
Expression of aldehyde oxidase 1 (AO1) in roots (a) and leaves (b) of pea seedlings exposed to lead and A. pisum. Gene expression level was assessed by RT-qPCR. Phosphoprotein phosphatase 2A (PP2A) was used as the reference gene. The data were obtained from three independent experiments and statistically analyzed using ANOVA (p < 0.001).
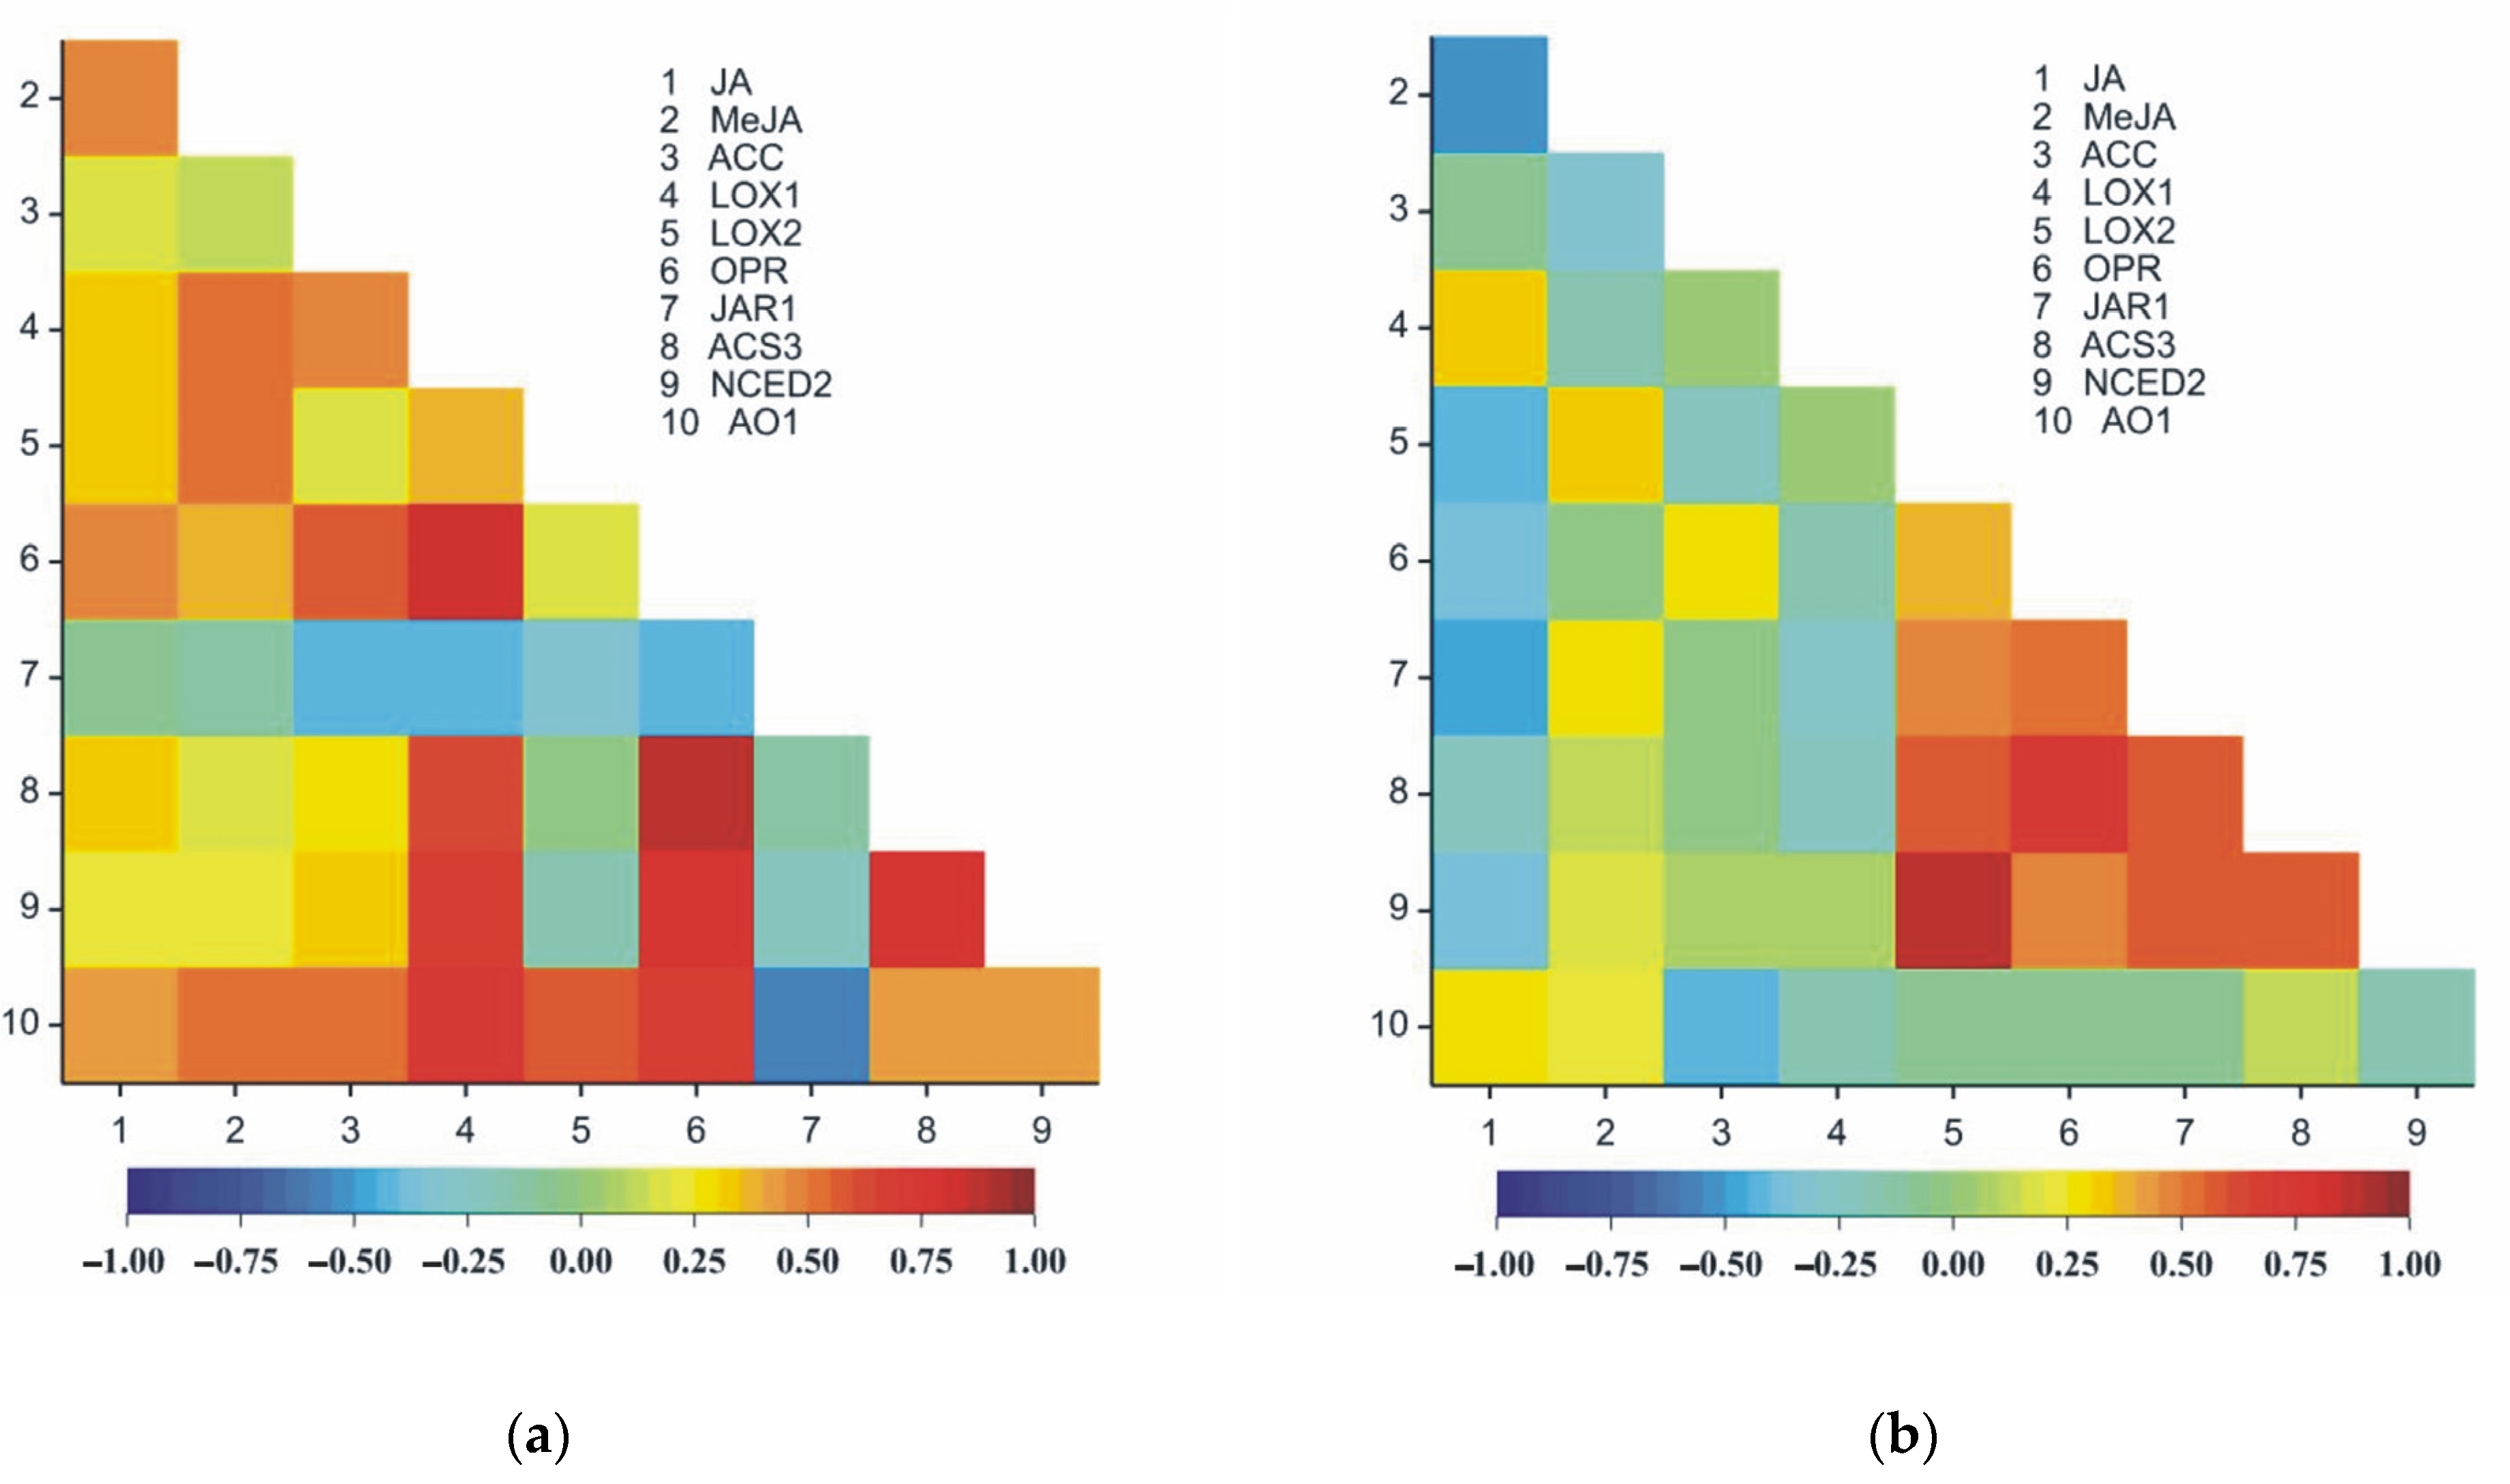
2.10. Correlation Analysis
The MANOVA results obtained for roots indicated that time (
F20;54 = 308.45), variants (
F50;127 = 207.93) and time × variant interactions (
F100;205 = 45.88) were statistically significantly different (
p < 0.0001) for all the ten traits jointly. The analysis of variance indicated that the main effect of time was significant for all the traits of this study, except for
LOX1 (
Table 1). The main effects of the variants were significant for all observed traits; however, the time × variant interaction was statistically significant for all the traits of this study except for
NCED2 (
Table 2).
The MANOVA results obtained for leaves indicated that time (
F20;54 = 392.59), variants (
F50;127 = 306.45) and time × variant interaction (
F100;205 = 74.54) were statistically significantly different (
p < 0.0001) for all the ten traits jointly. The analysis of variance indicated that the main effects of time, variant and time × variant interactions were significant for all the traits of this study (
Table 3).
In both organs of pea seedlings (roots and leaves), significant positive correlations were observed between the following pairs of traits: JA and
LOX1, JA and
AO1, MeJA and
LOX2, ACC and
OPR,
OPR and
ACS3,
OPR and
NCED2 and
ACS3 and
NCED2 (
Table 3,
Figure 13a,b).
LOX1 and
JAR1 were negatively correlated in both organs of the plants (roots and leaves) (
Table 3,
Figure 13a,b). Different signs of correlation, particularly the organs of the plant, were observed between JA and MeJA, JA and
LOX2, JA and
OPR, ACC and
AO1 and
OPR and
JAR1, as well as
LOX2 and
JAR1 (
Table 3,
Figure 13a,b). Eight pairs of traits were strongly correlated only in leaves (
Table 3,
Figure 13b); however, 18 pairs in roots were recorded.
Table 1.
Mean squares from two-way analysis of variance of observed traits in roots.
Table 1.
Mean squares from two-way analysis of variance of observed traits in roots.
| Source of Variation | Time | Variant | Time × Variant | Residual |
|---|
| d.f. | 2 | 5 | 10 | 36 |
| JA | 123694.6 *** | 124364.5 *** | 86281.6 *** | 110.7 |
| MeJA | 361.43067 *** | 249.64062 *** | 142.99084 *** | 0.04462 |
| ACC | 158.83 *** | 78.44 ** | 73.7 *** | 16.06 |
| LOX1 | 1.7468 | 181.2277 *** | 6.9638 *** | 0.6505 |
| LOX2 | 85.9859 *** | 3.3316 *** | 2.2319 *** | 0.414 |
| OPR | 6.994 *** | 432.4829 *** | 5.6986 *** | 0.5495 |
| JAR1 | 0.50587 *** | 0.85413 *** | 0.44485 *** | 0.01713 |
| ACS3 | 1.95411 *** | 5.95314 *** | 0.5122 *** | 0.06826 |
| NCED2 | 5.0463 *** | 10.1484 *** | 0.2751 | 0.1322 |
| AO1 | 9.3702 *** | 8.9024 *** | 0.4607 ** | 0.132 |
Table 2.
Mean squares from two-way analysis of variance of observed traits in leaves.
Table 2.
Mean squares from two-way analysis of variance of observed traits in leaves.
| Source of Variation | Time | Variant | Time × Variant | Residual |
|---|
| d.f. | 2 | 5 | 10 | 36 |
| JA | 69066.68 *** | 115201.53 *** | 30854.1 *** | 64.41 |
| MeJA | 7195.15 *** | 24832.73 *** | 6804.98 *** | 18.82 |
| ACC | 2563 ** | 1343.7 ** | 1210.7 ** | 358.4 |
| LOX1 | 0.188245 *** | 0.847116 *** | 0.348558 *** | 0.002717 |
| LOX2 | 14.71031 *** | 6.22456 *** | 2.02012 *** | 0.04167 |
| OPR | 106.381 *** | 21.2632 *** | 13.8401 *** | 0.4203 |
| JAR1 | 2.6038 *** | 1.44302 *** | 0.35843 *** | 0.03543 |
| ACS3 | 162.62 *** | 75.248 *** | 24.415 *** | 1.453 |
| NCED2 | 35.6774 *** | 5.4425 *** | 4.8647 *** | 0.2131 |
| AO1 | 0.265663 *** | 0.373335 *** | 0.117172 *** | 0.003367 |
Figure 13.
Heatmaps for Pearson’s correlation coefficients between all pairs of the ten observed traits in roots (a) and in leaves (b). The correlation coefficients ranged from −1 (blue) to 1 (red); rcr;0.05 = 0.19, rcr;0.01 = 0.25, rcr;0.001 = 0.32.
Figure 13.
Heatmaps for Pearson’s correlation coefficients between all pairs of the ten observed traits in roots (a) and in leaves (b). The correlation coefficients ranged from −1 (blue) to 1 (red); rcr;0.05 = 0.19, rcr;0.01 = 0.25, rcr;0.001 = 0.32.
Table 3.
The correlation matrix for the traits observed in roots (above diagonal) and leaves (below).
Table 3.
The correlation matrix for the traits observed in roots (above diagonal) and leaves (below).
| | JA | MeJA | ACC | LOX1 | LOX2 | OPR | JAR1 | ACS3 | NCED2 | AO1 |
|---|
| JA | 1 | 0.49 *** | 0.18 | 0.34 ** | 0.31 * | 0.48 *** | −0.06 | 0.34 ** | 0.21 | 0.42 *** |
| MeJA | −0.53 *** | 1 | 0.12 | 0.51 *** | 0.5 *** | 0.36 ** | −0.14 | 0.18 | 0.23 | 0.54 *** |
| ACC | −0.1 | −0.31 | 1 | 0.49 *** | 0.18 | 0.57 *** | −0.41 *** | 0.28 * | 0.32 * | 0.52 *** |
| LOX1 | 0.31 * | −0.17 | 0.04 | 1 | 0.39 ** | 0.82 *** | −0.44 *** | 0.65 *** | 0.66 *** | 0.71 *** |
| LOX2 | −0.42 *** | 0.32 * | −0.24 | 0.04 | 1 | 0.16 | −0.31 * | −0.03 | −0.18 | 0.59 *** |
| OPR | −0.39 ** | −0.02 | 0.29 * | −0.2 | 0.39 ** | 1 | −0.41 *** | 0.87 *** | 0.79 *** | 0.67 *** |
| JAR1 | −0.48 *** | 0.26 * | −0.02 | −0.26 * | 0.48 *** | 0.54 *** | 1 | −0.15 | −0.21 | −0.55 *** |
| ACS3 | −0.23 | 0.12 | −0.03 | −0.22 | 0.58 *** | 0.72 *** | 0.58 *** | 1 | 0.78 *** | 0.40 *** |
| NCED2 | −0.36 ** | 0.15 | 0.05 | 0.09 | 0.85 *** | 0.49 *** | 0.59 *** | 0.57 *** | 1 | 0.43 *** |
| AO1 | 0.27 * | 0.21 | −0.43 *** | −0.17 | −0.06 | −0.1 | −0.05 | 0.14 | −0.16 | 1 |
3. Discussion
The results obtained in this work showed, for the first time, the involvement of the biosynthesis of defense phytohormones at a molecular level in edible pea (Pisum sativum L. Cysterski) upon exposure of the plant to varying concentrations of lead—with the low concentration potentially leading to the hormesis effect and the high concentration causing a sublethal effect—as well as during infestation by phytophagous pea aphids (Acyrthosiphon pisum) (Harris). These studies are valuable for explaining the defense mechanisms of pea seedlings under controlled conditions as a response to numerous stressors. First, a significant induction of the expression of genes encoding enzymes for the biosynthesis of defense phytohormones such as JA/MeJA (LOX1, LOX2, OPR1 and JAR1), ET (ACS3) and ABA (NCED and AO1) has been demonstrated. It should be emphasized that the highest expression levels of genes encoding these enzymes, such as LOX1, LOX2, OPR1, ACS3, NCED2 and AO1, were observed in roots with a sublethal dose of lead. Additionally, pea aphid infestation on pea seedlings caused a strong upregulation of the abovementioned genes in the roots growing at a sublethal lead dose at some experimental time points. This result was clearly visible for genes such as LOX1, OPR1 and ACS3. Moreover, a very strong upregulation of the JAR1 gene in roots due to the effect of aphid feeding alone or the lead hormesis dose combined with aphid infestation was reported. This result clearly proves the upregulation of the JAR1 gene and of those mentioned above as a result of signal transmission from the leaves of pea seedlings to the roots in response to A. pisum infestation. Moreover, a strong upregulation of OPR1 and ACS3 gene expression in the leaves of pea seedlings under the influence of aphids and the cross-talk of lead and aphids was noted. It should be mentioned that changes in the expression of the analyzed genes in the roots and the leaves sometimes showed different trends, which was certainly dependent on the contact of the stressor with the pea seedling organs, its intensity and the duration. The results obtained in this work also revealed a significant increase in JA/MeJA and ET concentrations in response to abiotic (lead at sublethal and hormetic doses) and biotic (pea aphid A. pisum infestation) stressors acting independently or simultaneously.
Signaling networks play an important role in plant adaptation to environmental conditions and in plant survival [
31]. MeJA is known to be one of the most crucial plant signaling molecules that mediates both local and systemic responses against a wide spectrum of environmental stress factors, including insect attack [
32]. Jasmonates may function as fundamental phytohormones protecting plants from heavy metals and metalloids, as evidenced by the evolutionary conservation and diversity of these gene families in a large number of species of the major green plant lineages [
33]. Additionally, jasmonic acid applications are effective against aphids [
34]. For instance, exogenous applications of JA decreased aphid reproduction in cucumber leaves and increased the gene expression level of
OPR11 [
35].
Plants exposed to abiotic stresses (heat and drought combined) and biotic stresses (grain aphid infestation) have been shown to have elevated levels of ABA. Besides the increase in ABA, grain aphid infestation further increased the jasmonic acid- and salicylic acid-dependent defenses under combined abiotic stress conditions.
In the present work, we showed the effects of lead and cross-talk of Pb and the pea aphid
A. pisum on the expression levels of the 9-
cis-epoxycarotenoid dioxygenase (
NCED) and
aldehyde oxidase 1 (
AO1) genes. The results of our current research have revealed a significant upregulation of these genes which encode important enzymes of ABA biosynthesis in the roots of pea seedlings. The concentration of ABA in this model system has been determined in previous work [
6]. A significant accumulation of ABA and total salicylic acid (TSA) was recorded in the roots and leaves of pea seedlings growing on a medium supplemented with lead and then during infestation by aphids. It should be noted that high levels of ABA in the presence of a sublethal dose of lead, both in the roots and the leaves, were recorded; these were markedly higher in the leaves than in the roots. Moreover, ABA accumulation also occurred as a result of
A. pisum infestation, mainly at 24 h (+aphid variants).
On the other hand, it was demonstrated that heavy metals such as arsenic (As) led to a high expression of ABA biosynthesis genes such as
OsNCED2 and
OsNCED3 in rice (
Oryza sativa L.), as well as causing the upregulation of four ABA signaling genes [
36]. Moreover, as reported by Bücker-Neto et al. [
37], an increase in the endogenous ABA levels in roots of
Typha latifolia and
Phragmites australis [
38], in potato tubers [
39] and also in rice plants was noted as a response to Cd treatment [
40].
Plant–insect interactions in relation with the influence of other stress factors are generally poorly understood. In the published literature, there are no studies on the regulation of the expression of genes acting on phytohormone biosynthetic pathways by hormetic doses of heavy metals. It has been demonstrated that under heavy metal toxicity exposure, plants exhibit a rapid increase in ethylene production and reduced growth and development [
41]. Furthermore, these authors have pointed out that most studies have focused on
ACS or
ACO gene expression levels, although other levels of regulation, such as post-transcriptional and post-translational modifications, can affect enzyme activities under heavy metal exposure. In turn, lead treatment yielded an increase in the transcript levels of
EIN2 in
Arabidopsis seedlings, indicating a key role of this gene in heavy metal tolerance [
42].
Our results indicate a significant induction of expression of the
ACS3 gene in the roots and leaves of pea seedlings growing under the influence of sublethal and hormetic doses of lead. Additionally, a strong upregulation of this gene under the influence of sublethal and hormetic doses of lead and during pea aphid infestation occurred. The
ACS3 gene encodes an essential enzyme in the biosynthesis of ET that catalyzes the synthesis of 1-aminocyclopropane-1-carboxylic acid (ACC), a precursor of ET from
S-adenosyl methionine (AdoMet, SAM). Numerous studies have revealed that aphid feeding can stimulate ET synthesis upon different plant–aphid interactions [
43]. The above authors demonstrated that ET production in Arabidopsis was significantly induced by aphid infestation. Furthermore, numerous studies have reported increased ethylene production in plants exposed to metals [
44].
4. Materials and Methods
4.1. Plant Material and Growth Conditions
Seeds of pea (
Pisum sativum L. cv. Cysterski) from the Plant Breeding Company in Tulce near Poznan in Poland were used during the experiments. Firstly, seeds were surface-sterilized using ethanol for 3 min and repeatedly rinsed with distilled water and finally left in an incubator for 6 h at 23 °C for imbibition. Next, the seeds were transferred to Petri dishes and immersed in a small amount of water for 66 h. The germinating seeds were transferred to dark hydroponic boxes with Hoagland medium. On the fifth day, the medium was replaced in all the hydroponic variants and lead was added to the medium at doses of 0.075 Pb(NO
3)
2 and 0.5 mM Pb(NO
3)
2 [
6,
14]. After the next four days, pea seedlings were infested with 20 adults of pea aphid. Samples for analyses were collected four days after Pb administration and prior to transferring the aphids onto the pea seedlings (at 0 h) and then after 24, 48 and 72 h of both stress treatments.
During the experiments, hydroponic cultures were aerated with an aeration system. All pea seedlings, including the control seedlings, Pb-treated seedlings and those growing in the presence of Pb and infested by A. pisum, were cultured in glass aquariums (30 cm × 22 cm × 28 cm) and protected with gauze. The experiment was conducted in a growth chamber at 22–23 °C and 65% relative humidity and with a light intensity of 130–150 μmol photons m−2s−1 with a 14/10 h (light/dark) photoperiod. The experimental variants were as follows: control pea seedlings cultured without Pb and not colonized by pea aphids (Acyrthosiphon pisum); pea seedlings growing in Hoagland medium with varied concentrations of Pb, i.e., 0.075 mM Pb (NO3)2 and 0.5 mM Pb(NO3)2; pea seedlings growing in Hoagland medium with varied concentrations of Pb and colonized by pea aphids A. pisum and pea seedlings growing in Hoagland medium colonized by pea aphids A. pisum. The objects of this study were the leaves and roots of pea seedlings.
4.2. Aphids and Infestation Experiments
A. pisum (Harris) aphids were reared on
P. sativum L. cv. Cysterski in a growth chamber under conditions as specified above. On day 11 of culture, pea seedlings were infested with 20 wingless adult females of
A. pisum using a fine paintbrush. The aphid populations were monitored throughout all the experiments [
6,
14]. The control pea seedlings were cultured with no addition of lead and not colonized by pea aphids.
4.3. Determination of Jasmonic Acid (JA) and Methyl Jasmonate (MeJA)
The analyses of jasmonic acid (JA) and methyl jasmonate (MeJA) were performed using GC–MS according to the method described by Fan et al. [
45]. Leaves and roots of pea (1 g) were homogenized in liquid nitrogen and then with 200 ng of deuterium-labeled methyl jasmonate (d2-MeJA) and 200 ng of deuterium-labeled jasmonic acid (d5-JA) as internal standards in 20 mL of 80% (
v/
v) methanol. The suspension was left to stir overnight and then centrifuged at 10,000×
g for 10 min. The residue was re-extracted with 80% methanol in two parts of 20 mL each. Combined supernatants were reduced to the aqueous phase by rotary evaporation, acidified to pH 2.0 with 7 M HCl and centrifuged at 10,000×
g for 10 min to remove chlorophylls. The supernatant was partitioned three times against chloroform and then dried under vacuum. The residue was dissolved in 3 mL
n-hexane and applied to a silica gel solid-phase extraction column (Backer-bound SPE silica gel, 500 mg, 3 mL; J.T.Backer, Philipsburg, NJ, USA). The column was washed with 5 mL
n-hexane and then eluted with 6 mL of
n-hexane:diethyl ether (2:1,
v/
v) with 0.5% (
v/
v) acetic acid. The eluate was evaporated and further purified by HPLC using a SUPELCOSIL ABZ + PLUS column (250 mm × 4.5 mm, 5 µm particle size; Supelco Inc., Bellefonte, PA, USA). The samples were dissolved in 200 µL of 20% methanol and chromatographed with a linear gradient of 20–80% methanol in 1% (
v/
v) formic acid in 20 min, with a flow rate of 1.0 mL/min at a temperature of 22 °C. The fractions collected at the retention times of 12.0–13.4 min for JA and 18.30–19.20 min for MeJA were evaporated to dryness, and in the case of JA, methylated with (Trimethylsilyl)diazomethane (Sigma-Aldrich, St. Louis, MO, USA), dissolved in 50 µL of methanol and analyzed by GC–MS-SIM (Auto-System XL coupled to a Turbo Mass, PerkinElmer, Waltham, MA, USA) using a DB-5 column (30 m × 0.25 mm, 0.5 µm phase thickness). The GC temperature program was 80 °C for 1 min, 80–160 °C at 10 °C/min and 160–230 °C at 5 °C/min, with a flow rate of 1 mL/min, injection port of 250 °C and electron potential of 70 eV. GC/MS-SIM analysis was performed by monitoring
m/
z 156, 161, 193, 198, 224, 226 and 229. The dwell time for all ions was 100 ms. The levels of JA and MeJA in the samples were determined from the ratio of peak area, calculated following d5-JA and d2-MeJA standards and expressed as nanograms per gram of fresh material (ng × g
−1 FW).
4.4. Determination of Aminococyclopropane-1-carboxylic Acid (ACC)
Endogenous levels of aminococyclopropane-1-carboxylic acid (ACC) were determined using mass spectrometry combined with liquid chromatography (LC–MS). Leaves and roots of pea (300 mg) were homogenized in liquid nitrogen. For the extraction, 4 mL of 60% acetonitrile (v/v) in 2% HCOOH (v/v) was added, and a small amount of the antioxidant butylhydroxytoluol (BHT) was used. Additionally, 25 ng of 1-aminocyclopropane-2,2,3,3-d4-carboxylic acid as a standard was added. The mixture was shaken overnight, and then, 0.4 g of MgSO4 and 0.1 g NaCl were added and vortexed for 2 min. Next, the samples were centrifuged at 10,000× g for 10 min and the upper layer was collected. The pellet was extracted once again with 2 mL of acetonitrile and agitated for an additional 30 min and centrifuged. Combined supernatants were then dried in a stream of nitrogen, and the samples were reconstituted with 1 mL of 1M HCOOH and finally subjected to solid phase extraction using silica packed columns (Discovery® DSC-18 SPE Tubes, Supelco Inc. Bellefonte, PA, USA). The columns were activated with 100% methanol and conditioned with 1 M HCOOH. Elution was performed using 80% methanol (v/v). For determination, the LCMS-8045 tandem mass spectrometer (Shimadzu Corp., Kyoto, Japan) was used. Chromatographic separation was carried out on a Kinetex® 2.6 μm XB-C18 100 Å reverse phase column (150 × 2.1 mm, Phenomenex, Le Pecq, France). Water with 0.1% formic acid (v/v) (A) and methanol with 0.1% formic acid (v/v) (B) were used as the mobile phases. A linear gradient of 40–90% (v/v) of B for 7 min at a flow rate of 0.3 mL/min at 30 °C was used. In the mass spectrometry experiments, the samples were subjected to positive electrospray ionization (ESI), and ions were fragmented by collision-induced dissociation (CID). The ionization voltage was −3 kV. Analysis of the aminococyclopropane-1-carboxylic acid (ACC) content was based on the MRM transitions used for analyte quantitation (102 → 56 m/z) and for deuterated internal standard (106 → 60 m/z). Results were expressed as nanograms per gram of fresh material (ng × g−1 FW).
4.5. Extraction of Total RNA and Analysis by Reverse Transcription Polymerase Chain Reaction (RT-qPCR)
The extraction of the total RNA from roots and leaves was carried out using the miRNeasy Mini Kit (Qiagen, Venlo, the Netherlands), with the additional step of on-column digestion using an RNase-Free DNase Set (Qiagen, Venlo, The Netherlands). Evaluation of the quality and the quantity of the extracted total RNA was performed with a Nanodrop ND-1000 Spectrophotometer (Thermo Scientific Waltham, MA, USA), UV/VIS measurement and gel electrophoresis techniques. Synthesis of cDNA was performed with an NG dART RT Kit (EURx, Gdansk, Poland) using 0.5 µg of total RNA in a 20-µL reaction volume. The synthesized samples were then diluted with RNase-free water five times to a final volume of 100 µL before being used in the qPCR. Quantitative PCR was performed using the SensiFAST Probe No-ROX kit (Bioline Meridian Bioscience, Cincinnati, OH, USA) following the manufacturer’s protocol. Each 20-µL reaction contained the following: 5 µL cDNA template, 1 µL of 10 µM qPCR forward primer, 1 µL of 10 µM reverse primer, 10 µL of 2× SensiFAST Probe No-ROX Mix, 0.2 µL of 10 µM specific UPL probe (Roche, Basel, Switzerland) and 2.8 µL ddH
2O. The qPCR was carried out on the LightCycler480 (Roche, Switzerland) under the following conditions: pre-incubation at 95 °C for 10 min followed by 45 cycles of 95 °C for 10 s, 60 °C for 30 s and 72 °C for 1 s. Each experiment, consisting of three biological replicates, was carried out in three technical replicates. Calculation of the relative expression levels was achieved using the 2
−∆∆Ct method, and the data were normalized to the CT values with the
PPA2 gene as a reference. The primers and UPL (Universal Probe Library) probes used in the qPCR were designed using ProbeFinder version 2.48 (Roche, Switzerland) and are listed in
Table 4.
4.6. Statistical Analysis
All determinations were conducted within three independent experiments. The normality of the distribution of the ten traits, namely JA, MeJA, ACC,
LOX1,
LOX2,
OPR,
JAR1,
ACS3,
NCED2 and
AO1, was tested using the Shapiro–Wilk normality test [
46] to verify whether the analysis of variance (ANOVA) met the assumption that the ANOVA model residuals followed a normal distribution. The homogeneity of the variance was tested using Bartlett’s test. Box’s M test tested multivariate normality and homogeneity of variance–covariance matrices. All the traits had a normal distribution. A two-way (time, variant) multivariate analysis of variance (MANOVA) was performed. Two-way analyses of variance (ANOVA) were carried out to determine the effects of time and variants as well as time × variant interaction on the variability of the observed traits. The relationships between the ten observed traits were estimated using Pearson’s linear correlation coefficients. Relationships within the observed traits are presented in heatmaps. The elementary comparisons between the specific levels of the analyzed factors were tested using the two-sample t-test for equal means for all the observed traits. To account for multiple testing, we used the Bonferroni correction. All analyses were performed independently for leaves and roots. The figures present the data obtained as means of triplicates for each variant along with standard errors of mean (SE). The GenStat v. 22 statistical software package (VSN International, Hemel Hempstead, UK) was used for the analyses.


 ,
, 


