Article

Circulating miRNAs Expression in Myalgic Encephalomyelitis/Chronic Fatigue Syndrome

1
Department of Chemical, Pharmaceutical and Agricultural Sciences, and LTTA, University of Ferrara, 44121 Ferrara, Italy
2
Institute of Microbiology and Virology, Rīga Stradiņš University, LV-1067 Riga, Latvia
3
Faculty of Medicine, Department of Infectology, Rīga Stradiņš University, LV-1006 Riga, Latvia
*
Authors to whom correspondence should be addressed.
These authors contributed equally to this work.
Int. J. Mol. Sci. 2023, 24(13), 10582; https://doi.org/10.3390/ijms241310582
Submission received: 30 May 2023 / Revised: 15 June 2023 / Accepted: 21 June 2023 / Published: 24 June 2023

Abstract

:
Myalgic encephalomyelitis/chronic fatigue syndrome (ME/CFS) is a complex multifactorial disease that causes increasing morbidity worldwide, and many individuals with ME/CFS symptoms remain undiagnosed due to the lack of diagnostic biomarkers. Its etiology is still unknown, but increasing evidence supports a role of herpesviruses (including HHV-6A and HHV-6B) as potential triggers. Interestingly, the infection by these viruses has been reported to impact the expression of microRNAs (miRNAs), short non-coding RNA sequences which have been suggested to be epigenetic factors modulating ME/CFS pathogenic mechanisms. Notably, the presence of circulating miRNAs in plasma has raised the possibility to use them as valuable biomarkers for distinguishing ME/CFS patients from healthy controls. Thus, this study aimed at determining the role of eight miRNAs, which were selected for their previous association with ME/CFS, as potential circulating biomarkers of the disease. Their presence was quantitatively evaluated in plasma from 40 ME/CFS patients and 20 healthy controls by specific Taqman assays, and the results showed that six out of the eight of the selected miRNAs were differently expressed in patients compared to controls; more specifically, five miRNAs were significantly upregulated (miR-127-3p, miR-142-5p, miR-143-3p, miR-150-5p, and miR-448), and one was downmodulated (miR-140-5p). MiRNA levels directly correlated with disease severity, whereas no significant correlations were observed with the plasma levels of seven pro-inflammatory cytokines or with the presence/load of HHV-6A/6B genome, as judged by specific PCR amplification. The results may open the way for further validation of miRNAs as new potential biomarkers in ME/CFS and increase the knowledge of the complex pathways involved in the ME/CFS development.

1. Introduction

Myalgic encephalomyelitis/chronic fatigue syndrome (ME/CFS) is a severe chronic disease that is characterized by unexplained debilitating fatigue, post-exertional malaise, localized or diffuse muscle pain, and sleep disturbances. The prevalence of ME/CFS in Europe ranges from 0.1% to 2.2% [1], although the estimate is affected by the poor knowledge of the disease, its challenging recognition, and the existence of different case definitions, based on different diagnostic criteria (among the commonly used ones, Centers for Disease Control & Prevention (CDC, 1994) [2], Canadian Consensus Criteria [3], London Criteria [4], International Consensus Criteria [5], or Institute of Medicine criteria) [6].
ME/CFS etiology is still unclarified, but it is recognized as a heterogeneous and multifactorial disease, and several factors have been hypothesized as triggers, including genetic predisposition, physical or emotional stress conditions, disruption of immunological processes, infection, and autoimmunity [7,8].
Several pieces of evidence support the role of human herpesviruses (HHVs), including HHV-6A, HHV-6B, HHV-7, and Epstein–Barr virus (EBV), as potential causative agents. To note, 49–93% of patients who developed ME/CFS disease reported an initial “flu-like” symptomatology, suggestive of undergoing viral infection or reactivation [9,10,11]. Consistently, HHV-6A/6B reactivation has been associated with the occurrence of ME/CFS clinical symptoms and higher levels of proinflammatory cytokines, including tumor necrosis factor (TNF)-α, interleukin (IL)-6, and IL-12 [12,13]. Saliva samples from ME/CFS patients were recently reported to harbor high loads of HHV-6 and HHV-7, which correlated with symptoms’ severity, thus supporting the hypothesis that HHV reactivation may have a role in ME/CFS pathogenesis and related immunological dysregulation [14]. Reactivation of HHV-6 was observed in the brain and neuronal tissues of ME/CFS patients, supporting the role of this virus in disease development [15].
However, despite increasing evidence implicating HHVs as potential etiological agents of ME/CFS, the underlying mechanisms are not clarified, and a few mechanistic hypotheses have been recently proposed [16,17]. HHV-6 reactivation was reported to induce mitochondrial fragmentation, decrease of ATP production, and an increase in reactive oxygen species, which are considered the key pathway in ME/CFS pathophysiology [16,18]. Other recent data evidenced a possible role of HHV-6A in altering germinal center activity and extrafollicular antibody responses by viral protein deoxyuridine triphosphate nucleotidohydrolase [17].
The lack of quantitative markers for ME/CFS diagnosis has stimulated several studies in the past 30 years, originally suggesting the role of immune response or dysfunction and trying to identify specific cytokines as biomarkers for the disease development [19,20]. Some data were, however, recognized as artifacts, such as those regarding the transforming growth factor β (TGFβ) marker, which, in fact, was related to the procedure of sample preparation rather than to genuine variation in serum concentration [20]. Other reports suggest that ME/CFS could be an autoimmune disease [8,21], and, indeed, increased plasmatic levels of antibodies against beta2-adrenergic receptors and muscarinic acetylcholine receptor 4 were found in ME/CFS patients compared to healthy controls [22].
More recently, growing interest has been given to microRNAs (miRNAs) as potential biomarkers in ME/CFS; however, so far, no miRNA has been validated for clinical diagnosis [23,24,25]. MiRNAs are short sequences (18–23 nucleotides) of non-coding RNA with essential roles in regulating gene expression at the post-transcriptional level, which is suggested to have a role in many pathological pathways. Specifically, circulating miR-124, miR-448, and miR-551b have been found to be differentially expressed in patients with rheumatoid arthritis (RA), systemic lupus erythematosus (SLE), Sjögren’s syndrome (SS), and ulcerative colitis, with respect to healthy controls, and thus have been suggested as biomarkers for autoimmune diseases [26]. High-throughput miRNome sequencing of plasma from ME/CFS subjects evidenced differential expression of miR-127-3p, miR-142-5p, and miR-143-3p compared to non-CFS controls [24]. In addition, the upregulation of miR-140-5p and miR-150-5p expression has been reported both in plasma and peripheral blood mononuclear cells (PBMCs) of ME/CFS subjects compared to healthy controls or associated with ME/CFS response to post-exertional malaise induction [23,25,27], and an influence of the nutritional status and gender of patients has been observed [27]. The main findings regarding the mentioned miRNAs and their association and role in ME/CFS disease are summarized in Table 1.
Interestingly, the infection by HHV-6 has been reported to affect the expression of miRNAs in different tissues and cellular types, particularly of those miRNAs also found to be deregulated in patients with autoimmune diseases [38,39,40].
Based on these observations, the aim of the present study was to determine the potential role of autoimmunity-associated miRNAs as biomarkers of ME/CFS. To this purpose, circulating miR-124-3p, miR-127-3p, miR-140-5p, miR-142-5p, miR-143-3p, miR-150-5p, miR-448, and miR-551b-3p were analyzed in plasma from 40 ME/CFS patients and 20 healthy controls (CTRs). Correlations were searched between miRNAs’ expression and disease severity, plasma pro-inflammatory cytokines, and HHV-6 infection/reactivation.

2. Results

2.1. Epidemiological and Clinical Features of ME/CFS and CTR Groups

A total of 60 subjects were recruited at the Rīga Stradiņš University outpatient clinic (Riga, Latvia), including 40 patients with clinical diagnosis of ME/CFS and 20 healthy subjects without medical history and symptoms of ME/CFS who were included as controls. Based on semi-structured interview questions created by Minnock et al. [41], ME/CFS patients were subdivided into three subgroups, according to the degree of disease severity (1, severe; 2, moderate; and 3, mild). Epidemiological characteristics (age and gender distribution) and ME/CFS severity of recruited patients were presented in Table 2. ME/CFS group included 9 men (30–69 years old) and 31 women (24–76 years old), with a mean age of 49.3 years. Overall, 5 patients out of 40 (12.5%) presented the most severe disease (grade 1), 22/40 (55%) were classified as severity grade 2 (moderate ME/CFS), and 13/40 (32.5%) presented the mildest degree of severity (grade 3). The control group included 4 men (19–38 years old) and 16 women (18–61 years old), with a mean age of 33.4 years. No statistically significant differences were observed in gender distribution between the ME/CFS and control groups (p = 1.00), whereas a statistically significant difference was observed for mean age (p < 0.0001), likely due to the low number or healthy subjects recruited.

2.2. Quantification of Pro-Inflammatory Cytokines in Plasma Samples

In order to correlate miRNA levels with the eventual inflammatory status of ME/CFS patients, the levels of seven of the most relevant cytokines involved in autoimmune diseases (IFN-γ, IL-17A, IL-2, IL-21, IL-23, IL-6, and TNF-α) were quantified in plasma samples from 39 patients and 20 controls, using the MILLIPLEX MAP Human High Sensitivity T Cell Panel—Immunology Multiplex Assay on Luminex 200 System. The results, which are summarized in Table 3, showed that five out of seven tested cytokines (IL-17A, IL-2, IL-21, IL-6, and TNF-α) were decreased in the ME/CFS group compared to the controls. By subdividing the ME/CFS group based on the severity of symptoms (1, severe; 2, moderate; and 3, mild), statistically significant differences were observed between the CTR group and ME/CFS-2 and ME/CFS-3 subgroups for IL-17A (p < 0.0001 and p = 0.0043, respectively), IL-2 (p < 0.0001 and p = 0.0004), IL-21 (p < 0.0001 and p = 0.0005), and IL-23 (p = 0.0013 and p = 0.0156). IL-6 levels were markedly reduced in ME/CFS-1 and -2 subgroups, compared to the controls (p = 0.0061 and p = 0.0308, respectively). Last, TNF-α resulted in being significantly decreased in ME/CFS grade 2 patients (p = 0.0038), compared to the CTR group. Interestingly, patients with the most severe disease (ME/CFS—grade 1) exhibited higher levels of all tested cytokines compared to subjects with moderate and mild disease, although the difference was not statistically significant. Although data regarding cytokine levels in ME/CFS disease are conflicting, a significant upward linear trend which correlated with ME/CFS severity has already been observed; however, in this case, cytokine levels in patients were found to be higher than in controls [19].

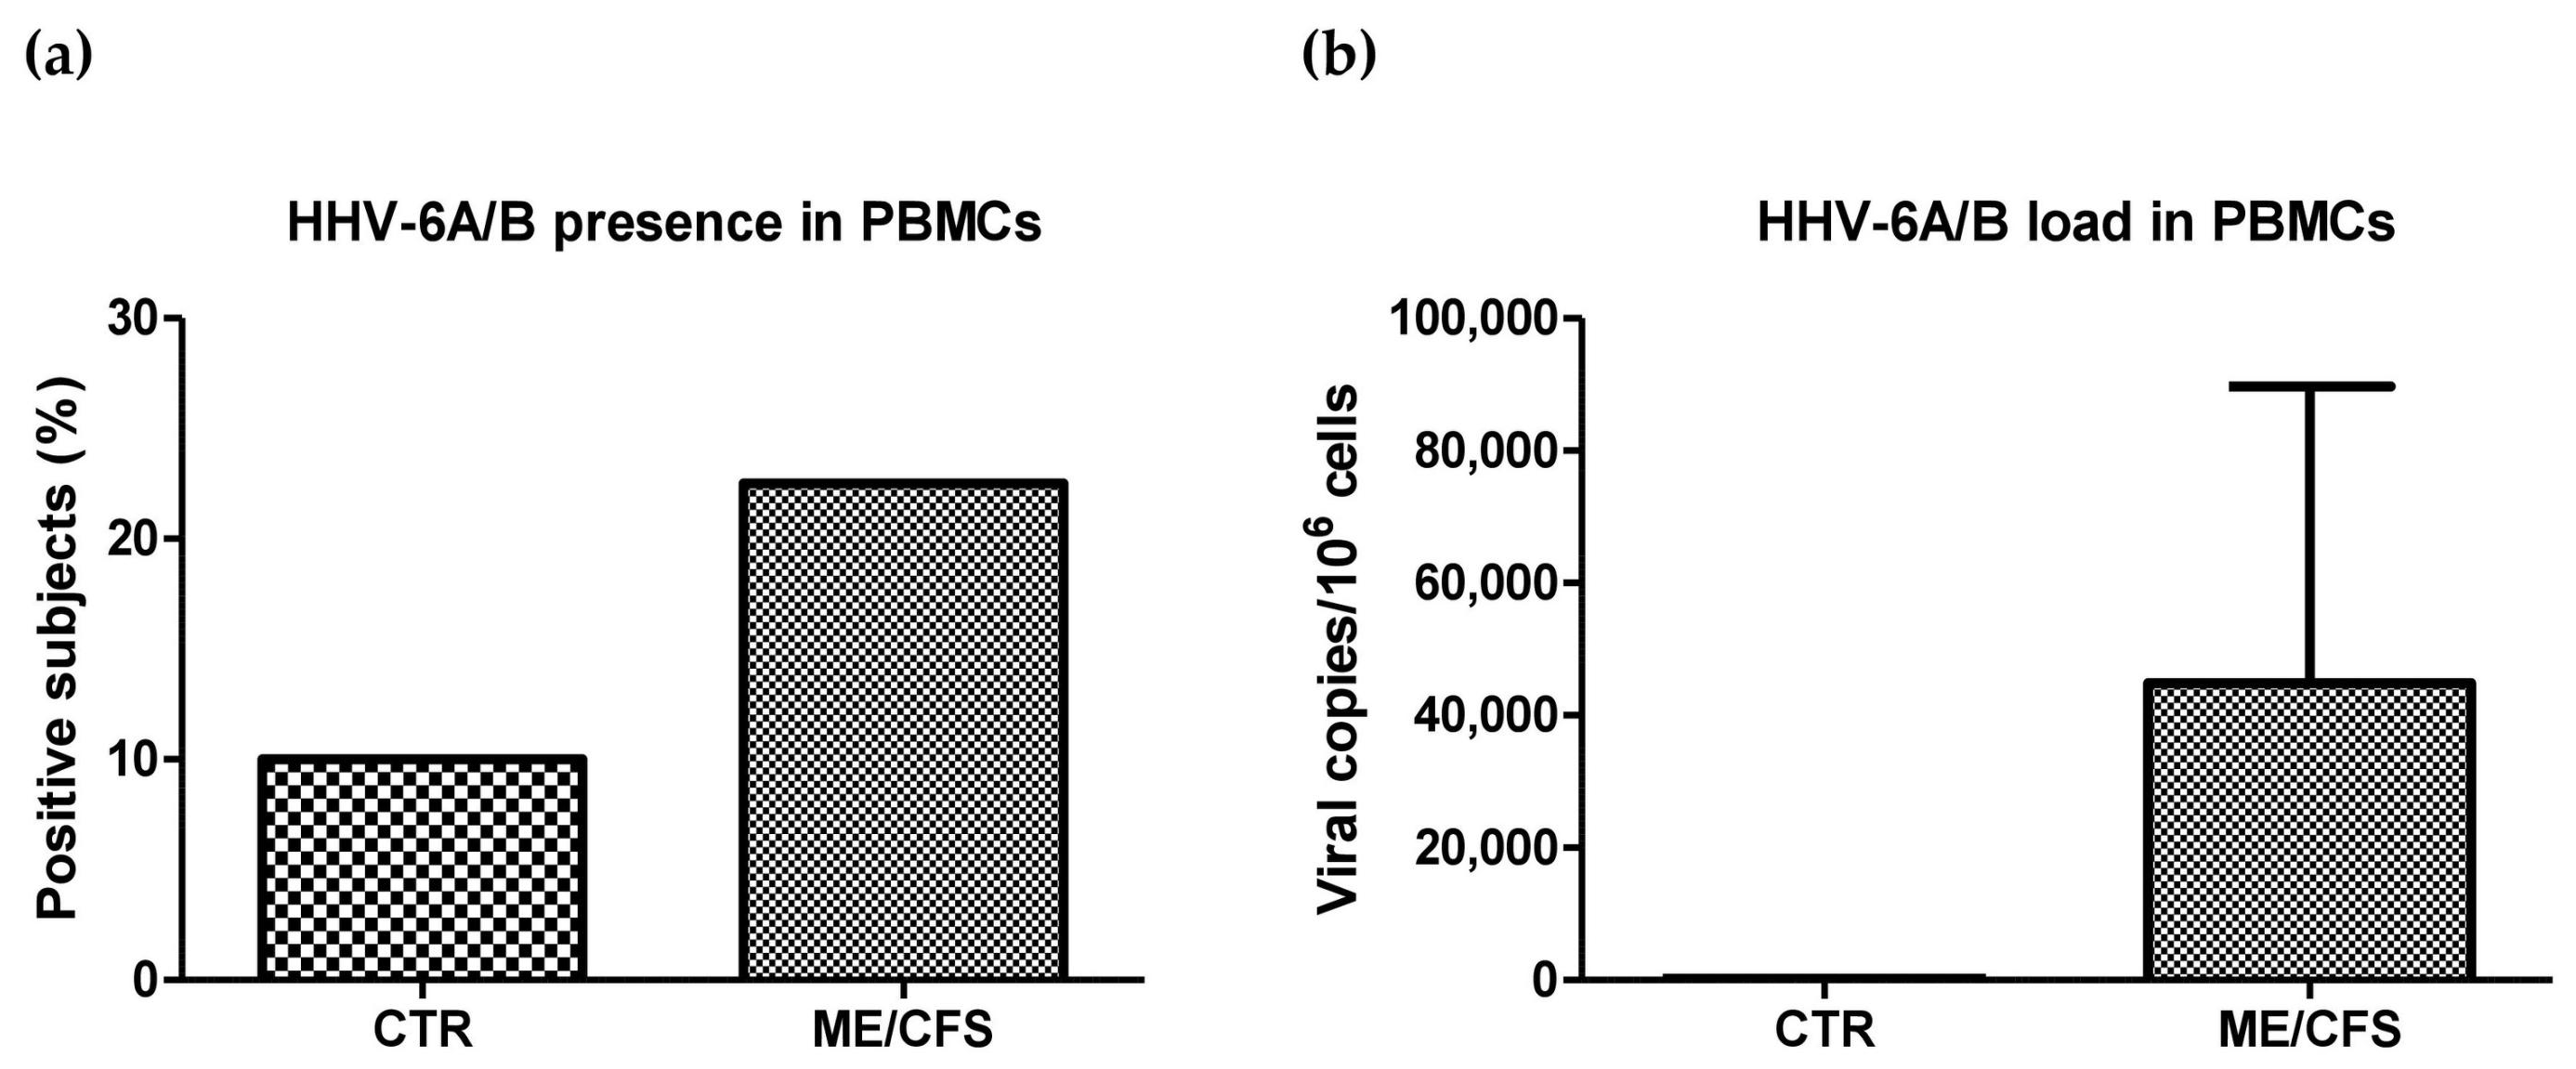
2.3. HHV-6A/B Presence and Load

In order to assess the presence and amount of HHV-6A/6B in the blood of ME/CFS subjects compared to controls, PBMCs were isolated from whole blood of patients and controls, and HHV-6A/B viral presence was analyzed by specific quantitative real-time PCR (RT-PCR), targeting the HHV-6 pol-gene. The results, reported in Figure 1, showed that a total of 9/40 patients (22.5%) resulted in being positive for the presence of HHV-6A/6B, with a mean viral load of 44,871.00 copies/106 cells (range 5.71–403,454.00 copies/106 cells). Among HHV-6-positive ME/CFS patients, two patients had severe symptoms (ME/CFS Subgroup 1; 2/5, 40%), six subjects showed moderate ME/CFS symptoms (Subgroup 2; 6/22, 27.3%), and one patient showed mild signs (Subgroup 3; 1/13, 33.3%), evidencing higher viral prevalence in the subgroup of patients with more severe symptoms; however, the differences among subgroups were not statistically significant (p = 0.22).
In the control group, only 2/20 subjects (10%) resulted in being positive for viral presence, with a mean viral load corresponding to 211.94 copies/106 cells (range 174.80–249.08 copies/106 cells). The differences detected between control and ME/CFS subjects, however, were not statistically significant, likely due to the low number of subjects included in the analysis and to the high variability of virus load in positive subjects.

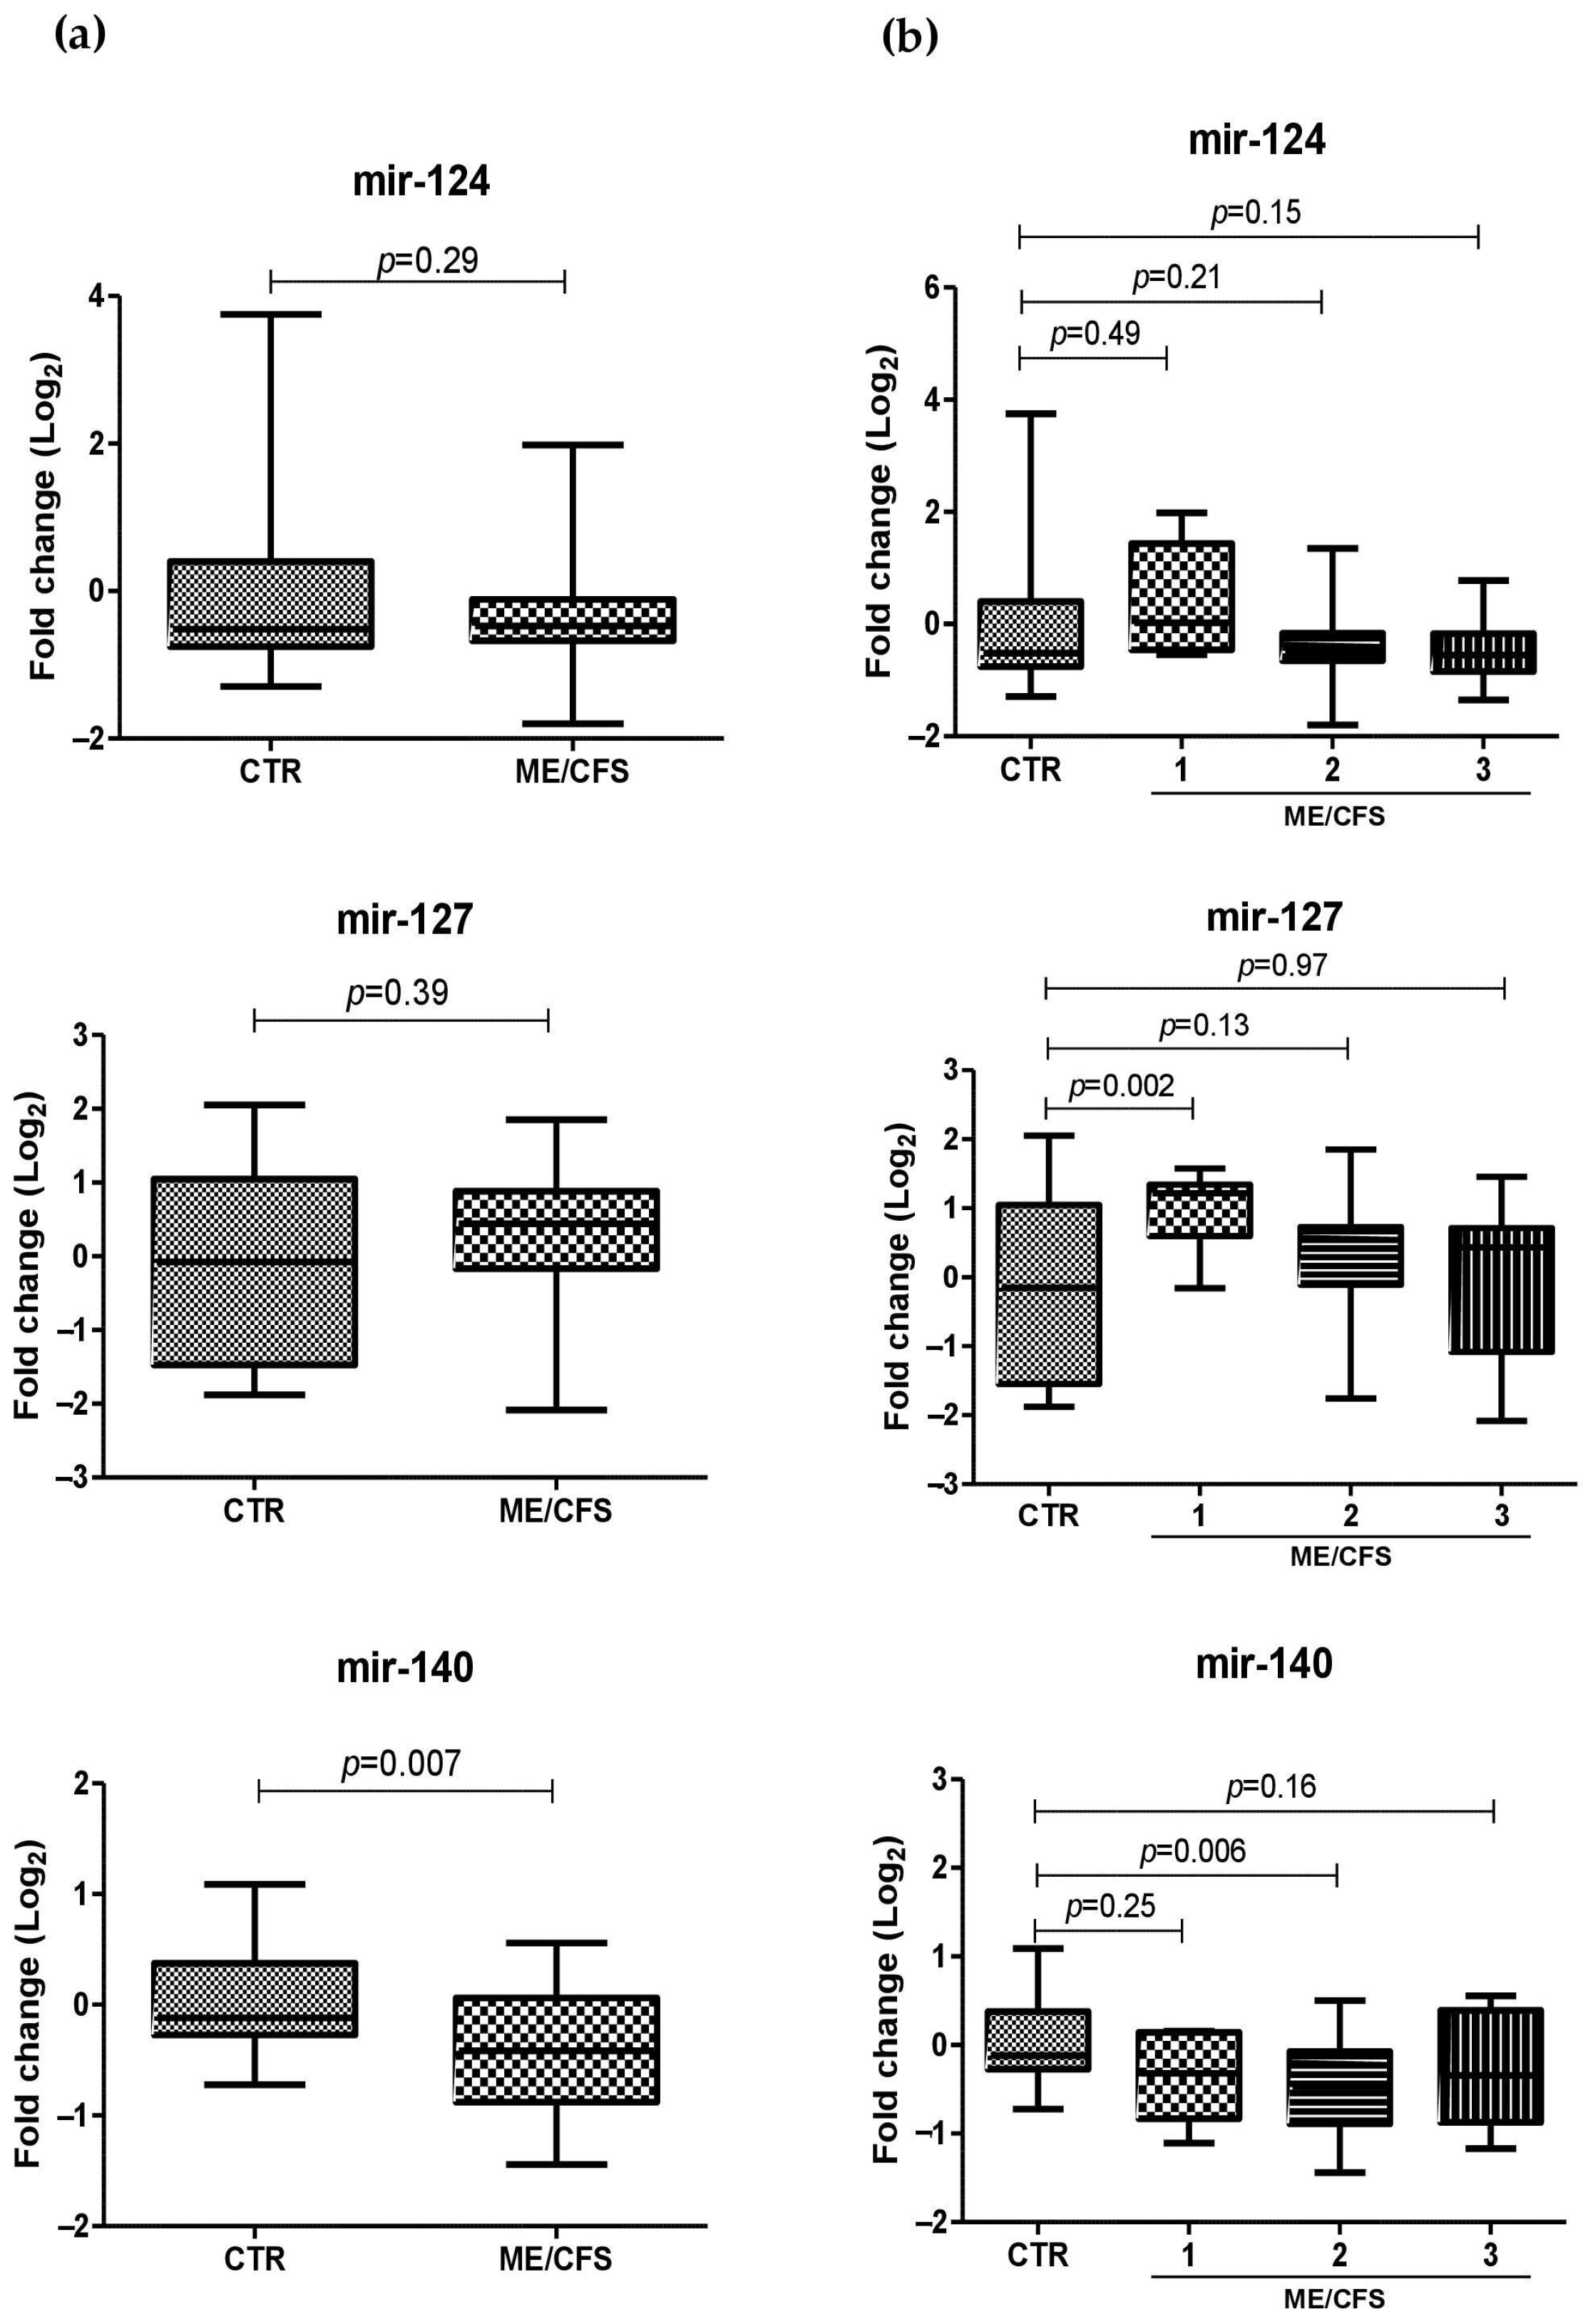
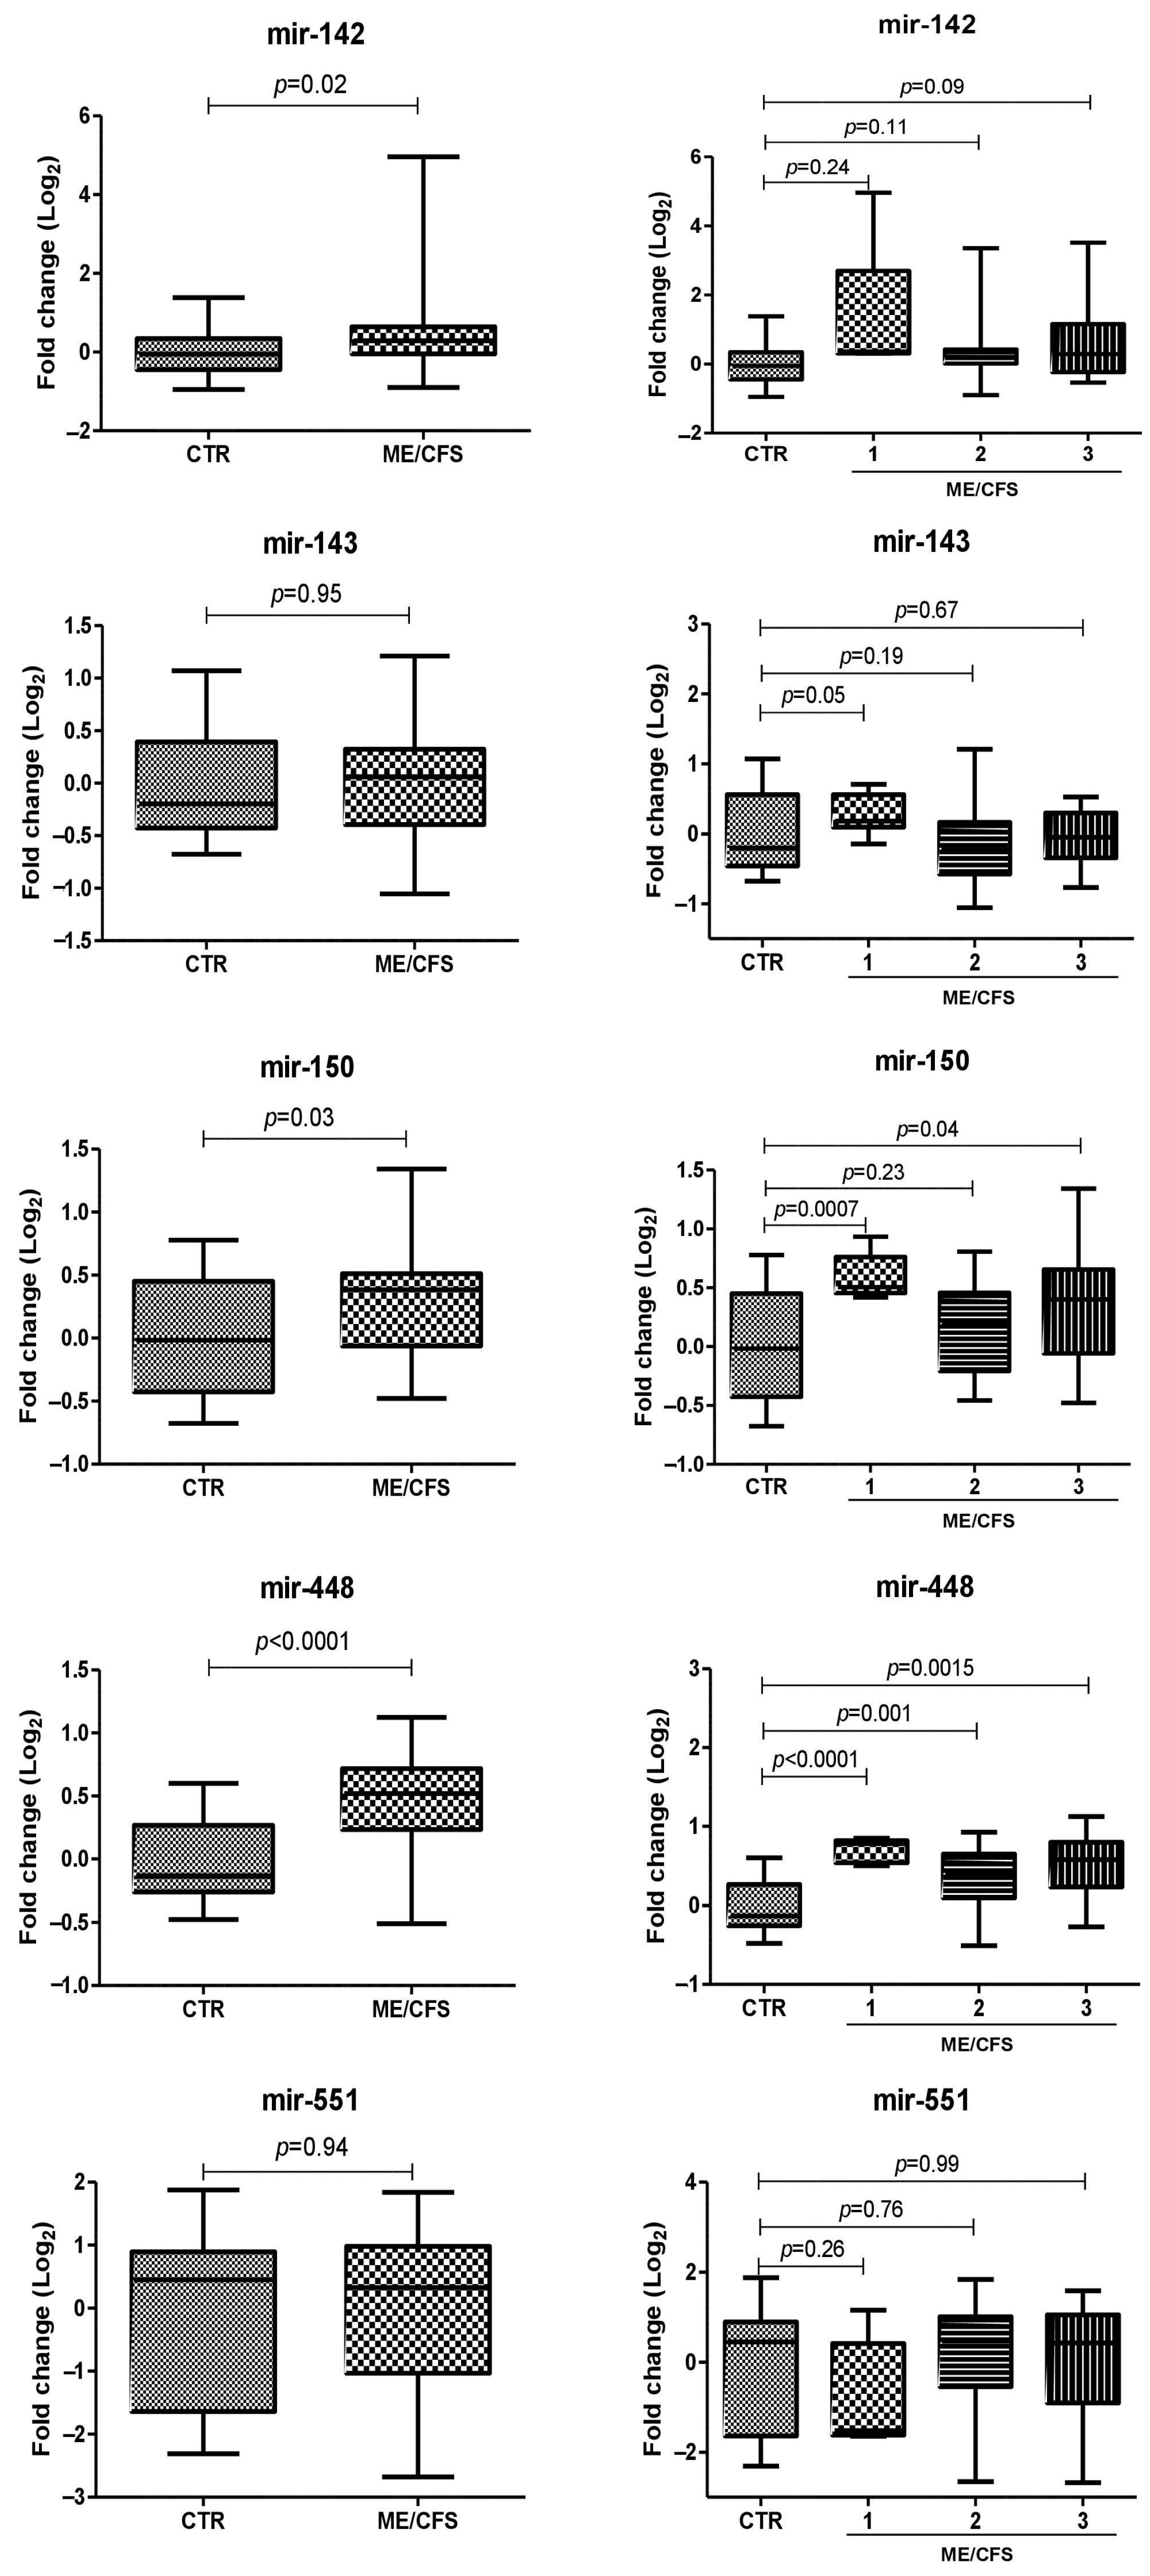
2.4. miRNA Plasma Levels in ME/CFS Patients

The presence and amount of eight miRNAs, selected based on the literature data, were investigated in the plasma samples derived from ME/CFS patients and healthy controls by specific Taqman qPCR assays. The results showed that six miRNAs were differentially expressed in ME/CFS samples compared to the controls (Figure 2a). Among them, in particular, miR-142, miR-150, and miR-448 were increased in ME/CFS plasma specimens compared to the controls (p = 0.02, p = 0.03, and p < 0.0001 respectively), while miR-140 resulted in being significantly downmodulated in the ME/CFS group, as compared to the controls (p = 0.007).
By stratifying ME/CFS patients according to symptoms severity (1, severe; 2, moderate; and 3, mild), very different levels of circulating miRNAs were detected within the three subgroups (Figure 2b). Specifically, miR-124 and miR-142 appeared to be increased in the subgroups with a higher level of disease severity, although differences between the patient groups and control group were not statistically significant. Similarly, the downmodulation of miR-140 correlated with the severity of symptoms, although the decrease resulted in being significant only for the ME/CFS Subgroup 2 compared to the controls (p = 0.006). Overall, increased levels of plasmatic miRNAs in the ME/CFS group were more evident by stratifying patients according to severity, showing a positive correlation between abundance of miRNAs and more severe symptoms. This was evident for miR-448, which was overexpressed in all symptoms’ subgroups, as compared to healthy controls, with increasing values correlating with ME/CFS severity, (p < 0.0001, p = 0.001, and p = 0.0015, for Subgroups 1, 2, and 3, respectively). Statistically significant increases were also detected for miR-127 (p = 0.0019), miR-143 (p = 0.5), and mir-150 (p = 0.0007) in ME/CFS Subgroup 1 when compared to the controls.

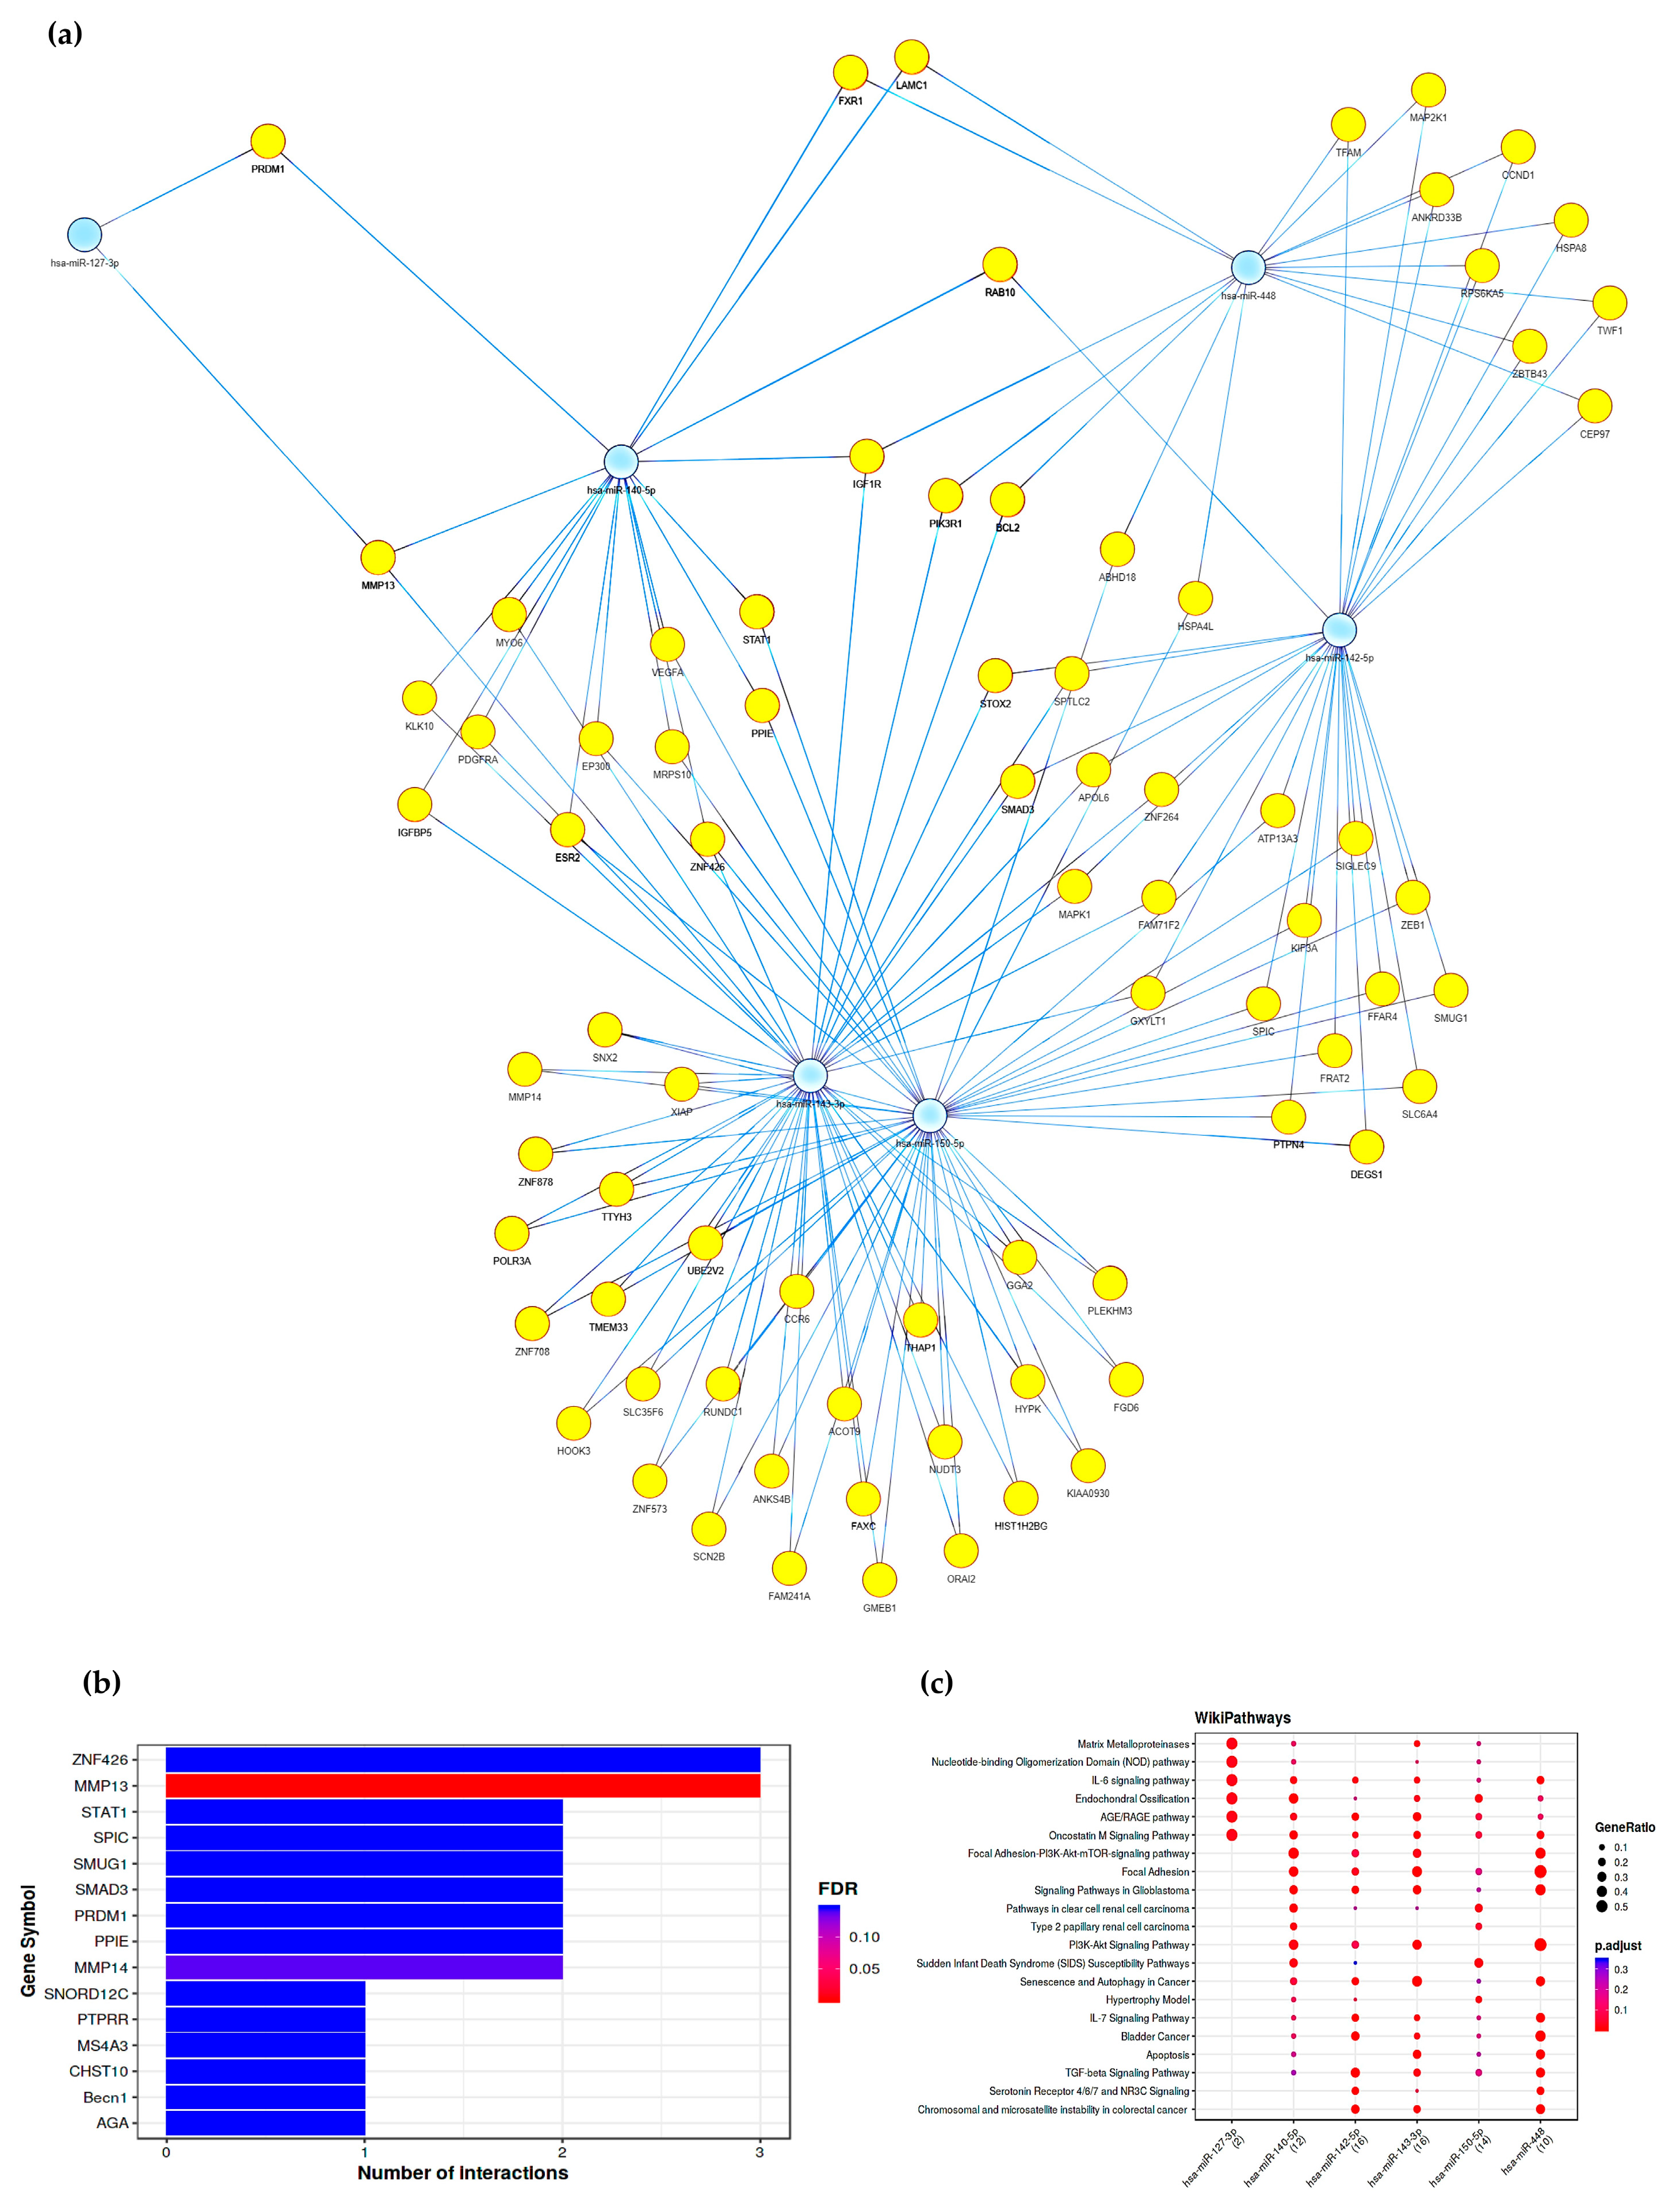
2.5. Gene Pathways Analysis

To investigate the possible pathways affected by the miRNAs resulting from dysregulation in the ME/CFS patients, gene pathways and network analyses were performed by using the MIENTURNET web tool [42]. Potential genes regulated by altered miRNAs were computationally predicted based on the miRTarBase reference database. The network of experimentally validated miRNA–target interactions identified by the enrichment analysis was built while considering both strong and weak experimental methods (Figure 3a).
Most predicted interactions involved genes encoding the Zinc Finger Protein 426 (ZNF426), Matrix Metallopeptidase 13 and 14 (MMP13 and MMP14), Signal Transducer and Activator of Transcription 1 (STAT1), Gene-Spi-C Transcription Factor (SPIC), Single-Strand-Selective Monofunctional Uracil-DNA Glycosylase 1 (SMUG1), SMAD Family Member 3 (SMAD3), PR/SET Domain 1 (PRDM1), and Peptidylprolyl Isomerase E (PPIE).
Functional enrichment analysis, performed by considering WikiPathways database to evidence eventual specific ME/CFS-associated genes (Figure 3c), showed that pathways regulated by altered miRNAs were involved in extracellular matrix remodeling (matrix metalloproteinases and Focal Adhesion), cytokines-mediated signaling pathway (IL-6, Oncostatin M, IL-7, and TGF-β), apoptosis, cell-cycle regulation via the P13K-m-TOR signaling pathway, immune response to microbial infection (NOD pathway), and senescence and autophagy in pathologic conditions.
No direct positive correlation was detected by the Spearman analysis between any of the analyzed miRNAs, inflammatory cytokines, and patients’ HHV-6A/B positivity, while some inverse correlations were observed between miR-448 and all assayed cytokines, except for IL-17A and TNFα (r range = −0.259/−0.438; p < 0.05) (Supplementary Table S1).

3. Discussion

Currently, the only available diagnostic methods for ME/CFS are clinical, based on symptom-related criteria, which also leads to undiagnosed or misclassified cases due to symptom heterogeneity. Thus, specific biomarkers to be used for ME/CFS diagnosis are urgently needed.
Recently, different expressions of circulating miRNAs have been reported in ME/CFS patients compared to healthy subjects, suggesting their use as a signature to discriminate ME/CFS disease. In parallel, HHV-6A/B infection was suggested to be a trigger of ME/CFS onset and/or progression, and in vitro infection by such viruses was reportedly shown to induce alterations of miRNA expression in infected cells, possibly correlated with inflammation, cell apoptosis, and fibrosis [12,13,14,15,16,17,38,39,40,43].
Thus, this study aimed to assess, for the first time in the Latvian population, the diagnostic value of miRNA signatures in distinguishing patients with ME/CFS from healthy controls. Meanwhile, the status of patients with regard to HHV-6A/B positivity and concentration of plasma proinflammatory cytokines was analyzed in order to evidence any eventual correlation with miRNA deregulation.
The expression levels of eight miRNAs, selected based on the literature data [24,25,26], were quantified by specific RT-qPCR in plasma samples derived from 40 subjects with ME/CFS diagnosis and 20 healthy controls. The results evidenced significant upregulation of miR-142-5p, miR-150-5p, and miR-448 in ME/CFS group, compared to the controls, confirming previously reported data [24,25,26]. Moreover, the increases were more evident and statistically significant in the subgroups of ME/CFS patients showing more severe symptoms (Subgroups 1 and 2), evidencing a direct correlation between miRNA amount and symptoms severity. In addition, two more miRNAs were significantly upregulated in severe ME/CFS patients as compared to the controls: miR-127-3p and miR-143-3p, suggesting that those miRNAs may be used as markers for severe disease. In our study, miR-140-5p was the only miRNA significantly downmodulated in ME/CFS subjects compared to healthy individuals (p = 0.07).
Our results are in line with those reported in other ME/CFS patients’ cohorts. Nineteen miRNAs were reported to be differentially expressed at the plasma level in ME/CFS patients compared to non-fatigued controls, and significant upregulations of miR-127-3p, miR-142-5p, and miR-143-3p were detected [24]. More recently, the plasma levels of miR-127-3p, miR-140-5p, and miR-150-5p were found to be increased in ME/CFS patients compared to the controls after post-exertional stress challenge, suggesting miR-127 and miR-140 as biomarkers to discriminate between patients suffering from ME/CFS and fibromyalgia [25,29]. In addition, PBMCs of ME/CFS patients were shown to harbor increased levels of miR-140-5p [23] and miR-150-5p in response to exercise [27].
From a mechanistical point of view, miR-127-3p expression has been shown to inhibit the expression of IL-10 via regulation of the B-Cell Lymphoma 6 Protein (BCL6) gene [30]. IL-10, an important anti-inflammatory cytokine that suppresses Th1-related responses, has been consistently observed to be significantly reduced in the cerebrospinal fluid of ME/CFS patients in comparison to the controls [44]. In addition, miR-127 upregulation has been reported to inhibit cell proliferation and induce apoptosis [31,45].
Among the miRNAs found to be upregulated in ME/CFS patients, miR-142-5p has been reported as being overexpressed in most diseases linked to immunological disorders [46], and miR-143-3p has been identified as a neutrophil-specific miRNA [47] that is upregulated during increased erythropoiesis in polycythemia [48]. Of note, both miR-142-5p and miR-143-3p have been proved to interact with TGF-β1 through various mechanisms and modulate fibrotic processes [33,34,49].
The upregulation observed in our cohort of ME/CFS patients is in line with what was previously reported, showing that the overexpression of miR-150-5p in ME/CFS correlates with higher post-exertional malaise scores and symptom severity of patients [25,29]. This lymphopoietic-specific miRNA regulates many genes involved in the differentiation and proliferation of immune cells [35,50], and its pivotal role in autoimmune disease such as autoimmune pancreatitis, systemic SLE, primary Sjögren’s syndrome, and multiple sclerosis has been pointed out [51,52,53].
Similarly, plasmatic miR-448 has been already suggested as a valuable biomarker for distinguishing patients affected by autoimmune diseases, including RA, SLE, SS, ulcerative colitis, and MS, from healthy controls [26,54]. Based on our knowledge, our results evidence, for the first time, the potential diagnostic value of miR-448 also in ME/CFS.
Mixed results were instead obtained regarding miR-140-5p, whose expression was found to be increased in some ME/CFS cohorts [25,29] and decreased in our group of patients. This miRNA regulates different pathways, including cell proliferation, apoptosis, and inflammatory cascades [32]; it is implicated in immune-related disorders, through TLR4/NF-κB signaling modulation, and has been found to be downregulated in several neoplastic diseases [32].
To have a comprehensive view of the pathways regulated by the miRNAs that were found to be altered in our ME/CFS cohort, we performed gene pathways and functional enriched analyses. One of the principal target genes for number of interactions was ZNF426, encoding a zinc finger transcriptional repressor that modulates the reactivation of Kaposi’s sarcoma-associated herpesvirus (HHV-8) [55], suggesting a potential role of this target also in other human herpesviruses. Other identified target genes included MMP13 and MMP14 of the metalloproteinase family, involved in tissue remodeling and cartilage degradation, which are activated in non-pathological post-exercise conditions but can be associated with pathologic processes, including tumor invasion and arthritis [56,57,58,59]. Further predicted genes included STAT1, a gene coding cytokine-induced factors, including interferons (IFNs), EGF, PDGF, and IL-6 [60,61]. STAT1 protein has a crucial role in regulating immune responses to viral, fungal, and mycobacterial pathogens, and its mutation has been associated with pathological immunodeficiency [62]. In addition, STAT1 has been recognized to be involved in chronic fatigue and immune deficiency syndrome (CFIDS) and can mediate mitochondrial dysfunction by ROS and disruption of ATP production [63]. Another recognized target gene was SPIC, which controls the development of red pulp macrophages, which are essential for iron homeostasis and the recycling of red blood cells (RBCs) [64]. The alteration of this pathway could have a role in the phenotypic alteration and decrease of deformability affecting RBCs of ME/CFS patients, as compared to healthy individuals [65]. Last, other genes potentially affected by investigated miRNAs are involved in the regulation of innate and adaptive immune tissue-resident lymphocyte T cells via the β-IFN pathway (PRDM1 gene), modulation of the TGF-β signaling pathway (SMAD3 gene), DNA repair mechanisms (SMUG1 gene), and protein folding (PPIE gene) [66,67,68,69].
By contrast, the analysis of the inflammatory status of our ME/CFS cohort, by quantifying the plasmatic levels of seven cytokines, did not reveal specific signatures associated with ME/CFS or correlated with disease severity. Rather, we found out that IL-2, IL-21, IL-6, IL-17A, and TNF-α were significantly decreased in patients compared to controls. Although these cytokines have a significant proinflammatory role, contradictory data have been published regarding their role in ME/CFS. In fact, by analyzing whether a signature of 51 serum cytokines could be associated with ME/CFS and correlated with disease severity, only TGF-β and resistin appeared to be significantly altered in patients compared to controls [19]. Notably, despite the fact that resistin is known to have a significant proinflammatory role [70], it was decreased in ME/CFS subjects. With regard to IL-2, some studies reported increased levels in CFS patients compared to controls, whereas, in others, decreased IL-2 levels or no difference was reported between patients and control groups [71]. In a similar way, decreased IL-6 levels were reported in mild/moderate ME/CFS patients compared with both healthy controls and severe ME/CFS patients [72].
The observed results may be due to the use of nonsteroidal anti-inflammatory drugs and benzodiazepines in ME/CFS patients that could lower the concentration of inflammatory cytokines in comparison to the healthy controls, as also reported in the scientific literature regarding these medications [73]. Thus, taking into account that, in our study, cytokine levels were measured only in 40 patients, it is not possible to draw general conclusions about cytokine signatures related to disease severity in ME/CFS. Similarly, no significant direct correlation was observed between altered miRNAs and inflammatory cytokines, while a weak inverse correlation was found between miR-448 and most of the tested cytokines (IFN-γ, IL-2, IL-21, IL-23, and IL-6). However, this aspect may deserve further investigation and validation in a larger cohort of patients.
The literature data support the role of HHV-6A/B as a potential trigger of ME/CFS, highlighting the association between HHV-6A/B infection and ME/CFS development [9,22]. In our study cohort, the percentage of HHV-6A/B positive subjects was doubled in the ME/CFS group compared to the controls (22.5% vs. 10%), and the viral load in the PBMCs of ME/CFS patients was remarkably higher than in the controls (mean of 44,871.00 copies/106 cells vs. 211.9 copies/106 cells); however, the differences were not statistically significant, likely due to the low number of subjects included. In this regard, given that these results may be clues of HHV-6A/B’s involvement in the disease, enlarging the cohort of patients and controls will be important to confirm, in a statistically significant way, HHV-6A/B as one of the potential biomarkers for ME/CFS diagnosis.
Limitations of this study included the low number of enrolled subjects and the differences in mean age between patients and the control group, which should be acknowledged and taken into account. Future studies should thus expand the number of individuals and find adequate control cohorts (with matched age and gender) to confirm the role of ME/CFS-associated miRNAs as potential diagnostic biomarkers in order to further investigate their possible correlation with inflammatory status and viral infection in ME/CFS patients and deepen our understanding of the mechanisms by which they may induce viral and host gene regulation during the disease onset and progression.

4. Materials and Methods

4.1. Study Population

A total of 60 subjects were recruited at the Rīga Stradiņš University outpatient clinic. The ME/CFS group included 40 patients with ME/CFS clinical diagnosis based on the Fukuda criteria [2], and based on adapted semi-structured interview questions created by Minnock et al. [41], patients were stratified into three subgroups according to disease severity: 1, severe; 2, moderate; 3, mild. The control group included 20 subjects with no medical history or symptoms of chronic fatigue syndrome. ME/CFS and control groups were matched in terms of sex distribution; however, due to a lack of healthy individuals involved in this study, age equality was not achieved. The study was conducted in accordance with the Declaration of Helsinki and obtained approval by the Ethical Committee of Rīga Stradiņš University (Ethical code Nr.6-1/05/33 and date of approval 30 April 2020). Prior to recruitment, informed consent was obtained from all subjects involved in the study.

4.2. Samples Collection

Ten milliliters of peripheral blood was collected from each participant in EDTA-treated tubes and immediately transported to the laboratory for processing. PBMCs were isolated by Ficoll-Hypaque gradient, as previously reported [74]. PBMCs (5 × 10⁵ aliquots) in Trizol and plasma fractions were frozen and stored at −80 °C until the analysis.

4.3. Cytokines Evaluation

Detection of IL-2, IL-17, IL-6, IL-21, IL-23, TNF-α, and IFN-γ levels in plasma samples of 39 ME/CFS patients and 20 healthy controls was carried out with Luminex 200 Instrument System, using a commercially available kit (MILLIPLEX MAP Human High Sensitivity T Cell Panel—Immunology Multiplex Assay), according to the manufacturer’s protocol.

4.4. DNA Extraction and Analyses of HHV-6A/B Presence

DNA was isolated from PBMC samples via the phenol–chloroform extraction method; DNA quality and concentration were evaluated by spectrophotometric reading, using Nanodrop instrument (ThermoFisher Scientific, Waltham, MA, USA, NanoDrop 1000); and β-globin PCR was also performed to determine DNA quality, as previously described [75]. HHV-6 Real-TM Quant amplification test (Sacace Biotechnologies; Como, Italy) was used for quantitative detection of HHV-6A/B in DNA of PBMCs. DNA was amplified using real-time amplification with fluorescent reporter dye probes specific for pol-gene of HHV-6A/B and internal control.

4.5. RNA Extraction and miRNA Analysis

Plasma samples were thawed on ice and additionally centrifuged for 10 min at 15,000× g at 4 °C to remove residual cellular debris. Total RNA, including miRNA fraction, was extracted from plasma samples, using the MagMax mirVana Total RNA isolation kit (ThermoFisher Scientific, Waltham, MA, USA), based on magnetic-bead technology, following the manufacturer’s instructions. Synthetic ath-miR-159a (ThermoFisher Scientific, Waltham, MA, USA) was combined with plasma samples during the lysis step as spike-in control to monitor the extraction efficiency. After reverse transcription by the TaqMan advanced miRNA cDNA synthesis kit (ThermoFisher Scientific, Waltham, MA, USA), cDNA templates were analyzed by the TaqMan Advanced miRNA assays (ThermoFisher Scientific, Waltham, MA, USA). Individual target miRNAs included hsa-miR-448, hsa-miR-124-3p, hsa-miR-551b-3p, hsa-miR-127-3p, hsa-miR-142-5p, hsa-miR-143-3p, hsa-miR-140-5p, and hsa-miR-150-5p. In addition, two endogenous controls (hsa-miR-361-5p and hsa-miR-186-5p) and an exogenous control (spike-in ath-miR-159a) were tested. All real-time qPCR reactions were performed using the QuantStudio5 instrument (Applied Biosystem, Waltham, MA, USA).
The expression levels of selected miRNAs were quantified by using the ∆∆Ct method. Briefly, ∆Ct values were obtained for each sample, subtracting the Ct value of each miRNA from that of the exogenous control, ath-miR-159a. Secondly, ∆∆Ct values were calculated for every sample, as the difference between the normalized ∆Ct value and the average ∆Ct values of controls. Lastly, relative miRNA expression values were calculated and expressed as 2−∆∆Ct. To avoid heavily skewed data, Log-transformed 2−∆∆Ct values were used for statistical analysis.

4.6. Gene Pathways and Functional Enriched Analysis

The potential target genes of altered miRNAs were identified by using the MIENTURNET web tool, based on experimentally validated miRNA-target interactions collected in the miRTarBase reference database [42]. For each gene in the chosen database (TargetScan or miRTarBase), the hypergeometric test was used to calculate the significance (p-value < 0.05). The network of miRNA–target interactions identified by the enrichment analysis was built considering both strong and weak experimental methods. The thresholds for the minimum number of miRNA–target interactions and for the adjusted p-values, obtained by using the Benjamini-Hochberg (False Discovery Rate, FDR) procedure for multiple testing, were set as 2 and 1, respectively (default settings). A functional enrichment analysis of target genes of selected miRNAs was performed while considering the following annotation databases: KEGG, REACTOME, WikiPathways, Disease Ontology. The results obtained from WikiPathways are shown.

4.7. Statistical Analysis

Statistical analysis and graphical representations were performed using GraphPad Prism 5.03 software (GraphPad Software, San Diego, CA, USA). Unpaired Student’s t-test was used to compare miRNAs’ relative expression values between the control group and ME/CFS patients’ group. One-way ANOVA, followed by Bonferroni’s multiple comparisons test and Spearman Correlation analysis, was applied to investigate the correlation between presence/number of miRNAs and patients’ variables (disease severity and levels of inflammatory cytokines). Values of p ≤ 0.05 were considered statistically significant. The statistical power of the study was evaluated during the study design by using G*Power 3.1 free software (Heinrich Heine University Düsseldorf, Düsseldorf, Germany, HHU), error probability α =0.05, and power level pβ = 0.8.

5. Conclusions

ME/CFS disease has a yet unclarified etiology and suffers from the lack of distinctive diagnostic biomarkers. Our findings show that specific circulating miRNAs (miR-127-3p, miR-140-5p, miR-142-5p, miR-143-3p, miR-150-5p, and miR-448), are differentially expressed in the plasma of ME/CFS patients compared to healthy controls, correlating with disease severity. Of note, these miRNAs are involved in immune and inflammatory response pathways, suggesting their role in ME/CFS pathogenesis and their possible use as useful blood markers to help identify ME/CFS patients. In addition, the collected data suggest a possible involvement of HHV-6A/B infection as a potential environmental ME/CFS trigger, though the differences between ME/CFS patients and controls did not result in being statistically significant.

Supplementary Materials

The following supporting information can be downloaded at https://www.mdpi.com/article/10.3390/ijms241310582/s1.

Author Contributions

Conceptualization, E.C.; methodology, I.S. and S.G.; software, S.G.; formal analysis, I.S.; investigation, I.S., S.G. and A.V.; resources, M.M., Z.N.-K. and A.K.; data curation, I.S., S.G., M.D., F.B., E.M. and S.R.-D.; writing—original draft preparation, I.S. and S.G.; writing—review and editing, E.C., M.M., S.R.-D., A.V. and Z.N.-K.; supervision, E.C. and M.M.; project administration, M.M. All authors have read and agreed to the published version of the manuscript.

Funding

This research was funded in part by EU H2020 project VirA, No.952376; and by the Latvian Science Council’s Fundamental and Applied Research project, No. LZP-2019/1-0380.

Institutional Review Board Statement

The study was conducted in accordance with the Declaration of Helsinki and approved by the Ethical Committee of Rīga Stradiņš University (Ethical code Nr.6-1/05/33 and date of approval 30 April 2020).

Informed Consent Statement

Informed consent was obtained from all subjects involved in the study. Written informed consent was obtained from the patients to publish this paper.

Data Availability Statement

All data generated by the study are included in the manuscript or in its Supplementary Materials.

Conflicts of Interest

The authors declare no conflict of interest.

References

  1. Estévez-López, F.; Mudie, K.; Wang-Steverding, X.; Bakken, I.J.; Ivanovs, A.; Castro-Marrero, J.; Nacul, L.; Alegre, J.; Zalewski, P.; Słomko, J.; et al. Systematic Review of the Epidemiological Burden of Myalgic Encephalomyelitis/Chronic Fatigue Syndrome Across Europe: Current Evidence and EUROMENE Research Recommendations for Epidemiology. J. Clin. Med. 2020, 9, 1557. [Google Scholar] [CrossRef]
  2. Fukuda, K.; Straus, S.E.; Hickie, I.; Sharpe, M.C.; Dobbins, J.G.; Komaroff, A. The Chronic Fatigue Syndrome: A Comprehensive Approach to Its Definition and Study. International Chronic Fatigue Syndrome Study Group. Ann. Intern. Med. 1994, 121, 953–959. [Google Scholar] [CrossRef] [PubMed]
  3. Carruthers, B.M.; Jain, A.K.; De Meirleir, K.L.; Peterson, D.L.; Klimas, N.G.; Lemer, A.M.; Bested, A.C.; Flor-Henry, P.; Joshi, P.; Powles, A.C.P.; et al. Myalgic Encephalomyelitis/Chronic Fatigue Syndrome. J. Chronic Fatigue Syndr. 2011, 11, 7–115. [Google Scholar] [CrossRef]
  4. A Copy of the ‘London Criteria for M.E.’ as Revised in 2014|Archived Here for Reference Purposes|15 October 2016|The ME Association. Available online: https://meassociation.org.uk/2016/10/a-copy-of-the-london-criteria-as-revised-in-2014-archived-here-for-reference-purposes-15-october-2016/ (accessed on 20 January 2023).
  5. Carruthers, B.M.; Van de Sande, M.I.; De Meirleir, K.L.; Klimas, N.G.; Broderick, G.; Mitchell, T.; Staines, D.; Powles, A.C.P.; Speight, N.; Vallings, R.; et al. Myalgic Encephalomyelitis: International Consensus Criteria. J. Intern. Med. 2011, 270, 327–338. [Google Scholar] [CrossRef] [Green Version]
  6. Sunnquist, M.; Jason, L.A.; Nehrke, P.; Goudsmit, E.M. A Comparison of Case Definitions for Myalgic Encephalomyelitis and Chronic Fatigue Syndrome. J. Chronic Dis. Manag. 2017, 2, 1013. [Google Scholar] [PubMed]
  7. Ariza, M.E.; Sciortino, T.; Williams, M. Myalgic Encephalomyelitis/Chronic Fatigue Syndrome: The Human Herpesviruses Are Back! Biomolecules 2021, 11, 185. [Google Scholar] [CrossRef]
  8. Sotzny, F.; Blanco, J.; Capelli, E.; Castro-Marrero, J.; Steiner, S.; Murovska, M.; Scheibenbogen, C. Myalgic Encephalomyelitis/Chronic Fatigue Syndrome—Evidence for an Autoimmune Disease. Autoimmun. Rev. 2018, 17, 601–609. [Google Scholar] [CrossRef]
  9. Rasa, S.; Nora-Krukle, Z.; Henning, N.; Eliassen, E.; Shikova, E.; Harrer, T.; Scheibenbogen, C.; Murovska, M.; Prusty, B.K. Chronic Viral Infections in Myalgic Encephalomyelitis/Chronic Fatigue Syndrome (ME/CFS). J. Transl. Med. 2018, 16, 268. [Google Scholar] [CrossRef] [PubMed] [Green Version]
  10. Hickie, I.; Davenport, T.; Wakefield, D.; Vollmer-Conna, U.; Cameron, B.; Vernon, S.D.; Reeves, W.C.; Lloyd, A. Post-Infective and Chronic Fatigue Syndromes Precipitated by Viral and Non-Viral Pathogens: Prospective Cohort Study. BMJ 2006, 333, 575. [Google Scholar] [CrossRef] [Green Version]
  11. Chu, L.; Valencia, I.J.; Garvert, D.W.; Montoya, J.G. Onset Patterns and Course of Myalgic Encephalomyelitis/Chronic Fatigue Syndrome. Front. Pediatr. 2019, 7, 12. [Google Scholar] [CrossRef]
  12. Chapenko, S.; Krumina, A.; Logina, I.; Rasa, S.; Chistjakovs, M.; Sultanova, A.; Viksna, L.; Murovska, M. Association of Active Human Herpesvirus-6, -7 and Parvovirus B19 Infection with Clinical Outcomes in Patients with Myalgic Encephalomyelitis/Chronic Fatigue Syndrome. Adv. Virol. 2012, 2012, 205085. [Google Scholar] [CrossRef] [PubMed] [Green Version]
  13. Rasa-Dzelzkaleja, S.; Krumina, A.; Capenko, S.; Nora-Krukle, Z.; Gravelsina, S.; Vilmane, A.; Ievina, L.; Shoenfeld, Y.; Murovska, M. The Persistent Viral Infections in the Development and Severity of Myalgic Encephalomyelitis/Chronic Fatigue Syndrome. J. Transl. Med. 2023, 21, 33. [Google Scholar] [CrossRef]
  14. Lee, J.S.; Lacerda, E.M.; Nacul, L.; Kingdon, C.C.; Norris, J.; O’Boyle, S.; Roberts, C.H.; Palla, L.; Riley, E.M.; Cliff, J.M. Salivary DNA Loads for Human Herpesviruses 6 and 7 Are Correlated With Disease Phenotype in Myalgic Encephalomyelitis/Chronic Fatigue Syndrome. Front. Med. 2021, 8, 656692. [Google Scholar] [CrossRef] [PubMed]
  15. Kasimir, F.; Toomey, D.; Liu, Z.; Kaiping, A.C.; Ariza, M.E.; Prusty, B.K. Tissue Specific Signature of HHV-6 Infection in ME/CFS. Front. Mol. Biosci. 2022, 9, 1044964. [Google Scholar] [CrossRef]
  16. Schreiner, P.; Harrer, T.; Scheibenbogen, C.; Lamer, S.; Schlosser, A.; Naviaux, R.K.; Prusty, B.K. Human Herpesvirus-6 Reactivation, Mitochondrial Fragmentation, and the Coordination of Antiviral and Metabolic Phenotypes in Myalgic Encephalomyelitis/Chronic Fatigue Syndrome. ImmunoHorizons 2020, 4, 201–215. [Google Scholar] [CrossRef] [Green Version]
  17. Cox, B.S.; Alharshawi, K.; Mena-Palomo, I.; Lafuse, W.P.; Ariza, M.E. EBV/HHV-6A DUTPases Contribute to Myalgic Encephalomyelitis/Chronic Fatigue Syndrome Pathophysiology by Enhancing TFH Cell Differentiation and Extrafollicular Activities. JCI Insight 2022, 7, e158193. [Google Scholar] [CrossRef]
  18. Kennedy, G.; Spence, V.A.; McLaren, M.; Hill, A.; Underwood, C.; Belch, J.J.F. Oxidative Stress Levels Are Raised in Chronic Fatigue Syndrome and Are Associated with Clinical Symptoms. Free Radic. Biol. Med. 2005, 39, 584–589. [Google Scholar] [CrossRef]
  19. Montoya, J.G.; Holmes, T.H.; Anderson, J.N.; Maecker, H.T.; Rosenberg-Hasson, Y.; Valencia, I.J.; Chu, L.; Younger, J.W.; Tato, C.M.; Davis, M.M. Cytokine Signature Associated with Disease Severity in Chronic Fatigue Syndrome Patients. Proc. Natl. Acad. Sci. USA 2017, 114, E7150–E7158. [Google Scholar] [CrossRef] [PubMed] [Green Version]
  20. Roerink, M.E.; van der Schaaf, M.E.; Hawinkels, L.J.A.C.; Raijmakers, R.P.H.; Knoop, H.; Joosten, L.A.B.; van der Meer, J.W.M. Pitfalls in Cytokine Measurements—Plasma TGF-Β1 in Chronic Fatigue Syndrome. Neth. J. Med. 2018, 76, 310–313. [Google Scholar]
  21. Scherbakov, N.; Szklarski, M.; Hartwig, J.; Sotzny, F.; Lorenz, S.; Meyer, A.; Grabowski, P.; Doehner, W.; Scheibenbogen, C. Peripheral Endothelial Dysfunction in Myalgic Encephalomyelitis/Chronic Fatigue Syndrome. ESC Heart Fail. 2020, 7, 1064–1071. [Google Scholar] [CrossRef] [Green Version]
  22. Gravelsina, S.; Vilmane, A.; Svirskis, S.; Rasa-Dzelzkaleja, S.; Nora-Krukle, Z.; Vecvagare, K.; Krumina, A.; Leineman, I.; Shoenfeld, Y.; Murovska, M. Biomarkers in the Diagnostic Algorithm of Myalgic Encephalomyelitis/Chronic Fatigue Syndrome. Front. Immunol. 2022, 13, 5980. [Google Scholar] [CrossRef]
  23. Almenar-Pérez, E.; Sarría, L.; Nathanson, L.; Oltra, E. Assessing Diagnostic Value of MicroRNAs from Peripheral Blood Mononuclear Cells and Extracellular Vesicles in Myalgic Encephalomyelitis/Chronic Fatigue Syndrome. Sci. Rep. 2020, 10, 2064. [Google Scholar] [CrossRef] [Green Version]
  24. Brenu, E.W.; Ashton, K.J.; Batovska, J.; Staines, D.R.; Marshall-Gradisnik, S.M. High-Throughput Sequencing of Plasma MicroRNA in Chronic Fatigue Syndrome/Myalgic Encephalomyelitis. PLoS ONE 2014, 9, e102783. [Google Scholar] [CrossRef] [PubMed] [Green Version]
  25. Nepotchatykh, E.; Elremaly, W.; Caraus, I.; Godbout, C.; Leveau, C.; Chalder, L.; Beaudin, C.; Kanamaru, E.; Kosovskaia, R.; Lauzon, S.; et al. Profile of Circulating MicroRNAs in Myalgic Encephalomyelitis and Their Relation to Symptom Severity, and Disease Pathophysiology. Sci. Rep. 2020, 10, 19620. [Google Scholar] [CrossRef]
  26. Jin, F.; Hu, H.; Xu, M.; Zhan, S.; Wang, Y.; Zhang, H.; Chen, X. Serum MicroRNA Profiles Serve as Novel Biomarkers for Autoimmune Diseases. Front. Immunol. 2018, 9, 2381. [Google Scholar] [CrossRef] [Green Version]
  27. Cheema, A.K.; Sarria, L.; Bekheit, M.; Collado, F.; Almenar-Pérez, E.; Martín-Martínez, E.; Alegre, J.; Castro-Marrero, J.; Fletcher, M.A.; Klimas, N.G.; et al. Unravelling Myalgic Encephalomyelitis/Chronic Fatigue Syndrome (ME/CFS): Gender-Specific Changes in the MicroRNA Expression Profiling in ME/CFS. J. Cell. Mol. Med. 2020, 24, 5865–5877. [Google Scholar] [CrossRef] [PubMed] [Green Version]
  28. Ponomarev, E.D.; Veremeyko, T.; Barteneva, N.; Krichevsky, A.M.; Weiner, H.L. MicroRNA-124 Promotes Microglia Quiescence and Suppresses EAE by Deactivating Macrophages via the C/EBP-α-PU.1 Pathway. Nat. Med. 2011, 17, 64–70. [Google Scholar] [CrossRef] [Green Version]
  29. Nepotchatykh, E.; Caraus, I.; Elremaly, W.; Leveau, C.; Elbakry, M.; Godbout, C.; Rostami-Afshari, B.; Petre, D.; Khatami, N.; Franco, A.; et al. Circulating MicroRNA Expression Signatures Accurately Discriminate Myalgic Encephalomyelitis from Fibromyalgia and Comorbid Conditions. Sci. Rep. 2023, 13, 1896. [Google Scholar] [CrossRef] [PubMed]
  30. Saito, Y.; Liang, G.; Egger, G.; Friedman, J.M.; Chuang, J.C.; Coetzee, G.A.; Jones, P.A. Specific Activation of MicroRNA-127 with Downregulation of the Proto-Oncogene BCL6 by Chromatin-Modifying Drugs in Human Cancer Cells. Cancer Cell 2006, 9, 435–443. [Google Scholar] [CrossRef] [Green Version]
  31. Wei, G.; Tan, M.; Wang, C.; Liang, L. Decreased MiR-127 Promotes the Occurrence of Breast Cancer via Increasing the Expression of SPP1. Adv. Clin. Exp. Med. 2023, 32. Epub ahead of print. [Google Scholar] [CrossRef]
  32. Ghafouri-Fard, S.; Bahroudi, Z.; Shoorei, H.; Abak, A.; Ahin, M.; Taheri, M. MicroRNA-140: A MiRNA with Diverse Roles in Human Diseases. Biomed. Pharmacother. 2021, 135, 111256. [Google Scholar] [CrossRef] [PubMed]
  33. Wang, Z.; Fu, M.; Li, Y. MiR-142-5p and MiR-212-5p Cooperatively Inhibit the Proliferation and Collagen Formation of Cardiac Fibroblasts by Regulating c-Myc/TP53INP1. Can. J. Physiol. Pharmacol. 2020, 98, 314–323. [Google Scholar] [CrossRef]
  34. Cheng, W.; Yan, K.; Xie, L.Y.; Chen, F.; Yu, H.C.; Huang, Y.X.; Dang, C.X. MiR-143-3p Controls TGF-Β1-Induced Cell Proliferation and Extracellular Matrix Production in Airway Smooth Muscle via Negative Regulation of the Nuclear Factor of Activated T Cells 1. Mol. Immunol. 2016, 78, 133–139. [Google Scholar] [CrossRef] [PubMed]
  35. Ménoret, A.; Agliano, F.; Karginov, T.A.; Karlinsey, K.S.; Zhou, B.; Vella, A.T. Antigen-Specific Downregulation of MiR-150 in CD4 T Cells Promotes Cell Survival. Front. Immunol. 2023, 14, 1102403. [Google Scholar] [CrossRef]
  36. Liao, Z.B.; Tan, X.L.; Dong, K.S.; Zhang, H.W.; Chen, X.P.; Chu, L.; Zhang, B.X. miRNA-448 Inhibits Cell Growth by Targeting BCL-2 in Hepatocellular Carcinoma. Dig. Liver Dis. 2019, 51, 703–711. [Google Scholar] [CrossRef] [PubMed]
  37. Zhang, Y.; Yan, L.; Han, W. Elevated Level of MiR-551b-5p Is Associated With Inflammation and Disease Progression in Patients With Severe Acute Pancreatitis. Ther. Apher. Dial. 2018, 22, 649–655. [Google Scholar] [CrossRef] [Green Version]
  38. Soffritti, I.; D’Accolti, M.; Ravegnini, G.; Arcangeletti, M.C.; Maccari, C.; De Conto, F.; Calderaro, A.; Caselli, E. Modulation of Micrornome by Human Cytomegalovirus and Human Herpesvirus 6 Infection in Human Dermal Fibroblasts: Possible Significance in the Induction of Fibrosis in Systemic Sclerosis. Cells 2021, 10, 1060. [Google Scholar] [CrossRef] [PubMed]
  39. Rizzo, R.; Soffritti, I.; D’Accolti, M.; Bortolotti, D.; Di Luca, D.; Caselli, E. HHV-6A/6B Infection of NK Cells Modulates the Expression of MiRNAs and Transcription Factors Potentially Associated to Impaired NK Activity. Front. Microbiol. 2017, 8, 2143. [Google Scholar] [CrossRef] [PubMed] [Green Version]
  40. Caselli, E.; D’Accolti, M.; Soffritti, I.; Zatelli, M.C.; Rossi, R.; Degli Uberti, E.; Di Luca, D. HHV-6A in vitro Infection of Thyrocytes and T Cells Alters the Expression of MiRNA Associated to Autoimmune Thyroiditis. Virol. J. 2017, 14, 3. [Google Scholar] [CrossRef] [Green Version]
  41. Minnock, P.; Ringnér, A.; Bresnihan, B.; Veale, D.; FitzGerald, O.; McKee, G. Perceptions of the Cause, Impact and Management of Persistent Fatigue in Patients with Rheumatoid Arthritis Following Tumour Necrosing Factor Inhibition Therapy. Musculoskelet. Care 2017, 15, 23–35. [Google Scholar] [CrossRef]
  42. Licursi, V.; Conte, F.; Fiscon, G.; Paci, P. MIENTURNET: An Interactive Web Tool for MicroRNA-Target Enrichment and Network-Based Analysis. BMC Bioinform. 2019, 20, 545. [Google Scholar] [CrossRef] [PubMed] [Green Version]
  43. Soffritti, I.; D’Accolti, M.; Maccari, C.; Bini, F.; Mazziga, E.; de Conto, F.; Calderaro, A.; Arcangeletti, M.C.; Caselli, E. Human Cytomegalovirus and Human Herpesvirus 6 Coinfection of Dermal Fibroblasts Enhances the Pro-Inflammatory Pathway Predisposing to Fibrosis: The Possible Impact on Systemic Sclerosis. Microorganisms 2022, 10, 1600. [Google Scholar] [CrossRef] [PubMed]
  44. Peterson, D.; Brenu, E.W.; Gottschalk, G.; Ramos, S.; Nguyen, T.; Staines, D.; Marshall-Gradisnik, S. Cytokines in the Cerebrospinal Fluids of Patients with Chronic Fatigue Syndrome/Myalgic Encephalomyelitis. Mediat. Inflamm. 2015, 2015, 929720. [Google Scholar] [CrossRef]
  45. Tian, P.; Tao, L.; Wang, Y.; Han, X. MicroRNA-127 Inhibits the Progression of Melanoma by Downregulating Delta-Like Homologue 1. Biomed. Res. Int. 2020, 2020, 8523465. [Google Scholar] [CrossRef] [Green Version]
  46. Saito, Y.; Suzuki, H.; Tsugawa, H.; Imaeda, H.; Matsuzaki, J.; Hirata, K.; Hosoe, N.; Nakamura, M.; Mukai, M.; Saito, H.; et al. Overexpression of MiR-142-5p and MiR-155 in Gastric Mucosa-Associated Lymphoid Tissue (MALT) Lymphoma Resistant to Helicobacter Pylori Eradication. PLoS ONE 2012, 7, e47396. [Google Scholar] [CrossRef] [PubMed] [Green Version]
  47. Slezak, S.; Jin, P.; Caruccio, L.; Ren, J.; Bennett, M.; Zia, N.; Adams, S.; Wang, E.; Ascensao, J.; Schechter, G.; et al. Gene and MicroRNA Analysis of Neutrophils from Patients with Polycythemia Vera and Essential Thrombocytosis: Down-Regulation of Micro RNA-1 and -133a. J. Transl. Med. 2009, 7, 39. [Google Scholar] [CrossRef] [Green Version]
  48. Allantaz, F.; Cheng, D.T.; Bergauer, T.; Ravindran, P.; Rossier, M.F.; Ebeling, M.; Badi, L.; Reis, B.; Bitter, H.; D’Asaro, M.; et al. Expression Profiling of Human Immune Cell Subsets Identifies MiRNA-MRNA Regulatory Relationships Correlated with Cell Type Specific Expression. PLoS ONE 2012, 7, e29979. [Google Scholar] [CrossRef] [Green Version]
  49. Yu, B.; Yu, M.; Zhang, H.; Xie, D.; Nie, W.; Shi, K. Suppression of MiR-143-3p Contributes to the Anti-Fibrosis Effect of Atorvastatin on Myocardial Tissues via the Modulation of Smad2 Activity. Exp. Mol. Pathol. 2020, 112, 104346. [Google Scholar] [CrossRef]
  50. Xia, S.; Huang, J.; Yan, L.; Han, J.; Zhang, W.; Shao, H.; Shen, H.; Wang, J.; Wang, J.; Tao, C.; et al. MiR-150 Promotes Progressive T Cell Differentiation via Inhibiting FOXP1 and RC3H1. Hum. Immunol. 2022, 83, 778–788. [Google Scholar] [CrossRef]
  51. Hamada, S.; Masamune, A.; Kanno, A.; Shimosegawa, T. Comprehensive Analysis of Serum MicroRNAs in Autoimmune Pancreatitis. Digestion 2015, 91, 263–271. [Google Scholar] [CrossRef]
  52. Su, Y.; Li, Z.; Rang, X.; Wang, Y.; Fu, J. Integrated Analysis and Identification of CSF-Derived Risk MiRNAs and Pivotal Genes in Multiple Sclerosis. J. Mol. Neurosci. 2022, 72, 1916–1928. [Google Scholar] [CrossRef]
  53. Chen, J.Q.; Papp, G.; Póliska, S.; Szabó, K.; Tarr, T.; Bálint, B.L.; Szodoray, P.; Zeher, M. MicroRNA Expression Profiles Identify Disease-Specific Alterations in Systemic Lupus Erythematosus and Primary Sjögren’s Syndrome. PLoS ONE 2017, 12, e0174585. [Google Scholar] [CrossRef]
  54. Wu, R.; He, Q.; Chen, H.; Xu, M.; Zhao, N.; Xiao, Y.; Tu, Q.; Zhang, W.; Bi, X. MicroRNA-448 Promotes Multiple Sclerosis Development through Induction of Th17 Response through Targeting Protein Tyrosine Phosphatase Non-Receptor Type 2 (PTPN2). Biochem. Biophys. Res. Commun. 2017, 486, 759–766. [Google Scholar] [CrossRef]
  55. Yang, Z.; Wen, H.J.; Minhas, V.; Wood, C. The Zinc Finger DNA-Binding Domain of K-RBP Plays an Important Role in Regulating Kaposi’s Sarcoma-Associated Herpesvirus RTA-Mediated Gene Expression. Virology 2009, 391, 221–231. [Google Scholar] [CrossRef] [Green Version]
  56. Spiesz, E.M.; Thorpe, C.T.; Chaudhry, S.; Riley, G.P.; Birch, H.L.; Clegg, P.D.; Screen, H.R.C. Tendon Extracellular Matrix Damage, Degradation and Inflammation in Response to in Vitro Overload Exercise. J. Orthop. Res. 2015, 33, 889–897. [Google Scholar] [CrossRef] [PubMed] [Green Version]
  57. Sun, H.B.; Li, Y.; Fung, D.T.; Majeska, R.J.; Schaffler, M.B.; Flatow, E.L. Coordinate Regulation of IL-1β and MMP-13 in Rat Tendons Following Subrupture Fatigue Damage. Clin. Orthop. Relat. Res. 2008, 466, 1555–1561. [Google Scholar] [CrossRef] [PubMed] [Green Version]
  58. Godwin, J.S.; Sexton, C.L.; Kontos, N.J.; Ruple, B.A.; Willoughby, D.S.; Young, K.C.; Mobley, C.B.; Roberts, M.D. Extracellular Matrix Content and Remodeling Markers Do Not Differ in College-Aged Men Classified as Higher and Lower Responders to Resistance Training. J. Appl. Physiol. 2023, 134, 731–741. [Google Scholar] [CrossRef]
  59. Rullman, E.; Norrbom, J.; Strömberg, A.; Wågsäter, D.; Rundqvist, H.; Haas, T.; Gustafsson, T. Endurance Exercise Activates Matrix Metalloproteinases in Human Skeletal Muscle. J. Appl. Physiol. 2009, 106, 804–812. [Google Scholar] [CrossRef] [Green Version]
  60. Zhuang, Y.; Yang, D.; Shi, S.; Wang, L.; Yu, M.; Meng, X.; Fan, Y.; Zhou, R.; Wang, F. MiR-375-3p Promotes Cardiac Fibrosis by Regulating the Ferroptosis Mediated by GPX4. Comput. Intell. Neurosci. 2022, 2022, 9629158. [Google Scholar] [CrossRef]
  61. Alphonse, N.; Wanford, J.J.; Voak, A.A.; Gay, J.; Venkhaya, S.; Burroughs, O.; Mathew, S.; Lee, T.; Evans, S.L.; Zhao, W.; et al. A Family of Conserved Bacterial Virulence Factors Dampens Interferon Responses by Blocking Calcium Signaling. Cell 2022, 185, 2354–2369.e17. [Google Scholar] [CrossRef] [PubMed]
  62. Ott, N.; Faletti, L.; Heeg, M.; Andreani, V.; Grimbacher, B. JAKs and STATs from a Clinical Perspective: Loss-of-Function Mutations, Gain-of-Function Mutations, and Their Multidimensional Consequences. J. Clin. Immunol. 2023. [Google Scholar] [CrossRef] [PubMed]
  63. Rusin, A.; Seymour, C.; Mothersill, C. Chronic Fatigue and Immune Deficiency Syndrome (CFIDS), Cellular Metabolism, and Ionizing Radiation: A Review of Contemporary Scientific Literature and Suggested Directions for Future Research. Int. J. Radiat. Biol. 2018, 94, 212–228. [Google Scholar] [CrossRef]
  64. Okreglicka, K.; Iten, I.; Pohlmeier, L.; Onder, L.; Feng, Q.; Kurrer, M.; Ludewig, B.; Nielsen, P.; Schneider, C.; Kopf, M. PPARγ Is Essential for the Development of Bone Marrow Erythroblastic Island Macrophages and Splenic Red Pulp Macrophages. J. Exp. Med. 2021, 218, e20191314. [Google Scholar] [CrossRef]
  65. Saha, A.K.; Schmidt, B.R.; Wilhelmy, J.; Nguyen, V.; Abugherir, A.; Do, J.K.; Nemat-Gorgani, M.; Davis, R.W.; Ramasubramanian, A.K. Red Blood Cell Deformability Is Diminished in Patients with Chronic Fatigue Syndrome. Clin. Hemorheol. Microcirc. 2019, 71, 113–116. [Google Scholar] [CrossRef] [PubMed]
  66. Solé, P.; Yamanouchi, J.; Garnica, J.; Uddin, M.M.; Clarke, R.; Moro, J.; Garabatos, N.; Thiessen, S.; Ortega, M.; Singha, S.; et al. A T Follicular Helper Cell Origin for T Regulatory Type 1 Cells. Cell. Mol. Immunol. 2023, 20, 489. [Google Scholar] [CrossRef]
  67. Yao Lan, H.; Ka, L.; Lan, H.Y.; Ka Shing, L. Diverse Roles of TGF-β/Smads in Renal Fibrosis and Inflammation. Int. J. Biol. Sci. 2011, 7, 1056–1067. [Google Scholar] [CrossRef] [PubMed] [Green Version]
  68. Rioux, K.L.; Delaney, S. Ionic Strength Modulates Excision of Uracil by SMUG1 from Nucleosome Core Particles. DNA Repair 2023, 125, 103482. [Google Scholar] [CrossRef]
  69. Mi, H.; Kops, O.; Zimmermann, E.; Jäschke, A.; Tropschug, M. A Nuclear RNA-Binding Cyclophilin in Human T Cells. FEBS Lett. 1996, 398, 201–205. [Google Scholar] [CrossRef] [PubMed] [Green Version]
  70. Huang, X.; Yang, Z. Resistin’s, Obesity and Insulin Resistance: The Continuing Disconnect between Rodents and Humans. J. Endocrinol. Investig. 2016, 39, 607–615. [Google Scholar] [CrossRef]
  71. Patarca, R. Cytokines and Chronic Fatigue Syndrome. Ann. N. Y. Acad. Sci. 2001, 933, 185–200. [Google Scholar] [CrossRef]
  72. Hardcastle, S.L.; Brenu, E.W.; Johnston, S.; Nguyen, T.; Huth, T.; Ramos, S.; Staines, D.; Marshall-Gradisnik, S. Serum Immune Proteins in Moderate and Severe Chronic Fatigue Syndrome/Myalgic Encephalomyelitis Patients. Int. J. Med. Sci. 2015, 12, 764–772. [Google Scholar] [CrossRef] [PubMed] [Green Version]
  73. Lisboa, F.A.; Bradley, M.J.; Hueman, M.T.; Schobel, S.A.; Gaucher, B.J.; Styrmisdottir, E.L.; Potter, B.K.; Forsberg, J.A.; Elster, E.A. Nonsteroidal Anti-Inflammatory Drugs May Affect Cytokine Response and Benefit Healing of Combat-Related Extremity Wounds. Surgery 2017, 161, 1164–1173. [Google Scholar] [CrossRef] [PubMed] [Green Version]
  74. Fuss, I.J.; Kanof, M.E.; Smith, P.D.; Zola, H. Isolation of Whole Mononuclear Cells from Peripheral Blood and Cord Blood. Curr. Protoc. Immunol. 2009, 85, 7.1.1–7.1.8. [Google Scholar] [CrossRef] [PubMed]
  75. Saiki, R.K.; Gelfand, D.H.; Stoffel, S.; Scharf, S.J.; Higuchi, R.; Horn, G.T.; Mullis, K.B.; Erlich, H.A. Primer-Directed Enzymatic Amplification of DNA with a Thermostable DNA Polymerase. Science 1988, 239, 487–491. [Google Scholar] [CrossRef] [PubMed] [Green Version]
Figure 1. HHV-6A/B presence and load in enrolled subjects. (a) HHV-6A/B-positive subjects in control (CTR) and ME/CFS groups; results are expressed as percentage of positive individuals on the total enrolled subjects. (b) HHV-6A/B load in CTR and ME/CFS groups; results are expressed as mean viral genome copy number per 106 PBMCs ± S.E. (standard error).
Ijms 24 10582 g001
Figure 2. Plasma miRNA levels in control (CTR) and ME/CFS subjects. (a) Comparison between whole CTR and ME/CFS groups. (b) Comparison between CTR group and ME/CFS subgroups, subdivided for symptoms severity (1, severe; 2, moderate; and 3, mild). All results are expressed as fold change (log10 values) detected in ME/CFS subjects compared to the controls. Results are depicted as boxplots with Whiskers; the median line, interquartile range, and min-max values for each group are shown. Statistical significance is also shown, as obtained by the unpaired t-test and ANOVA test for multiple comparisons.
Ijms 24 10582 g002aIjms 24 10582 g002b
Figure 3. Predicted gene pathways of altered miRNAs in ME/CFS plasma. (a) Potential pathways affected by miR-127, miR-140, miR-142, miR-143, miR-150, and miR-448; miRNAs are represented in blue circles, target genes are represented in yellow circles, each blue line represents a miRNA-gene interaction. (b) Main target genes involved in detected pathways; the top ten target genes resulted from the analysis and the number of miRNAs targeting them are presented. The color code reflects the adjusted p-values for multiple testing (False Discovery Rate, FDR), increasing from red to blue. (c) Functional enrichment analysis based on WikiPathways; colors from red to blue of the dots represent the adjusted p-values (FDR), whereas the size of the dots represents the gene ratio (n° of miRNA targets found in each category/n° of total miRNA targets). Analyses and graphical representations were obtained using the MIENTURNET tool [42].
Ijms 24 10582 g003
Table 1. Association of selected miRNAs with ME/CFS and potential role in the disease.
Target miRNAs Association and Potential Role in ME/CFSReferences
miR-124-3p
  • Significantly decreased in RA, SLE, SS, and UC subjects, compared to healthy controls; suggested as biomarker for systemic autoimmune diseases: AUC 0.9 (95% CI 0.833–0.967), 76.5% specificity and 91.3% sensitivity.
  • It regulates autoimmune inflammation.
  • Jin F. et al., 2018 [26]
  • Ponomarev E.D. et al., 2011 [28]
miR-127-3p
  • Upregulated in plasma of ME/CFS subjects compared to non-fatigued controls.
  • Increased in PEM.
  • Identified as a potential biomarker to distinguish ME/CFS disease from fibromyalgia.
  • It suppresses IL-10 response, inhibits cell proliferation, and induces cell apoptosis.
  • Brenu E.W et al., 2014 [24]
  • Nepotchatykh, E. et al., 2020 [25]
  • Nepotchatykh, E. et al., 2023 [29]
  • Saito Y. et al., 2006 [30]
  • Wei G. et al., 2023 [31]
miR-140-5p
  • Increased in plasma of ME/CFS subjects.
  • Identified as a potential biomarker to distinguish ME/CFS from fibromyalgia.
  • Upregulated in PBMCs of ME/CFS patients.
  • It suppresses IL-10 response and modulates T-cell differentiation and proliferation of immune cells.
  • Nepotchatykh, E. et al., 2020 [25]
  • Nepotchatykh, E. et al., 2023 [29]
  • Almenar-Pérez E. et al., 2020 [23]
  • Ghafouri-Fard S. et al., 2021 [32]
miR-142-5p
  • Upregulated in plasma of ME/CFS subjects compared to non-fatigued controls.
  • It modulates differentiation/proliferation of immune cells and interaction with TGF-β1 pathway.
  • Brenu E.W. et al., 2014 [24]
  • Wang Z. et al., 2020 [33]
miR-143-3p
  • Upregulated in plasma of ME/CFS subjects compared to non-fatigued controls.
  • It modulates differentiation/proliferation of immune cells and interaction with TGF-β1 pathway.
  • Brenu E.W. et al., 2014 [24]
  • Cheng W. et al., 2016 [34]
miR-150-5p
  • Higher PEM scores and increased symptom severity of ME/CFS patients.
  • Upregulated in PBMCs of ME/CFS patients in response to exercise.
  • It modulates differentiation/proliferation of immune cells.
  • Nepotchatykh, E. et al., 2020 [25]
  • Nepotchatykh, E. et al., 2023 [29]
  • Cheema A.K. et al., 2020 [27]
  • Ménoret A. et al., 2023 [35]
miR-448
  • Significantly increased in RA, SLE, SS, UC, compared to healthy controls. Suggested as biomarkers for systemic autoimmune diseases: AUC 0.91 (95% CI 0.85–0.97), 82.4% specificity and 91.3% sensitivity.
  • Mainly studied in cancer-related pathways.
  • Jin F. et al., 2018 [26]
  • Liao Z.B. et al., 2019 [36]
miR-551b-3p
  • Significantly increased in RA, SLE, SS, and UC subjects compared to healthy controls; suggested as biomarkers for systemic autoimmune diseases: AUC 0.850 (95% CI 0.769–0.932), 73.5% specificity, and 88.4% sensitivity.
  • It regulates inflammatory response.
  • Jin F. et al., 2018 [26]
  • Zhang Y. et al., 2018 [37]
RA, rheumatoid arthritis; SLE, systemic lupus erythematosus; SS, Sjögren’s syndrome; UC, ulcerative colitis; AUC, area under the ROC curve; ME/CFS, myalgic encephalomyelitis/chronic fatigue syndrome; PEM, post-exertional malaise; PBMCs, peripheral blood mononuclear cells.
Table 2. Epidemiological features of ME/CFS patients and healthy controls.
GroupNAge
Mean ± SE 1
GenderME/CFS Severity 2
123
ME/CFS4049.30 ± 2.234 F: 31 (77.5%)
M: 9 (22.5%)
5 (12.5%)22 (55%)13 (32.5%)
Controls2033.40 ± 2.634 F: 16 (80%)
M: 4 (40%)
---
p value 0.00011.00 (n.s)
1 Standard error. 2 ME/CFS symptoms severity based on the semi-structured interview questions created by Minnock et al. (1, severe; 2, moderate; and 3, mild). n.s., not significant.
Table 3. Plasma cytokine quantification 1.
Cytokine Group (Subjects n°)
Controls
(20)
ME/CFS
(39)
p-Value 2ME/CFS
Grade 1
(5)
p-Value 2ME/CFS
Grade 2
(22)
p-Value 2ME/CFS
Grade 3
(13)
p-Value 2
IFN-γ649.90 ± 61.33507.7 ± 49.980.1560675.8 ± 92.420.2890429.2 ± 77.060.1634572.3 ± 79.800.5089
IL-17A103.80 ± 12.4018.80 ± 5.540.000320.47 ± 20.430.156816.66 ± 5.55<0.000119.48 ± 11.760.0043
IL-230.40 ± 3.994.52 ± 1.420.00017.26 ± 7.170.19894.28 ± 1.10<0.00014.40 ± 2.630.0004
IL-2143.97 ± 5.949.07 ± 2.130.000110.46 ± 9.200.10658.68 ± 2.18<0.00019.64 ± 3.990.0005
IL-231.602 ± 235.00407.5 ± 114.50.1065527.5 ± 620.30.6728403.2 ± 100.30.0013377.4 ± 194.30.0156
IL-616.34 ± 8.140.90 ± 2.130.02700.95 ± 0.230.00610.90 ± 2.960.03080.74 ± 4.310.0588
TNF-α45.16 ± 4.0612.35 ± 3.420.005213.44 ± 11.270.639712.35 ±4.040.003811.61 ± 6.890.0587
1 Results are expressed as median cytokine concentration (pg/mL) ± standard error. 2 p-value obtained by comparing all ME/CFS patients or ME/CFS subgroups (1, severe; 2, moderate; and 3, mild) with the group of controls.
Disclaimer/Publisher’s Note: The statements, opinions and data contained in all publications are solely those of the individual author(s) and contributor(s) and not of MDPI and/or the editor(s). MDPI and/or the editor(s) disclaim responsibility for any injury to people or property resulting from any ideas, methods, instructions or products referred to in the content.

