Article

Genome-Wide Identification and Expression Profiles of C-Repeat Binding Factor Transcription Factors in Betula platyphylla under Abiotic Stress

State Key Laboratory of Tree Genetics and Breeding, Northeast Forestry University, Harbin 150040, China
*
Authors to whom correspondence should be addressed.
These authors contributed equally to this work.
Int. J. Mol. Sci. 2023, 24(13), 10573; https://doi.org/10.3390/ijms241310573
Submission received: 5 June 2023 / Revised: 17 June 2023 / Accepted: 22 June 2023 / Published: 24 June 2023
(This article belongs to the Special Issue Advances in Forest Tree Physiology, Breeding and Genetic Research)

Abstract

:
CBF (C-repeat binding factor) transcription factor subfamily belongs to AP2/ERF (Apetala 2/ethylene-responsive factor) transcription factor family, known for playing a vital role in plant abiotic stress response. Although some CBF transcription factors have been identified in several species, such as Arabidopsis, tobacco, tomato and poplar, research of CBF focus mainly on model plant Arabidopsis and have not been reported in Betula platyphylla yet. In this study, a total of 20 BpCBF subfamily members were identified. The conserved domains, physicochemical properties, exon-intron gene structure and the structure of conserved protein motifs of BpCBFs were analyzed via bioinformatic tools. The collinearity analysis of CBF genes was performed between Betula platyphylla and Arabidopsis thaliana, Betula platyphylla, and Populus trichocarpa. The cis-acting elements in the promoter region of BpCBFs were identified, which were mainly environmental stress-related and hormone-related element components. In this case, the expression patterns of the 20 BpCBFs upon ABA or salt treatment were investigated. Most of these transcription factors were responsive to ABA or salt stress in different plant tissues. The up-regulation trend upon cold treatment of the six cold-responsive genes validated by qRT-PCR was consistent with the result of RNA-seq. BpCBF7 showed transcription activating activity. This study sheds light on the responses of BpCBFs to abiotic stress and provides a reference for further study of CBF transcription factors in woody plants.

1. Introduction

Plant growth is affected by various abiotic stresses, such as salt, drought, high or low temperature and heavy metal stress. Facing the unpredictable or continuous adverse conditions, they have gradually developed multiple strategies for survival during long-term evolution, one of which refers to transcriptional regulation. Transcription factor, as a kind of protein, plays a key and central role in the process of transcriptional regulation by specifically binding to the cis-acting elements in the promoters of genes, and thereby activates or represses the transcription of these genes [1]. AP2/ERF (Apetala 2/ethylene-responsive factor) transcription factor family is one of the largest plant-specific transcription factor families and is marked by an AP2 conserved domain [2]. This transcription factor family is divided into five subfamilies according to the number of AP2 domains contained and sequence traits, including ERF (Ethylene Responsive Factor), AP2, DREB (Dehydration-Responsive Element Binding), RAV (Abscisic Acid Insensitive 3/Viviparous 1) and soloist [3]. CBF transcription factor subfamily belongs to the DREB subfamily. CBF1, a member of CBF (C-repeat binding factor) transcription factors, was first separated in Arabidopsis from cDNA library via a yeast one hybrid experiment by Stockinger et al. [4,5,6]. CBF transcription factors can specifically bind to the CRT/DRE sequence in the promoters of downstream genes and thereby activate or inhibit the expression of these genes, most of which are related to stress response, especially cold stress [7].
CBF subfamily has been mostly studied in Arabidopsis, in which six members have been identified. AtCBF1, AtCBF2 and AtCBF3 are tandemly located on Chromosome 4 [8]. They shared high similarity in gene sequences and some overlapping functions in plant cold stress responses [9]. Overexpression of each of the three genes, respectively, can promote the tolerance of Arabidopsis against cold, drought or salt stress, while the repression of AtCBF1 or AtCBF3 reduced the tolerance of Arabidopsis against cold stress [9,10]. AtCBF4 was reported to be responsive to drought stress but not to cold stress. Overexpression of AtCBF4 in Arabidopsis raised the expression levels of DRE-containing downstream genes, which function in plant cold or drought stress responses [11]. The expression of another two members, AtDDF1 and AtDDF2 were induced by drought and salt stress [12,13]. Ectopic expression of Arabidopsis CBF genes in other plants [14,15,16,17,18,19,20,21,22] or other plants’ CBF genes in Arabidopsis [23,24,25] both improved the cold tolerance of transgenic plants, indicating that the function of CBF in different species may have shared characteristics. Additionally, CBF transcription factors also play important roles in other abiotic stress responses, such as salt and drought stress. In banana (Musa acuminata), CBF transcription factor MaDREB1F was responsive to salt and osmotic treatment and expressed at the highest level at 24 d, 17 d, respectively [26]. Overexpression of MaDREB1F in banana enhanced drought tolerance of the transgenic plants. In Kandelia obovate, KoCBF3 was induced by salt treatment (reaching a maximum of 10-fold at 3 h) [27]. This gene showed significant down-regulation after PEG treatment (reaching a minimum of 0.04-fold at 48 h). In apple (Malus baccata), MbCBF1 was induced by salt (reaching a maximum of over 20-fold at 12 h) and drought (reaching a maximum of over 10-fold at 5 h) treatment [28]. Overexpression of this gene in Arabidopsis improved high salt tolerance of the transgenic plants.
To date, CBF subfamily members have been identified and characterized in many other species. Ding et al. identified six CBF subfamily members in Populus trichocarpa by analyzing the transcriptomic data with Arabidopsis sequences as reference [29]. Lee et al. identified ten CBF subfamily members in Brassica rapa by searching the genome database [30]. The increased quantity of subfamily members in Brassica rapa compared to that in Arabidopsis can be attributed to genome triplication and reorganization. Furthermore, eight genes of the ten were significantly up-regulated after cold treatment, and some of them were also responsive to salt, drought and ABA treatment. In Taraxacum kok-saghyz, ten CBF subfamily members were identified and their basic properties and relationships were analyzed with bioinformatic methods [31]. It was also found that the expression levels of most of the CBF subfamily members in Taraxacum kok-saghyz were significantly changed after cold treatment. Wang et al. identified 12 CBF subfamily members in Lolium perenne and divided them into three phylogenetic clades [32]. The expression levels of these genes were significantly up- or down-regulated in different patterns after cold, heat, water deficit, salinity and ABA treatment, and were more influenced by cold treatment. Otherwise, CBF transcription factors were also identified, and their functions were characterized in many other species, such as rice, barley, wheat, tobacco, tomato, grape and eucalypt [33,34,35,36,37], but are rarely reported in woody plants.
Birch, as a widely spread tree species across the globe, is well known not only for its ornamental value, but also its remarkable adaptability and tolerance to stresses. It possibly has developed mature strategies to survive the adverse environmental conditions. In this study, a total of 20 CBF transcription factors were identified in Betula platyphylla via the analysis of genomic data. With bioinformatic tools, we analyzed their protein sequences, chromosome locations, evolutionary relationships, basic physiochemical properties and gene structures. The expression patterns of these genes in different plant tissues upon salt, ABA and cold treatment were also investigated using qRT-PCR. This study hopes to provide a reference for future research on CBF transcription factors and plant stress response.

2. Results

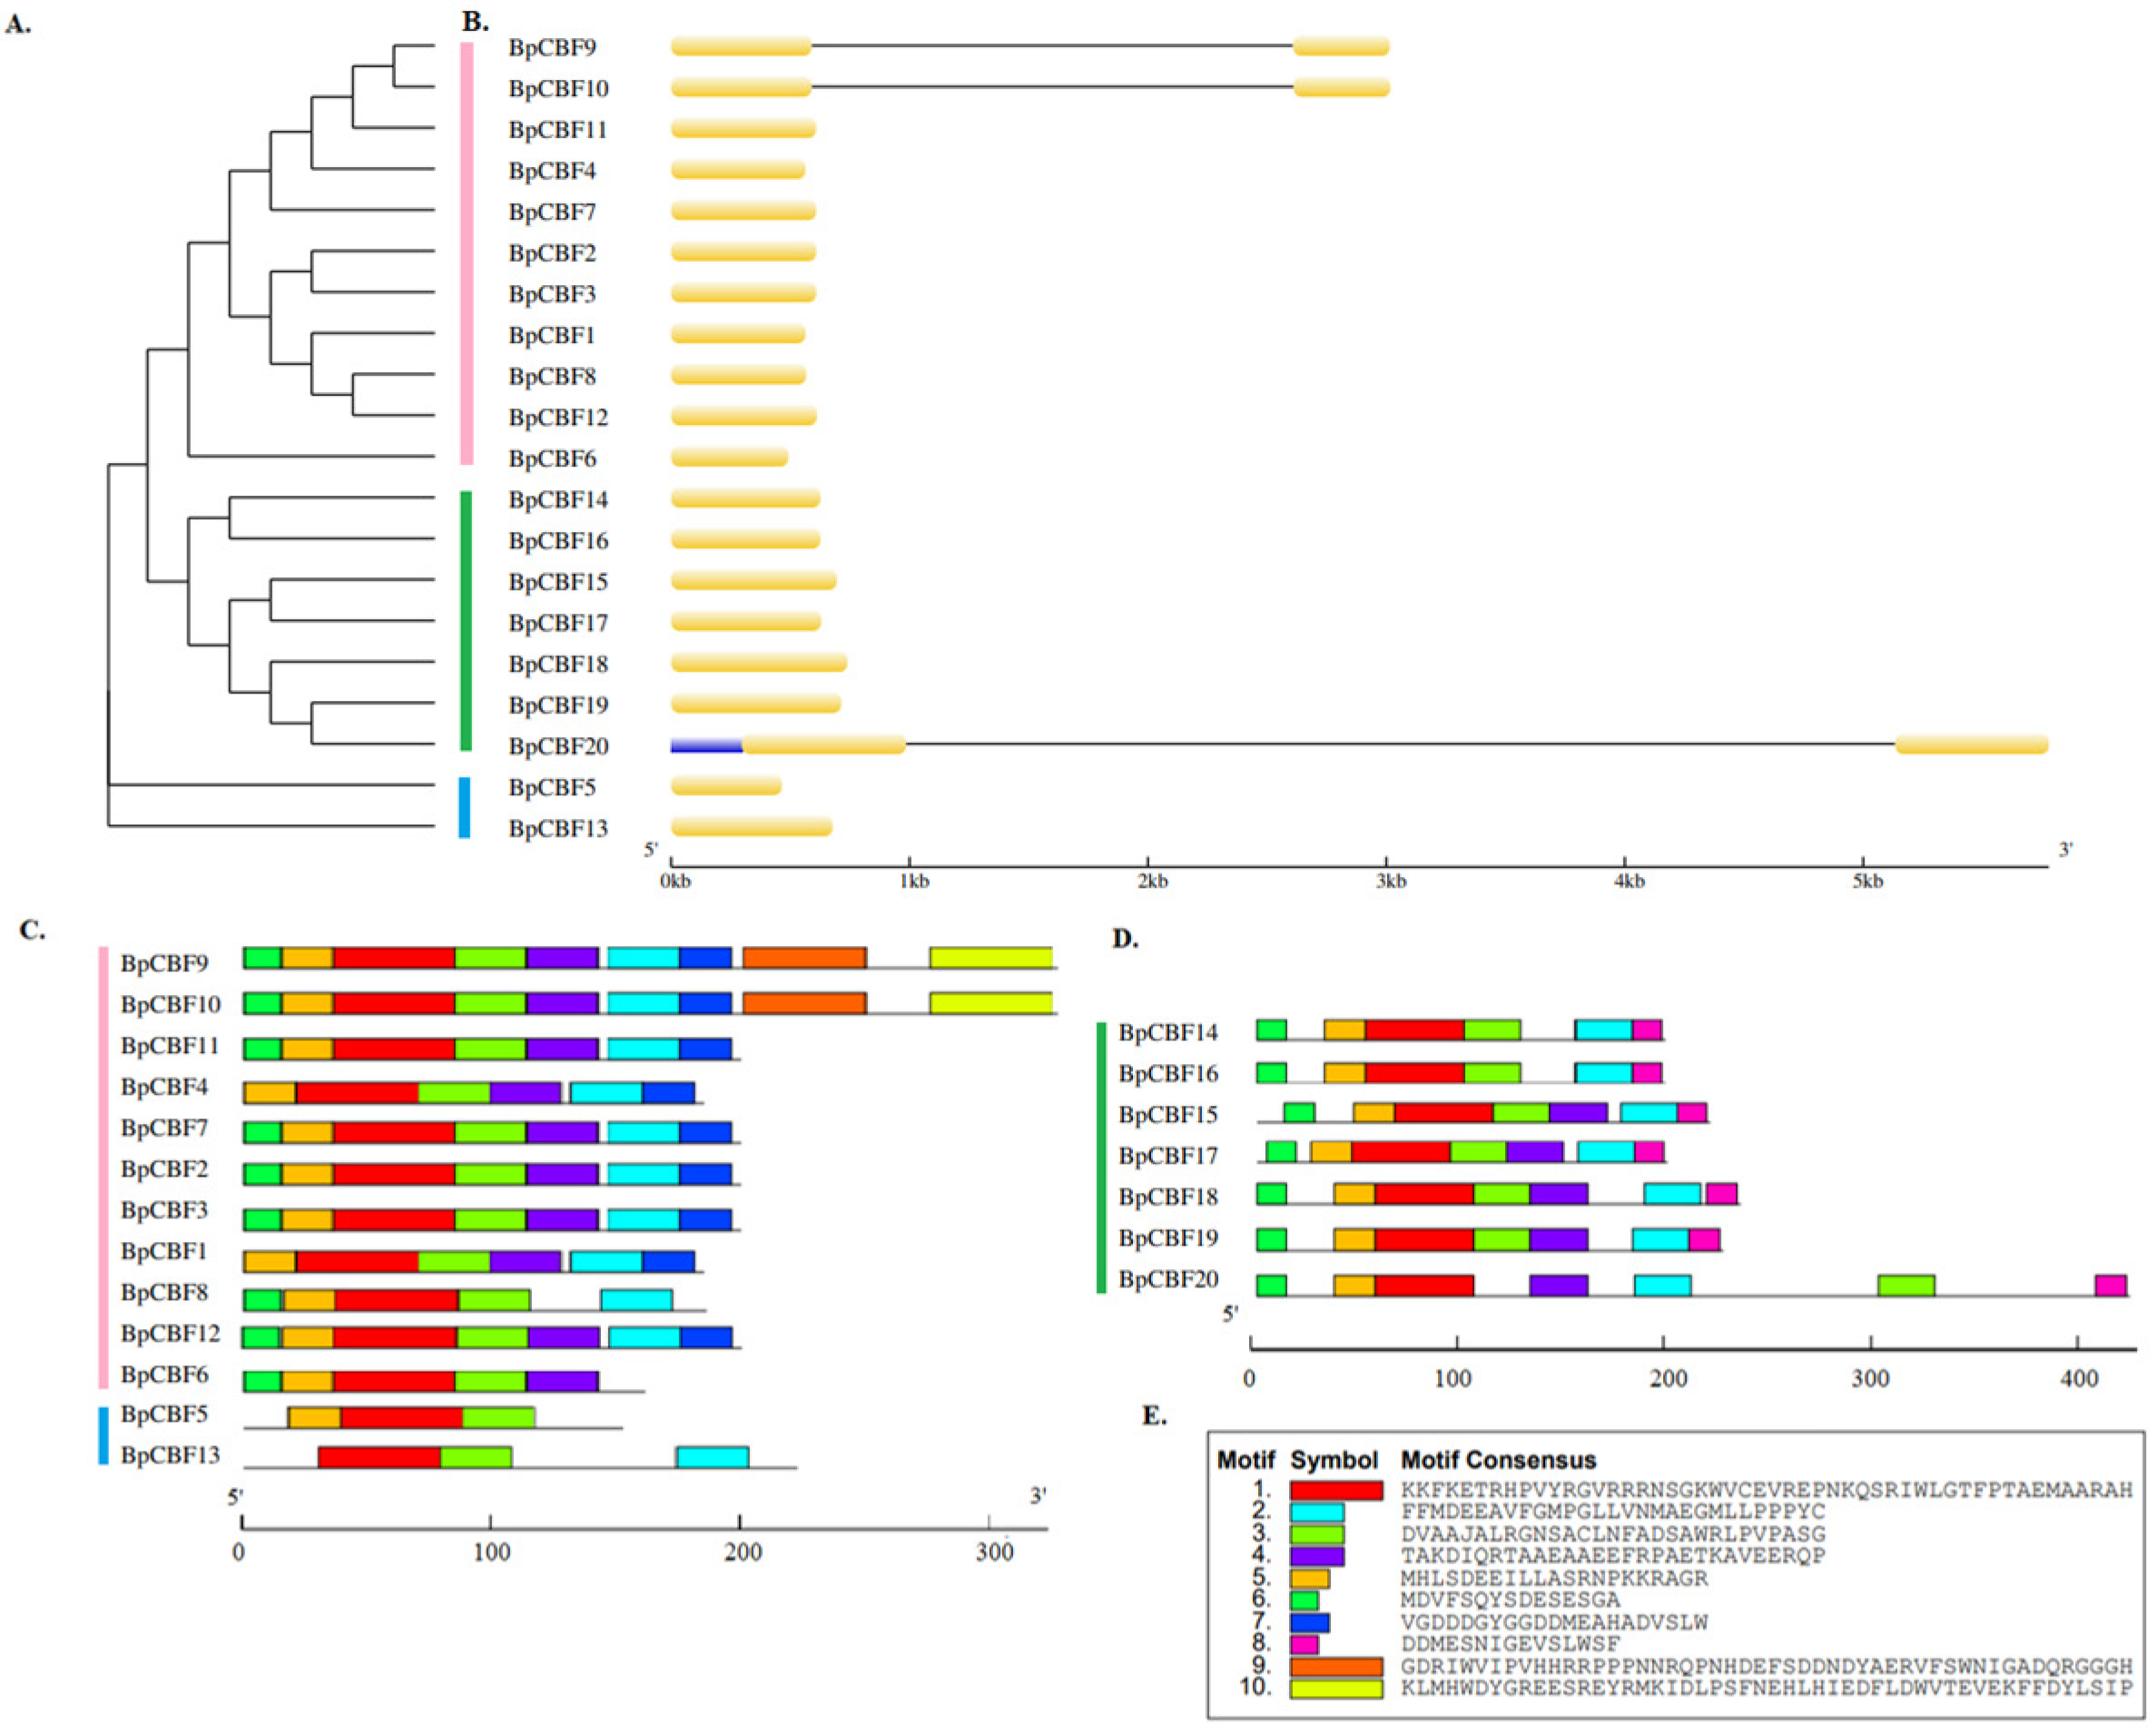
2.1. Identification and Sequence Analysis of CBF Transcription Factors in Betula platyphylla

The Betula platyphylla v1.1 genome database was searched by BlastP with the six AtCBFs as query sequences. After Pfam analysis, HMMER prediction and another two conserved domain screening, a total of 20 BpCBFs were identified (Table 1). They were named BpCBF1-BpCBF20 according to their location order on chromosomes. The physicochemical properties of the 20 putative BpCBF family transcription factors were analyzed, and the length of their protein sequences ranged from 155 to 332 amino acids (aa). The physicochemical properties, such as chromosome location, isoelectric point and molecular weight, were listed in Table 1.
The phylogenetic tree of the CBFs in Betula platyphylla, Arabidopsis thaliana and Populus trichocarpa was constructed (Figure 1). The six AtCBFs were divided into two clades, which was consistent with the results of previous studies [30]. In order to more intuitively clarify the evolutionary relationships between BpCBFs, we introduced the members of CBF transcription factor family in the woody model plant Populus trichocarpa into the phylogenetic tree as well. The six PtCBFs were divided into three clades, which was consistent with the results of previous studies [29]. BpCBF14-20 were divided into Clade 2, indicating that the family members were highly conserved in the evolution process. BpCBF5 and BpCBF13 were closely related with PtCBF3 and PtCBF4, which were clustered in Clade 3. Others member, BpCBF1 -BpCBF4 and BpCBF6 -BpCBF12, were classified in Clade 1.
The phylogenetic tree of BpCBFs, which was constructed using the TBtools-II (v1.120) software based on the full-length protein sequences of BpCBFs, was constructed to further investigate the conservatism and evolutionary relationships (Figure 2A), which was consistent with the result in Figure 1. The gene structure (exon-intron) analysis (Figure 2B) of the twenty BpCBF transcription factor family members showed that only three CBFs (BpCBF9, BpCBF10 and BpCBF20) contained only one intron, with an intron length longer than 2 kb. None of the other members contain introns. Except for BpCBF20 which contained 5′-regions, other members contain neither 5′-regions nor 3′-regions. Based on the results of the online MEME tool motif analysis, schematic representations of the structures of all BpCBF proteins were constructed (Figure 2C,D). A total of 10 conserved motifs were obtained. Motif 1 and Motif 3 were distributed in all transcription factors, and Motif 3–6 exists in almost all members. Transcription factors in the same class usually had similar motif structures. For example, BpCBF14 -BpCBF20 had roughly the same motif structures (Motif 8), while BpCBF1 -BpCBF13 did not contain this motif, which might be an evolutionary difference. The 10 motif sequences were shown in Figure 2E. Their width, E-value and conserved domain were labeled in Table S1.

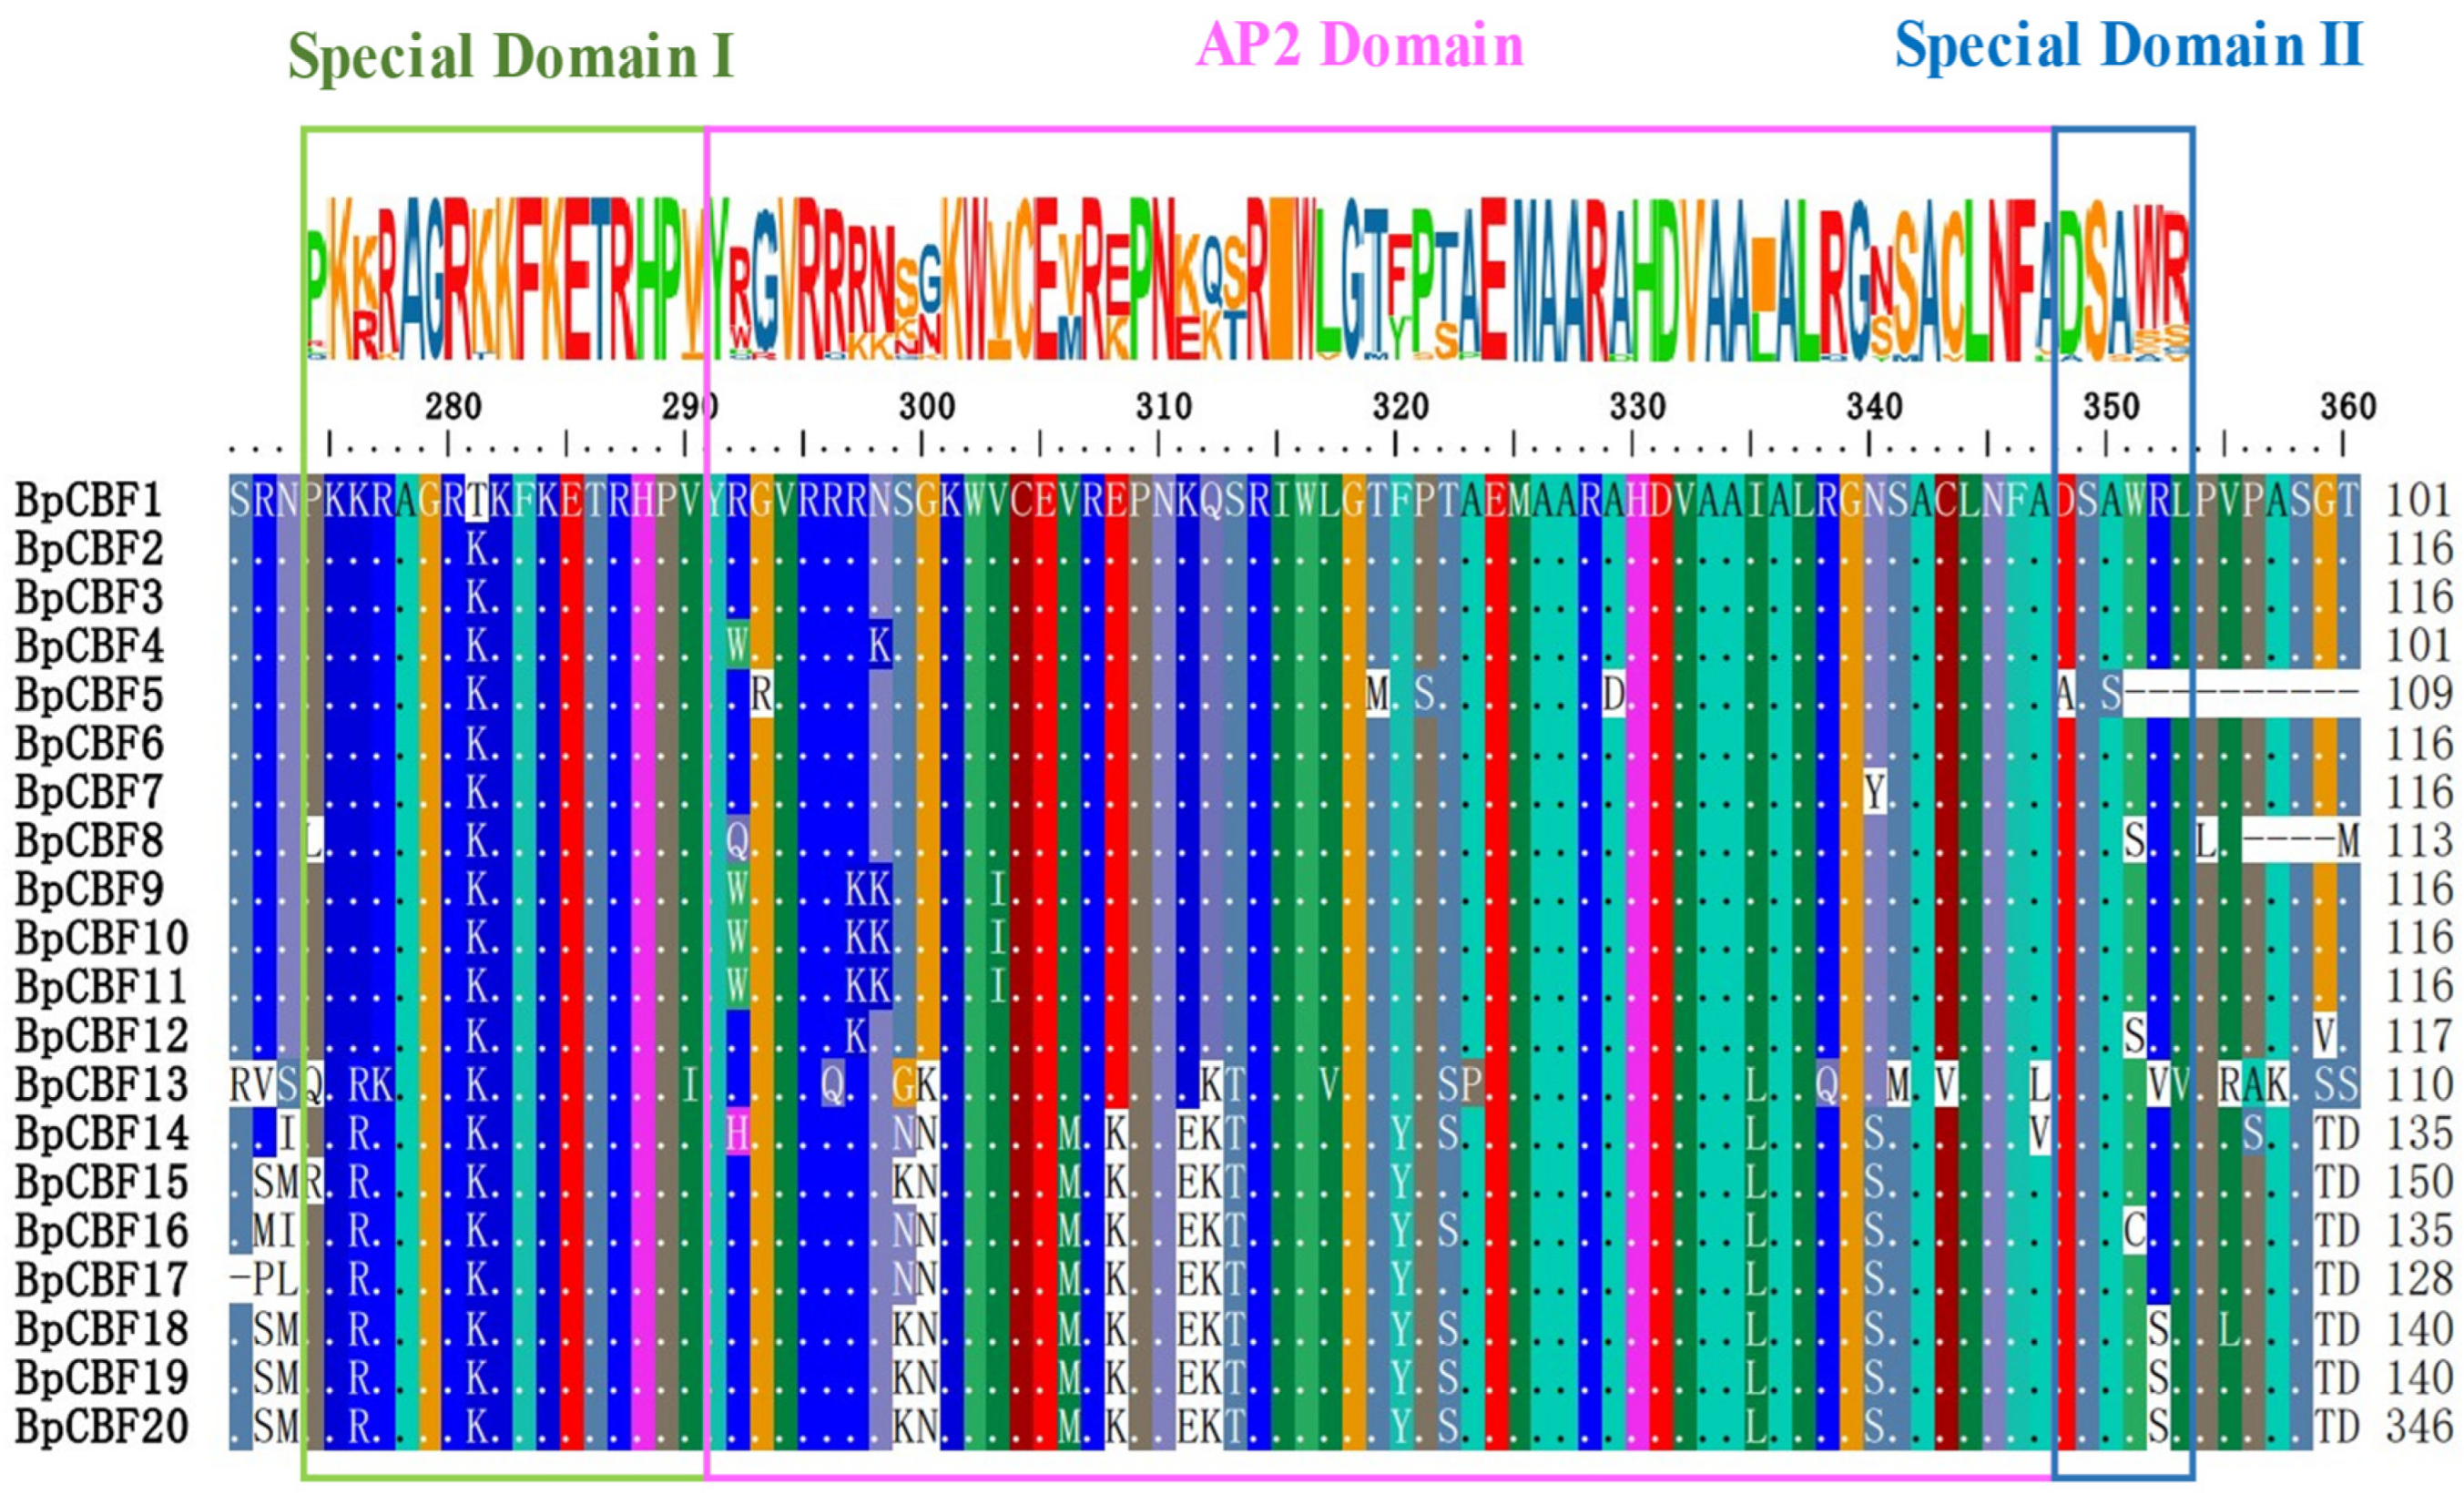
2.2. Multiple Sequence Alignment Analysis of the 20 BpCBFs

It was reported in previous studies that CBF protein has three conserved domains, including AP2 domain, Special Domain I or Special Domain II [8]. In this study, a multiple sequence alignment of the 20 BpCBFs was performed, and the complete analysis results were shown in Figure S1. All of these conserved domains were present in the 20 BpCBFs (Figure 3). The three domains were continuously aligned, with Special Domain Ⅰ and Special Domain Ⅱ on the left and right side of AP2 domain, respectively. They were located at around positions 275- 353aa of the sequences.

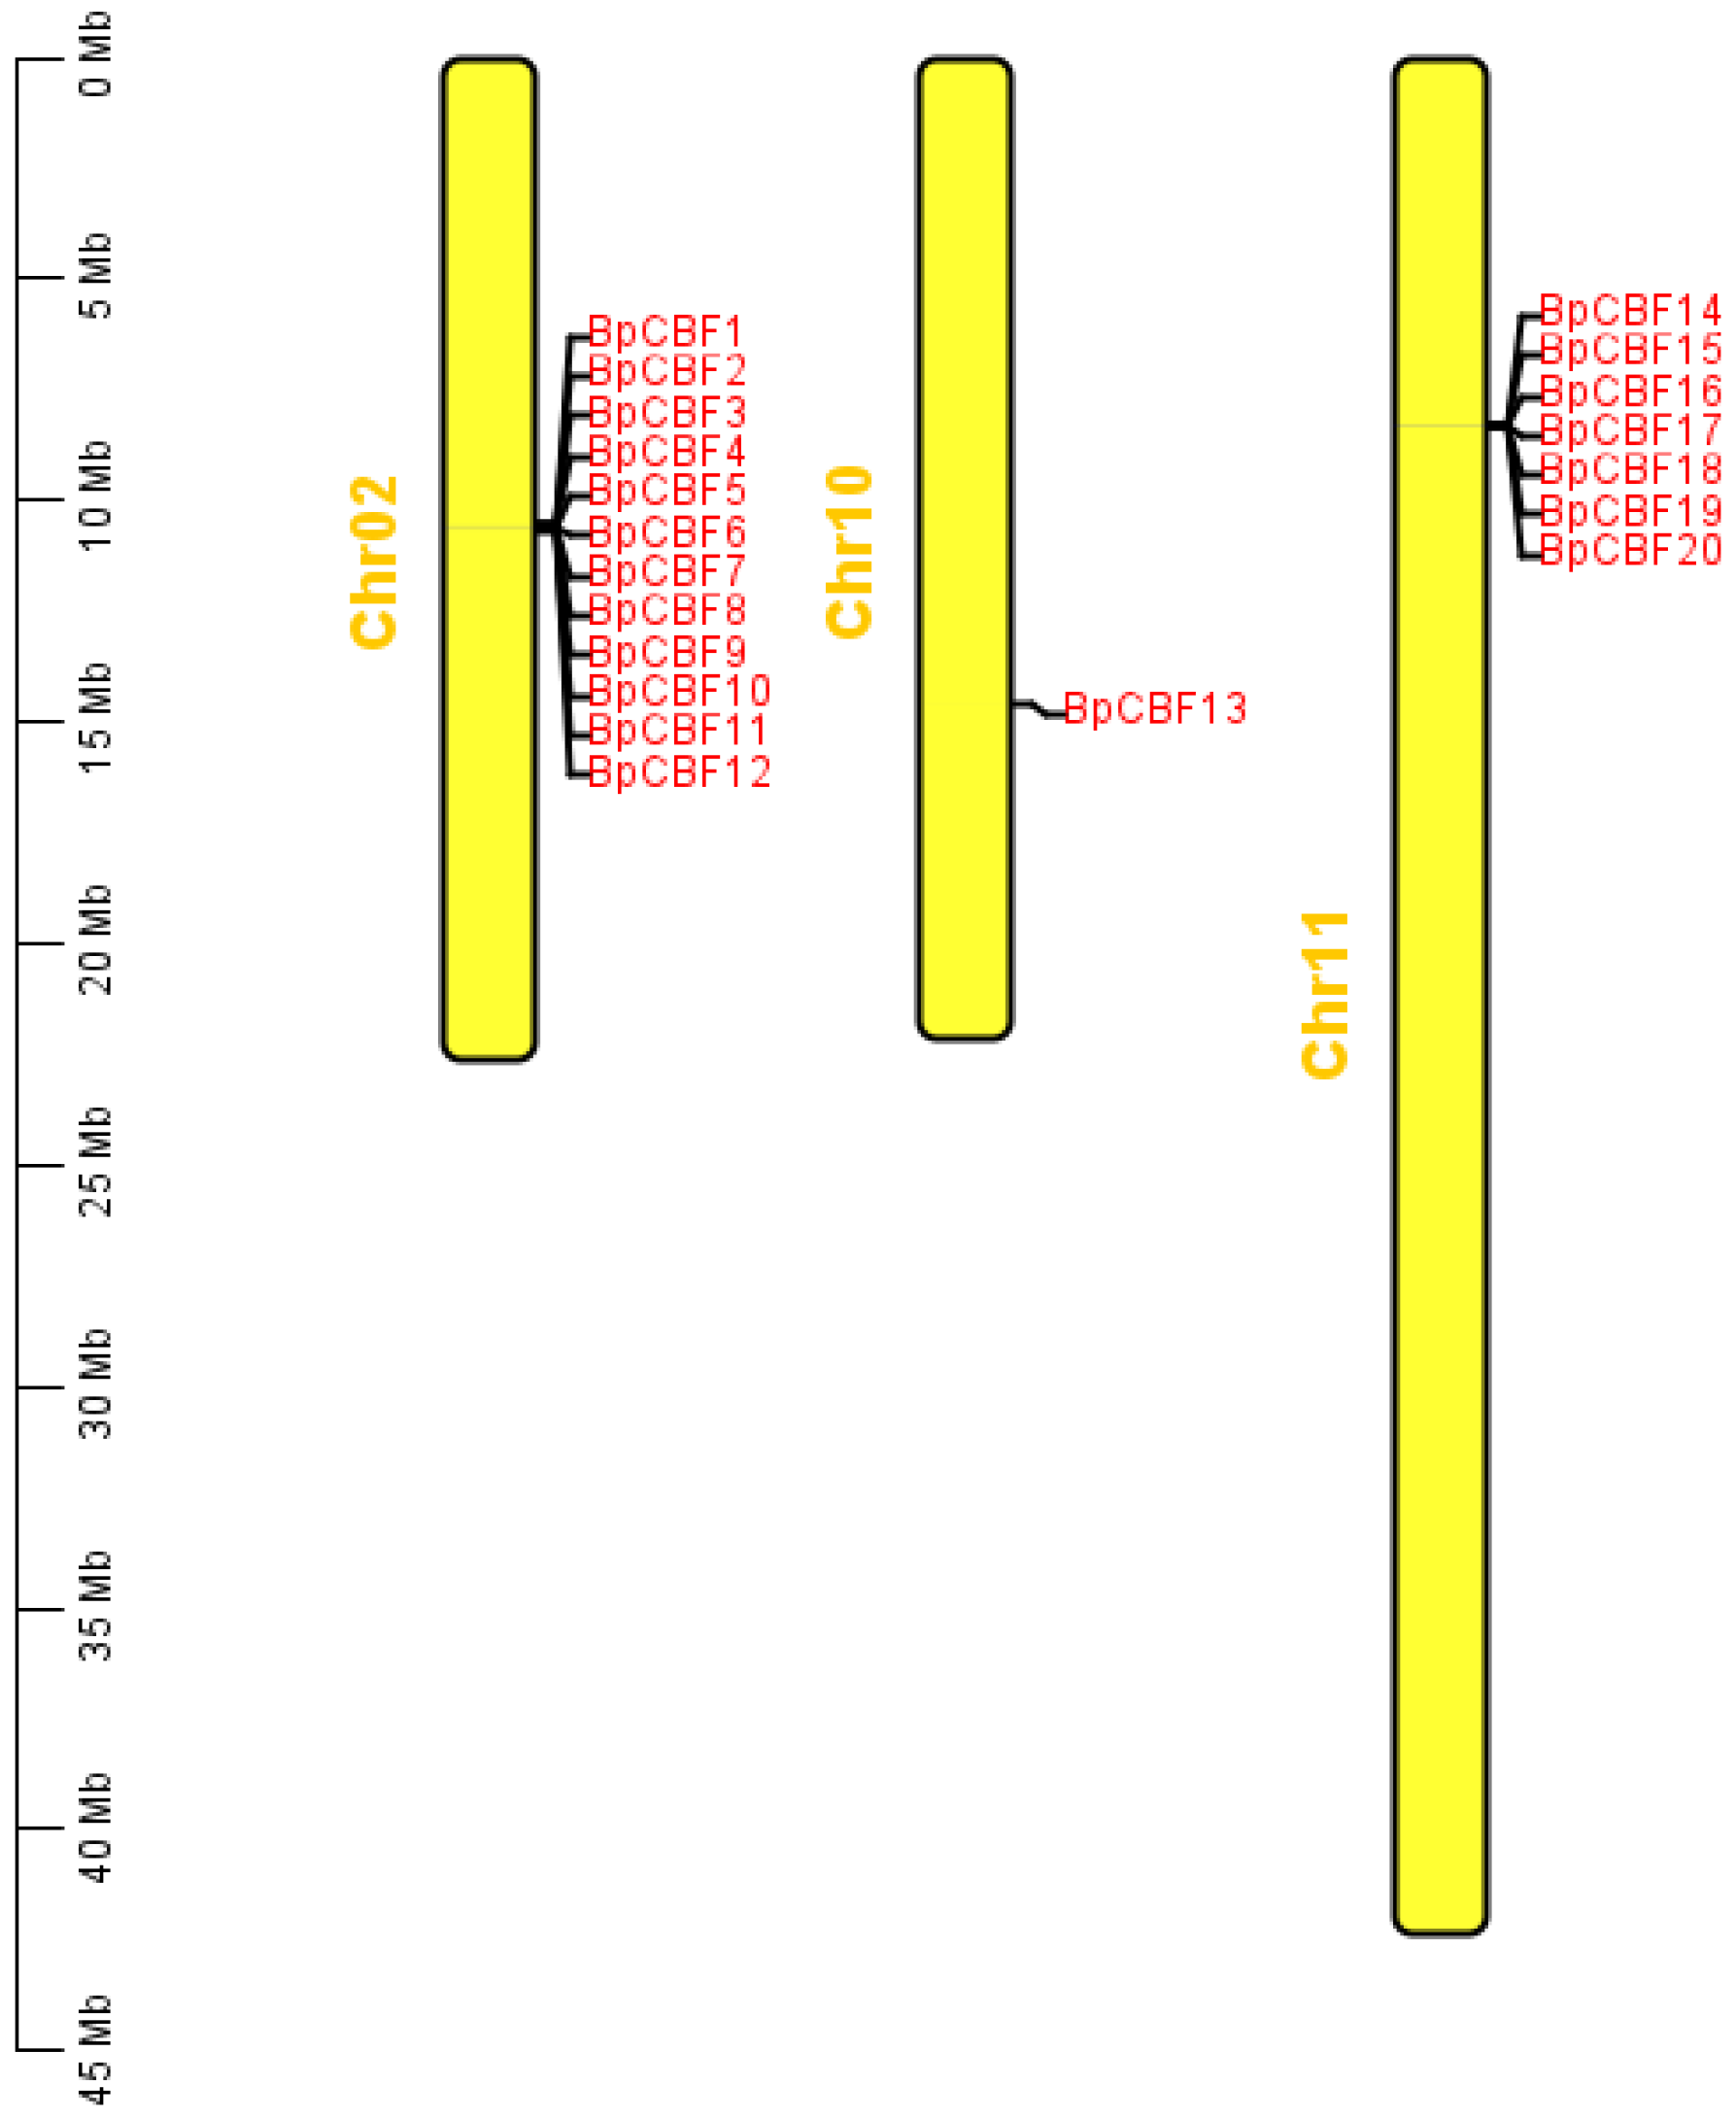
2.3. Chromosome Distribution and Analysis of BpCBF Transcription Factors

The chromosome location of the 20 BpCBFs were mapped based on the genomic information of Betula platyphylla (Figure 4). The results showed that these 20 genes were located on three different chromosomes (Chr02, 10, 11). BpCBF1-12 were tandem duplications on Chr02, BpCBF14-20 were tandem duplications on Chr11 and BpCBF13 alone located on Chr10. That these family members were located in different chromosome positions was consistent with the phylogenetic cluster in Figure 1, which indicated that the members on the same chromosome were a tandem result caused by gene duplication in the evolution process, and also showed the stability of protein conservative structure in the evolution process.

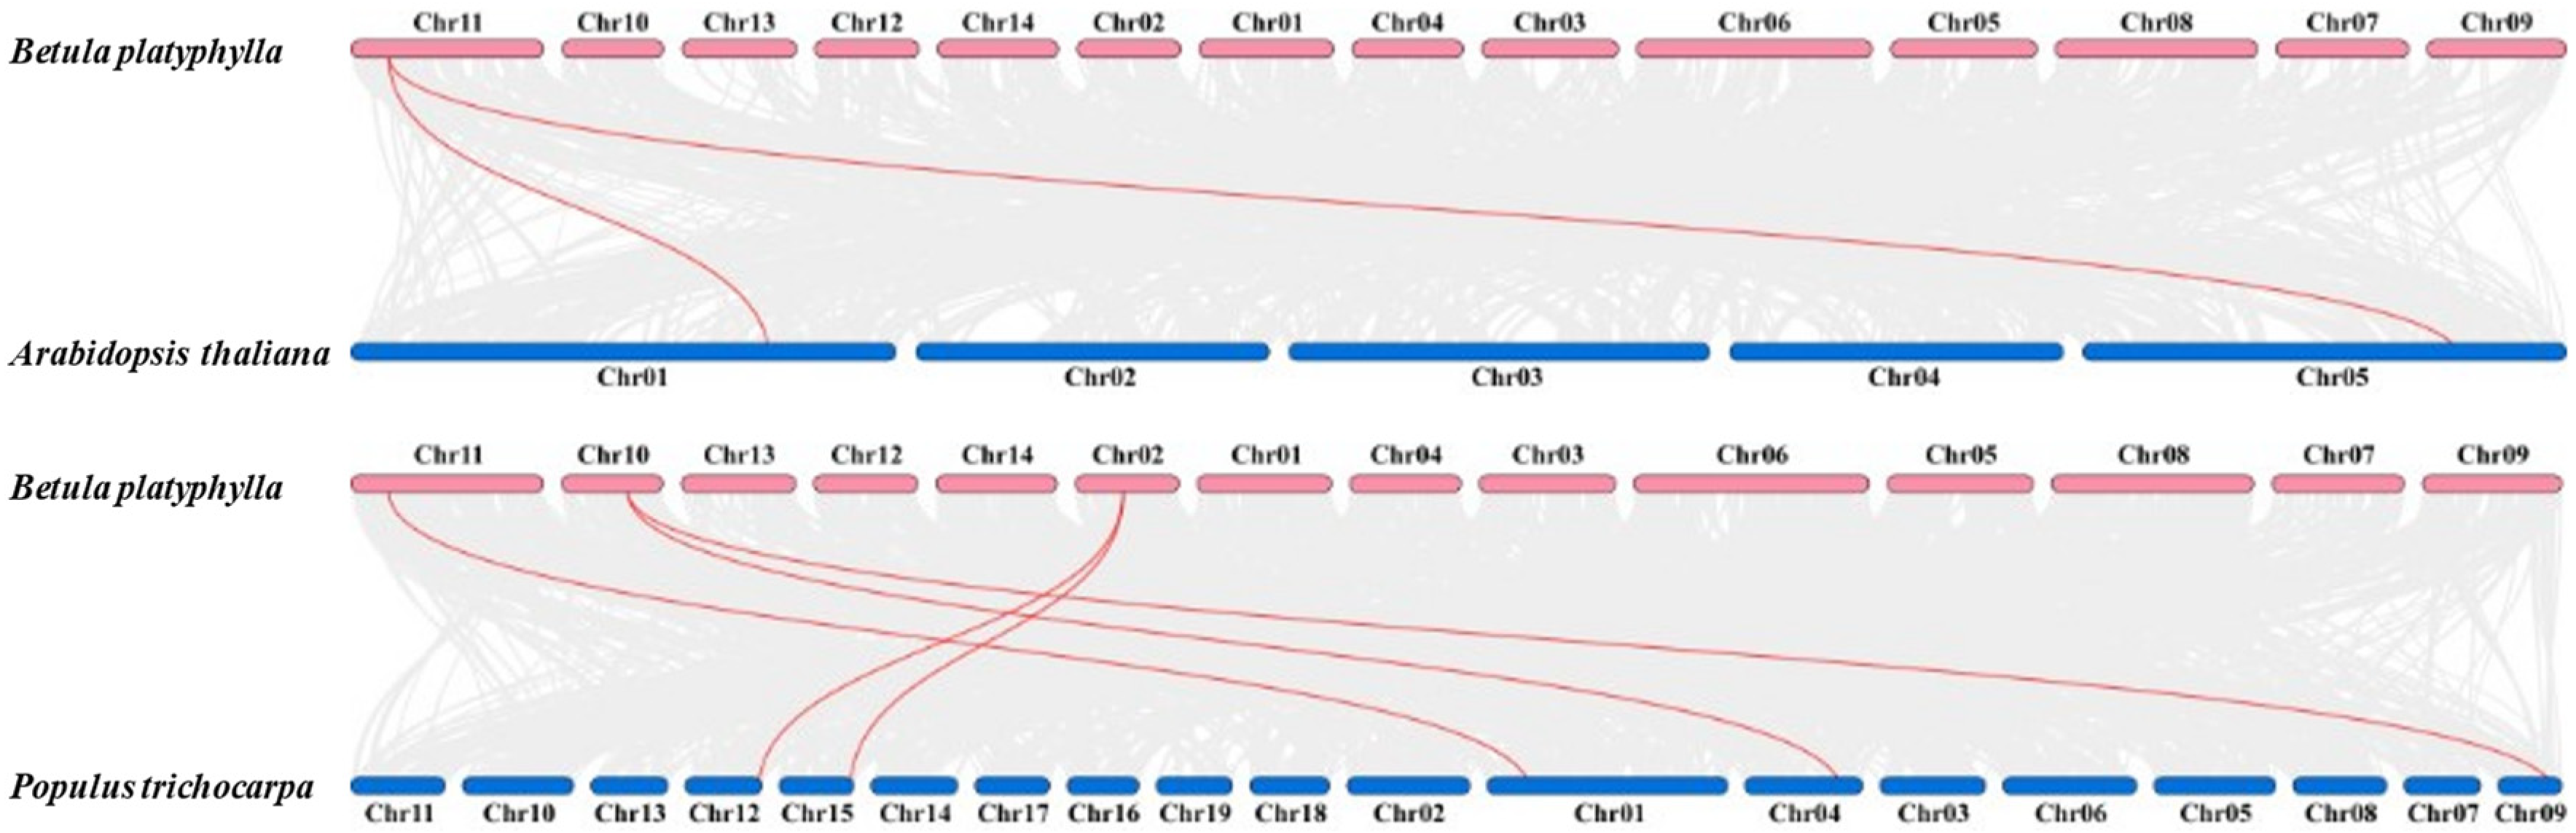
2.4. Collinearity Analysis of BpCBF Transcription Factors

In order to explore the duplication mechanism of BpCBF transcription factor family, we constructed comparative syntenic maps between birch and Arabidopsis and birch and poplar, respectively (Figure 5). The results showed that the BpCBF had more syntenic transcription factor pairs with the PtCBF, than with AtCBF. The number of syntenic CBF transcription factor pairs between birch and Arabidopsis was two (Table S4) and between birch and poplar was five (Table S5). BpCBF14 had collinear genes in the other two plants, and there were collinear sites in the other two species, and only BpCBF14 was collinear with the AtCBFs. The collinear CBFs between Betula platyphylla and Arabidopsis thaliana and Betula platyphylla and Populus trichocarpa are displayed in Tables S4 and S5.

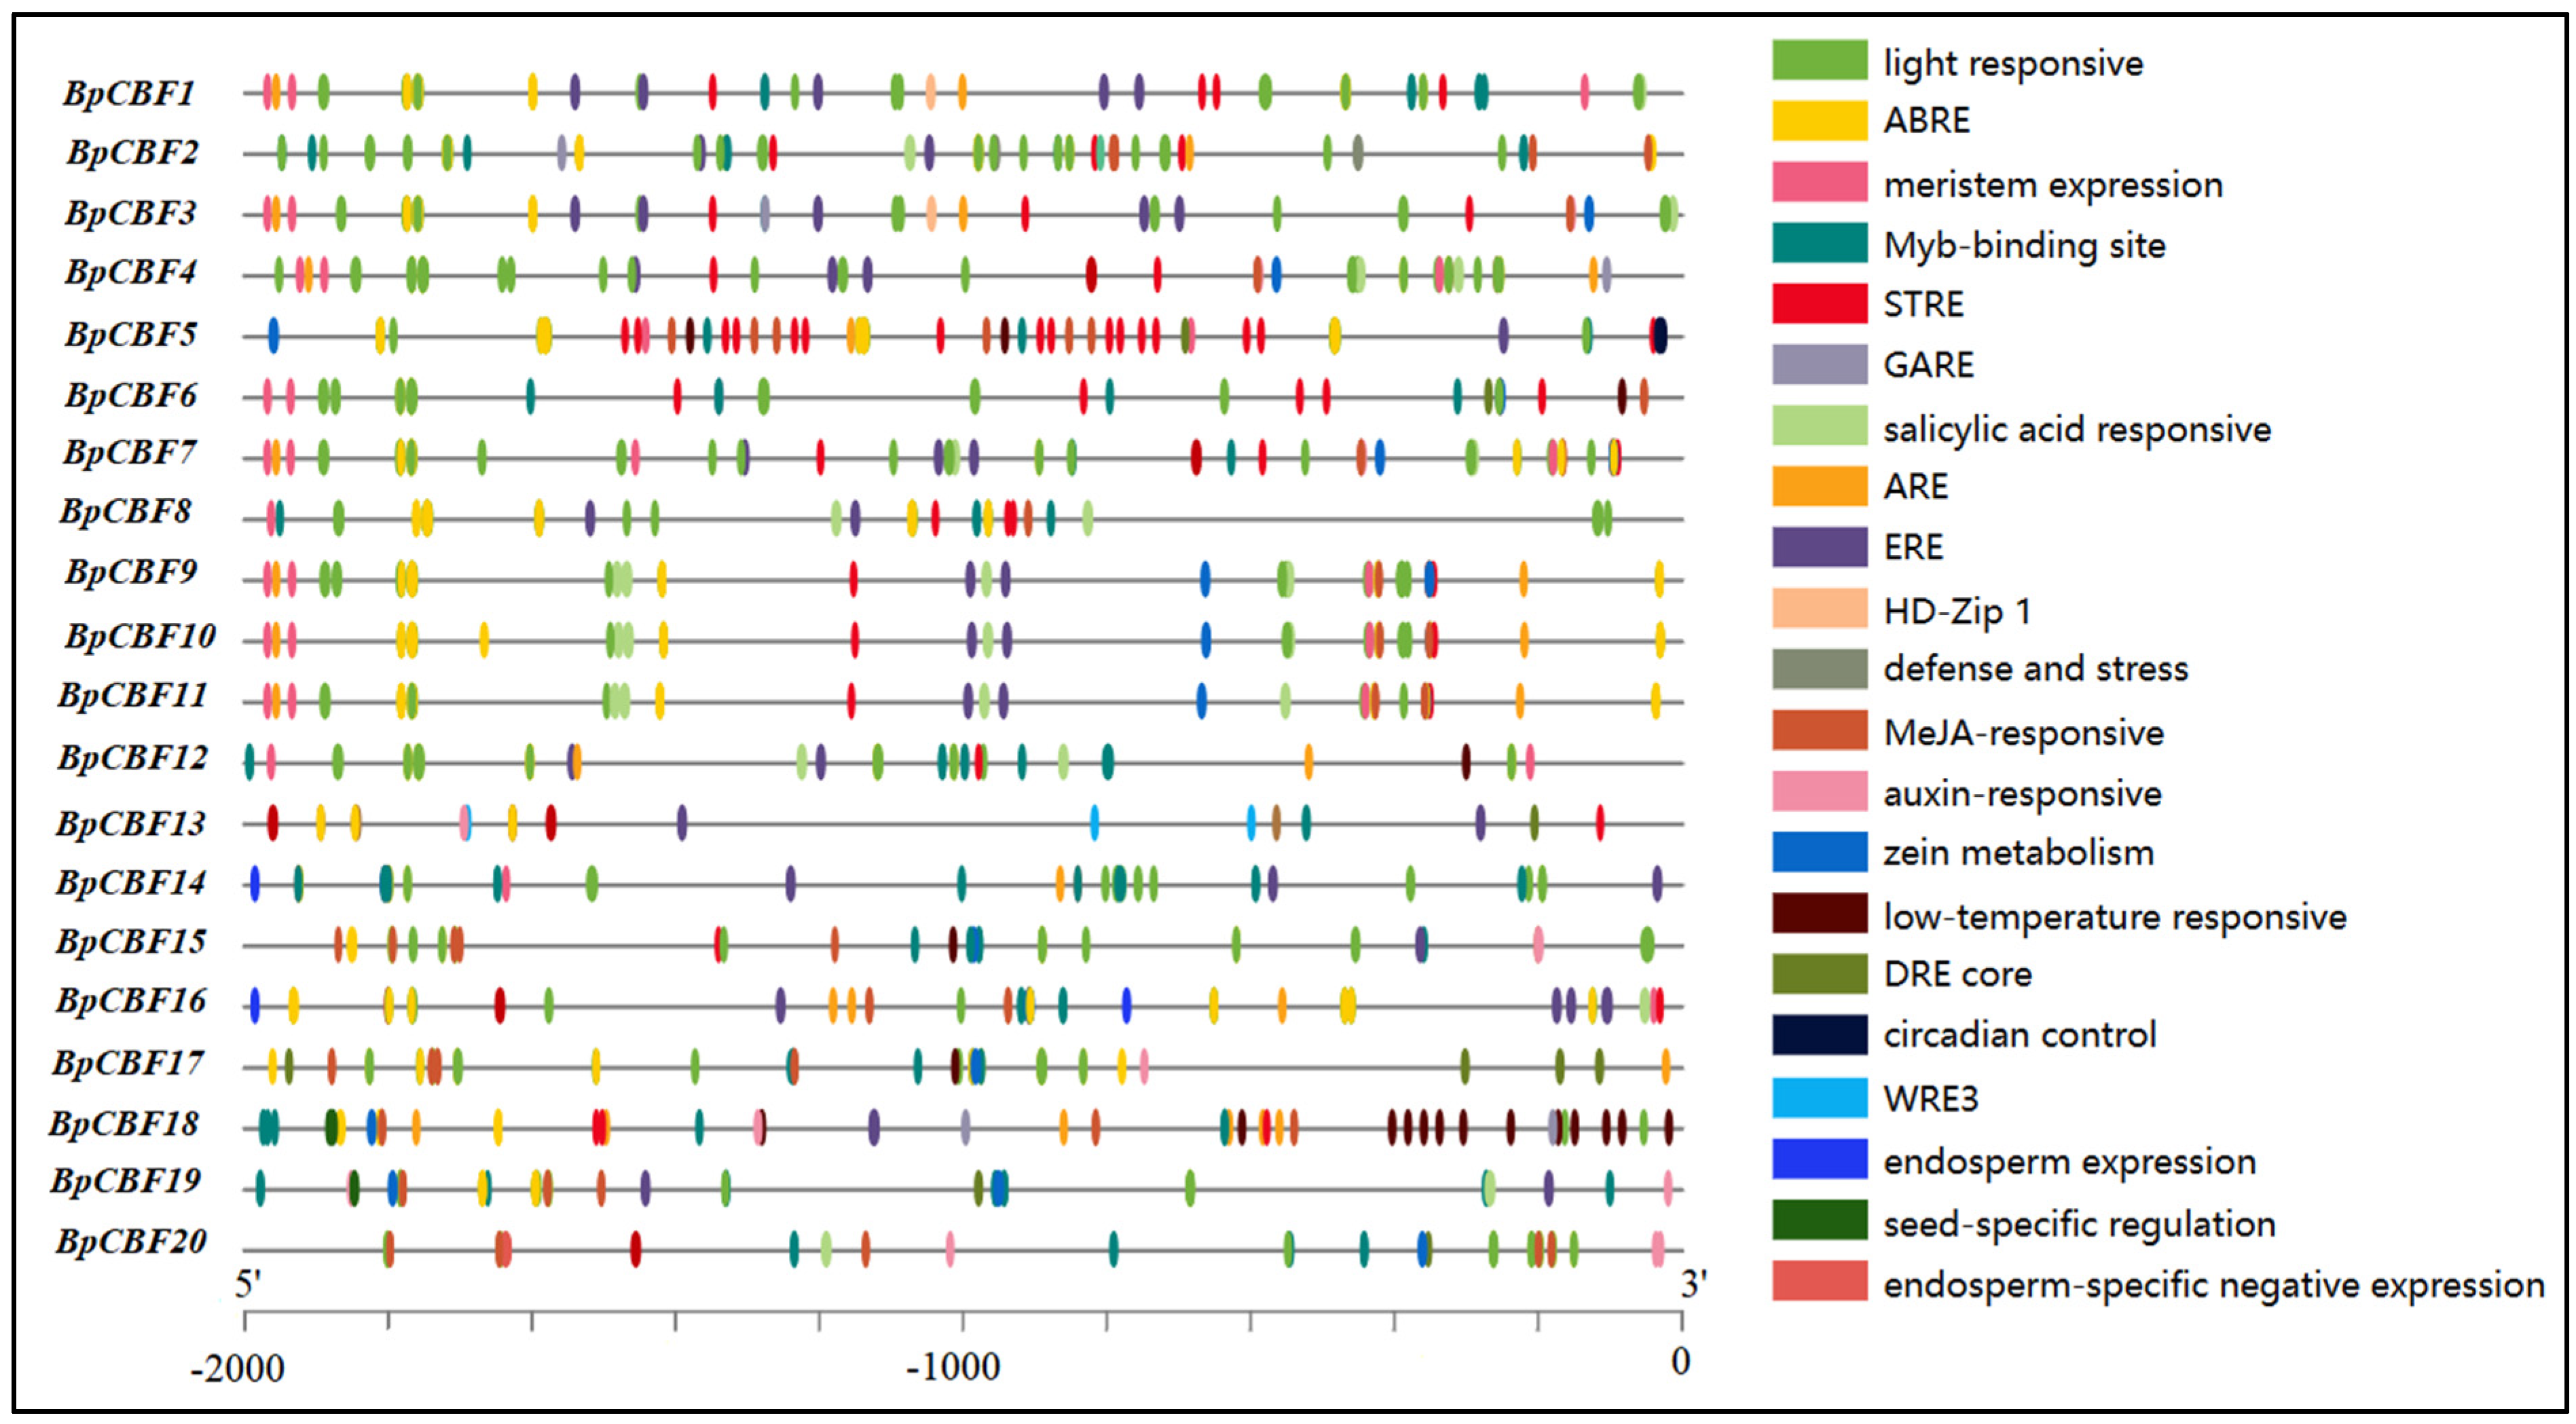
2.5. Analysis of Cis-Acting Elements in the Promoter Regions of BpCBFs

We identified 21 cis-acting elements that play key roles in plant growth by analyzing the 2000 bp sequences upstream the BpCBFs CDS. Analysis showed that these cis-acting elements included light-responsive elements, site-binding-related elements, development-related elements (Figure 6). And most environmental stress-related and hormone-related element components can be found in the promoter regions of BpCBFs, most frequent ones including light-responsive element (280), abscisic acid response element (ABRE, 199), MeJA-responsive element (99), Myb-bingding site (80) and stress response element (STRE, 60). Other elements like gibberellin response element (GARE), low-temperature response element, and other components can also be found (Table S6). Taking ABRE as an example, the promoter of BpCBF10 had the most ABRE, the number of which is 15. The promoter of BpCBF9 contained 14 ABRE, 14 for that of BpCBF11, −13 for that of BpCBF5. It showed that BpCBFs may be closely related to plant abiotic stress response.

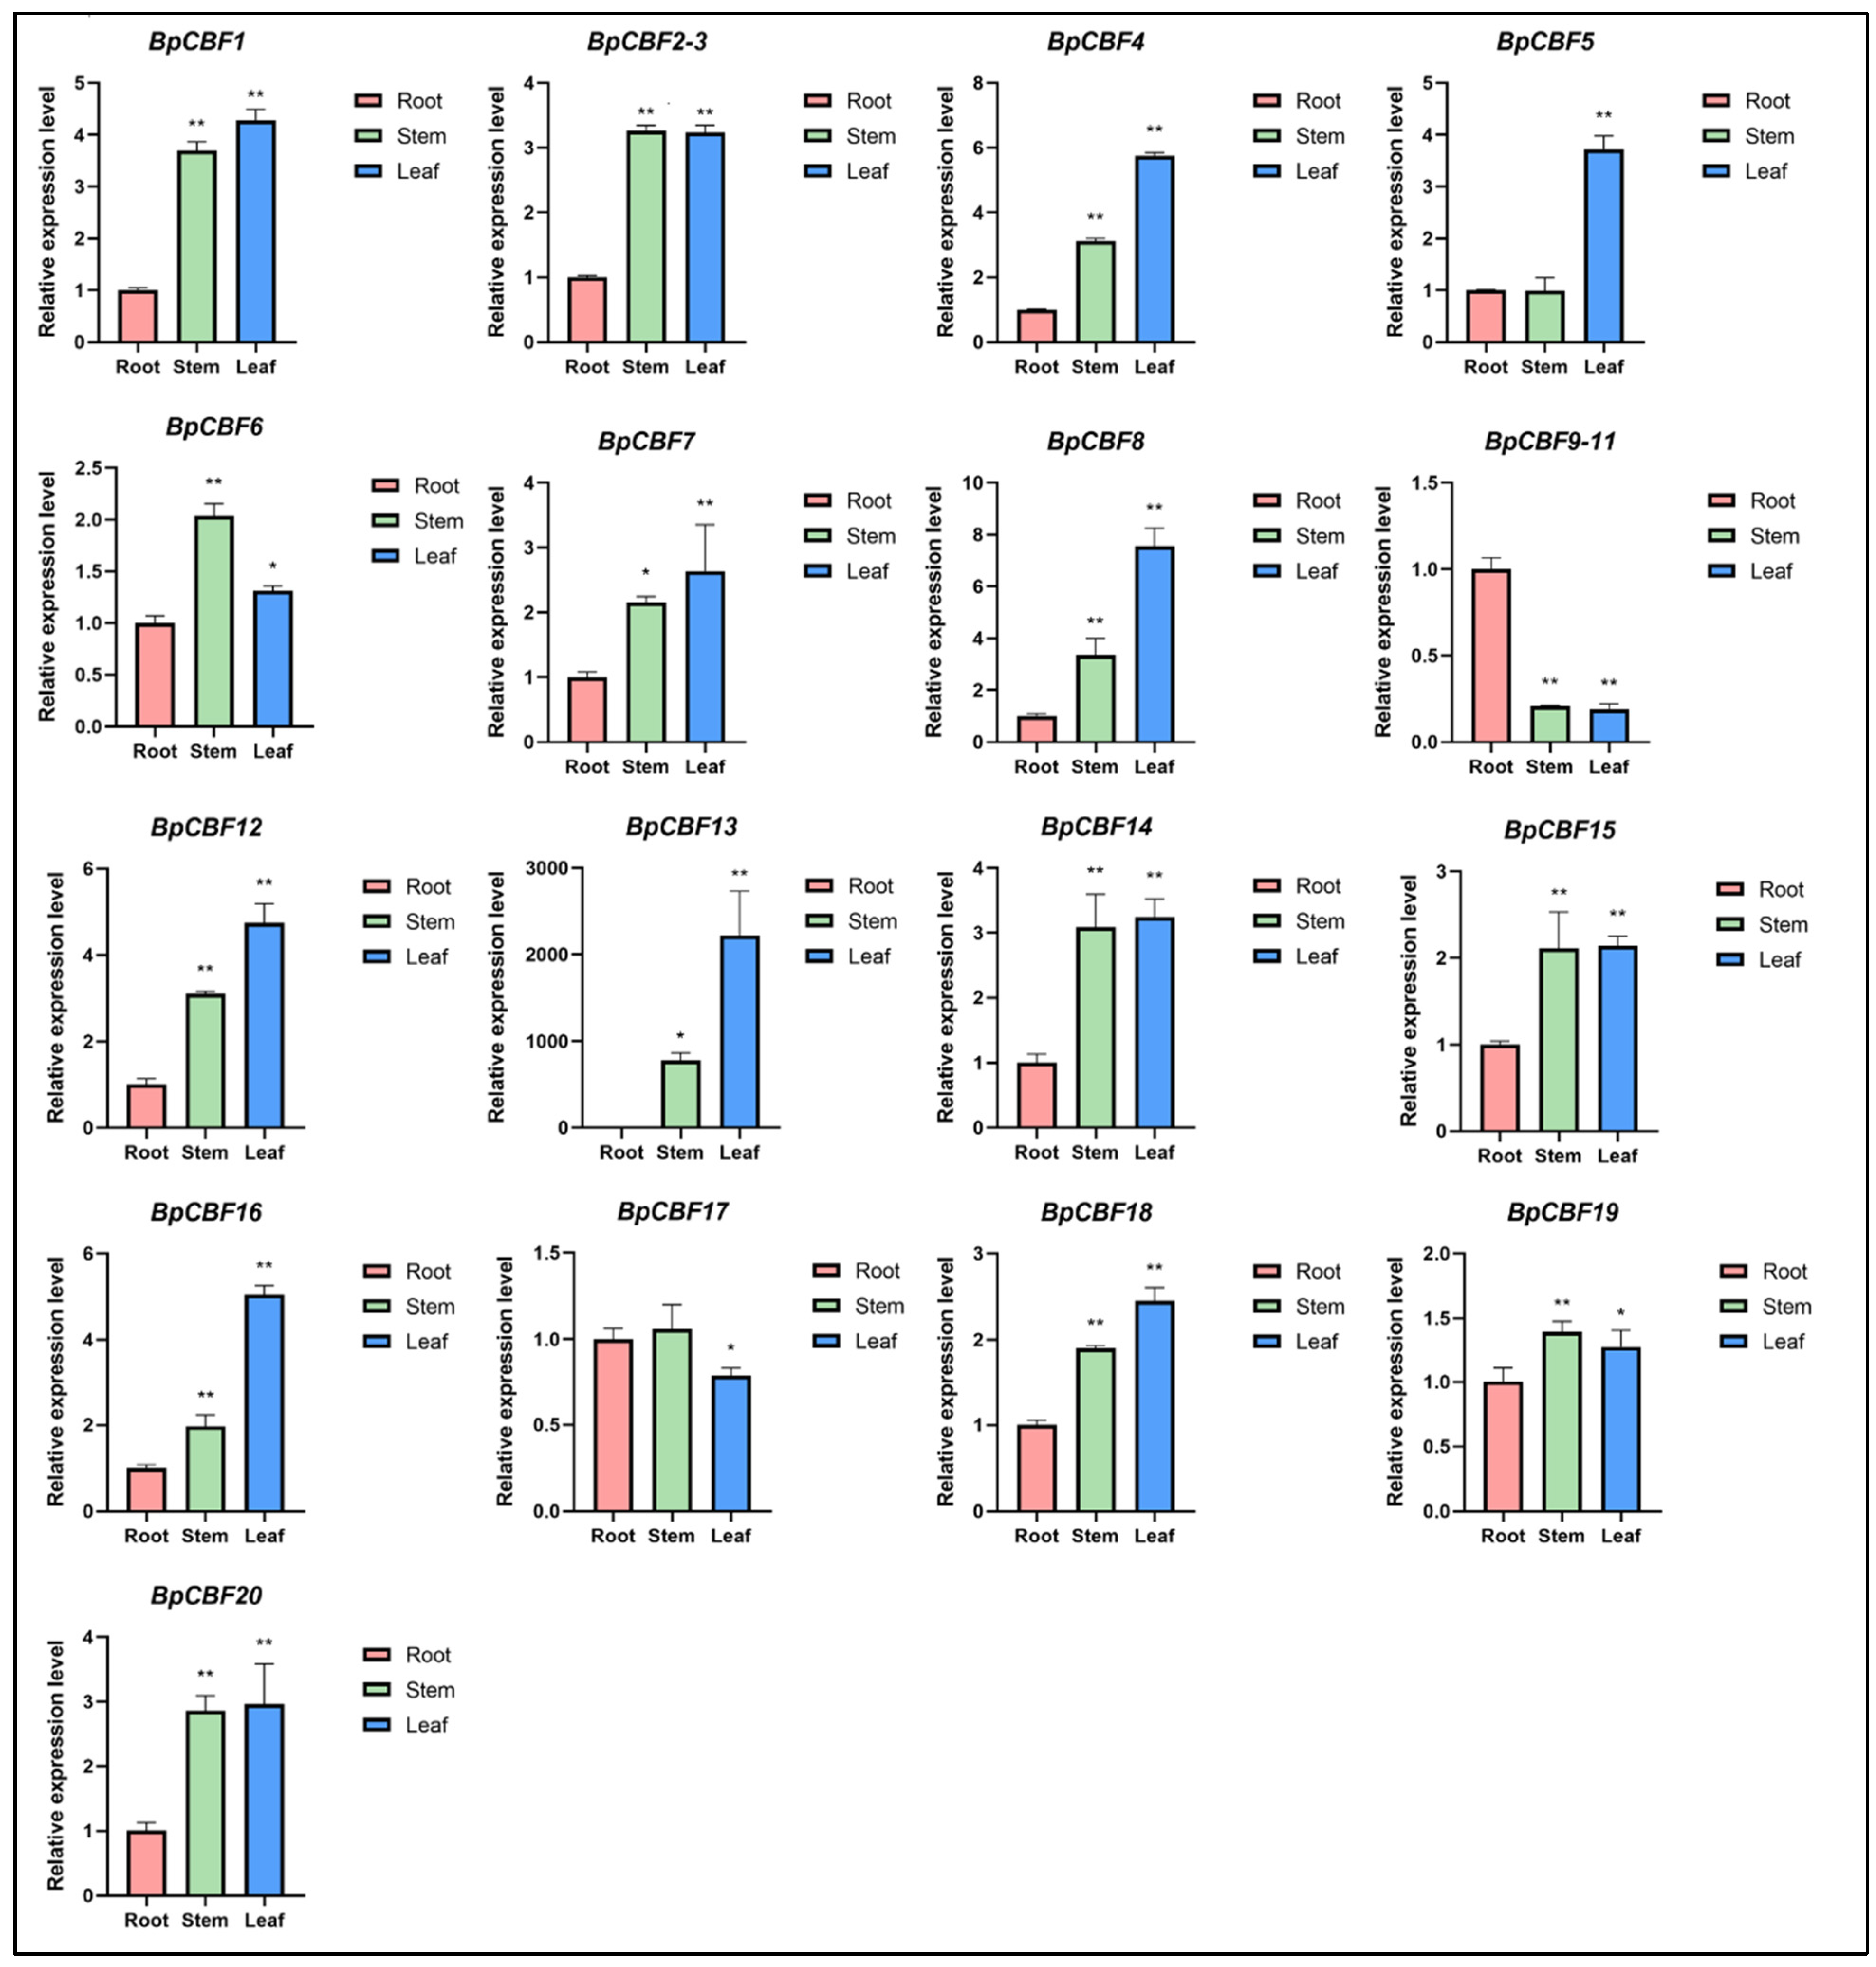
2.6. Tissue-Specific Expression Analysis of BpCBFs

To elucidate the expression patterns of BpCBFs, the relative expression levels of these genes in roots, stems and leaves of birch were measured using qRT-PCR (Figure 7). Overall, most of these genes were expressed at the highest levels in leaves, lower in stems and lowest in roots. Additionally, the difference degree between the relative expression levels of each gene in different tissues diverges between these genes. For instance, the relative expression level of BpCBF8 in leaves was 2.25 times that in stems and 7.55 times of that in roots. However, BpCBF20 was nearly expressed at the same level in stems and leaves, which is approximately three times that in roots. Apart from this trend, different expression patterns did exist. For instance, BpCBF6 and BpCBF19 had the highest expression levels in stems, lower expression levels in leaves and lowest expression levels in roots. BpCBF17 had the highest expression levels in roots, lower expression levels in leaves and lowest expression levels in leaves. The total expression levels of BpCBF9, BpCBF10 and BpCBF11 were significantly higher in roots than those in stems or leaves. All the related qRT-PCR data were listed in Table S7.

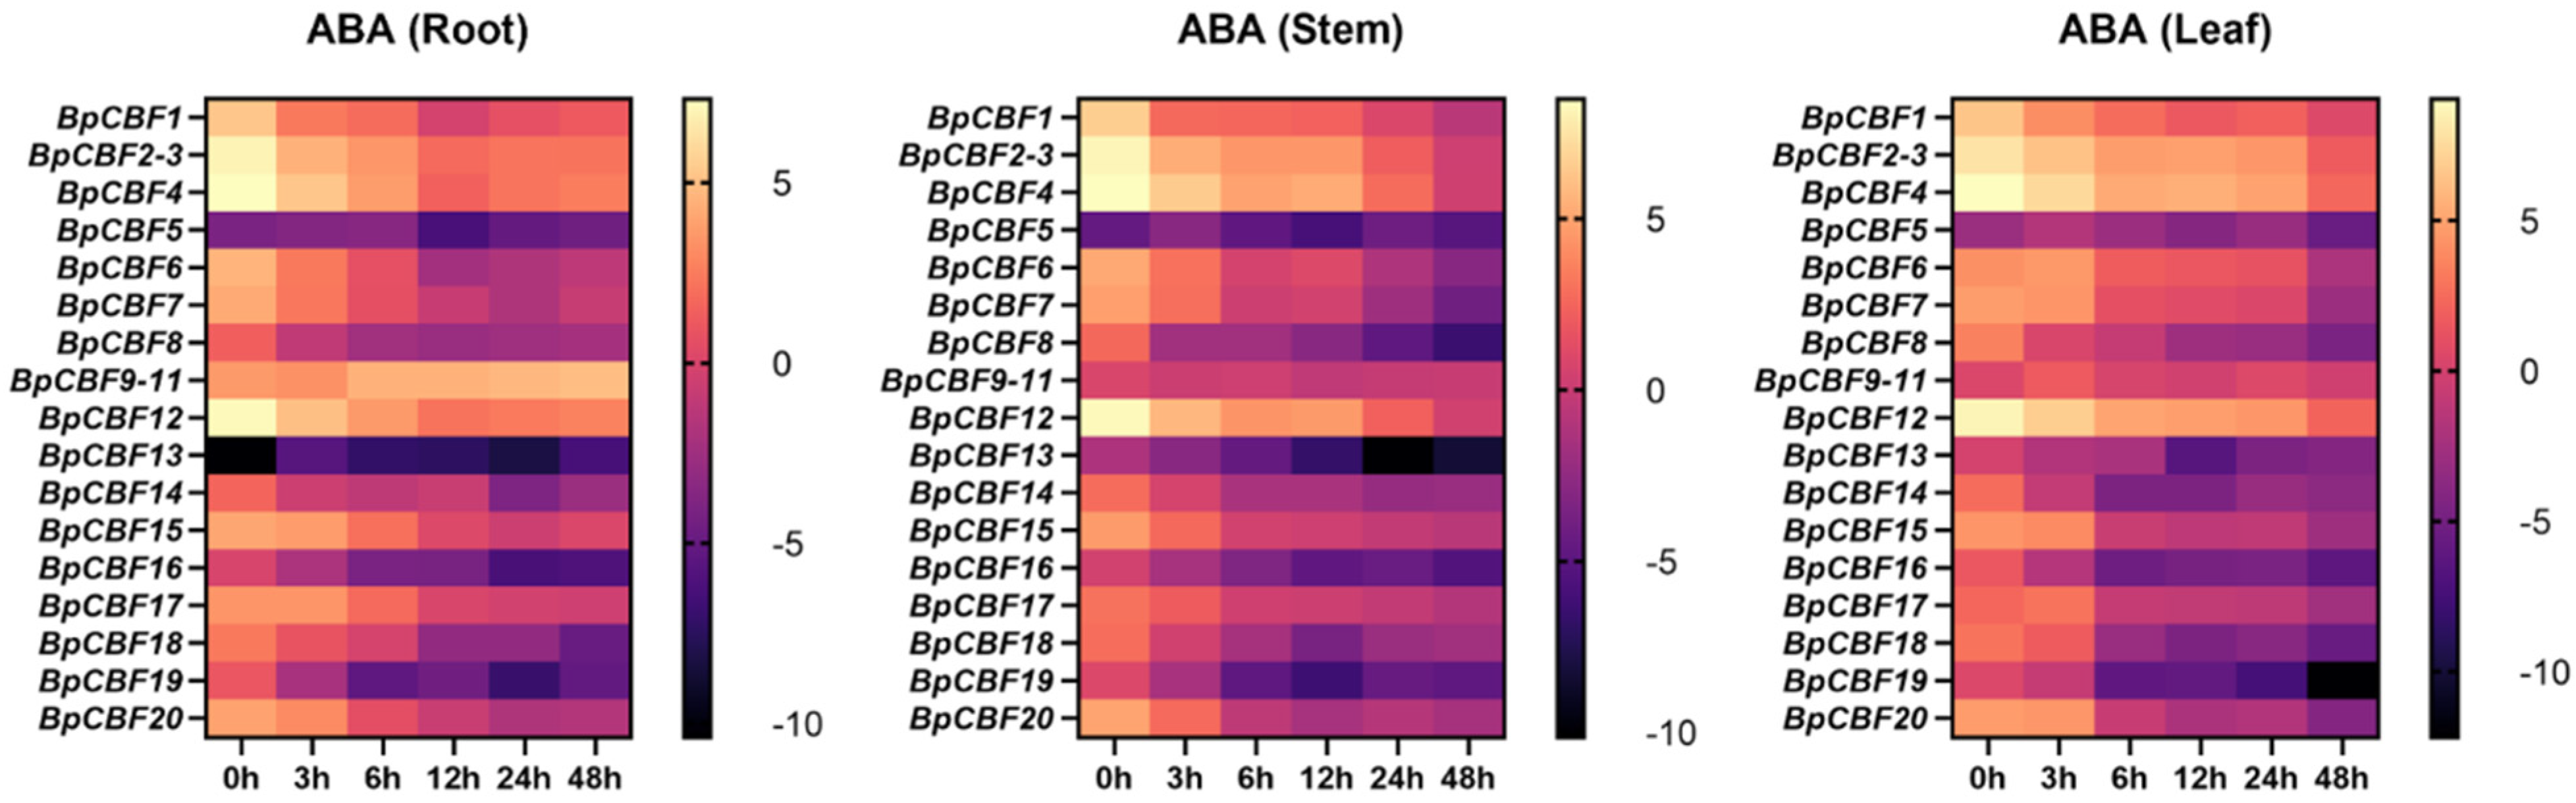
2.7. Tissue-Specific Expression Pattern Analysis of BpCBFs under ABA Treatment

The cis-acting element analysis of the 20 BpCBFs proved the necessity of studying the responses of these transcription factors upon stress conditions. To investigate the responses of the 20 BpCBFs upon ABA treatment, 100 μM ABA treatment was performed for different times (0 h, 3 h, 6 h, 12 h, 24 h and 48 h) on birch seedlings and the relative expression levels of these genes in roots, stems and leaves were measured by qRT-PCR (Figure 8). The results showed that most BpCBFs were responsive to ABA treatment. The expression patterns of these genes under ABA treatment were different while that of each gene in different tissues is similar. The expression levels of most BpCBFs decreased since the ABA treatment began, reached the minimum at 12 h or 24 h time point and bounced back to a certain extent thereafter. And the minimum of some relative expression levels showed a delayed effect in stems and leaves compared to roots. Taking BpCBF1 as an example, its expression level in roots decreased since the ABA treatment, reached the minimum at 12 h, and then increased at 24 h and 48 h. BpCBF4 and BpCBF12 were significantly down-regulated in roots since the ABA treatment, expressed the lowest levels at 12 h and increasingly expressed at 24 h and 48 h. The expression levels of some BpCBFs did not change as obviously as those of other members, such as BpCBF7, BpCBF17 and BpCBF20. All the data of expression level (log2 value) were listed in Table S8.

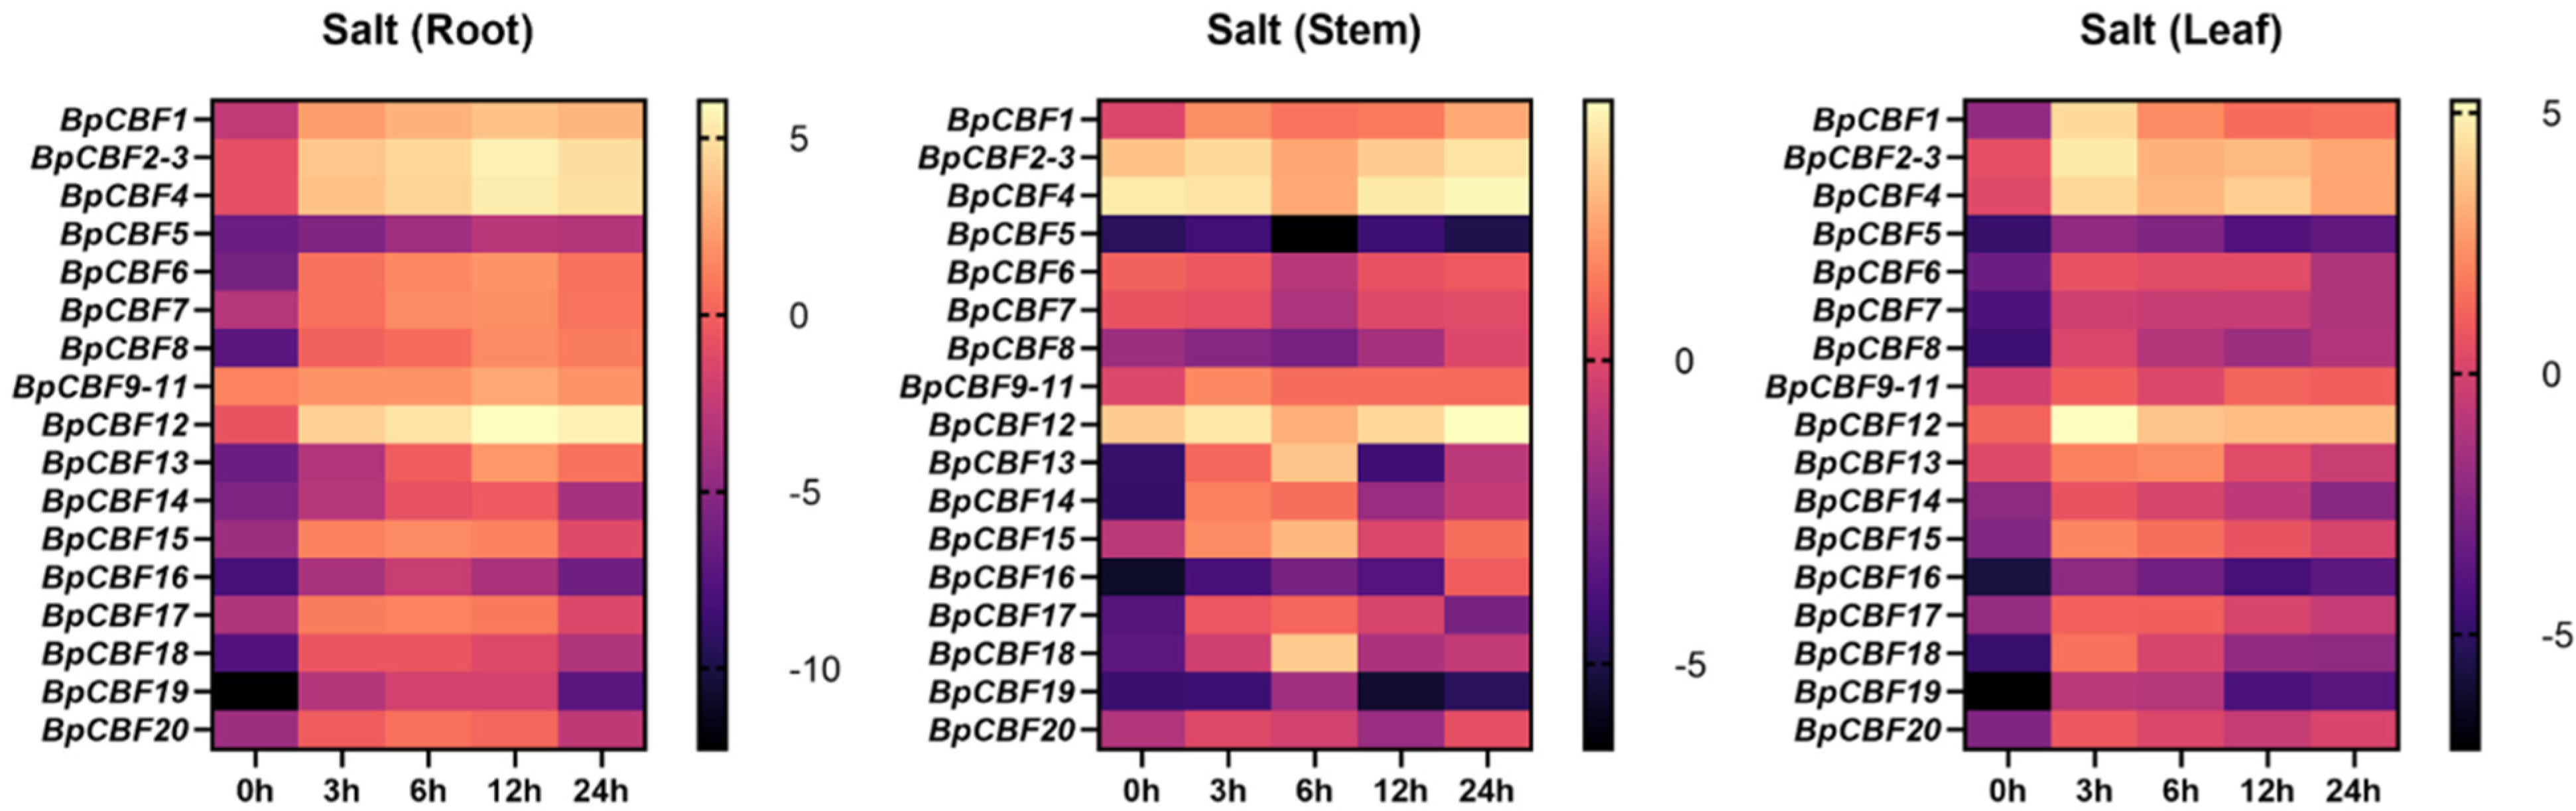
2.8. Tissue-Specific Expression Patterns Analysis of the BpCBFs under Salt Stress

To investigate the responses of the 20 BpCBFs upon salt treatment, 200 mM NaCl treatment was performed for different times (0 h, 3 h, 6 h, 12 h, 24 h and 48 h) on birch seedlings, and the relative expression levels of these genes in roots, stems and leaves were measured using qRT-PCR (Figure 9). The results showed that most of BpCBFs were up-regulated in different degrees after the salt treatment was performed, while the up-regulation reached the maximum at different time points and bounced back to a certain extent thereafter. The maximum of some expression levels showed an earlier effect in stems and leaves than in roots. Taking BpCBF1 as an example, its expression level in roots increased since the salt treatment began, reached the maximum at 12 h and then decreased at 24 h. BpCBF12 was the most expressed at 12 h time point in roots and then less expressed at 24 h. Some genes, such as BpCBF5 and BpCBF16, were not as responsive to salt treatment as other members. All the data of relative expression level (log2 value) were listed in Table S9.

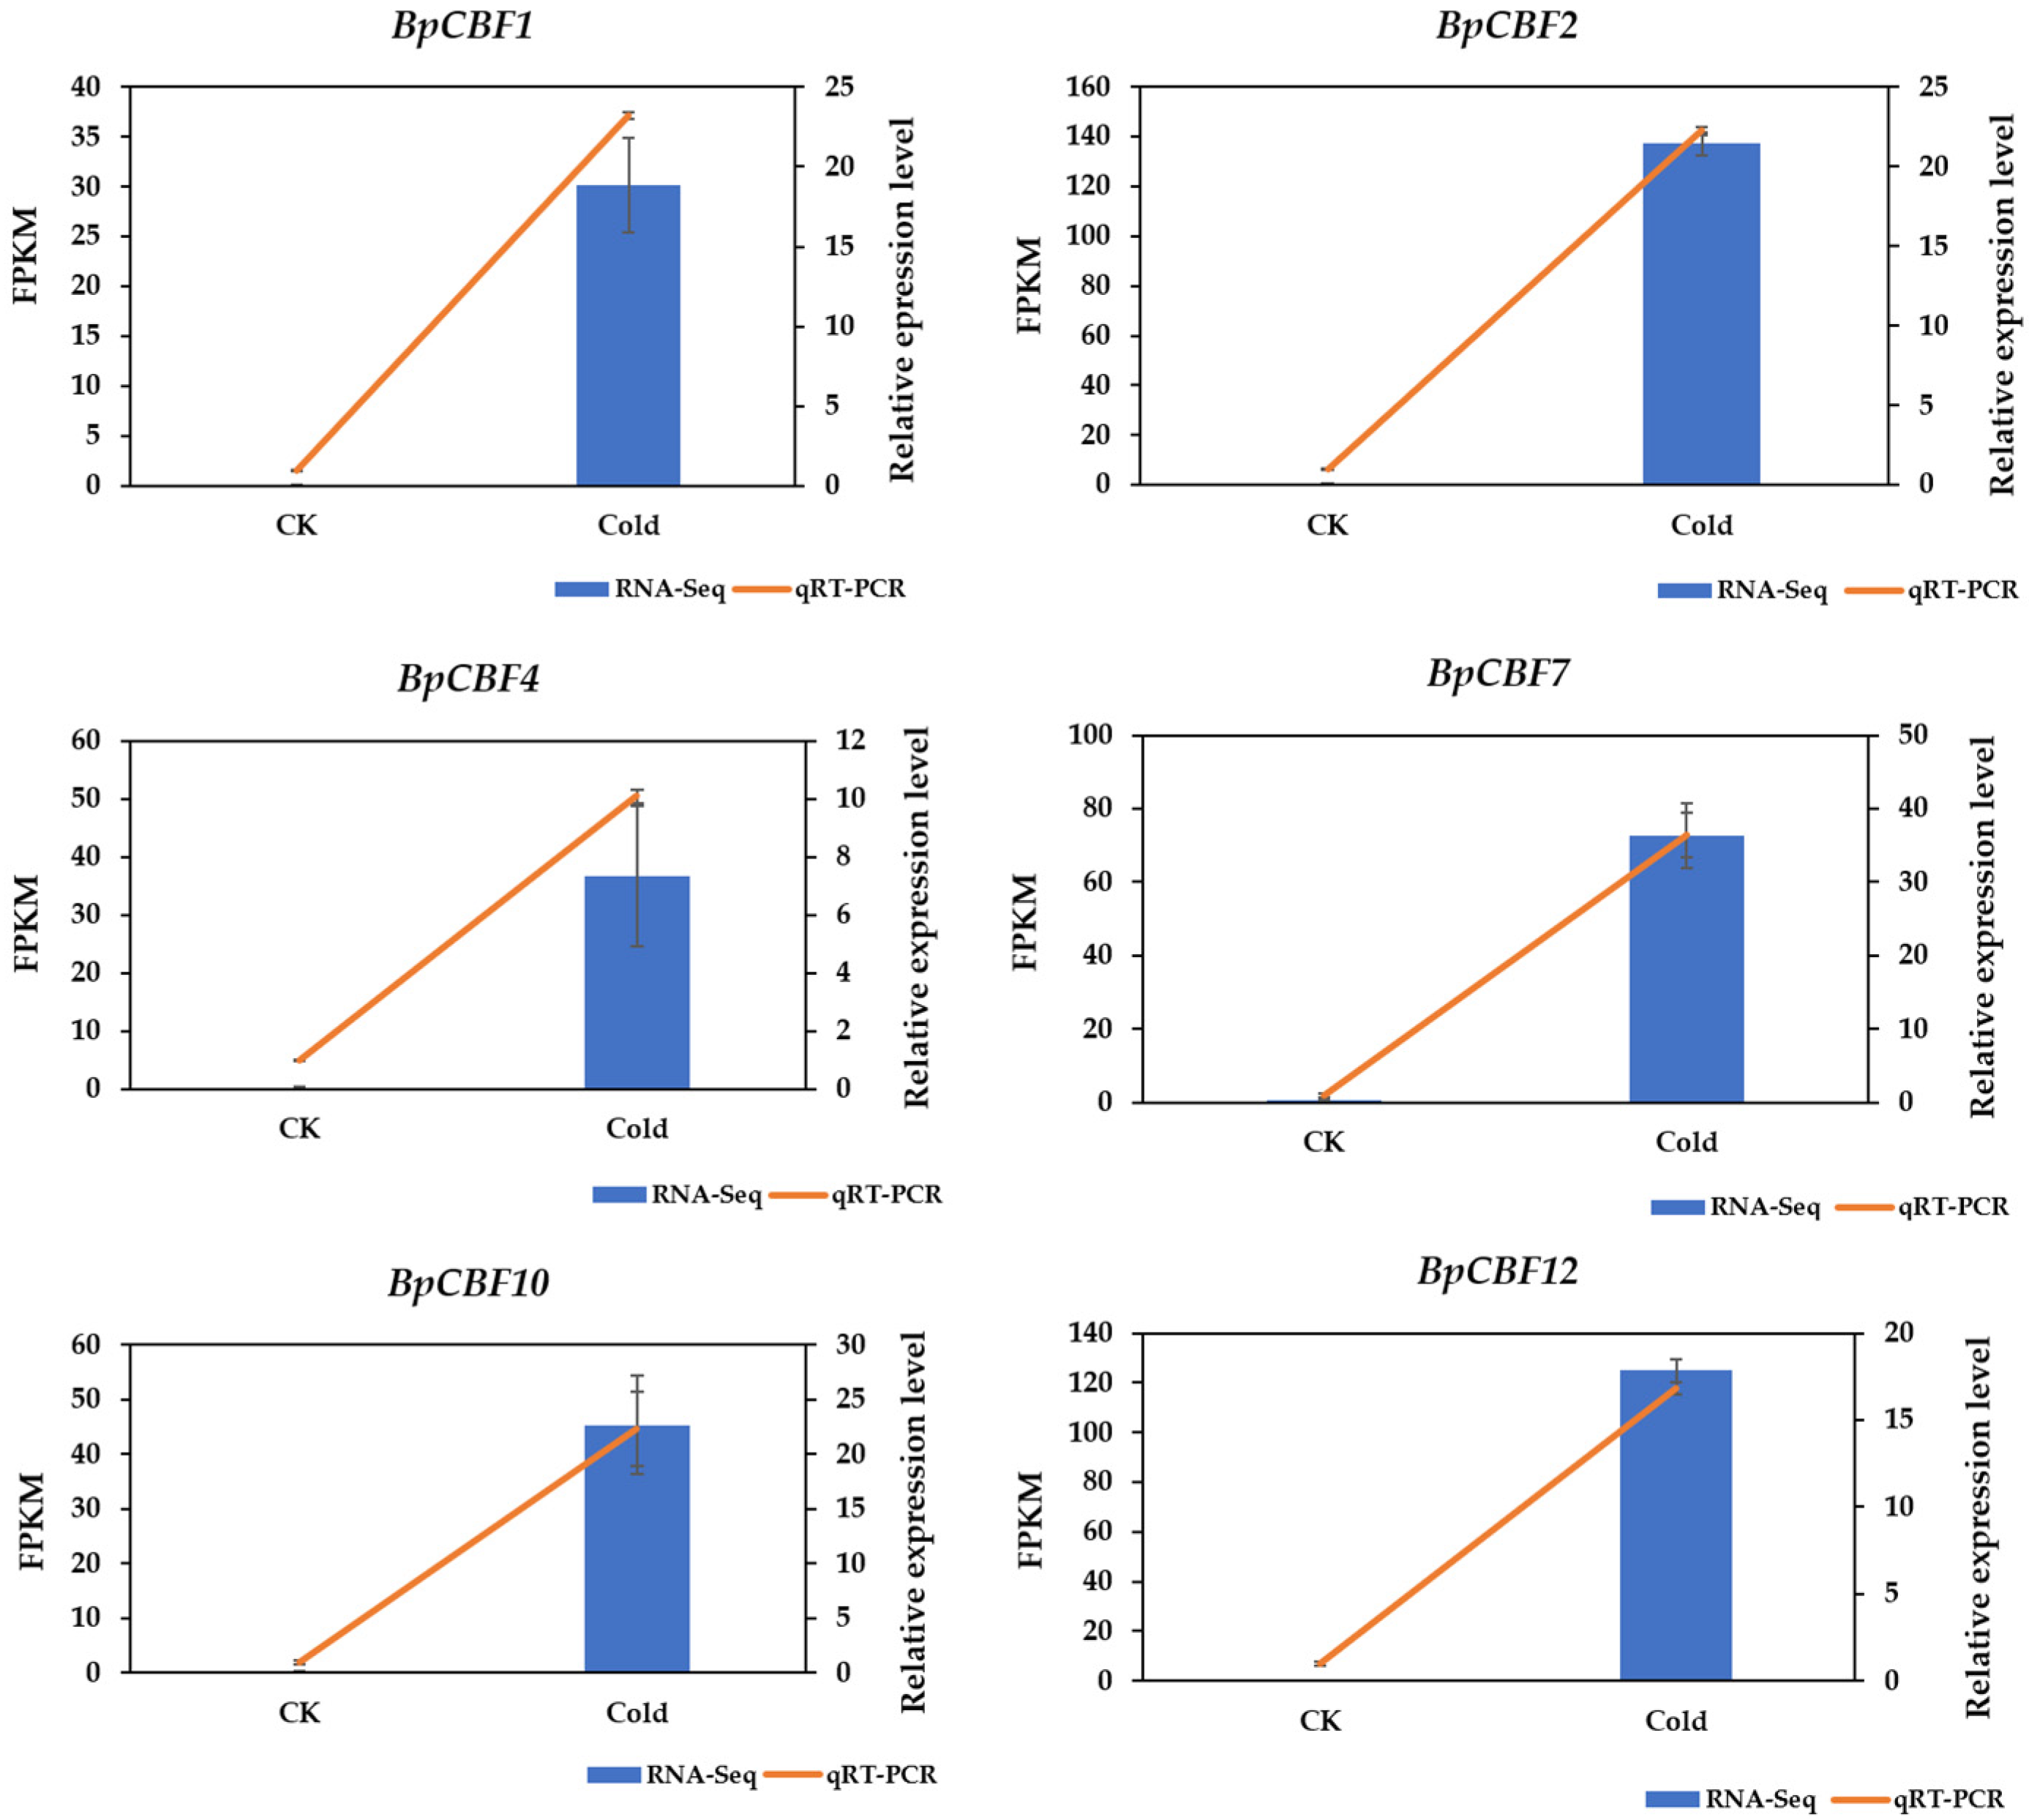
2.9. Identification of BpCBFs Responding to Cold Stress and Verification of RNA-Seq Data of Betula platyphylla under Cold Stress

For the verification of the RNA-seq data [38], the cold-responsive genes (BpCBF1, BpCBF2, BpCBF4, BpCBF7, BpCBF10 and BpCBF12) were selected for quantitative validation. As the results of tissue-specific expression pattern analysis showed, these genes were the most expressed in leaves, in which case their relative expression levels upon cold stress in leaves were determined by using qRT-PCR (Figure 10). These six genes were all significantly up-regulated upon cold treatment, and this trend is consistent with the result of the RNA-seq data analysis. The result of the RNA-seq data is displayed in Table S10. The related qRT-PCR data are listed in Table S11.

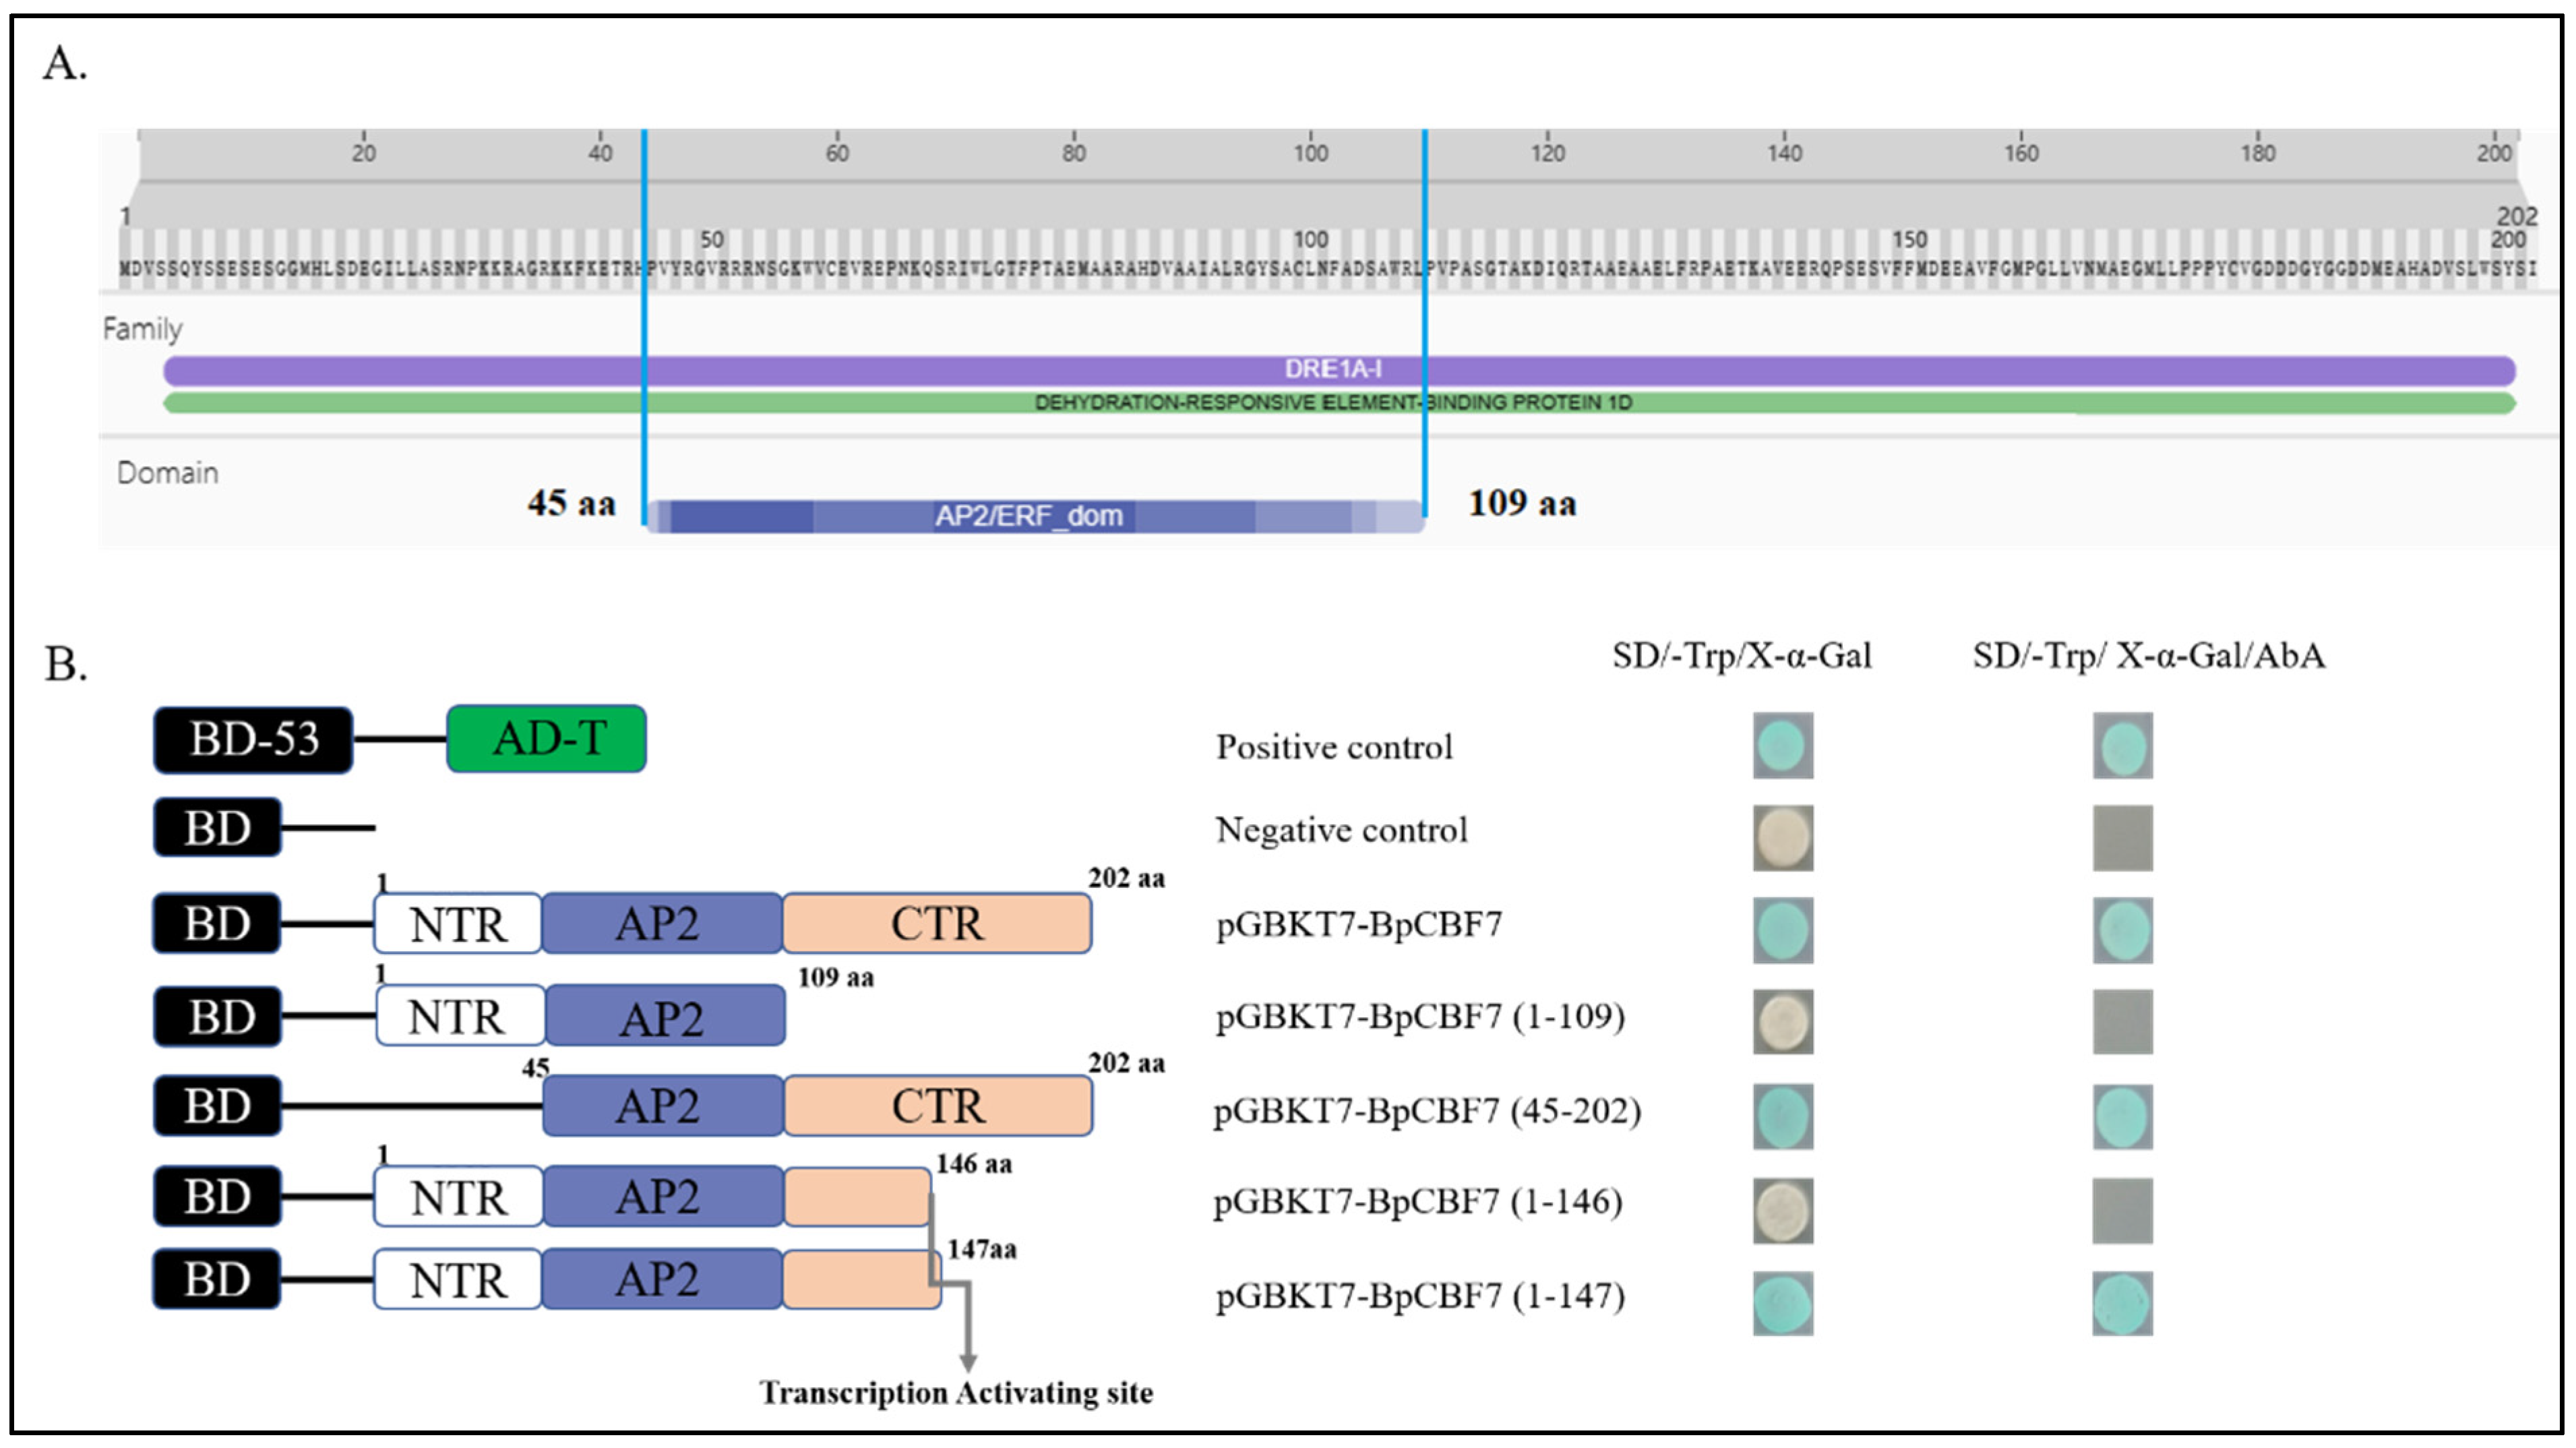
2.10. Transcription Activating Activity of BpCBFs Responsive to Cold Stress

The transcription activating activity of BpCBFs responsive to cold stress were investigated with BpCBF7 as a representative. A BpCBF7 gene was introduced into a pGBKT7 vector, and the recombinant vector was transformed into yeast cell. The negative control did not grow on the nutrition-deprived culture medium added with AbA, while the yeast transformed with pGBKT7-BpCBF7 could normally grow on this kind of culture medium, like positive control did (Figure 11). This result showed that BpCBF7 had self-activation. To further narrow the range where the self-activation site was located, different lengths of BpCBF7 sequence were introduced into the pGBKT7 vector. The result showed that the yeast transformed with pGBKT7-BpCBF7 (1–147) could normally grow on the nutrition-deprived culture medium added with AbA, while the yeast transformed with pGBKT7-BpCBF7 (1–146) could not. It can be deduced that the self-activation site was near the No. 147 amino acid site.

3. Discussion

Surviving in the changing environment, plants have to cope with all kinds of abiotic stresses with various molecular, biochemical and physiological methods, one of which is transcription regulation. CBF subfamily transcription factors, as important members of AP2/ERF transcription factor family, play important roles in plant stress response in many species [39]. In model plant Arabidopsis, six CBF transcription factors were identified and characterized in response to cold, drought or salt stress [4,5,6,11,12,13]. In woody plant Populus trichocarpa, six CBF transcription factors were identified [29], while their functions still remained undetermined. With the development of bioinformatic tools and sequencing, it is necessary to identify the CBF transcription factors in Betula platyphylla, a tree species with good adaptability and tolerance to abiotic stresses.
In this study, a total of 20 BpCBF transcription factor subfamily members were identified with AtCBFs as query sequences according to conserved domain characteristics. The increased subfamily members may explain the reason for the better defense of birch than Arabidopsis or poplar against abiotic stress. The basic properties and gene structures of BpCBFs were analyzed. As Figure 1D showed, BpCBF14-20 shared the same chromosome location, more similar gene structure and more similar motif distribution like Motif 8, from which it can be inferred that these seven genes possibly are the result of gene duplication event and endowed to birch a stronger defense against abiotic stresses. The results of collinearity analysis showed that BpCBF had more syntenic transcription factor pairs with PtCBF than that of AtCBF. The BpCBF14 had collinear genes in the other two plants, and there were collinear sites in the other two species, and only BpCBF14 showed collinearity with the AtCBFs, which implied that BpCBF14 was more conservative and might play important roles in certain biological process. It is worth noting that CBFs in poplar have collinear genes in Betula platyphylla except PtCBF2, from which can be inferred that the evolution of CBF transcription factors is conservative and plays an indispensable role in woody plants. The cis-acting elements in the promoters of BpCBFs were identified, including environmental stress-related and hormone-related element components, such as abscisic acid response element (ABRE), stress response element (STRE), gibberellin response element (GARE) and low-temperature response element. It can be inferred that CBF transcription factors in birch can be closely related to abiotic stress response. In this case, the tissue-specific expression patterns of BpCBFs under ABA or salt treatment were analyzed using qRT-PCR. Most BpCBFs were down-regulated since the ABA treatment began, reached the minimum at 12 h or 24 h time point and bounced back to a certain extent thereafter. And the minimum showed a delayed effect in stems and leaves compared to roots. Taking BpCBF1 as an example, its relative expression level in roots deceased since the ABA treatment, reached the minimum at 12 h and then increased at 24 h and 48 h. However, its relative expression levels in stems and leaves did not reach the minimum at 12 h. In contrast, most of BpCBFs were up-regulated since the salt treatment began, while the up-regulation reached the maximum at different time points and bounced back to a certain extent thereafter. The maximum showed an earlier effect in stems and leaves than in roots. Taking BpCBF1 as an example, its expression level in roots increased since the salt treatment began, reached the maximum at 12 h and then decreased at 24 h. However, its expression levels in stems and leaves reached the maximum at 3 h time point. The delayed or earlier effect may be due to the different responses of different plant tissues against different abiotic stresses. Otherwise, the relative expression levels of some BpCBFs did not change significantly upon ABA or salt stress, which was possibly due to their involvement in responses to other stresses or other biological processes. The analysis of the transcription activating activity of the cold-responsive BpCBFs showed that BpCBF7 had transcription activating activity, and the transcription activating site was near the No. 147 amino acid. Due to the high sequence similarity of these six BpCBFs near this site, we deduced that this region may contribute to the transcription activating activity of all these six BpCBFs.
The results in this study proved that most of the 20 BpCBF transcription factors were responsive to ABA or salt treatment, in different expression patterns. The six cold-responsive BpCBFs were all up-regulated upon cold treatment, which was consistent with the result of RNA-seq. The analysis of the transcription activating activity of the cold-responsive BpCBFs can provide a reference for future research on BpCBF protein functions.

4. Materials and Methods

4.1. Identification and Analysis of CBF Transcription Factor Family in Betula platyphylla

The amino acid sequences of the 6 Arabidopsis thaliana CBFs (AT1G12610, AT1G63030, AT4G25470, AT4G25480, AT4G25490 and AT5G51990) were downloaded from the Phytozome v13.1 database (https://phytozome.jgi.doe.gov/pz/portal.html (accessed on 24 April 2023)). Two methods were used to screen and identify CBF subfamily members in Betula platyphylla. On the one hand, AtCBFs were used as query sequences to search for CBF sequences in Betula platyphylla through BlastP [40]. On the other hand, the HMM file of CBF (AP2: PF00847) was retrieved from the Pfam database (http://pfam.xfam.org/ (accessed on 26 April 2023)), and HMMER v3.1 [41] tool was used to obtain putative CBF family members from the Betula platyphylla database. Additionally, another two conservative domains were used for further verification according to Nie’s method [8]. Finally, we reserved the sequences of BpCBFs, including 20 members, that contained all the three conserved domains. Basic characteristics of the BpCBF amino acid sequences were analyzed using ExPASy (http://www.expasy.org/ (accessed on 27 April 2023)), such as molecular weight, isoelectric point, amino acid number, aliphatic index and hydrophilic mean (GRAVY) score.

4.2. Analysis of Gene Structure and Conserved Motifs

The gene sequences and CDS of BpCBFs were downloaded from Phytozome, and then analyzed with the online software GSDS 2.0 (Gene Structure Display Server: http://gsds.cbi.pku.edu.cn/ (accessed on 30 April 2023)) for exon and intron distribution patterns. The online software MEME 5.0 (http://meme-suite.org/ (accessed on 1 May 2023)) was used to predict the conserved motifs of the BpCBF protein sequences.

4.3. Multiple Sequence Alignment and Phylogenetic Analysis of the 20 BpCBFs

Multiple sequence alignment of amino acid sequences was performed using BioEdit (version 7.2.5), and the conserved motifs were checked using TBtools-II (v1.120) software. The phylogenetic tree (1000 bootstrap replications) was constructed with CBF subfamily members in Betula platyphylla, Populus trichocarpa and Arabidopsis thaliana via neighbor-joining (NJ) method using MEGA v7.0 software.

4.4. Chromosome Distribution and Gene Duplication

The location information of the BpCBFs was retrieved from Phytozome database and Tbtools-II (v1.120) was used to visualize the chromosome distribution. Gff3 (General Feature Format 3) files of Betula platyphylla v1.1, Arabidopsis thaiana TAIR10 and Populus trichocarpa v4.1 were searched and downloaded from Phytozome. Tbtools software was used to construct collinear analysis diagram and explore the gene duplication events of BpCBFs.

4.5. Analysis of Cis-Acting Elements

The 2000 bp sequence upstream of BpCBF CDS was collected from the Phytozome database (www.Phytozome.net, accessed on 6 May 2023) and was analyzed using the PlantCARE online service platform (http://bioinformatics.psb.ugent.be/webtools/plantcare/html/ (accessed on 6 May 2023)). The generated cis-acting elements were visualized by Tbtools.

4.6. Plant Materials, Growth Conditions, Treatments and Sampling

Birch (Betula platyphylla) seedlings were preserved by the State Key Laboratory of Tree Genetics and Breeding, Northeast Forestry University (Harbin). The seedlings for experiment use grew for 60 days in hydroponic culture (1/2 MS medium with 25 g/L sucrose, 0.02 mg/L NAA and 0.4 mg IBA) and then through homogenization. Seedlings were treated in hydroponic culture containing 100 μM ABA [42] or 200 mM NaCl [43]. Growth conditions were set with 16-h light/8 h darkness in a greenhouse at 25 °C. The ABA treatment time was 0 h, 3 h, 6 h, 12 h, 24 h, 48 h, and the salt treatment time was 0 h, 3 h, 6 h, 12 h, 24 h. The birch seedlings were grown in tissue culture containers for 60 days, then transplanted to soil, and grew for another 30 days for cold treatment at 4 °C for 3 h [38].
After ABA treatment and salt treatment, roots, stems and leaves of the plants were sampled, respectively. After cold treatment, only leaves of the plants were sampled. The nutrient solution on the surface was rinsed with deionized water, and then the excess water was absorbed with absorbent tissue. The collected plant tissue samples were immediately frozen in liquid nitrogen and stored in a refrigerator at −80 °C for subsequent analysis. In order to obtain reproducible results, there were three sets of biological replicates.

4.7. RNA Extraction and Expression Analysis

Total RNA was extracted from different birch tissues (roots, stems and leaves) using RNA extraction kit (Bioteke). RNA concentration was measured, and its quality was examined by electrophoresis with 1% agarose gel. Then, single-stranded cDNA was synthesized using reverse transcription kit (PrimeScriptTM RT reagent Kit, Takara Bio, Kusatsu, Japan). Quantitative primers were designed according to the downloaded full-length cDNA sequences of BpCBFs, and the internal reference gene was 18S ribosomal RNA [44].
The cDNA obtained by reverse transcription was diluted 10 times and used as the template for qRT-PCR. Based on SYBR Green fluorescence program, the qRT-PCR experiment was performed using THUNDERBIRD Next SYBR qPCR Mix (TOYOBO, Osaka, Japan). The total reaction volume was 20 μL. The specific reaction conditions were as follows: 95 °C for 5 min, then 95 °C for 15 s, 60 °C for 5 min for 45 cycles. The amplification reaction was carried out on Applied Biosystems 7500 Fast Real-Time PCR System. All reactions were repeated 3 times, and the analysis of relative expression levels of genes was carried out with the 2−ΔΔCt method [45].
Primers used in qRT-PCR were designed by Primer 5.0 (Premier Biosoft, Palo Alto, CA, USA), listed in Table S12. Due to high sequence similarity, a pair of primers was designed for the simultaneous quantification of BpCBF2 and BpCBF3, and another pair of primers for BpCBF9, BpCBF10 and BpCBF11. The heatmaps of tissue-specific expression analysis of BpCBFs were constructed by GraphPad Prism 9.0.0. Difference significances were analyzed with Duncan’s multiple range test method (p < 0.05).

4.8. Identification of Transcriptional Activation Activity of BpCBFs

To identify the transcriptional activation activity of the six cold-responsive BpCBFs, the BpCBF7 as a representative, was introduced into pGBKT7 yeast expression vector. The recombinant pGBKT7- BpCBF7, pGBKT-53/pGADT7-T (positive control) and pGBKT7 (negative control) were transformed into yeast competent cells (Y2H), which were then cultured on the nutrition-deprived yeast culture medium for 3–5 d at 30 °C. Added in the yeast culture medium, X-α-Gal (40 mg/L in culture medium) and AbA (500 ng/L in culture medium) were for the detection of whether yeast GAL4 system was activated.

5. Conclusions

In this study, a total of 20 CBF transcription factor subfamily members in Betula platyphylla were identified and can be classified into three clades. The conserved domains, physicochemical properties, phylogenetic relationship, exon-intron gene structure and the structure of conserved protein motifs of BpCBF were analyzed. The collinearity analysis of CBF genes was performed between Betula platyphylla and Arabidopsis thaliana and Betula platyphylla and Populus trichocarpa. The cis-acting elements in the promoter region of BpCBFs were identified, which were mainly related to environmental stress-related and hormone-related element components. The expression patterns of the 20 BpCBFs upon ABA or salt treatment showed that most of these transcription factors were responsive to ABA or salt stress, however, in different degrees in different tissues. The up-regulation of relative expression levels of the six cold-responsive genes was consistent with the result of RNA-seq. BpCBF7, as a representative of the six cold-responsive transcription factors, showed transcription activating activity. All these results indicate that CBF transcription factors in Betula platyphylla play a significant role in ABA, salt or cold response of birch.

Supplementary Materials

The following supporting information can be downloaded at: https://www.mdpi.com/article/10.3390/ijms241310573/s1.

Author Contributions

Bioinformatic analysis, samples collection, experiment conduction, data analysis, manuscript writing, X.Z. and J.Y.; Database data collection, collinearity analysis, R.W.; Sequence Screening, W.L.; Database searching and summarization, S.C. (Song Chen); Graph generation, Y.W. and Y.Y.; Plant materials, manuscript revision, S.C. (Su Chen) and G.Q. All authors have read and agreed to the published version of the manuscript.

Funding

This research was funded by the Fundamental Research Funds for the Central Universities, grant number 2572018AA32.

Institutional Review Board Statement

Not applicable.

Data Availability Statement

Not applicable.

Conflicts of Interest

The authors declare no conflict of interest.

References

  1. Ma, X.; Yin, Y.F.J.; Chen, W.; Sun, L.; Xiao, Y. Research progress of NAC transcription factors in plant. Plant Physiol. J. 2021, 57, 2225–2234. [Google Scholar] [CrossRef]
  2. Fujimoto, S.Y.; Ohta, M.; Usui, A.; Shinshi, H.; Ohme-Takagi, M. Arabidopsis ethylene-responsive element binding factors act as transcriptional activators or repressors of GCC box-mediated gene expression. Plant Cell 2000, 12, 393–404. [Google Scholar] [CrossRef] [PubMed] [Green Version]
  3. Yu, Y.; Yu, M.; Zhang, S.; Song, T.; Zhang, M.; Zhou, H.; Wang, Y.; Xiang, J.; Zhang, X. Transcriptomic Identification of Wheat AP2/ERF Transcription Factors and Functional Characterization of TaERF-6-3A in Response to Drought and Salinity Stresses. Int. J. Mol. Sci. 2022, 23, 3272. [Google Scholar] [CrossRef] [PubMed]
  4. Stockinger, E.J.; Gilmour, S.J.; Thomashow, M.F. Arabidopsis thaliana CBF1 encodes an AP2 domain-containing transcriptional activator that binds to the C-repeat/DRE, a cis-acting DNA regulatory element that stimulates transcription in response to low temperature and water deficit. Proc. Natl. Acad. Sci. USA 1997, 94, 1035–1040. [Google Scholar] [CrossRef] [Green Version]
  5. Shinwari, Z.K.; Nakashima, K.; Miura, S.; Kasuga, M.; Seki, M.; Yamaguchi-Shinozaki, K.; Shinozaki, K. An Arabidopsis gene family encoding DRE/CRT binding proteins involved in low-temperature-responsive gene expression. Biochem. Biophys. Res. Commun. 1998, 250, 161–170. [Google Scholar] [CrossRef]
  6. Novillo, F.; Medina, J.; Salinas, J. Arabidopsis CBF1 and CBF3 have a different function than CBF2 in cold acclimation and define different gene classes in the CBF regulon. Proc. Natl. Acad. Sci. USA 2007, 104, 21002–21007. [Google Scholar] [CrossRef] [Green Version]
  7. Liu, Y.; Dang, P.; Liu, L.; He, C. Cold acclimation by the CBF-COR pathway in a changing climate: Lessons from Arabidopsis thaliana. Plant Cell Rep. 2019, 38, 511–519. [Google Scholar] [CrossRef] [Green Version]
  8. Nie, Y.; Guo, L.; Cui, F.; Shen, Y.; Ye, X.; Deng, D.; Wang, S.; Zhu, J.; Wu, W. Innovations and stepwise evolution of CBFs/DREB1s and their regulatory networks in angiosperms. J. Integr. Plant Biol. 2022, 64, 2111–2125. [Google Scholar] [CrossRef]
  9. Novillo, F.; Alonso, J.M.; Ecker, J.R.; Salinas, J. CBF2/DREB1C is a negative regulator of CBF1/DREB1B and CBF3/DREB1A expression and plays a central role in stress tolerance in Arabidopsis. Proc. Natl. Acad. Sci. USA 2004, 101, 3985–3990. [Google Scholar] [CrossRef] [Green Version]
  10. Gilmour, S.J.; Fowler, S.G.; Thomashow, M.F. Arabidopsis transcriptional activators CBF1, CBF2, and CBF3 have matching functional activities. Plant Mol. Biol. 2004, 54, 767–781. [Google Scholar] [CrossRef]
  11. Haake, V.; Cook, D.; Riechmann, J.L.; Pineda, O.; Thomashow, M.F.; Zhang, J.Z. Transcription factor CBF4 is a regulator of drought adaptation in Arabidopsis. Plant Physiol. 2002, 130, 639–648. [Google Scholar] [CrossRef] [PubMed] [Green Version]
  12. Nakashima, K.; Ito, Y.; Yamaguchi-Shinozaki, K. Transcriptional regulatory networks in response to abiotic stresses in Arabidopsis and grasses. Plant Physiol. 2009, 149, 88–95. [Google Scholar] [CrossRef] [Green Version]
  13. Lehti-Shiu, M.D.; Uygun, S.; Moghe, G.D.; Panchy, N.; Fang, L.; Hufnagel, D.E.; Jasicki, H.L.; Feig, M.; Shiu, S.H. Molecular Evidence for Functional Divergence and Decay of a Transcription Factor Derived from Whole-Genome Duplication in Arabidopsis thaliana. Plant Physiol. 2015, 168, 1717–1734. [Google Scholar] [CrossRef] [PubMed] [Green Version]
  14. Pino, M.T.; Skinner, J.S.; Jeknic, Z.; Hayes, P.M.; Soeldner, A.H.; Thomashow, M.F.; Chen, T.H. Ectopic AtCBF1 over-expression enhances freezing tolerance and induces cold acclimation-associated physiological modifications in potato. Plant Cell Environ. 2008, 31, 393–406. [Google Scholar] [CrossRef] [PubMed]
  15. Zhana, C.X.; Xu, J.; Lia, D.; Liua, B.; Fengb, Y.; Wanga, X. Overexpression of AtCBF1 in Sinningia speciosa Enhances Chilling Stress Tolerance. J. Bot. Sci. 2015. [Google Scholar]
  16. Storani, L.; Hernando, C.E.; Staneloni, R.J.; Ploschuk, E.; Rugnone, M.L.; Striker, G.G.; Casal, J.J.; Chernomoretz, A.; Yanovsky, M.J. AtCBF1 Overexpression Confers Tolerance to High Light Conditions at Warm Temperatures in Potato Plants. Am. J. Potato Res. 2015, 92, 619–635. [Google Scholar] [CrossRef]
  17. Xu, C.; Wang, Y.; Zhao, H.; Mi, F. A study on Agrobacterium tumefaciens-mediated transformation of Medicago sativa with the AtCBF1 gene. Acta Prataculturae Sin. 2012, 21, 168–174. [Google Scholar]
  18. Jin, W.; Dong, J.; Yin, S.; Yan, A.; Chen, M. CBF1 Gene Transgenic Strawberry and Increase Freezing Tolerance. Act a Bot. Boreal-Occident. Sin. 2007, 27, 0223–0227. [Google Scholar]
  19. Benedict, C.; Skinner, J.S.; Meng, R.; Chang, Y.; Bhalerao, R.; Huner, N.P.; Finn, C.E.; Chen, T.H.; Hurry, V. The CBF1-dependent low temperature signalling pathway, regulon and increase in freeze tolerance are conserved in Populus spp. Plant Cell Environ. 2006, 29, 1259–1272. [Google Scholar] [CrossRef]
  20. Pino, M.T.; Skinner, J.S.; Park, E.J.; Jeknic, Z.; Hayes, P.M.; Thomashow, M.F.; Chen, T.H. Use of a stress inducible promoter to drive ectopic AtCBF expression improves potato freezing tolerance while minimizing negative effects on tuber yield. Plant Biotechnol. J. 2007, 5, 591–604. [Google Scholar] [CrossRef]
  21. Singh, S.; Rathore, M.; Goyary, D.; Singh, R.K.; Anandhan, S.; Sharma, D.K.; Ahmed, Z. Induced ectopic expression of At-CBF1 in marker-free transgenic tomatoes confers enhanced chilling tolerance. Plant Cell Rep. 2011, 30, 1019–1028. [Google Scholar] [CrossRef] [PubMed]
  22. Jaglo, K.R.; Kleff, S.; Amundsen, K.L.; Zhang, X.; Haake, V.; Zhang, J.Z.; Deits, T.; Thomashow, M.F. Components of the Arabidopsis C-Repeat/Dehydration-Responsive Element Binding Factor Cold-Response Pathway Are Conserved in Brassica napus and Other Plant Species. Plant Physiol. 2001, 127, 910–917. [Google Scholar] [CrossRef] [PubMed]
  23. Dubouzet, J.G.; Sakuma, Y.; Ito, Y.; Kasuga, M.; Dubouzet, E.G.; Miura, S.; Seki, M.; Shinozaki, K.; Yamaguchi-Shinozaki, K. OsDREB genes in rice, Oryza sativa L.; encode transcription activators that function in drought-, high-salt- and cold-responsive gene expression. Plant J. 2003, 33, 751–763. [Google Scholar] [CrossRef] [PubMed]
  24. Qin, F.; Sakuma, Y.; Li, J.; Liu, Q.; Li, Y.Q.; Shinozaki, K.; Yamaguchi-Shinozaki, K. Cloning and functional analysis of a novel DREB1/CBF transcription factor involved in cold-responsive gene expression in Zea mays L. Plant Cell Physiol. 2004, 45, 1042–1052. [Google Scholar] [CrossRef] [Green Version]
  25. Li, J.; Wang, Y.; Yu, B.; Song, Q.; Liu, Y.; Chen, T.H.H.; Li, G.; Yang, X. Ectopic expression of StCBF1 and ScCBF1 have different functions in response to freezing and drought stresses in Arabidopsis. Plant Sci. 2018, 270, 221–233. [Google Scholar] [CrossRef]
  26. Xu, Y.; Hu, W.; Song, S.; Ye, X.; Ding, Z.; Liu, J.; Wang, Z.; Li, J.; Hou, X.; Xu, B.; et al. MaDREB1F confers cold and drought stress resistance through common regulation of hormone synthesis and protectant metabolite contents in banana. Hortic. Res. 2023, 10, uhac275. [Google Scholar] [CrossRef]
  27. Peng, Y.L.; Wang, Y.S.; Fei, J.; Sun, C.C. Isolation and expression analysis of two novel C-repeat binding factor (CBF) genes involved in plant growth and abiotic stress response in mangrove Kandelia obovata. Ecotoxicology 2020, 29, 718–725. [Google Scholar] [CrossRef]
  28. Liang, X.; Luo, G.; Li, W.; Yao, A.; Liu, W.; Xie, L.; Han, M.; Li, X.; Han, D. Overexpression of a Malus baccata CBF transcription factor gene, MbCBF1, Increases cold and salinity tolerance in Arabidopsis thaliana. Plant Physiol. Biochem. 2022, 192, 230–242. [Google Scholar] [CrossRef]
  29. Ding, D.; Chen, Y.; Cui, J.; Wei, J.; Zhang, Y.; Zhang, J. Bioinformatics Analysis of CBF/DREB1 Family in Populus trichocarpa. Southwest China J. Agric. Sci. 2018, 31, 457–461. [Google Scholar]
  30. Lee, S.C.; Lim, M.H.; Yu, J.G.; Park, B.S.; Yang, T.J. Genome-wide characterization of the CBF/DREB1 gene family in Brassica rapa. Plant Physiol. Biochem. 2012, 61, 142–152. [Google Scholar] [CrossRef]
  31. Zhang, H.; Gong, Y.; Sun, P.; Chen, S.; Ma, C. Genome-wide identification of CBF genes and their responses to cold acclimation in Taraxacum kok-saghyz. PeerJ 2022, 10, e13429. [Google Scholar] [CrossRef] [PubMed]
  32. Wang, D.; Cui, B.; Guo, H.; Liu, Y.; Nie, S. Genome-wide identification and expression analysis of the CBF transcription factor family in Lolium perenne under abiotic stress. Plant Signal. Behav. 2022, 2086733. [Google Scholar] [CrossRef] [PubMed]
  33. Mohseni, S.; Che, H.; Djillali, Z.; Dumont, E.; Nankeu, J.; Danyluk, J. Wheat CBF gene family: Identification of polymorphisms in the CBF coding sequence. Genome 2012, 55, 865–881. [Google Scholar] [CrossRef]
  34. Yang, Y.; Al-Baidhani, H.H.J.; Harris, J.; Riboni, M.; Li, Y.; Mazonka, I.; Bazanova, N.; Chirkova, L.; Sarfraz Hussain, S.; Hrmova, M.; et al. DREB/CBF expression in wheat and barley using the stress-inducible promoters of HD-Zip I genes: Impact on plant development, stress tolerance and yield. Plant Biotechnol. J. 2020, 18, 829–844. [Google Scholar] [CrossRef] [Green Version]
  35. Zhang, X.; Fowler, S.G.; Cheng, H.; Lou, Y.; Rhee, S.Y.; Stockinger, E.J.; Thomashow, M.F. Freezing-sensitive tomato has a functional CBF cold response pathway, but a CBF regulon that differs from that of freezing-tolerant Arabidopsis. Plant J. 2004, 39, 905–919. [Google Scholar] [CrossRef] [PubMed]
  36. Xiao, H.; Siddiqua, M.; Braybrook, S.; Nassuth, A. Three grape CBF/DREB1 genes respond to low temperature, drought and abscisic acid. Plant Cell Environ. 2006, 29, 1410–1421. [Google Scholar] [CrossRef]
  37. Cao, P.B.; Ployet, R.; Nguyen, C.; Dupas, A.; Ladouce, N.; Martinez, Y.; Grima-Pettenati, J.; Marque, C.; Mounet, F.; Teulieres, C. Wood Architecture and Composition Are Deeply Remodeled in Frost Sensitive Eucalyptus Overexpressing CBF/DREB1 Transcription Factors. Int. J. Mol. Sci. 2020, 21, 3019. [Google Scholar] [CrossRef] [Green Version]
  38. Ritonga, F.N. Transcriptome, Physiological, and Biochemical Analysis of Betula platyphylla S. in Response to Cold and Heat Stresses. Ph.D. Thesis, Northeast Forestry University, Harbin, China, 2022. [Google Scholar]
  39. Barrero-Gil, J.; Salinas, J. Gene Regulatory Networks Mediating Cold Acclimation: The CBF Pathway. Adv. Exp. Med. Biol. 2018, 1081, 3–22. [Google Scholar] [CrossRef]
  40. Goodstein, D.M.; Shu, S.; Howson, R.; Neupane, R.; Hayes, R.D.; Fazo, J.; Mitros, T.; Dirks, W.; Hellsten, U.; Putnam, N.; et al. Phytozome: A comparative platform for green plant genomics. Nucleic Acids Res. 2012, 40, D1178–D1186. [Google Scholar] [CrossRef]
  41. Potter, S.C.; Luciani, A.; Eddy, S.R.; Park, Y.; Lopez, R.; Finn, R.D. HMMER web server: 2018 update. Nucleic Acids Res. 2018, 46, W200–W204. [Google Scholar] [CrossRef] [Green Version]
  42. Tremblay, M.F.; Nadeau, P.; Lalonde, M. Effect of ABA on freezing resistance of Betula papyrifera and Alnus incana woody plant cell suspensions. Tree Physiol. 1992, 10, 317–326. [Google Scholar] [CrossRef] [PubMed]
  43. Hu, P.; Zhang, K.; Yang, C. Functional roles of the birch BpRAV1 transcription factor in salt and osmotic stress response. Plant Sci. 2022, 315, 111131. [Google Scholar] [CrossRef] [PubMed]
  44. Giricz, O.; Lauer-Fields, J.L.; Fields, G.B. The normalization of gene expression data in melanoma: Investigating the use of glyceraldehyde 3-phosphate dehydrogenase and 18S ribosomal RNA as internal reference genes for quantitative real-time PCR. Anal. Biochem. 2008, 380, 137–139. [Google Scholar] [CrossRef] [PubMed] [Green Version]
  45. Livak, K.J.S.; Schmittgen, T.D. Analysis of relative gene expression data using real-time quantitative PCR and the 2(-ΔΔC(T)) Method. Methods 2001, 25, 402–408. [Google Scholar] [CrossRef] [PubMed]
Figure 1. Phylogenetic analysis of CBF proteins from Betula platyphylla, Arabidopsis thaliana and Populus trichocarpa. The red circle represents BpCBFs; the yellow triangle represents AtCBFs; the purple square represents PtCBFs. Pink, green and blue represent Clades 1, 2 and 3, respectively.
Ijms 24 10573 g001
Figure 2. Phylogenetic relationship, exon-intron gene structure, structure of conserved protein motifs in BpCBF transcription factors. (A) Phylogenetic tree was constructed based on the full-length sequence of the BpCBFs protein. Pink line indicates Clade 1, green line indicates Clade 2 and blue line indicates Clade 3. (B) Exon-intron structure of the BpCBF transcription factors. Yellow boxes indicate exons, blue boxes indicate untranslated 5′- regions and black lines indicate introns. (C,D) are the motif composition of BpCBFs protein. The pattern of motif 1–10 is displayed with boxes in different colors. (E) Sequences of Motif 1–10. Motifs in the amino acid sequence of BpCBFs were predicted using online MEME tool.
Ijms 24 10573 g002
Figure 3. Partial multiple sequence alignment analysis of the 20 BpCBFs. The green box represents Special Domain Ⅰ; the pink box represents AP2 domain and the blue box represents Special Domain Ⅱ. The amplified colored letters above protein sequences indicate the motif of domains. Different colors of letters represent different amino acids.
Ijms 24 10573 g003
Figure 4. Chromosome location of the BpCBFs. The yellow square represents chromosome, and chromosome numbers are shown at the left side; Scale bar on the left represents the chromosome length (Mb).
Ijms 24 10573 g004
Figure 5. Collinearity analysis of CBFs between Betula platyphylla and Arabidopsis thaliana and Betula platyphylla and Populus trichocarpa. Grey lines in the background represent collinear blocks in Betula platyphylla and the other two plants, respectively. Pink lines represent collinear CBF transcription factor pairs. The numbers on the chromosomes indicate chromosome numbers.
Ijms 24 10573 g005
Figure 6. Analysis of cis-acting elements in the promoters of the 20 BpCBFs. Different colored boxes represent different cis-acting elements.
Ijms 24 10573 g006
Figure 7. Tissue-specific expression analysis of BpCBFs. Tissue-specific expression analysis is performed with roots, stems and leaves of Betula platyphylla. The bar graphs were derived from the results of qRT-PCR. The expression level of each gene in plant roots was normalized to 1.0, and transcription levels were calculated using 2−ΔΔCt method. (t test, * p < 0.05, ** p < 0.01).
Ijms 24 10573 g007
Figure 8. Tissue-specific expression analysis of BpCBFs under ABA treatment by qRT-PCR. The expression patterns of BpCBFs in roots, stems and leaves are shown. The concentration of ABA treatment is 100 μM, and the treatment time is 0 h, 3 h, 6 h, 12 h, 24 h and 48 h. The 2−ΔΔCt method was used to calculate the transcription levels of BpCBFs, and the log2 (sample/control) value of each BpCBF was used to show its relative expression level. Scale bars were laid at the right side of heatmaps, and different colors indicated that the gene expression in the treated sample is up-regulated or down-regulated compared to the control.
Ijms 24 10573 g008
Figure 9. Tissue-specific expression analysis of BpCBFs under salt stress by qRT-PCR. The expression patterns of BpCBFs in roots, stems and leaves are shown. The concentration of salt treatment is 200 mM, and the treatment time is 0 h, 3 h, 6 h, 12 h, 24 h. The 2−ΔΔCt method was used to calculate the transcription levels of BpCBFs, and the log2 (sample/control) value of each BpCBF was used to show its relative expression level. Scale bars were laid at the right side of heatmaps, and different colors indicated that the gene expression in the treated sample is up-regulated or down-regulated compared to the control.
Ijms 24 10573 g009
Figure 10. The expression analysis of BpCBFs responding to cold stress by qRT-PCR and RNA-seq data under cold stress in Betula platyphylla leaves. The temperature of cold treatment is 4 °C, and the treatment time is 3 h. The 2−ΔΔCt method was used to calculate the transcription levels of six BpCBFs responding to cold stress, and the expression level of each gene in untreated plant leaves was normalized to 1.0. The blue column indicates the FPKM in the RNA-seq data, and the orange line indicates the qRT-PCR results. The left-side bar is the scale of FPKM in the RNA-seq data, and the right-side bar is the scale of expression level by qRT-PCR.
Ijms 24 10573 g010
Figure 11. Identification of transcription activating activity of BpCBF7. (A) Display of the conserved domain of BpCBF7. The blue square under the protein sequence of BpCBF7 symbolizes the AP2 domain. (B) The localization of transcription activating activity site of BpCBF7 with yeast transformation method. BD means pGBKT7 vector. AD means pGADT7 vector. NTR means N-terminal of BpCBF7 and CTR means C-terminal. The number represent the site of amino acid (aa). The grey arrow shows the transcription activating site of BpCBF7. SD means nutrition-deprived yeast culture medium. The concentration of AbA in culture medium is 500 ng/L.
Ijms 24 10573 g011
Table 1. Identification and physicochemical properties for the 20 CBF transcription factor family members information in Betula platyphylla.
Transcription Factor NameLocus Name
Phytozome v13
Genomic Serquence (bp)Amino Acid No.Molecular Weight (Da)Isoelectric PointsGRAVYAliphatic IndexChromosome Location
BpCBF1BPChr02G2338456418720,750.435.85−0.45968.93Chr02:10503221..10503785 (+)
BpCBF2BPChr02G2330360920222,429.245.67−0.51564.36Chr02:10522058..10522667 (+)
BpCBF3BPChr02G2333360920222,429.245.67−0.51564.36Chr02:10531862..10532471 (+)
BpCBF4BPChr02G2347856418720,794.596.12−0.48866.36Chr02:10541230..10541794 (+)
BpCBF5BPChr02G2335246515417,566.1711.82−0.71961.49Chr02:10582208..10582673 (+)
BpCBF6BPChr02G2340549216318,195.539.96−0.70256.99Chr02:10584488..10584980 (+)
BpCBF7BPChr02G2345660920222,275.075.65−0.47865.30Chr02:10595771..10596380 (+)
BpCBF8BPChr02G2340156718720,805.626.33−0.43865.53Chr02:10606091..10606658 (+)
BpCBF9BPChr02G23413301533137,548.725.39−0.75661.36Chr02:10637802..10640817 (+)
BpCBF10BPChr02G23391301733137,548.725.39−0.75661.36Chr02:10644105..10647122 (+)
BpCBF11BPChr02G2345960920222,330.235.65−0.44066.29Chr02:10650404..10651013 (+)
BpCBF12BPChr02G2333861220322,347.075.34−0.49964.53Chr02:10660443..10661055 (+)
BpCBF13BPChr10G0339067822525,145.757.66−0.34582.31Chr10:14620830..14621508 (−)
BpCBF14BPChr11G0696962720723,030.715.30−0.50766.25Chr11:8279927..8280554 (−)
BpCBF15BPChr11G0697369623125,902.065.41−0.56060.04Chr11:8285278..8285974 (−)
BpCBF16BPChr11G0702462720823,131.995.21−0.50465.77Chr11:8298502..8299129 (−)
BpCBF17BPChr11G0676963020923,582.585.62−0.55964.02Chr11:8313160..8313790 (−)
BpCBF18BPChr11G0696774124627,052.194.78−0.45566.34Chr11:8319557..8320298 (−)
BpCBF19BPChr11G0681871423726,167.224.96−0.46767.22Chr11:8329468..8330182 (−)
BpCBF20BPChr11G06723577944449,211.025.12−0.52768.90Chr11:8334005..8339784 (−)
Note: (+) means forward; (−) means reverse.
Disclaimer/Publisher’s Note: The statements, opinions and data contained in all publications are solely those of the individual author(s) and contributor(s) and not of MDPI and/or the editor(s). MDPI and/or the editor(s) disclaim responsibility for any injury to people or property resulting from any ideas, methods, instructions or products referred to in the content.

