
Microglia and Astroglia—The Potential Role in Neuroinflammation Induced by Pre- and Neonatal Exposure to Lead (Pb)

 ,
,  , , , , ,
  and
and 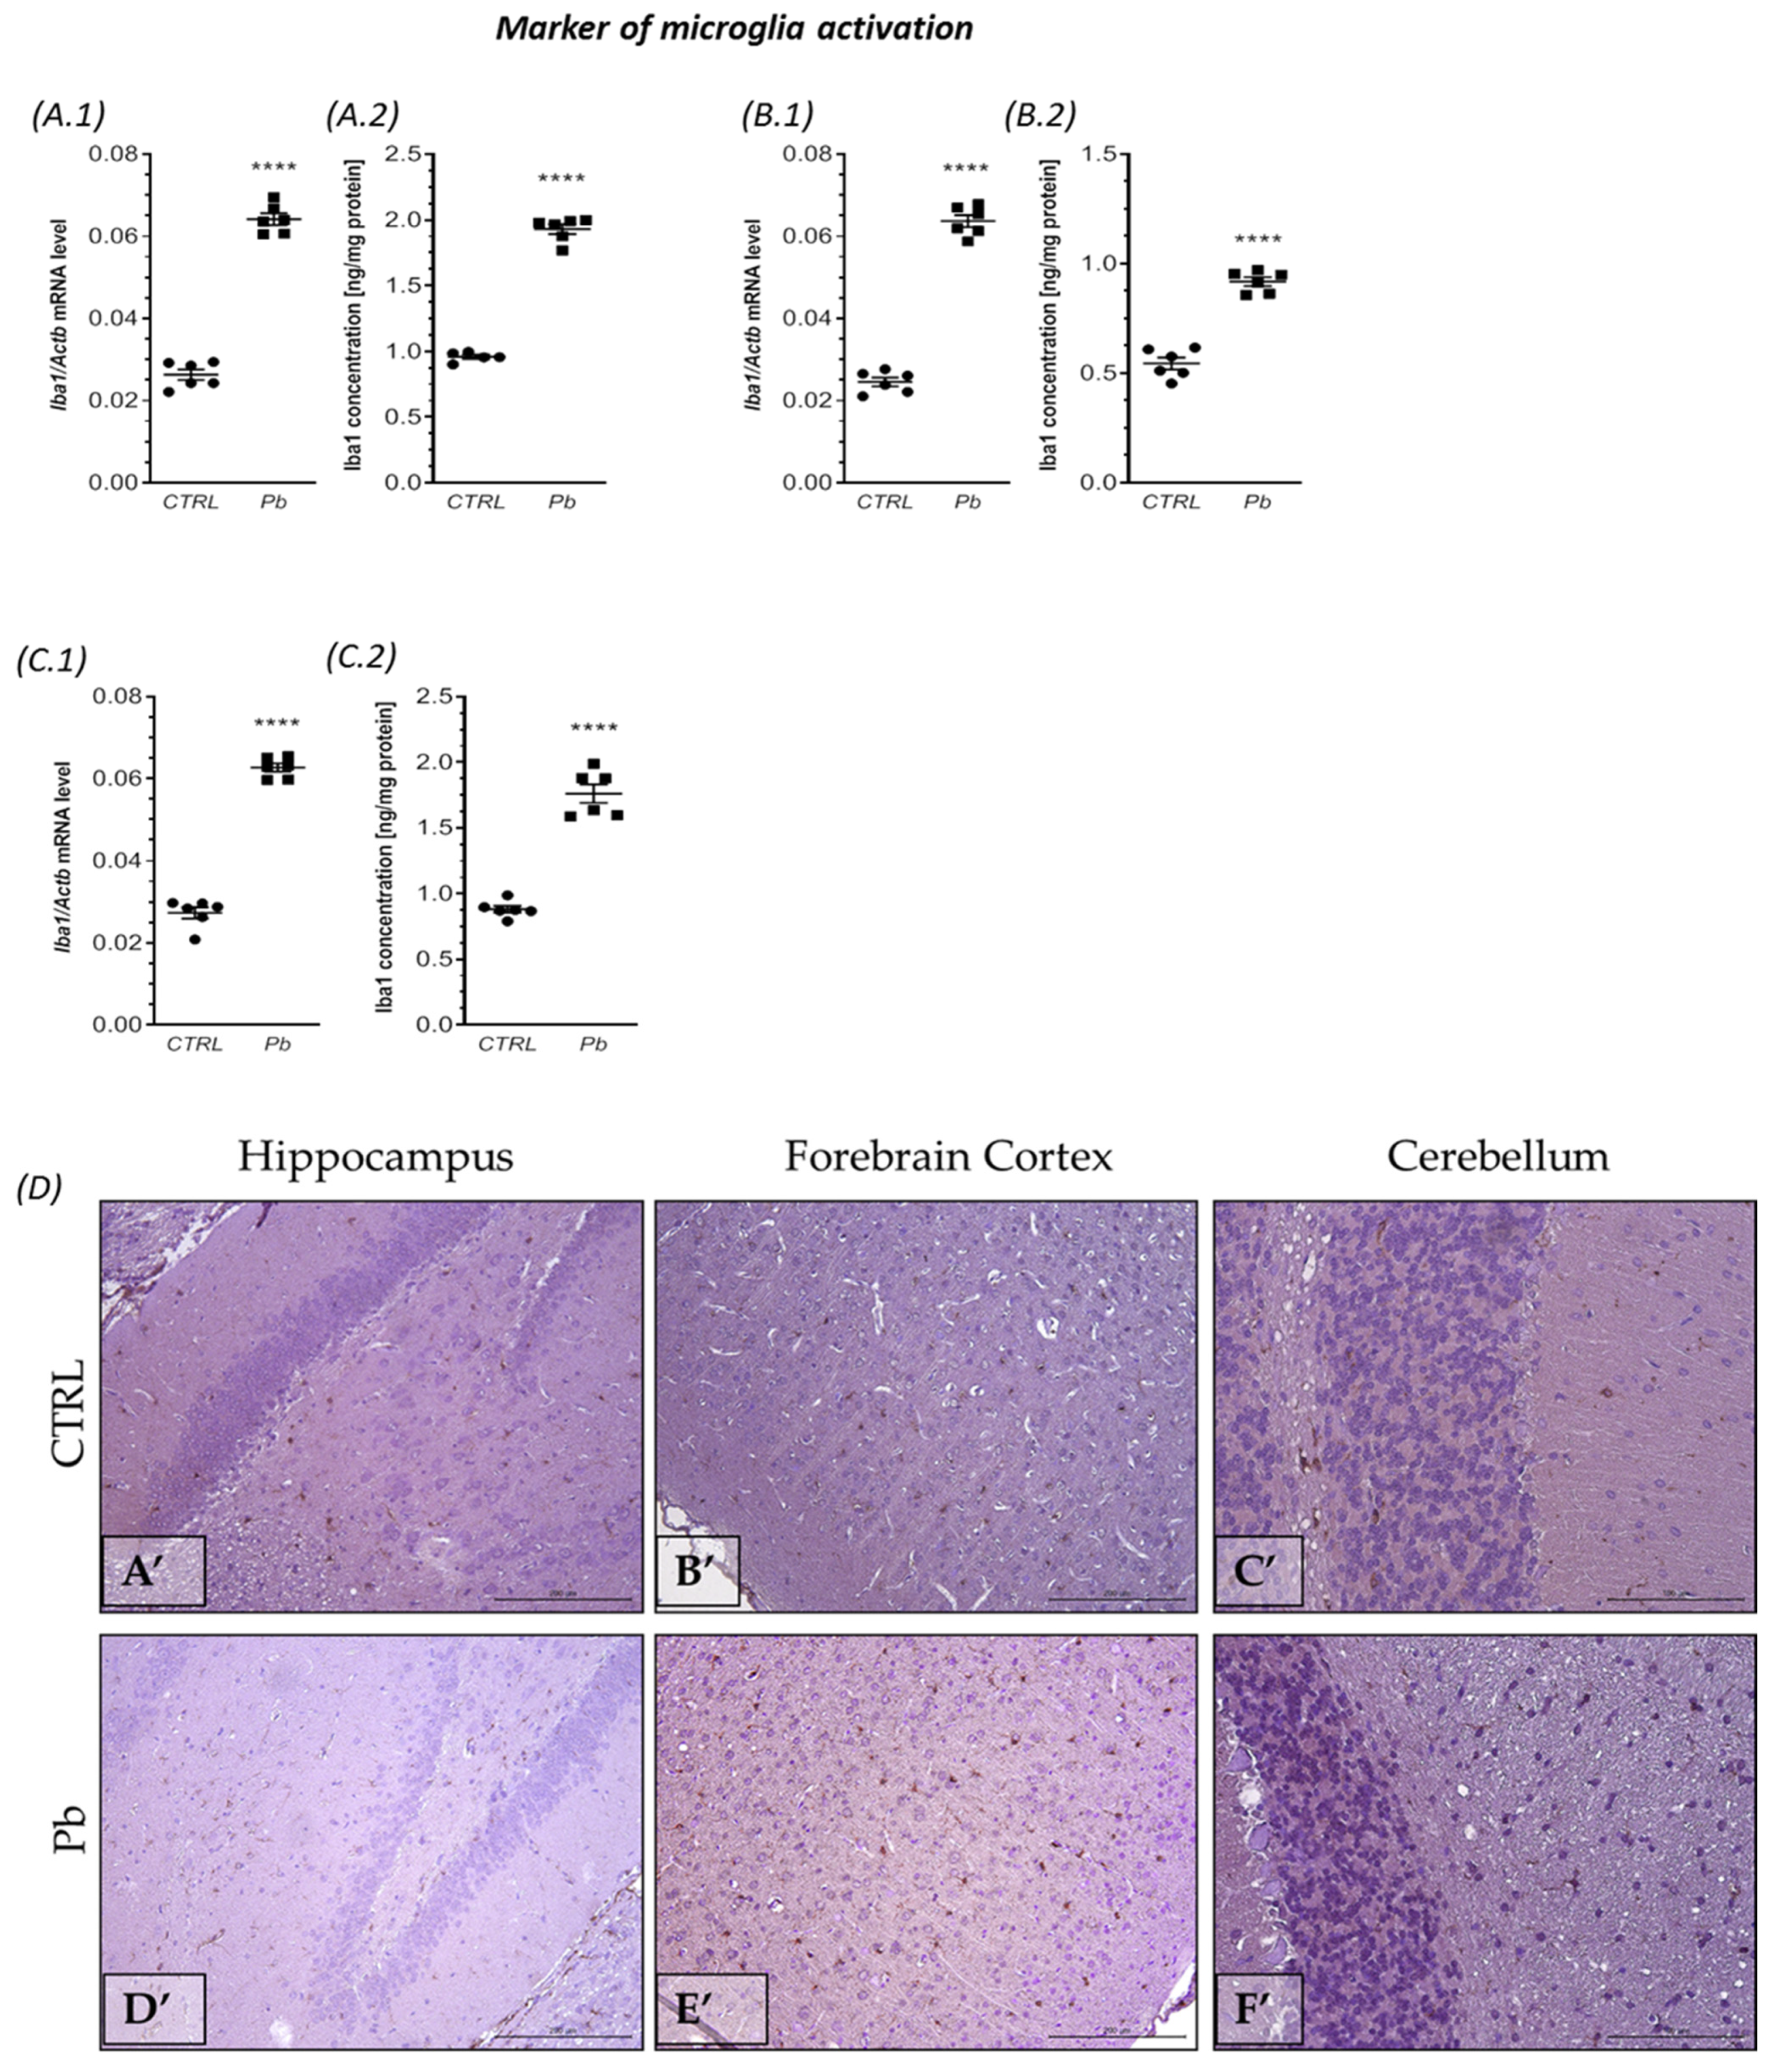
Abstract
1. Introduction
2. Results
2.1. Perinatal Exposure to Pb Increased Lead Concentration in Whole Blood and Brain Tissue
2.2. Perinatal Exposure to Pb Affected the Microglia in the Brain of Adult Rats
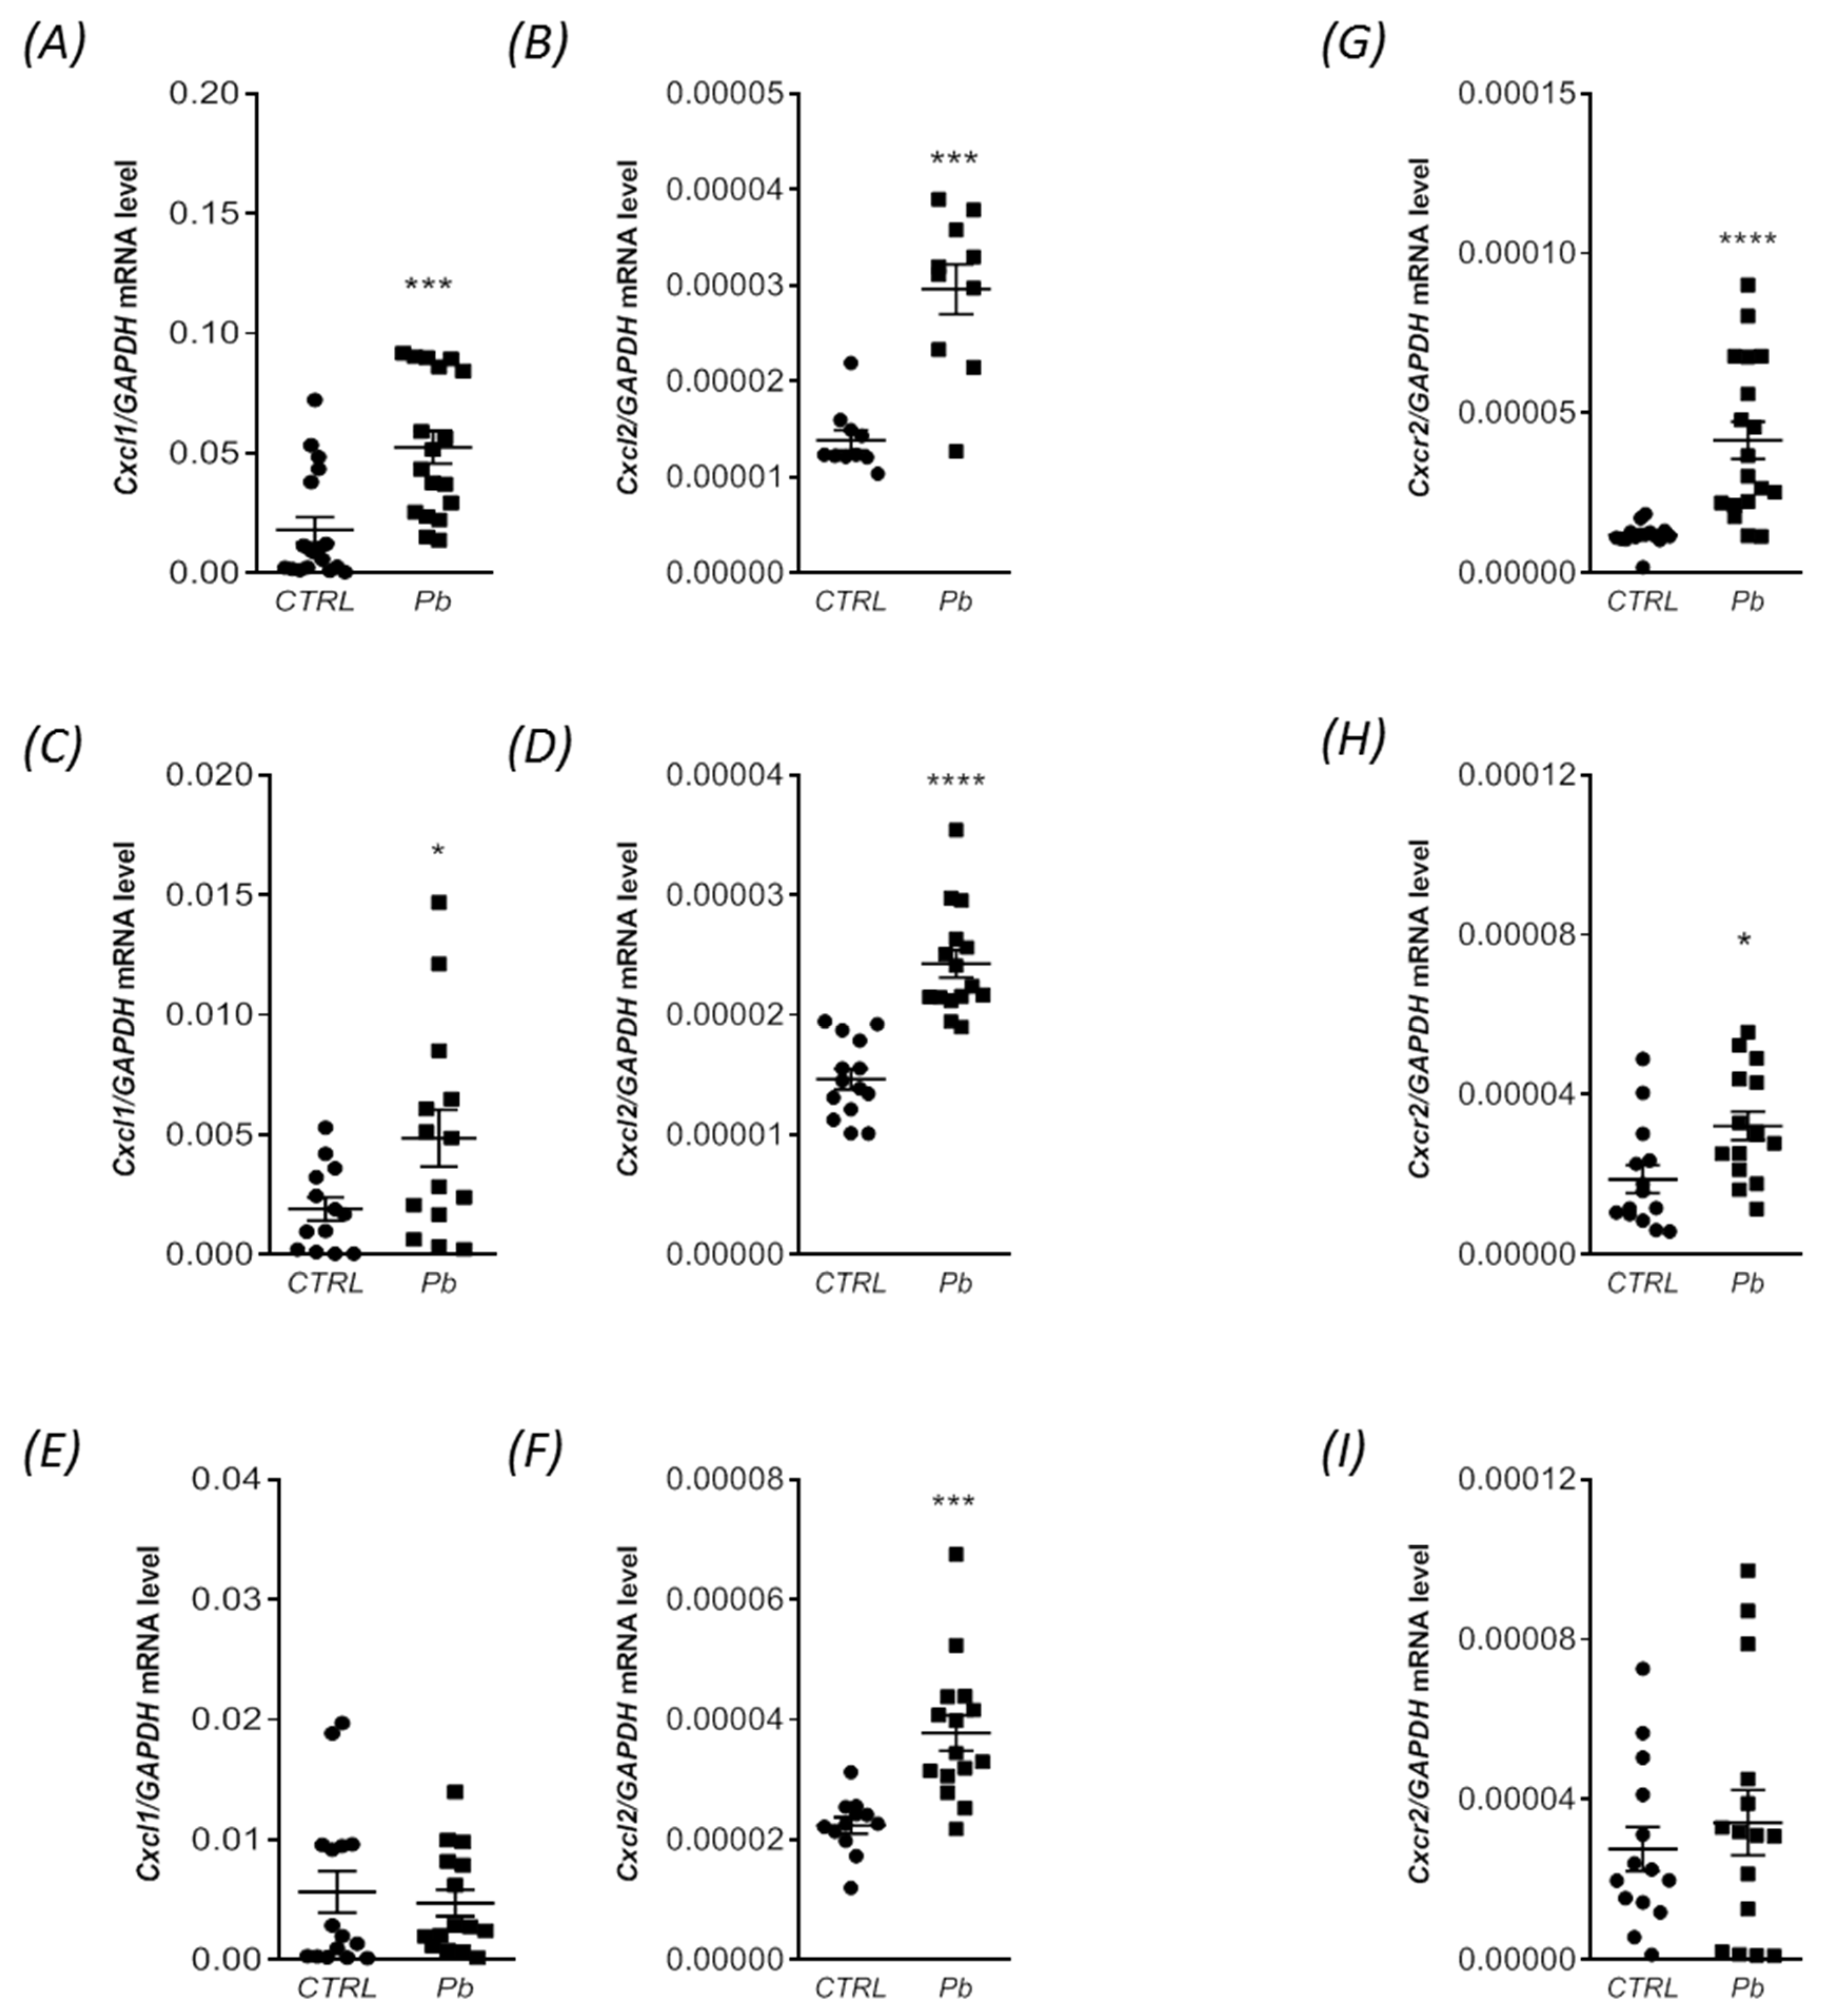
2.3. Perinatal Exposure to Pb Increased the mRNA Expression of Cxcl1 and Cxcl2 Chemokines and the Receptor Cxcr2 in the Brain of Adult Rats
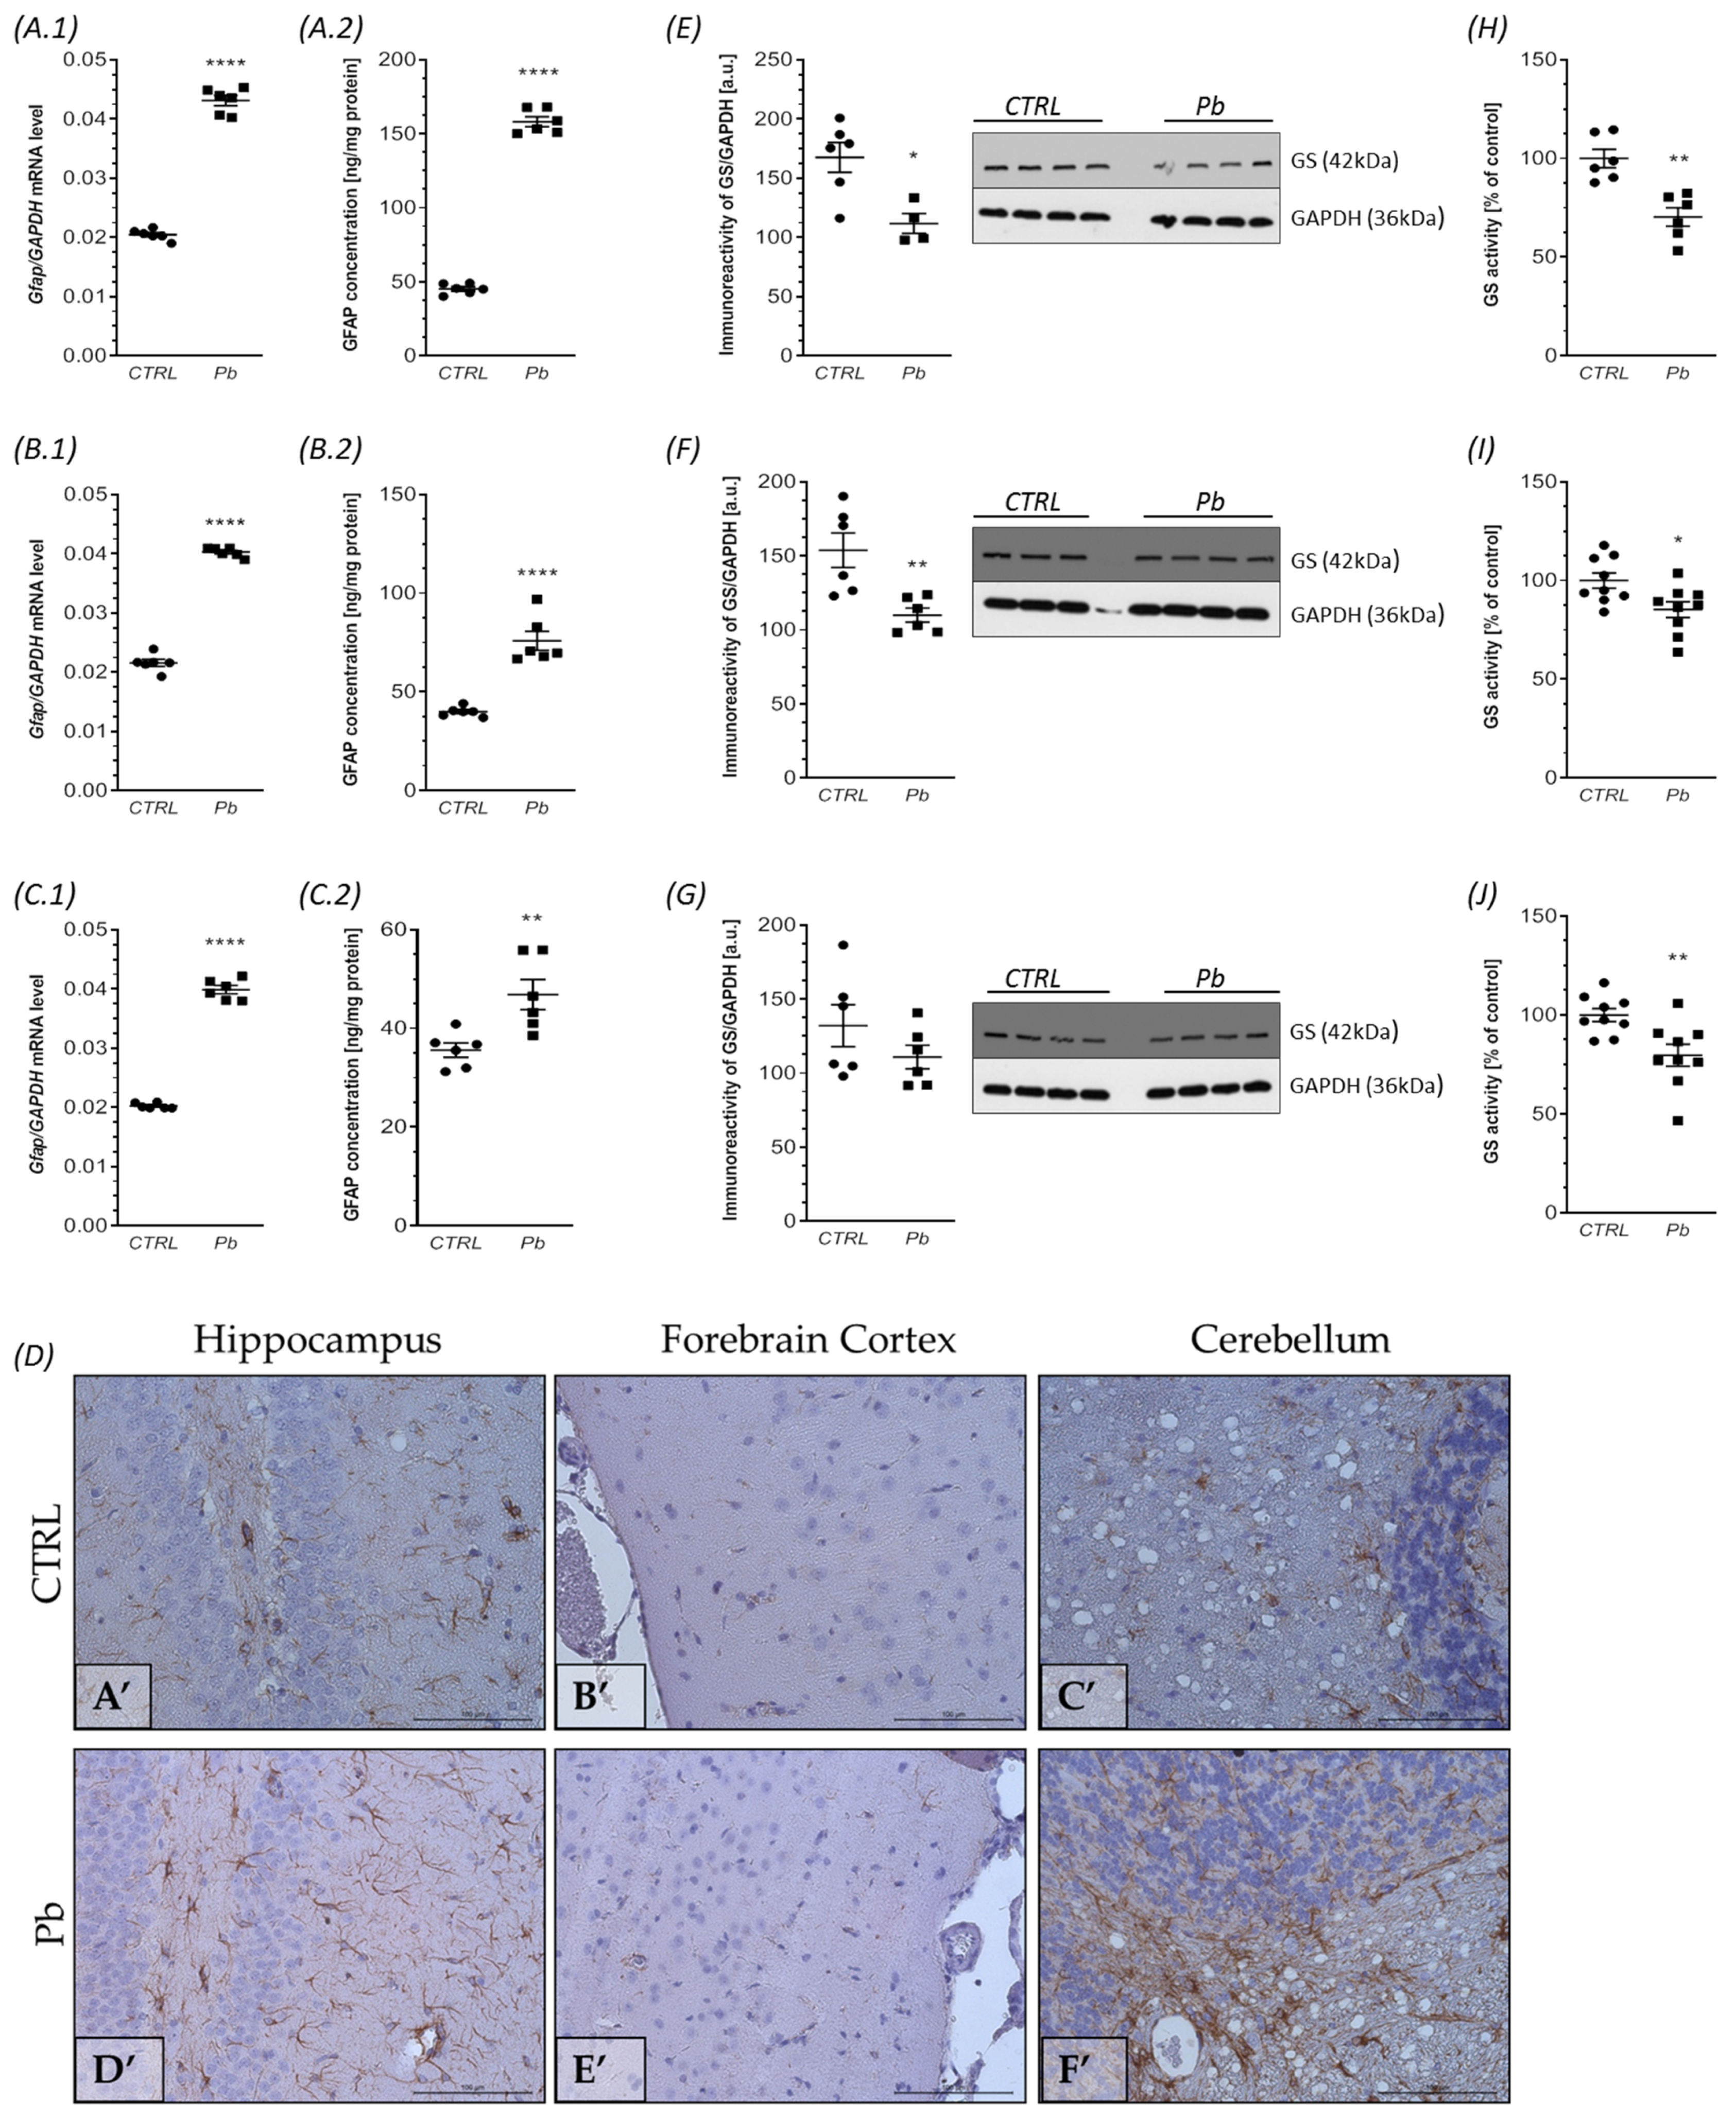
2.4. Perinatal Exposure to Pb Affects Astrocytes Phenotype and Function in the Brain of Adult Rats
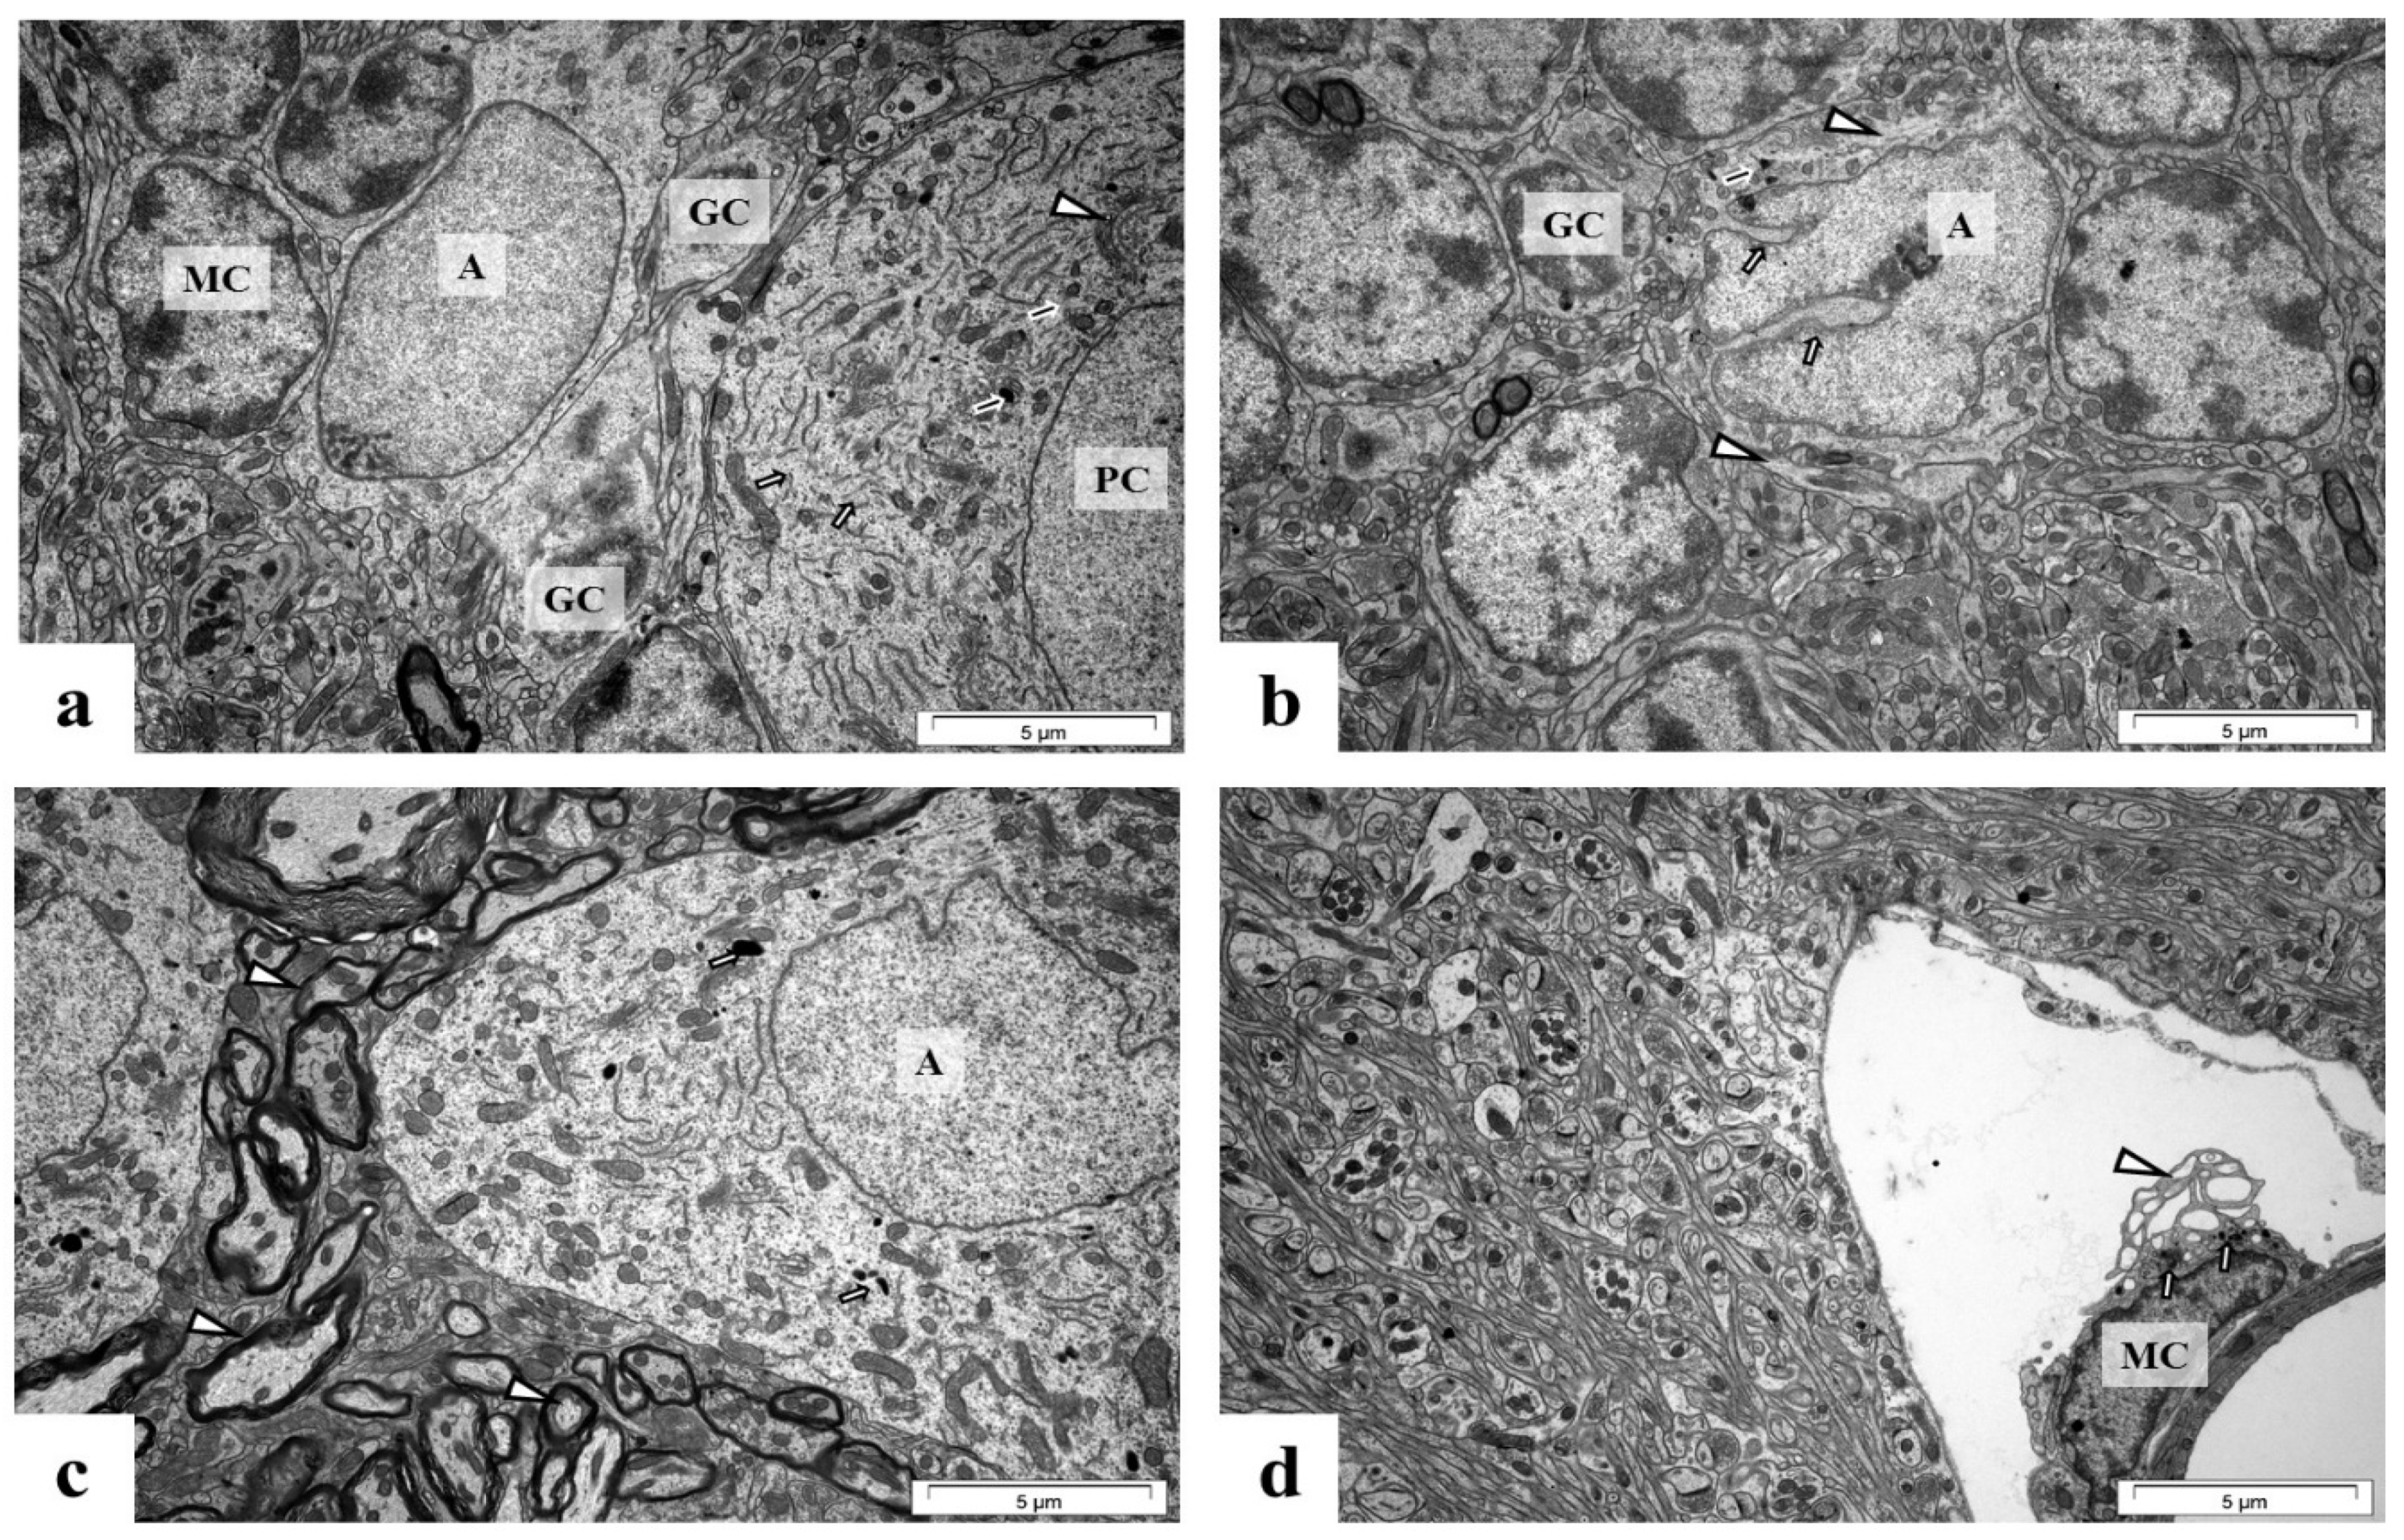
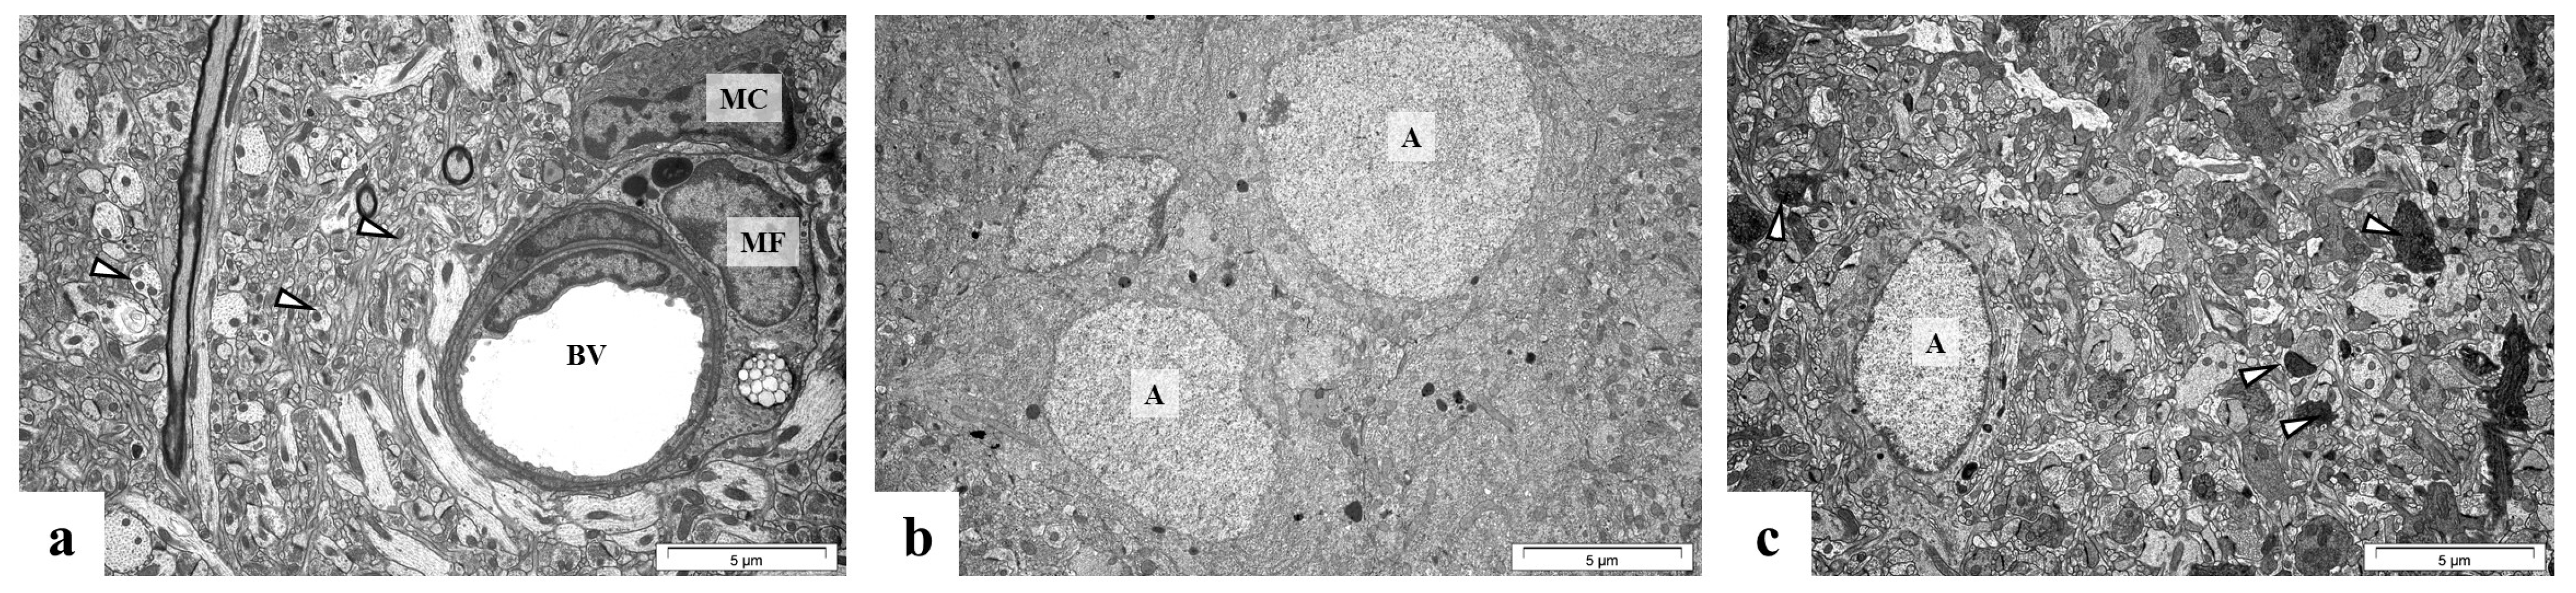
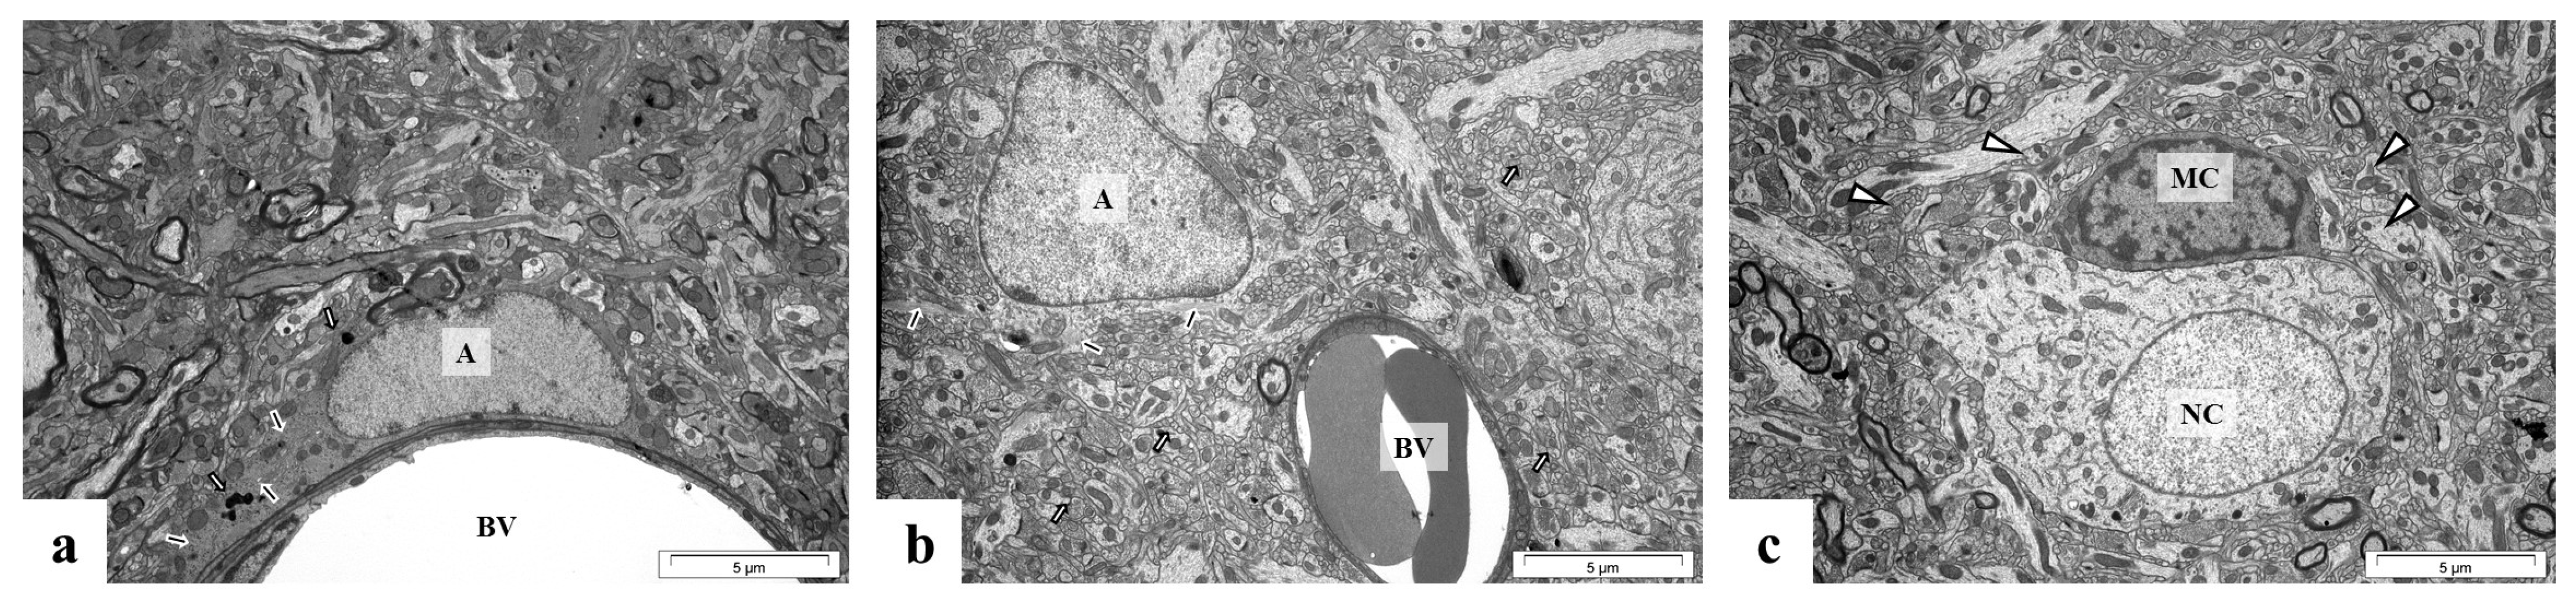
2.5. Perinatal Exposure to Pb Causes Ultrastructural Changes in the Glial Cells in the Brain of Adult Rats
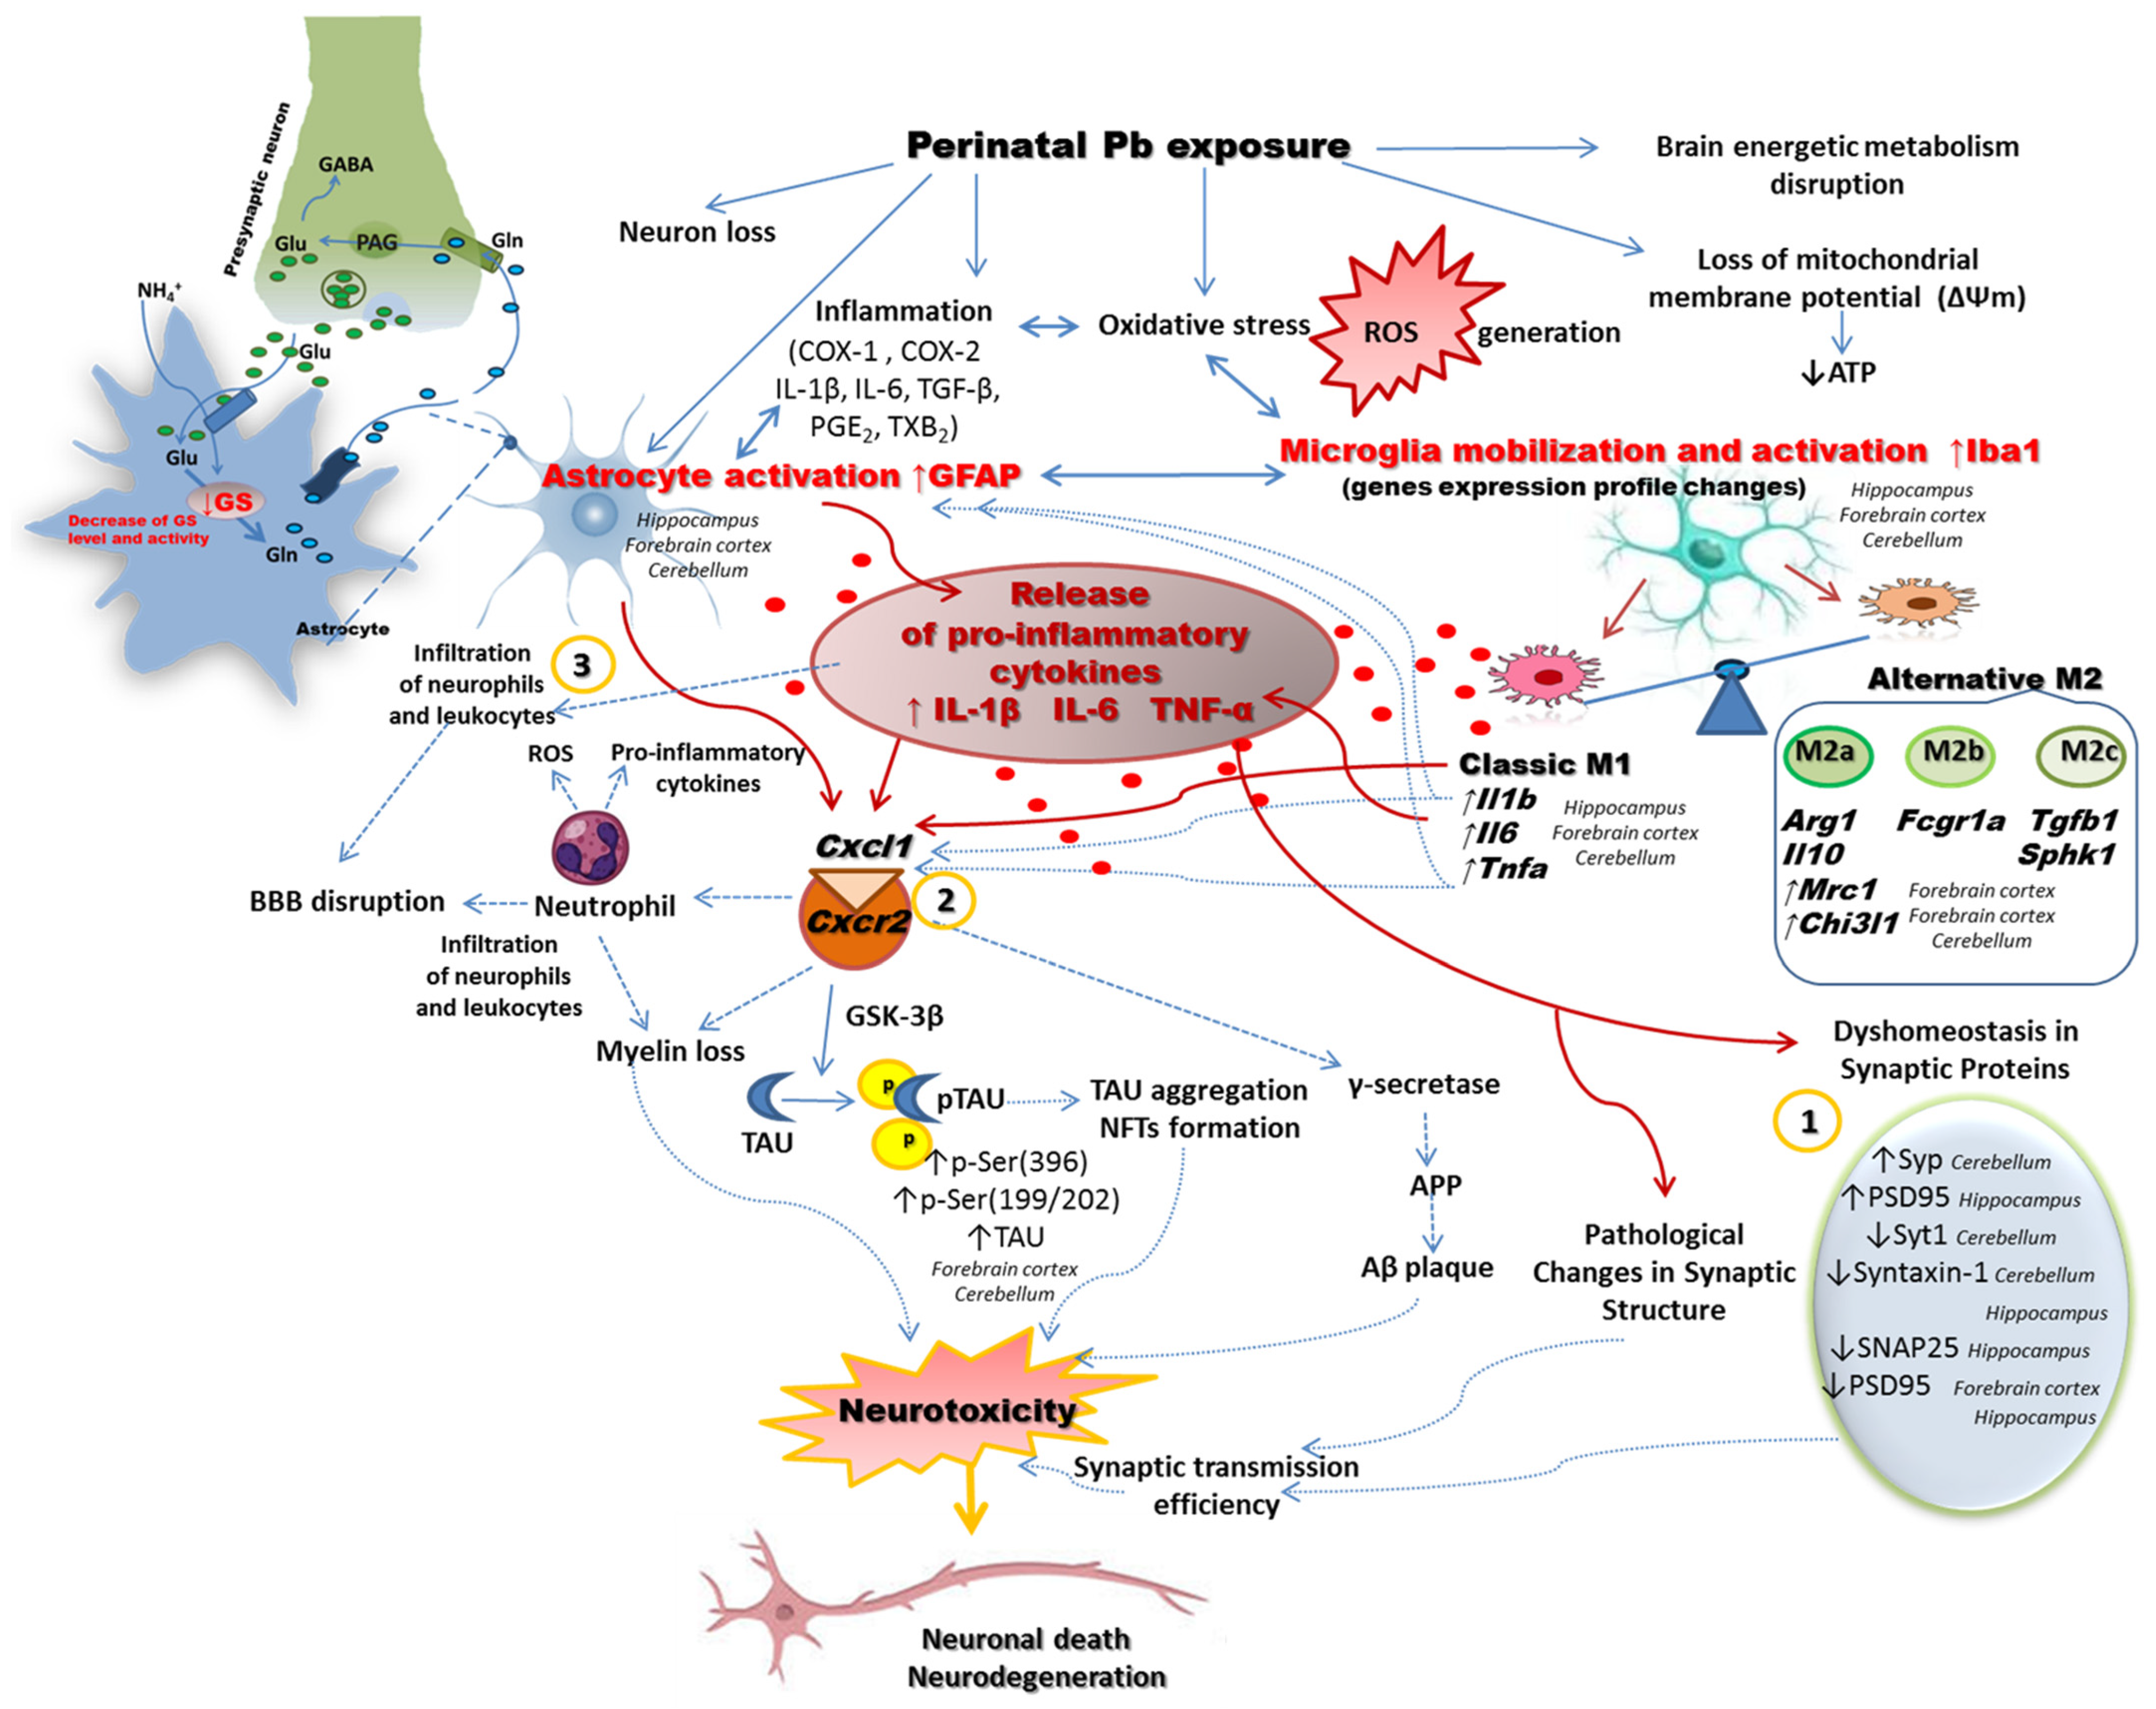
3. Discussion
4. Materials and Methods
4.1. Animals—In Vivo Model
4.2. Analysis of Pb by Atomic Absorption Spectroscopy
4.3. Quantitative Real Time Polymerase Chain Reaction (qRT-PCR)
| Iba1_F | GATTTGCAGGGAGGAAAAGCT |
| Iba1_R | AACCCCAAGTTTCTCCAGCAT |
| Il1b_F | GAAATAGCACCTTTTGACAGTG |
| Il1b_R | TGGATGCTCTCATCTGGACAG |
| Il6_F | CTGCAAGAGACTTCCAGCCAG |
| Il6_R | AGTGGTATATACTGGTCTGTTGG |
| Tnfa_F | CAGGCGGTGTCTGTGCCTC |
| Tnfa_R | CGATCACCCCGAAGTTCAGTAG |
| Arg1_F | CTCCAAGCCAAAGCCCATAGAG |
| Arg1_R | GGGGCTGTCATTGGGGACATCA |
| Chi3l1_F | ATGTGCACCTCTGCTGAAGCC |
| Chi3l1_R | ACCAGTTTGTACGCAGAGC |
| Mrc1_F | CGCTGTTCAACTCTTGGACTC |
| Mrc1_R | TGGCACCCCCAAACACAATTTGA |
| Il10_F | CTTACTGGCTGGAGTGAAGACCA |
| Il10_R | TCAGCTCTCGGAGCATGTGG |
| Fcgr1a_F | TCCACAAAGTGGTTTATCAACAG |
| Fcgr1a_R | CACTGTCCTTGAAACTGGCCT |
| Tgfb1_F | CCACCTGCAAGACCATCGAC |
| Tgfb1_R | CTGGCGAGCCTTAGTTTGGAC |
| Sphk1_F | ACTGATGCTCACCGAACGGCA |
| Sphk1_R | CCGTCACCGGACATGACCGC |
| Cxcl1_F | CAGGGATTCACTTCAAGAACATC |
| Cxcl1_R | CAGGGTCAAGGCAAGCCTC |
| Cxcl2_F | CCAACCATCAGGGTACAGG |
| Cxcl2_R | GGGTCACCGTCAAGCTCTG |
| Cxcr2_F | TCCCTGCCCATCTTCATTCTTC |
| Cxcr2_R | ACCCTCCACTTGGATGTATTAT |
| Gfap_F | GAGTCCACAACCATCCTTCTGAG |
| Gfap_R | ACACCAGGCTGCTTGAACAC |
4.4. Measurement of Iba1, IL-1β, IL-6, TNF-α, and GFAP Concentration by ELISA Method
4.5. Immunohistochemical Staining
4.6. Transmission Electron Microscopy (TEM) Analysis
4.7. Immunochemical Determination of Protein Levels (Western Blot Analysis)
4.8. Glutamine Synthetase (GS) Activity Assay
4.9. Statistical Analysis
5. Conclusions
Author Contributions
Funding
Institutional Review Board Statement
Informed Consent Statement
Data Availability Statement
Conflicts of Interest
References
- Modgil, S.; Lahiri, D.K.; Sharma, V.L.; Anand, A. Role of early life exposure and environment on neurodegeneration: Implications on brain disorders. Transl. Neurodegener. 2014, 3, 9. [Google Scholar] [CrossRef]
- ATSDR. Substance Priority List. Agency for Toxic Substances and Disease Registry. 2018. Available online: https://www.meritlabs.com/blog/2018/2/23/the-latest-atsdr-substance-priority-list-of-chemicals-and-elements-posing-the-most-significant-risk-at-npl-sites (accessed on 19 November 2019).
- Baranowska-Bosiacka, I.; Gutowska, I.; Marchetti, C.; Rutkowska, M.; Marchlewicz, M.; Kolasa, A.; Prokopowicz, A.; Wiernicki, I.; Piotrowska, K.; Baśkiewicz , M.; et al. Altered energy status of primary cerebellar granule neuronal cultures from rats exposed to lead in the pre- and neonatal period. Toxicology 2011, 280, 24–32. [Google Scholar] [CrossRef]
- Baranowska-Bosiacka, I.; Gutowska, I.; Marchlewicz, M.; Marchetti, C.; Kurzawski, M.; Dziedziejko, V.; Kolasa, A.; Olszewska, M.; Rybicka, M.; Safranow, K.; et al. Disrupted pro- and antioxidative balance as a mechanism of neurotoxicity induced by perinatal exposure to lead. Brain Res. 2012, 1435, 56–71. [Google Scholar] [CrossRef]
- Baranowska-Bosiacka, I.; Strużyńska, L.; Gutowska, I.; Machalińska, A.; Kolasa, A.; Kłos, P.; Czapski, G.A.; Kurzawski, M.; Prokopowicz, A.; Marchlewicz, M.; et al. Perinatal exposure to lead induces morphological, ultrastructural and molecular alterations in the hippocampus. Toxicology 2013, 303, 187–200. [Google Scholar] [CrossRef] [PubMed]
- Gąssowska, M.; Baranowska-Bosiacka, I.; Moczydłowska, J.; Frontczak-Baniewicz, M.; Gewartowska, M.; Strużyńska, L.; Gutowska, I.; Chlubek, D.; Adamczyk, A. Perinatal exposure to lead (Pb) induces ultrastructural and molecular alterations in synapses of rat offspring. Toxicology 2016, 373, 13–29. [Google Scholar] [CrossRef] [PubMed]
- Gąssowska, M.; Baranowska-Bosiacka, I.; Moczydłowska, J.; Tarnowski, M.; Pilutin, A.; Gutowska, I.; Strużyńska, L.; Chlubek, D.; Adamczyk, A. Perinatal exposure to lead (Pb) promotes Tau phosphorylation in the rat brain in a GSK-3β and CDK5 dependent manner: Relevance to neurological disorders. Toxicology 2016, 347–349, 17–28. [Google Scholar] [CrossRef]
- CDC (Centers for Disease Control and Prevention). Interpreting and Managing Blood Lead Levels < 10 ug/dL in Children and Reducing Childhood Exposures to Lead: Recommendations of CDC’s Advisory Committee on Childhood Lead Poisoning Prevention. MMWR Recomm. Rep. 2007, 56, 1–16. Available online: http://www.cdc.gov/mmwr/preview/mmwrhtml/rr5608a1.htm (accessed on 2 March 2021).
- CDC (Centers for Disease Control and Prevention). Sources of Lead. 2012. Available online: http://www.cdc.gov/nceh/lead/tips/sources.htm (accessed on 19 November 2019).
- Chiodo, L.M.; Jacobson, S.W.; Jacobson, J.L. Neurodevelopmental effects of postnatal lead exposure at very low levels. Neurotoxicol. Teratol. 2004, 26, 359–371. [Google Scholar] [CrossRef]
- Miranda, M.L.; Kim, D.; Galeano, M.A.; Paul, C.J.; Hull, A.P.; Morgan, S.P. The relationship between early childhood blood lead levels and performance on end-of-grade tests. Environ. Health Perspect. 2007, 115, 1242–1247. [Google Scholar] [CrossRef]
- Geier, D.A.; Kern, J.K.; Geier, M.R. Blood Lead Levels and Learning Disabilities: A Cross-Sectional Study of the 2003-2004 National Health and Nutrition Examination Survey (NHANES). Int. J. Environ. Res. Public Health 2017, 14, 1202. [Google Scholar] [CrossRef]
- Advisory Committee on Childhood Lead Poisoning Prevention. Report of the Advisory Committee on Childhood Lead Poisoning Prevention of the Centers for Disease Control and Prevention Low Level Lead Exposure Harms Children: A Renewed Call for Primary Prevention; CDC: Atlanta, GA, USA, 2012. Available online: http://www.cdc.gov/nceh/lead/acclpp/final_document_030712.pdf (accessed on 19 November 2019).
- Chibowska, K.; Baranowska-Bosiacka, I.; Falkowska, A.; Gutowska, I.; Goschorska, M.; Chlubek, D. Effect of lead (Pb) on inflammatory processes in the brain. Int. J. Mol. Sci. 2016, 17, 2140. [Google Scholar] [CrossRef]
- Metryka, E.; Chibowska, K.; Gutowska, I.; Falkowska, A.; Kupnicka, P.; Barczak, K.; Chlubek, D.; Baranowska-Bosiacka, I. Lead (Pb) Exposure Enhances Expression of Factors Associated with Inflammation. Int. J. Mol. Sci. 2018, 19, 1813. [Google Scholar] [CrossRef]
- Chibowska, K.; Korbecki, J.; Gutowska, I.; Metryka, E.; Tarnowski, M.; Goschorska, M.; Barczak, K.; Chlubek, D.; Baranowska-Bosiacka, I. Pre- and Neonatal Exposure to Lead (Pb) Induces Neuroinflammation in the Forebrain Cortex, Hippocampus and Cerebellum of Rat Pups. Int. J. Mol. Sci. 2020, 21, 1083. [Google Scholar] [CrossRef]
- Kwon, H.S.; Koh, S.H. Neuroinflammation in neurodegenerative disorders: The roles of microglia and astrocytes. Transl. Neurodegener. 2020, 9, 42. [Google Scholar] [CrossRef]
- Kempuraj, D.; Thangavel, R.; Natteru, P.A.; Selvakumar, G.P.; Saeed, D.; Zahoor, H.; Zaheer, S.; Iyer, S.S.; Zaheer, A. Neuroinflammation Induces Neurodegeneration. J. Neurol. Neurosurg. Spine 2016, 1, 1003. [Google Scholar] [PubMed]
- Russo, M.V.; McGavern, D.B. Inflammatory neuroprotection following traumatic brain injury. Science 2016, 353, 783–785. [Google Scholar] [CrossRef]
- Badanjak, K.; Fixemer, S.; Smajić, S.; Skupin, A.; Grünewald, A. The Contribution of Microglia to Neuroinflammation in Parkinson’s Disease. Int. J. Mol. Sci. 2021, 22, 4676. [Google Scholar] [CrossRef]
- Di Benedetto, G.; Burgaletto, C.; Bellanca, C.M.; Munafò, A.; Bernardini, R.; Cantarella, G. Role of Microglia and Astrocytes in Alzheimer’s Disease: From Neuroinflammation to Ca2+ Homeostasis Dysregulation. Cells 2022, 11, 2728. [Google Scholar] [CrossRef]
- Rossignol, D.A.; Frye, R.E. Evidence linking oxidative stress, mitochondrial dysfunction, and inflammation in the brain of individuals with autism. Front. Physiol. 2014, 5, 150. [Google Scholar] [CrossRef] [PubMed]
- Liu, W.; Tang, Y.; Feng, J. Cross talk between activation of microglia and astrocytes in pathological conditions in the central nervous system. Life Sci. 2011, 89, 141–146. [Google Scholar] [CrossRef] [PubMed]
- Linnerbauer, M.; Wheeler, M.A.; Quintana, F.J. Astrocyte Crosstalk in CNS Inflammation. Neuron 2020, 108, 608–622. [Google Scholar] [CrossRef] [PubMed]
- Zhao, Q.; Xie, X.; Fan, Y.; Zhang, J.; Jiang, W.; Wu, X.; Yan, S.; Chen, Y.; Peng, C.; You, Z. Phenotypic dysregulation of microglial activation in young offspring rats with maternal sleep deprivation-induced cognitive impairment. Sci. Rep. 2015, 5, 9513. [Google Scholar] [CrossRef] [PubMed]
- Bronzuoli, M.R.; Facchinetti, R.; Ingrassia, D.; Sarvadio, M.; Schiavi, S.; Steardo, L.; Verkhratsky, A.; Trezza, V.; Scuderi, C. Neuroglia in the autistic brain: Evidence from a preclinical model. Mol. Autism 2018, 9, 66. [Google Scholar] [CrossRef]
- Kaur, C.; Rathnasamy, G.; Ling, E.A. Biology of Microglia in the Developing Brain. J. Neuropathol. Exp. Neurol. 2017, 76, 736–753. [Google Scholar] [CrossRef]
- Deckmann, I.; Schwingel, G.B.; Fontes-Dutra, M.; Bambini-Junior, V.; Gottfried, C. Neuroimmune alterations in autism: A translational analysis focusing on the animal model of autism induced by prenatal exposure to valproic acid. Neuroimmunomodulation 2018, 25, 285–299. [Google Scholar] [CrossRef]
- Glass, C.K.; Saijo, K.; Winner, B.; Marchetto, M.C.; Gage, F.H. Mechanisms underlying inflammation in neurodegeneration. Cell 2010, 140, 918–934. [Google Scholar] [CrossRef]
- Sudduth, T.L.; Schmitt, F.A.; Nelson, P.T.; Wilcock, D.M. Neuroinflammatory phenotype in early Alzheimer’s disease. Neurobiol. Aging 2013, 34, 1051–1059. [Google Scholar] [CrossRef] [PubMed]
- Zhang, L.; Zhang, J.; You, Z. Switching of the Microglial Activation Phenotype Is a Possible Treatment for Depression Disorder. Front. Cell Neurosci. 2018, 16, 306. [Google Scholar] [CrossRef] [PubMed]
- Cherry, J.D.; Olschowka, J.A.; O’Banion, M.K. Are “resting” microglia more “m2”? Front. Immunol. 2014, 18, 594. [Google Scholar] [CrossRef]
- Hickman, S.; Izzy, S.; Sen, P.; Morsett, L.; El Khoury, J. Microglia in neurodegeneration. Nat. Neurosci. 2018, 21, 1359–1369. [Google Scholar] [CrossRef]
- Perry, V.H.; Nicoll, J.A.; Holmes, C. Microglia in neurodegenerative disease. Nat. Rev. Neurol. 2010, 6, 193–201. [Google Scholar] [CrossRef]
- Łabuzek, K.; Skrudlik, E.; Gabryel, B.; Okopień, B. Przeciwzapalna funkcja komórek mikrogleju w świetle najnowszych badań naukowych. Ann. Acad. Med. Siles. 2015, 69, 99–110. [Google Scholar] [CrossRef]
- Petrelli, F.; Pucci, L.; Bezzi, P. Astrocytes and Microglia and Their Potential Link with Autism Spectrum Disorders. Front. Cell Neurosci. 2016, 10, 21. [Google Scholar] [CrossRef] [PubMed]
- Verkhratsky, A.; Nedergaard, M. Physiology of Astroglia. Physiol. Rev. 2018, 98, 239–389. [Google Scholar] [CrossRef] [PubMed]
- Moulson, A.J.; Squair, J.W.; Franklin, R.J.M.; Tetzlaff, W.; Assinck, P. Diversity of Reactive Astrogliosis in CNS Pathology: Heterogeneity or Plasticity? Front. Cell Neurosci. 2021, 15, 703810. [Google Scholar] [CrossRef] [PubMed]
- Struzyńska, L.; Chalimoniuk, M.; Sulkowski, G. The role of astroglia in Pb-exposed adult rat brain with respect to glutamate toxicity. Toxicology 2005, 212, 185–194. [Google Scholar] [CrossRef]
- Rose, C.F.; Verkhratsky, A.; Parpura, V. Astrocyte glutamine synthetase: Pivotal in health and disease. Biochem. Soc. Trans. 2013, 41, 1518–1524. [Google Scholar] [CrossRef]
- Robinson, S.R.; Lee, A.; Bishop, G.M.; Czerwinska, H.; Dringen, R. Inhibition of Astrocytic Glutamine Synthetase by Lead is Associated with a Slowed Clearance of Hydrogen Peroxide by the Glutathione System. Front. Integr. Neurosci. 2015, 9, 61. [Google Scholar] [CrossRef]
- Lindahl, L.S.; Bird, L.; Legare, M.E.; Mikeska, G.; Bratton, G.R.; Tiffany-Castiglioni, E. Differential ability of astroglia and neuronal cells to accumulate lead: Dependence on cell type and on degree of differentiation. Toxicol. Sci. 1999, 50, 236–243. [Google Scholar] [CrossRef]
- Tiffany-Castiglioni, E.; Sierra, E.M.; Wu, J.N.; Rowles, T.K. Lead toxicity in neuroglia. Neurotoxicology 1989, 10, 417–443. [Google Scholar]
- Sierra, E.M.; Tiffany-Castiglioni, E. Reduction of glutamine synthetase activity in astroglia exposed in culture to low levels of inorganic lead. Toxicology 1991, 65, 295–304. [Google Scholar] [CrossRef]
- Engle, M.J.; Volpe, J.J. Glutamine synthetase activity of developing astrocytes is inhibited in vitro by very low concentrations of lead. Brain Res. Dev. Brain Res. 1990, 55, 283–287. [Google Scholar] [CrossRef] [PubMed]
- Takeuchi, H.; Taki, Y.; Nouchi, R.; Yokoyama, R.; Kotozaki, Y.; Nakagawa, S.; Sekiguchi, A.; Iizuka, K.; Hanawa, S.; Araki, T.; et al. Lead exposure is associated with functional and microstructural changes in the healthy human brain. Commun. Biol. 2021, 4, 912. [Google Scholar] [CrossRef] [PubMed]
- Priego, N.; Valiente, M. The Potential of Astrocytes as Immune Modulators in Brain Tumors. Front. Immunol. 2019, 10, 1314. [Google Scholar] [CrossRef] [PubMed]
- Liddelow, S.A.; Barres, B.A. Reactive astrocytes: Production, function, and therapeutic potential. Immunity 2017, 46, 957–967. [Google Scholar] [CrossRef] [PubMed]
- Liu, L.R.; Liu, J.C.; Bao, J.S.; Bai, Q.Q.; Wang, G.Q. Interaction of Microglia and Astrocytes in the Neurovascular Unit. Front. Immunol. 2020, 11, 1024. [Google Scholar] [CrossRef]
- Sofroniew, M.V. Molecular dissection of reactive astrogliosis and glial scar formation. Trends Neurosci. 2009, 32, 638–647. [Google Scholar] [CrossRef] [PubMed]
- Sen, M.K.; Mahns, D.A.; Coorssen, J.R.; Shortland, P.J. The roles of microglia and astrocytes in phagocytosis and myelination: Insights from the cuprizone model of multiple sclerosis. Glia 2022, 70, 1215–1250. [Google Scholar] [CrossRef]
- Carpentier, P.A.; Begolka, W.S.; Olson, J.K.; Elhofy, A.; Karpus, W.J.; Miller, S.D. Differential activation of astrocytes by innate and adaptive immune stimuli. Glia 2005, 49, 360–374. [Google Scholar] [CrossRef]
- Hu, S.; Sheng, W.S.; Ehrlich, L.C.; Peterson, P.K.; Chao, C.C. Cytokine effects on glutamate uptake by human astrocytes. Neuroimmunomodulation 2000, 7, 153–159. [Google Scholar] [CrossRef] [PubMed]
- Thornton, P.; Pinteaux, E.; Gibson, R.M.; Allan, S.M.; Rothwell, N.J. Interleukin-1-induced neurotoxicity is mediated by glia and requires caspase activation and free radical release. J. Neurochem. 2006, 98, 258–266. [Google Scholar] [CrossRef]
- Huber, J.D.; Witt, K.A.; Hom, S.; Egleton, R.D.; Mark, K.S.; Davis, T.P. Inflammatory pain alters blood-brain barrier permeability and tight junctional protein expression. Am. J. Physiol. Heart Circ. Physiol. 2001, 280, 1241–1248. [Google Scholar] [CrossRef]
- Natoli, R.; Fernando, N.; Madigan, M.; Chu-Tan, J.A.; Valter, K.; Provis, J.; Rutar, M. Microglia-derived IL-1β promotes chemokine expression by Müller cells and RPE in focal retinal degeneration. Mol. Neurodegener. 2017, 12, 31. [Google Scholar] [CrossRef]
- Stoeckle, M.Y. Removal of a 3’ non-coding sequence is an initial step in degradation of gro alpha mRNA and is regulated by interleukin-1. Nucleic Acids Res. 1992, 20, 1123–1127. [Google Scholar] [CrossRef] [PubMed]
- Shattuck, R.L.; Wood, L.D.; Jaffe, G.J.; Richmond, A. MGSA/GRO transcription is differentially regulated in normal retinal pigment epithelial and melanoma cells. Mol. Cell Biol. 1994, 14, 791–802. [Google Scholar]
- Liu, L.; Li, M.; Spangler, L.C.; Spear, C.; Veenstra, M.; Darnall, L.; Chang, C.; Cotleur, A.C.; Ransohoff, R.M. Functional defect of peripheral neutrophils in mice with induced deletion of CXCR2. Genesis 2013, 51, 587–595. [Google Scholar] [CrossRef]
- Geissmann, F.; Jung, S.; Littman, D.R. Blood monocytes consist of two principal subsets with distinct migratory properties. Immunity 2003, 19, 71–82. [Google Scholar] [CrossRef]
- Geiser, T.; Dewald, B.; Ehrengruber, M.U.; Clark-Lewis, I.; Baggiolini, M. The interleukin-8-related chemotactic cytokines GRO alpha, GRO beta, and GRO gamma activate human neutrophil and basophil leukocytes. J. Biol. Chem. 1993, 268, 15419–15424. [Google Scholar] [CrossRef] [PubMed]
- Dunican, A.; Grutkoski, P.; Leuenroth, S.; Ayala, A.; Simms, H.H. Neutrophils regulate their own apoptosis via preservation of CXC receptors. J. Surg. Res. 2000, 90, 32–38. [Google Scholar] [CrossRef]
- Addison, C.L.; Daniel, T.O.; Burdick, M.D.; Liu, H.; Ehlert, J.E.; Xue, Y.Y.; Buechi, L.; Walz, A.; Richmond, A.; Strieter, R.M. The CXC chemokine receptor 2, CXCR2, is the putative receptor for ELR+ CXC chemokine-induced angiogenic activity. J. Immunol. 2000, 165, 5269–5277. [Google Scholar] [CrossRef] [PubMed]
- Liu, J.T.; Dong, M.H.; Zhang, J.Q.; Bai, Y.; Kuang, F.; Chen, L.W. Microglia and astroglia: The role of neuroinflammation in lead toxicity and neuronal injury in the brain. Neuroimmunol. Neuroinflamm. 2015, 2, 131–137. [Google Scholar]
- Baranowska-Bosiacka, I.; Falkowska, A.; Gutowska, I.; Gąssowska, M.; Kolasa-Wołosiuk, A.; Tarnowski, M.; Chibowska, K.; Goschorska, M.; Lubkowska, A.; Chlubek, D. Glycogen metabolism in brain and neurons-astrocytes metabolic cooperation can be altered by pre- and neonatal lead (Pb) exposure. Toxicology 2017, 390, 146–158. [Google Scholar] [CrossRef] [PubMed]
- Struzynska, L.; Dabrowska-Bouta, B.; Koza, K.; Sulkowski, G. Inflammation-like glial response in lead-exposed immature rat brain. Toxicol. Sci. 2007, 95, 156–162. [Google Scholar] [CrossRef] [PubMed]
- Liu, M.C.; Liu, X.Q.; Wang, W.; Shen, X.F.; Che, H.L.; Guo, Y.Y.; Zhao, M.G.; Chen, J.Y.; Luo, W.J. Involvement of microglia activation in the lead induced long-term potentiation impairment. PLoS ONE 2012, 7, e43924. [Google Scholar] [CrossRef]
- Zurich, M.G.; Eskes, C.; Honegger, P.; Bérode, M.; Monnet-Tschudi, F. Maturation-dependent neurotoxicity of lead acetate In vitro: Implication of glial reactions. J. Neurosci. Res. 2002, 70, 108–116. [Google Scholar] [CrossRef]
- Li, N.; Liu, F.; Song, L.; Zhang, P.; Qiao, M.; Zhao, Q.; Li, W. The effects of early life Pb exposure on the expression of IL1-β, TNF-A and Aβ in cerebral cortex of mouse pups. J. Trace Elem. Med. Biol. 2014, 28, 100–104. [Google Scholar] [CrossRef] [PubMed]
- Li, N.; Liu, X.; Zhang, P.; Qiao, M.; Li, H.; Li, X.; Zhang, H.; Yu, Z. The effects of early life lead exposure on the expression of interleukin (IL) 1β, IL-6, and glial fibrillary acidic protein in the hippocampus of mouse pups. Hum. Exp. Toxicol. 2015, 34, 357–363. [Google Scholar] [CrossRef]
- Cheng, Y.J.; Liu, M.Y.; Wu, T.P.; Yang, B.C. Regulation of tumor necrosis factor-alpha in glioma cells by lead and lipopolysaccharide: Involvement of common signaling pathway. Toxicol. Lett. 2004, 152, 127–137. [Google Scholar]
- Liu, J.T.; Chen, B.Y.; Zhang, J.Q.; Kuang, F.; Chen, L.W. Lead exposure induced microgliosis and astrogliosis in hippocampus of young mice potentially by triggering TLR4-MyD88-NFκB signaling cascades. Toxicol. Lett. 2015, 239, 97–107. [Google Scholar] [CrossRef]
- Wu, L.; Li, S.; Pang, S.; Zhang, B.; Wang, J.; He, B.; Lv, L.; Wang, W.; Zhao, N.; Zhang, Y. Effects of lead exposure on the activation of microglia in mice fed with high-fat diets. Environ. Toxicol. 2021, 36, 1923–1931. [Google Scholar] [CrossRef]
- Mu, Y.; Yu, J.; Ji, W.; Chen, L.; Wang, X.; Yan, B. Alleviation of Pb2+ pollution-induced oxidative stress and toxicity in microglial cells and zebrafish larvae by chicoric acid. Ecotoxicol. Environ. Saf. 2019, 180, 396–402. [Google Scholar] [CrossRef] [PubMed]
- Sobin, C.; Montoya, M.G.; Parisi, N.; Schaub, T.; Cervantes, M.; Armijos, R.X. Microglial disruption in young mice with early chronic lead exposure. Toxicol. Lett. 2013, 220, 44–52. [Google Scholar] [CrossRef] [PubMed]
- Verkhratsky, A.; Parpura, V.; Vardjan, N.; Zorec, R. Physiology of Astroglia. Adv. Exp. Med. Biol. 2019, 1175, 45–91. [Google Scholar] [CrossRef] [PubMed]
- Cunningham, C.; Dunne, A.; Lopez-Rodriguez, A.B. Astrocytes: Heterogeneous and Dynamic Phenotypes in Neurodegeneration and Innate Immunity. Neuroscientist 2019, 25, 455–474. [Google Scholar] [CrossRef]
- Biesmans, S.; Acton, P.D.; Cotto, C.; Langlois, X.; Ver Donck, L.; Bouwknecht, J.A.; Aelvoet, S.A.; Hellings, N.; Meert, T.F.; Nuydens, R. Effect of stress and peripheral immune activation on astrocyte activation in transgenic bioluminescent Gfap-luc mice. Glia 2015, 63, 1126–1137. [Google Scholar] [CrossRef]
- Villa-Cedillo, S.A.; Nava-Hernández, M.P.; Soto-Domínguez, A.; Hernández-Ibarra, J.A.; Perez-Trujillo, J.J.; Saucedo-Cárdenas, O. Neurodegeneration, demyelination, and astrogliosis in rat spinal cord by chronic lead treatment. Cell Biol. Int. 2019, 43, 706–714. [Google Scholar] [CrossRef] [PubMed]
- Eid, T.; Tu, N.; Lee, T.S.; Lai, J.C. Regulation of astrocyte glutamine synthetase in epilepsy. Neurochem. Int. 2013, 63, 670–681. [Google Scholar] [CrossRef]
- Son, H.; Kim, S.; Jung, D.H.; Baek, J.H.; Lee, D.H.; Roh, G.S.; Kang, S.S.; Cho, G.J.; Choi, W.S.; Lee, D.K.; et al. Insufficient glutamine synthetase activity during synaptogenesis causes spatial memory impairment in adult mice. Sci. Rep. 2019, 9, 252. [Google Scholar] [CrossRef]
- Palmieri, E.M.; Menga, A.; Martín-Pérez, R.; Quinto, A.; Riera-Domingo, C.; De Tullio, G.; Hooper, D.C.; Lamers, W.H.; Ghesquière, B.; McVicar, D.W.; et al. Pharmacologic or Genetic Targeting of Glutamine Synthetase Skews Macrophages toward an M1-like Phenotype and Inhibits Tumor Metastasis. Cell Rep. 2017, 20, 1654–1666. [Google Scholar] [CrossRef]
- Spodenkiewicz, M.; Diez-Fernandez, C.; Rüfenacht, V.; Gemperle-Britschgi, C.; Häberle, J. Minireview on Glutamine Synthetase Deficiency, an Ultra-Rare Inborn Error of Amino Acid Biosynthesis. Biology 2016, 5, 40. [Google Scholar] [CrossRef]
- Xia, M.; Hyman, B.T. GROalpha/KC, a chemokine receptor CXCR2 ligand, can be a potent trigger for neuronal ERK1/2 and PI-3 kinase pathways and for tau hyperphosphorylation-a role in Alzheimer’s disease? J. Neuroimmunol. 2002, 122, 55–64. [Google Scholar] [CrossRef] [PubMed]
- Zhang, X.F.; Zhao, Y.F.; Zhu, S.W.; Huang, W.J.; Luo, Y.; Chen, Q.Y.; Ge, L.J.; Li, R.S.; Wang, J.F.; Sun, M.; et al. CXCL1 Triggers Caspase-3 Dependent Tau Cleavage in Long-Term Neuronal Cultures and in the Hippocampus of Aged Mice: Implications in Alzheimer’s Disease. J. Alzheimers Dis. 2015, 48, 89–104. [Google Scholar] [CrossRef] [PubMed]
- Bakshi, P.; Jin, C.; Broutin, P.; Berhane, B.; Reed, J.; Mullan, M. Structural optimization of a CXCR2-directed antagonist that indirectly inhibits gamma-secretase and reduces Abeta. Bioorg. Med. Chem. 2009, 17, 8102–8112. [Google Scholar] [CrossRef]
- Zhang, K.; Tian, L.; Liu, L.; Feng, Y.; Dong, Y.B.; Li, B.; Shang, D.S.; Fang, W.G.; Cao, Y.P.; Chen, Y.H. CXCL1 contributes to β-amyloid-induced transendothelial migration of monocytes in Alzheimer’s disease. PLoS ONE 2013, 8, e72744. [Google Scholar] [CrossRef]
- Kang, H.G.; Jeong, S.H.; Cho, M.R.; Cho, J.H.; Bischoff, K. Time-dependent changes in lead and delta-aminolevulinic acid after subchronic lead exposure in rats. Hum. Exp. Toxicol. 2009, 28, 647–654. [Google Scholar] [CrossRef]
- Xu, J.; Yan, C.H.; Yu, X.G.; Shen, X.M.; Gao, Y.; Yu, X.D.; Wu, S.H.; Shen, X. Effects of the lead exposure on expression of mGluR gene in developed hippocampus. Zhonghua Yi Xue Za Zhi 2005, 85, 705–707. [Google Scholar] [PubMed]
- Bidmon, H.J.; Gorg, B.; Palomero-Gallagher, N.; Schleicher, A.; Haussinger, D.; Speckmann, E.J.; Zilles, K. Glutamine synthetase becomes nitrated and its activity is reduced during repetitive seizure activity in the pentylentetrazole model of epilepsy. Epilepsia 2008, 49, 1733–1748. [Google Scholar] [CrossRef]
- Pawlik, M.J.; Obara-Michlewska, M.; Popek, M.P.; Czarnecka, A.M.; Czuczwar, S.J.; Łuszczki, J.; Kołodziej, M.; Acewicz, A.; Wierzba-Bobrowicz, T.; Albrecht, J. Pretreatment with a glutamine synthetase inhibitor MSO delays the onset of initial seizures induced by pilocarpine in juvenile rats. Brain Res. 2021, 1753, 147253. [Google Scholar] [CrossRef]


Disclaimer/Publisher’s Note: The statements, opinions and data contained in all publications are solely those of the individual author(s) and contributor(s) and not of MDPI and/or the editor(s). MDPI and/or the editor(s) disclaim responsibility for any injury to people or property resulting from any ideas, methods, instructions or products referred to in the content. |
© 2023 by the authors. Licensee MDPI, Basel, Switzerland. This article is an open access article distributed under the terms and conditions of the Creative Commons Attribution (CC BY) license (https://creativecommons.org/licenses/by/4.0/).
Share and Cite
Gąssowska-Dobrowolska, M.; Chlubek, M.; Kolasa, A.; Tomasiak, P.; Korbecki, J.; Skowrońska, K.; Tarnowski, M.; Masztalewicz, M.; Baranowska-Bosiacka, I. Microglia and Astroglia—The Potential Role in Neuroinflammation Induced by Pre- and Neonatal Exposure to Lead (Pb). Int. J. Mol. Sci. 2023, 24, 9903. https://doi.org/10.3390/ijms24129903
Gąssowska-Dobrowolska M, Chlubek M, Kolasa A, Tomasiak P, Korbecki J, Skowrońska K, Tarnowski M, Masztalewicz M, Baranowska-Bosiacka I. Microglia and Astroglia—The Potential Role in Neuroinflammation Induced by Pre- and Neonatal Exposure to Lead (Pb). International Journal of Molecular Sciences. 2023; 24(12):9903. https://doi.org/10.3390/ijms24129903
Chicago/Turabian StyleGąssowska-Dobrowolska, Magdalena, Mikołaj Chlubek, Agnieszka Kolasa, Patrycja Tomasiak, Jan Korbecki, Katarzyna Skowrońska, Maciej Tarnowski, Marta Masztalewicz, and Irena Baranowska-Bosiacka. 2023. "Microglia and Astroglia—The Potential Role in Neuroinflammation Induced by Pre- and Neonatal Exposure to Lead (Pb)" International Journal of Molecular Sciences 24, no. 12: 9903. https://doi.org/10.3390/ijms24129903
APA StyleGąssowska-Dobrowolska, M., Chlubek, M., Kolasa, A., Tomasiak, P., Korbecki, J., Skowrońska, K., Tarnowski, M., Masztalewicz, M., & Baranowska-Bosiacka, I. (2023). Microglia and Astroglia—The Potential Role in Neuroinflammation Induced by Pre- and Neonatal Exposure to Lead (Pb). International Journal of Molecular Sciences, 24(12), 9903. https://doi.org/10.3390/ijms24129903