
Differences in Plasma Cannabidiol Concentrations in Women and Men: A Randomized, Placebo-Controlled, Crossover Study

 , , ,
, , ,  ,
,  and
and
Abstract
1. Introduction
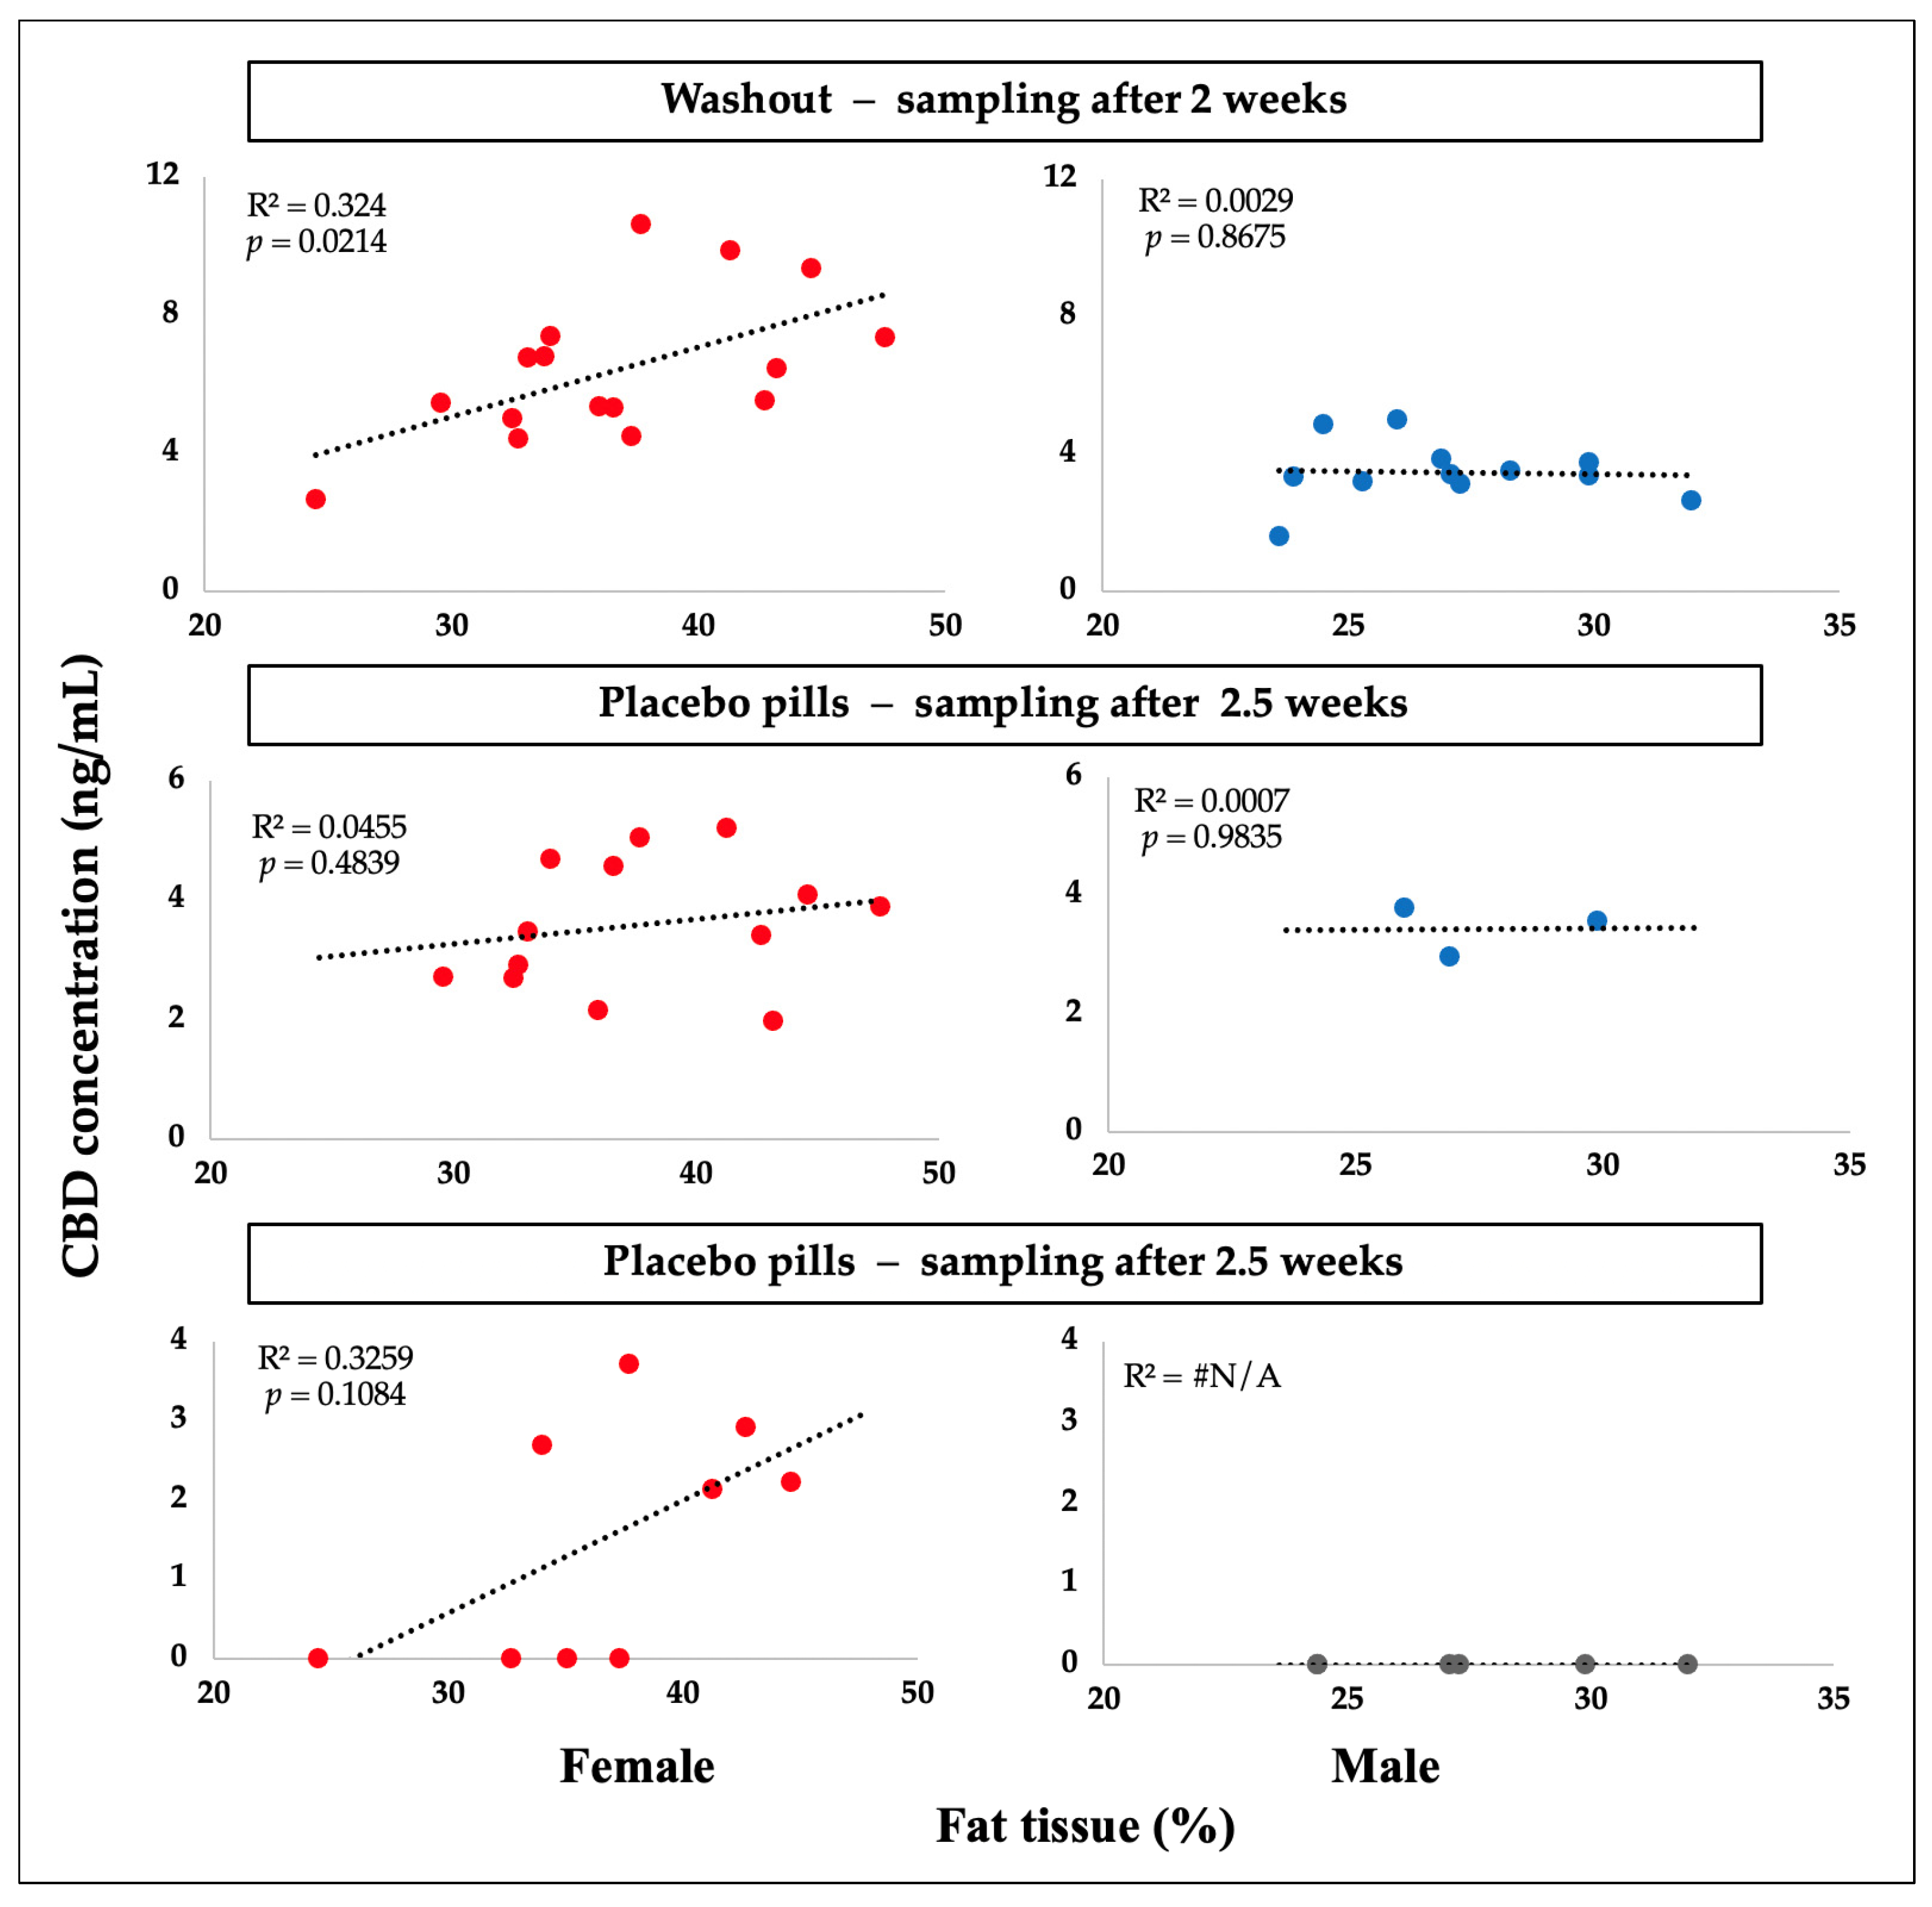
2. Results
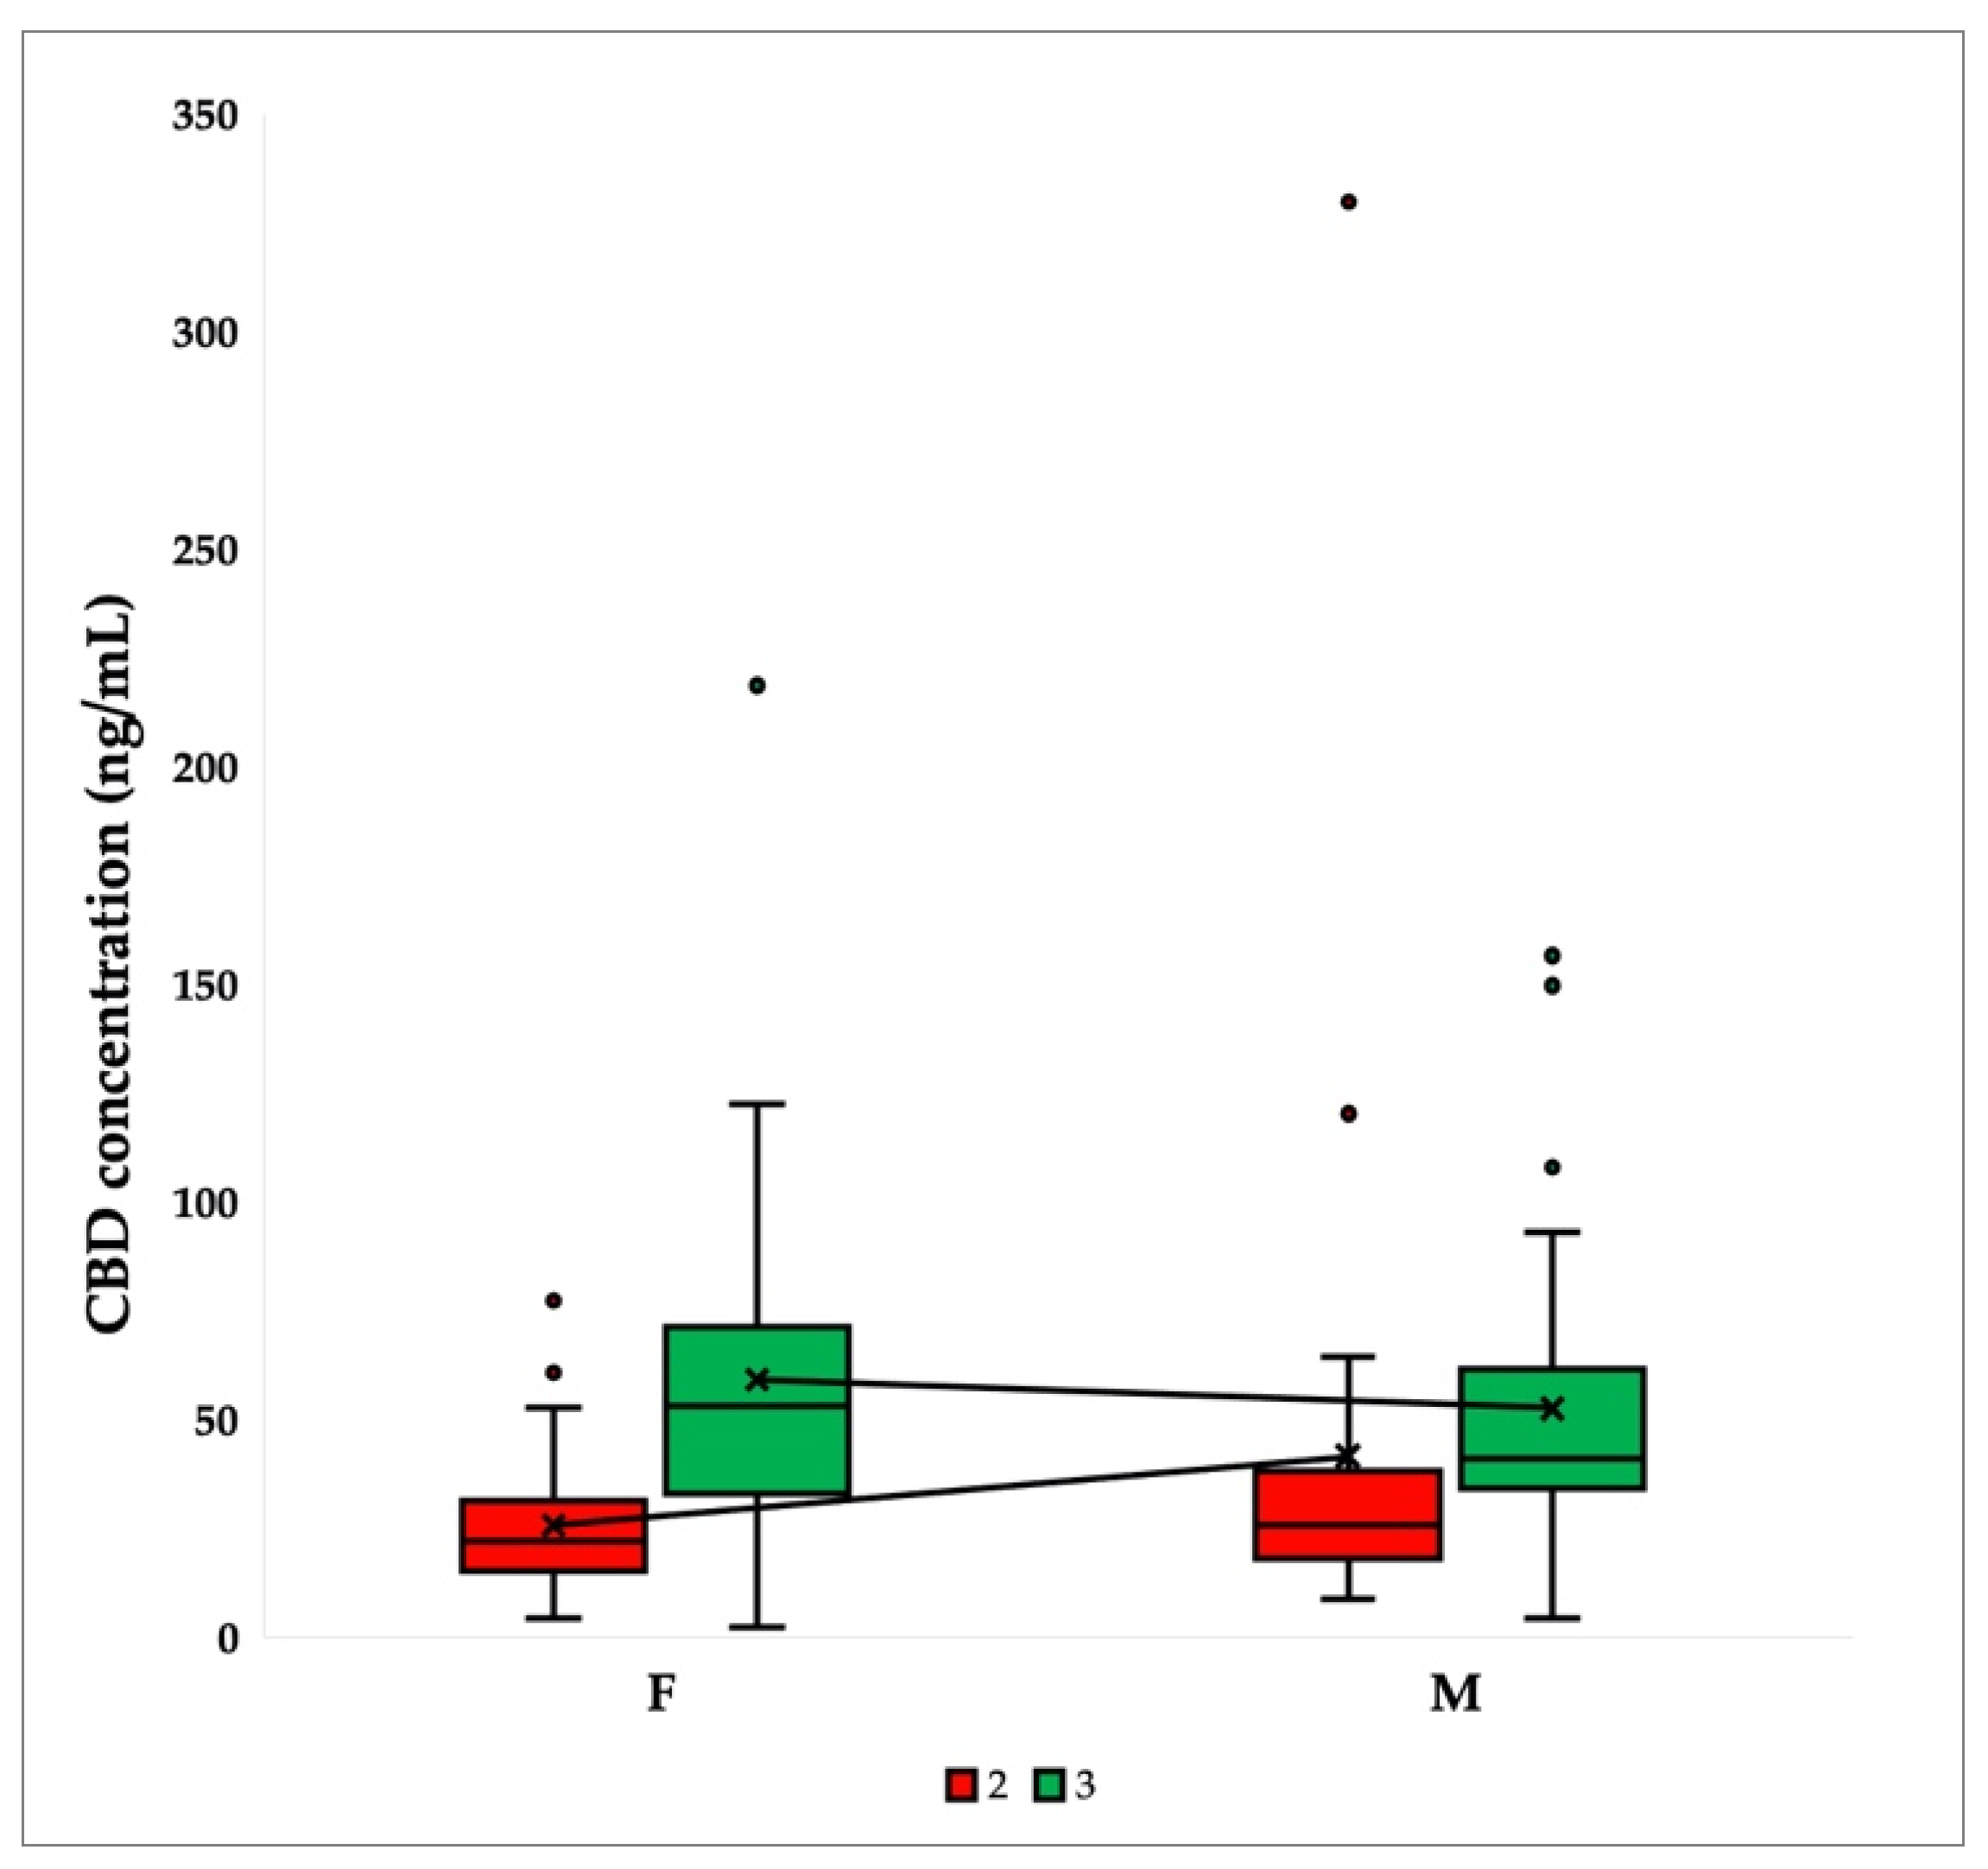
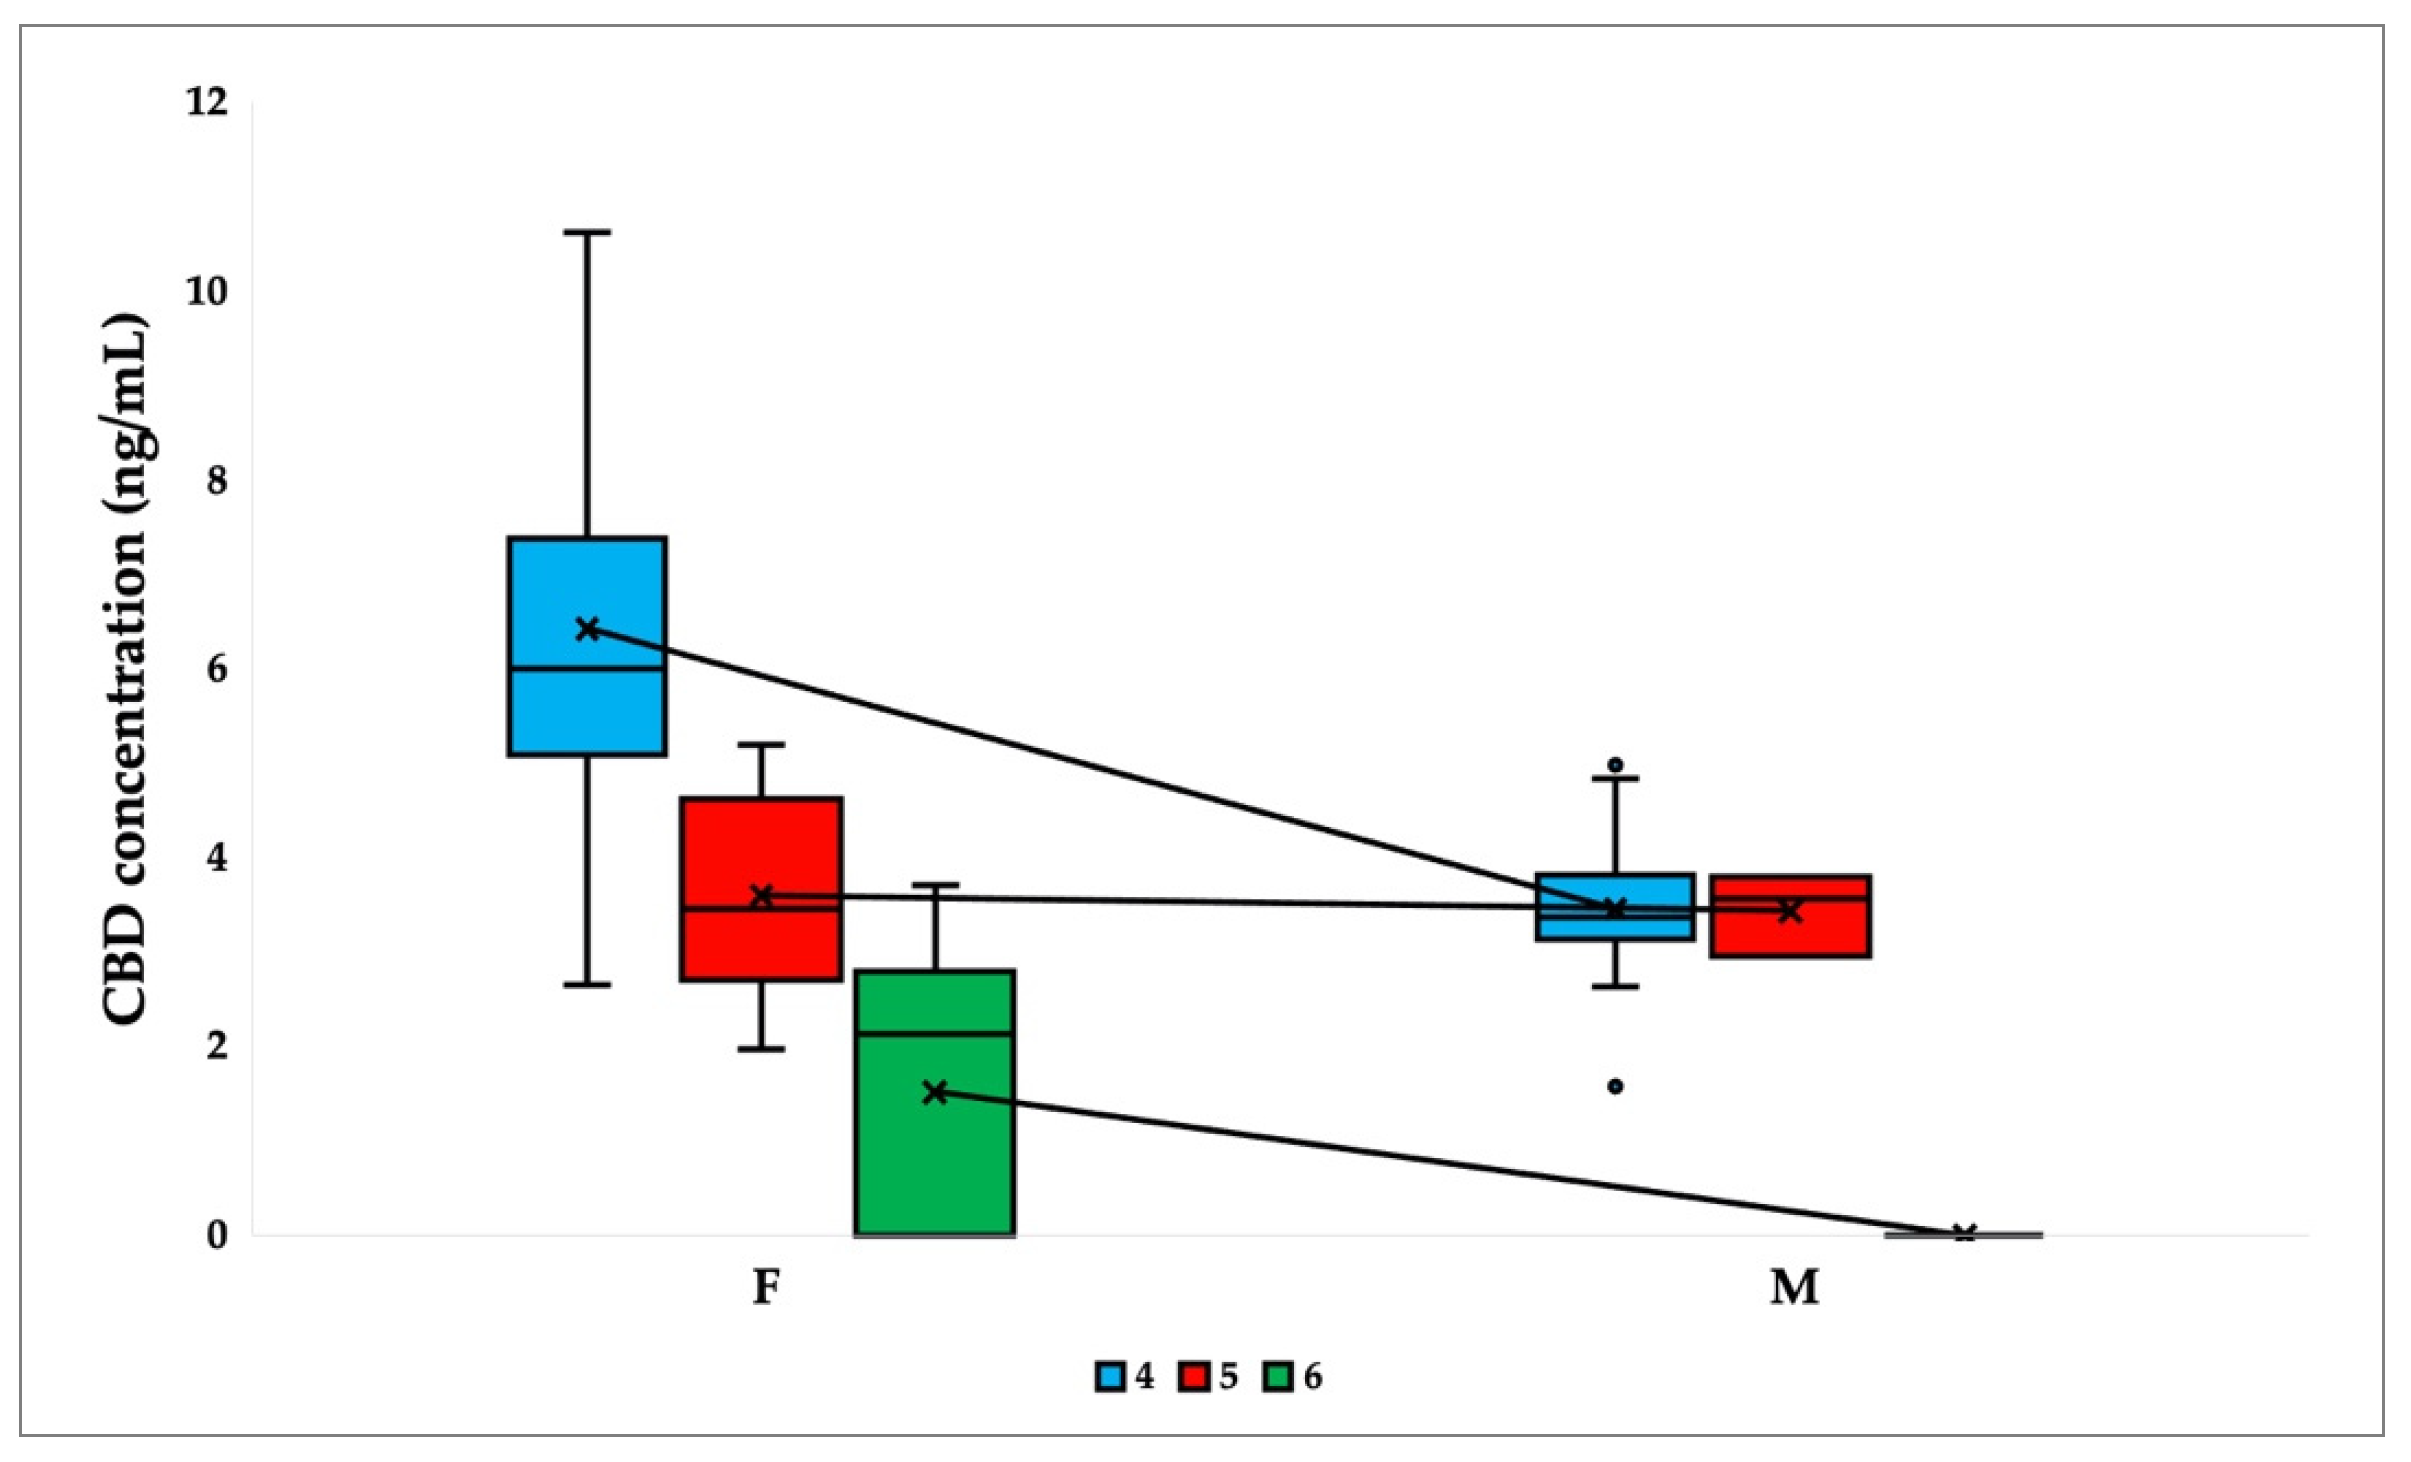
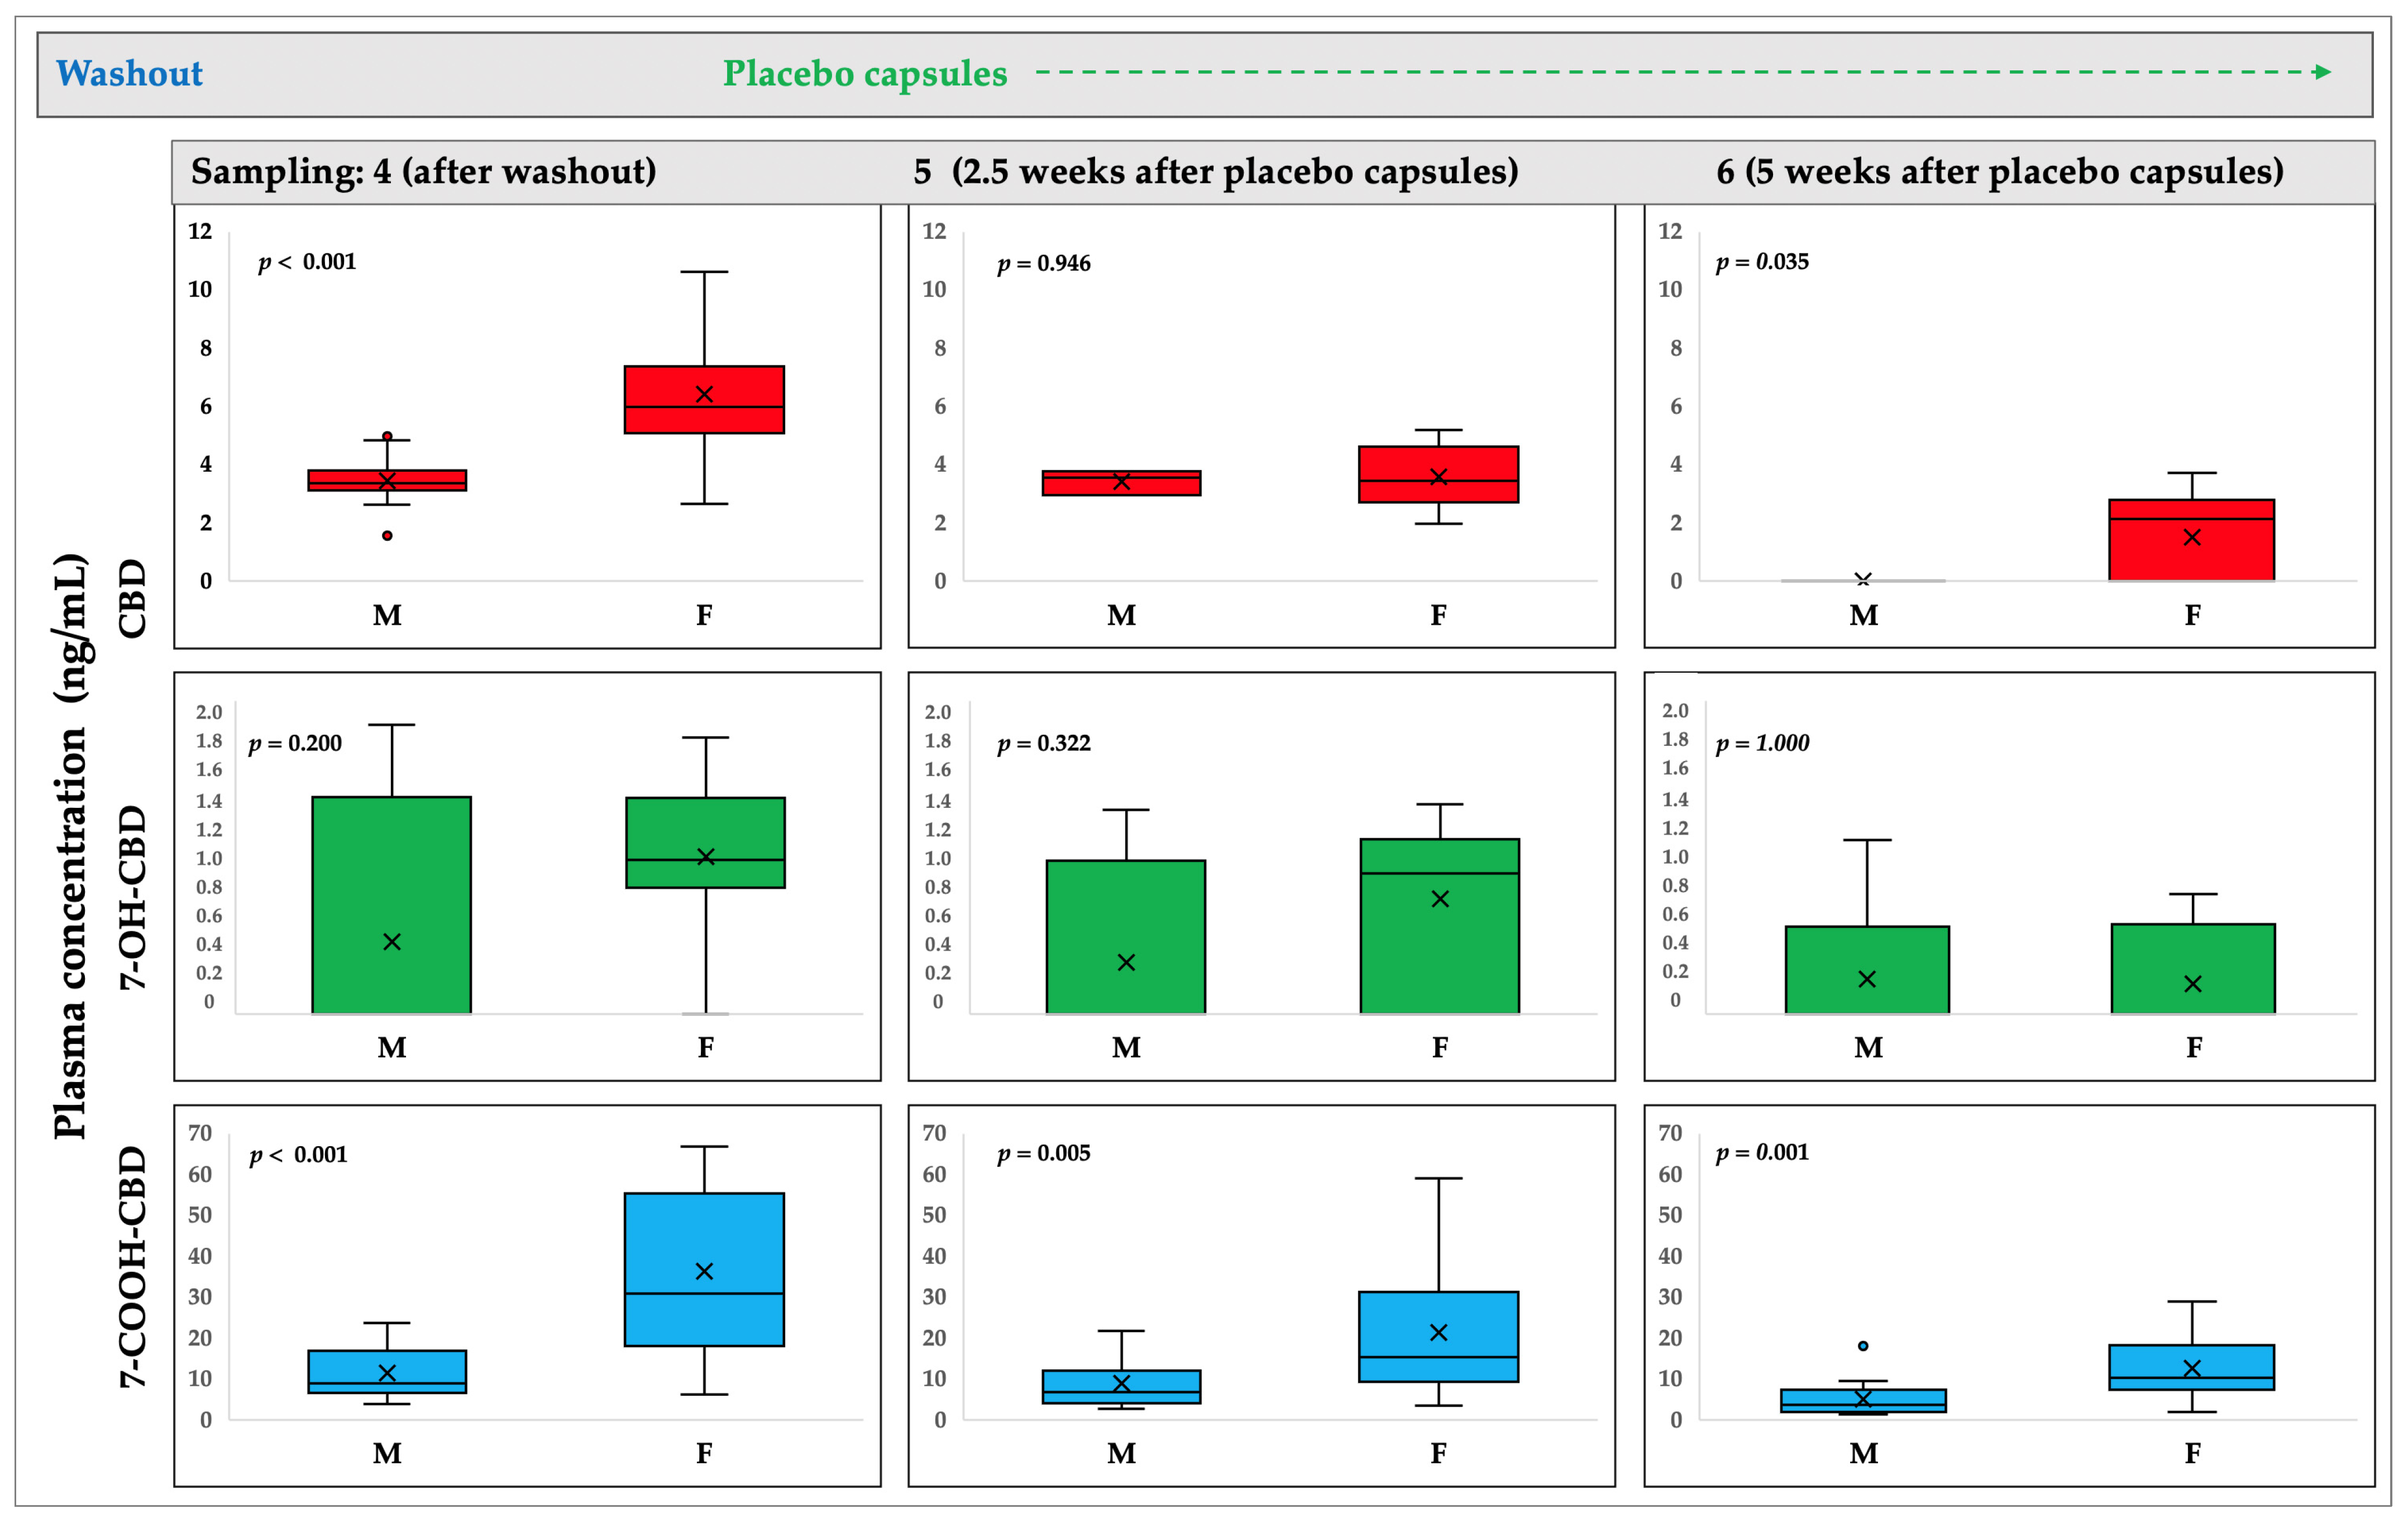
2.1. CBD and Metabolites Concentrations
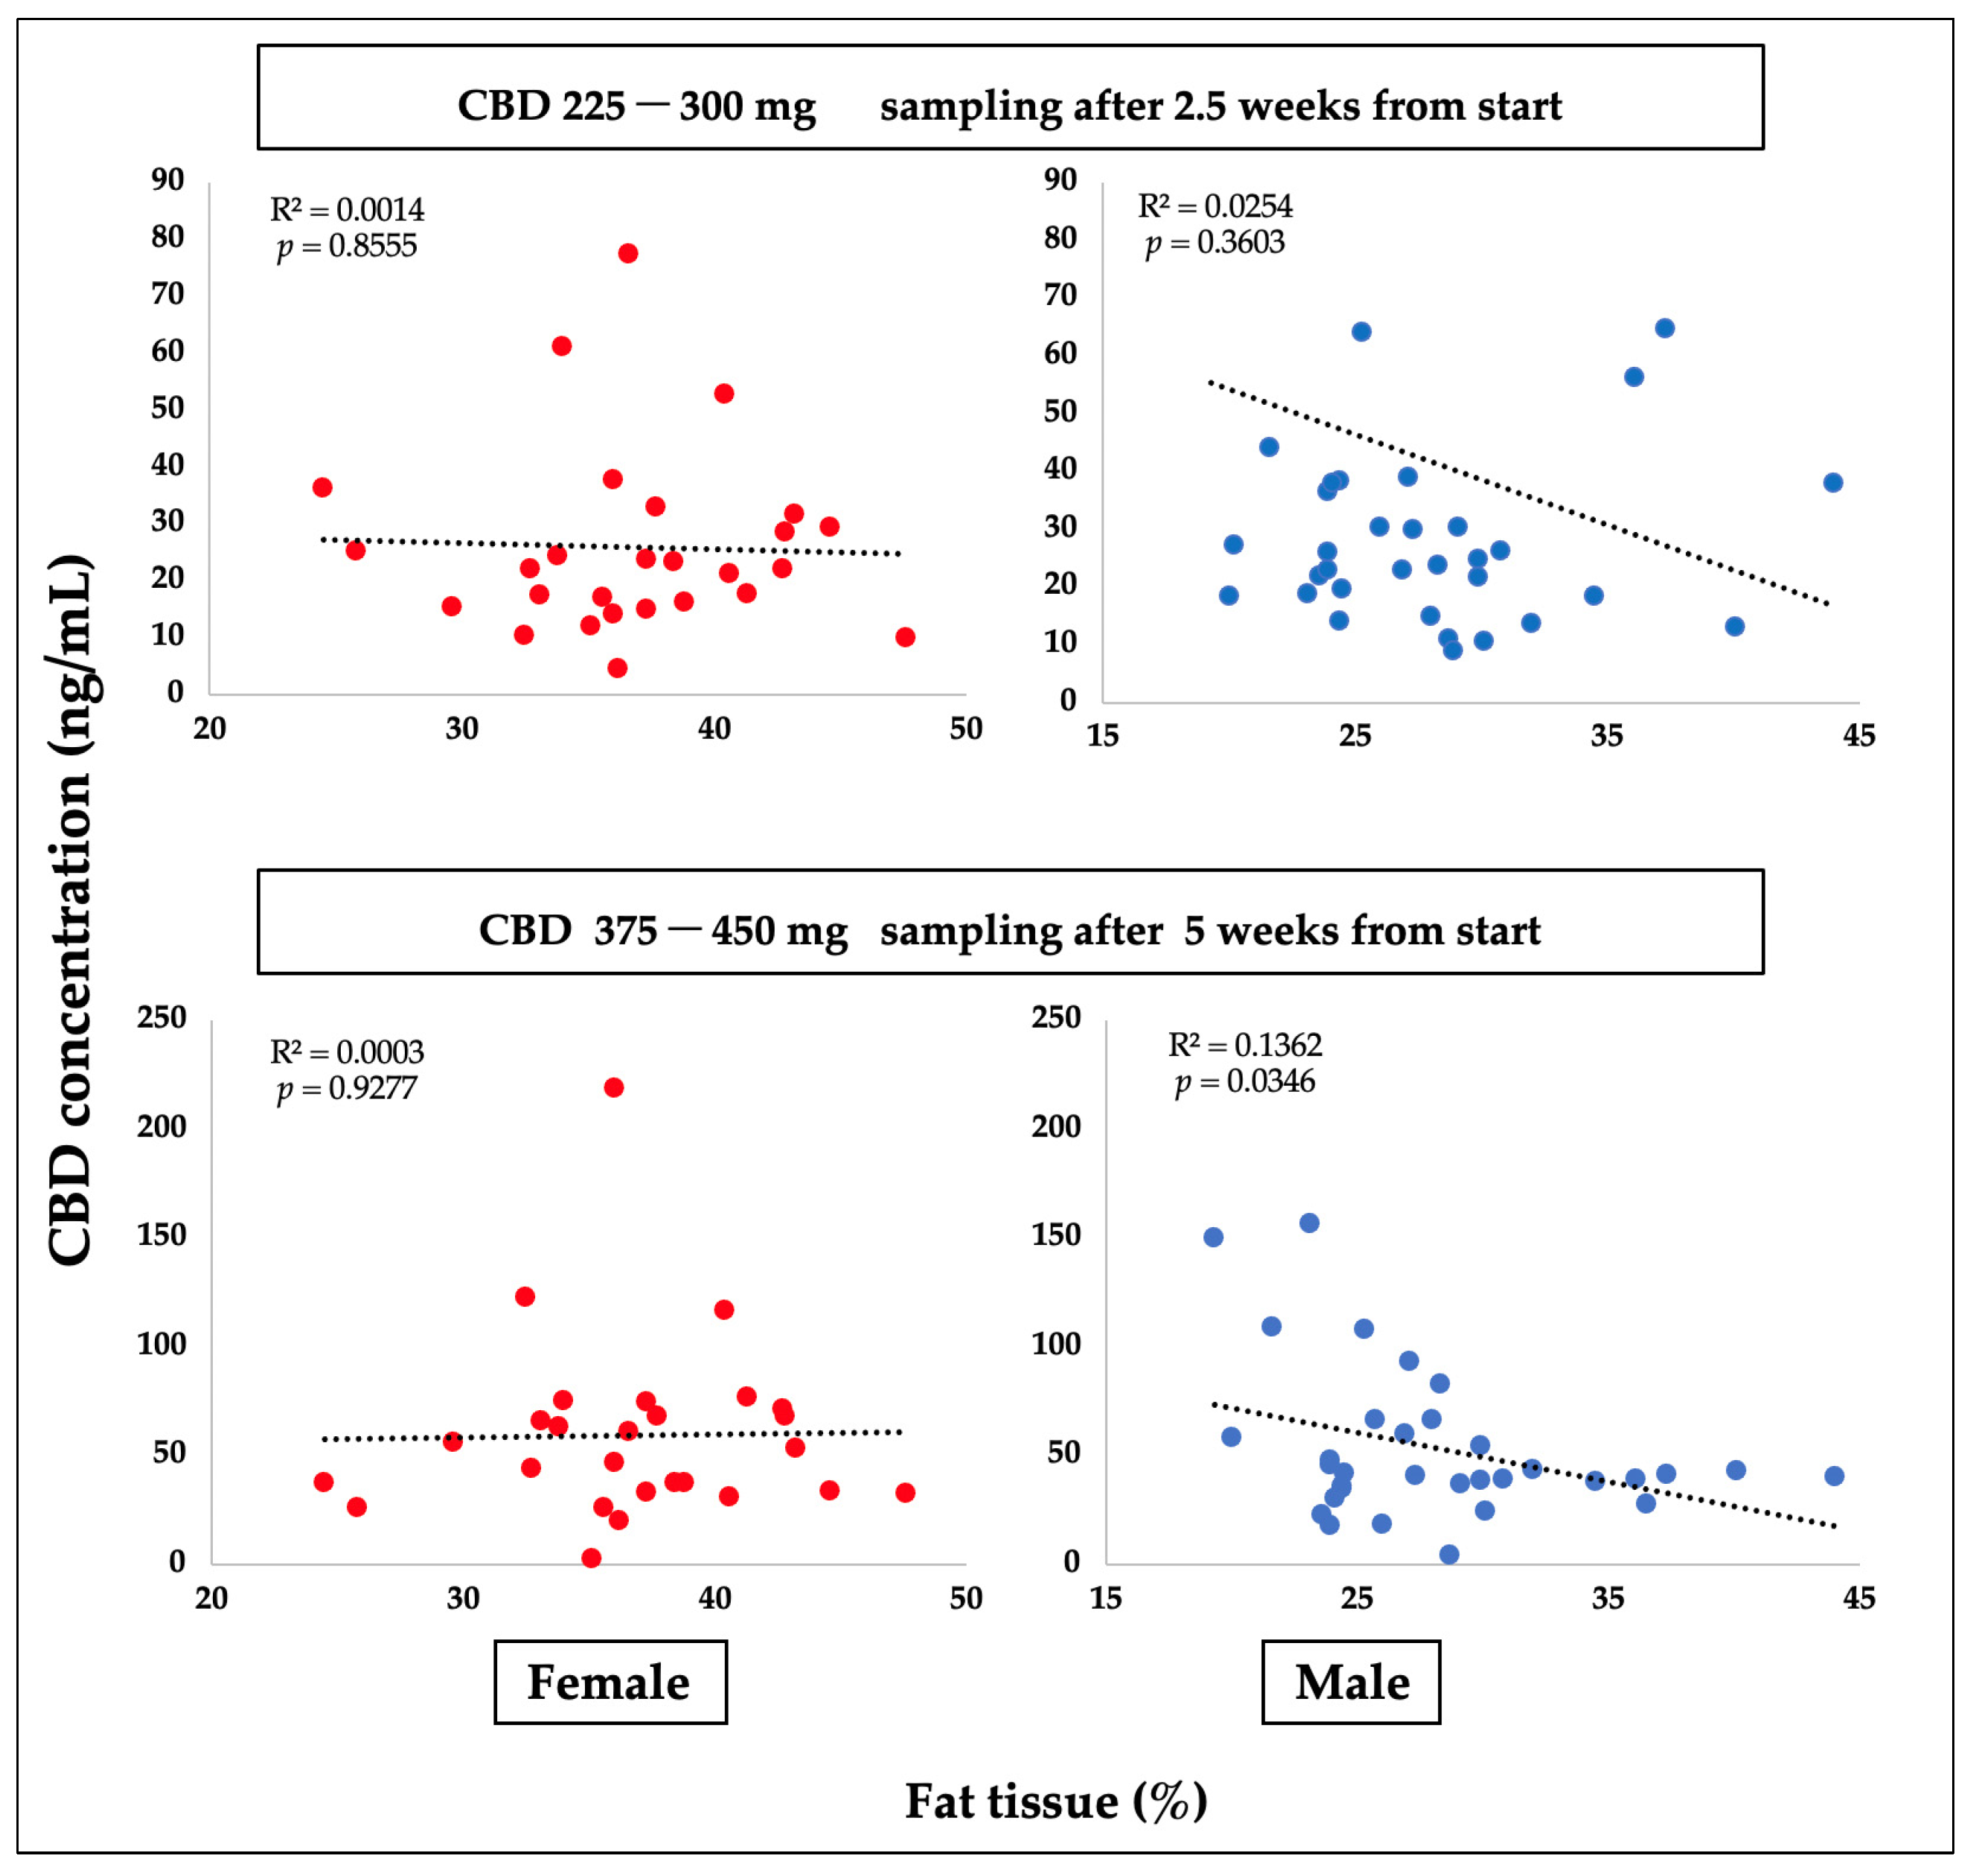
2.2. Association of Concentrations with CYP Genotype and Phenotype of Subjects
3. Discussion
3.1. Sex Difference
3.2. Implications
3.3. CYP Genotype and Phenotype
3.4. Study Limitations
4. Materials and Methods
4.1. Participants and Ethical Approval
4.2. Anthropometrics and Background
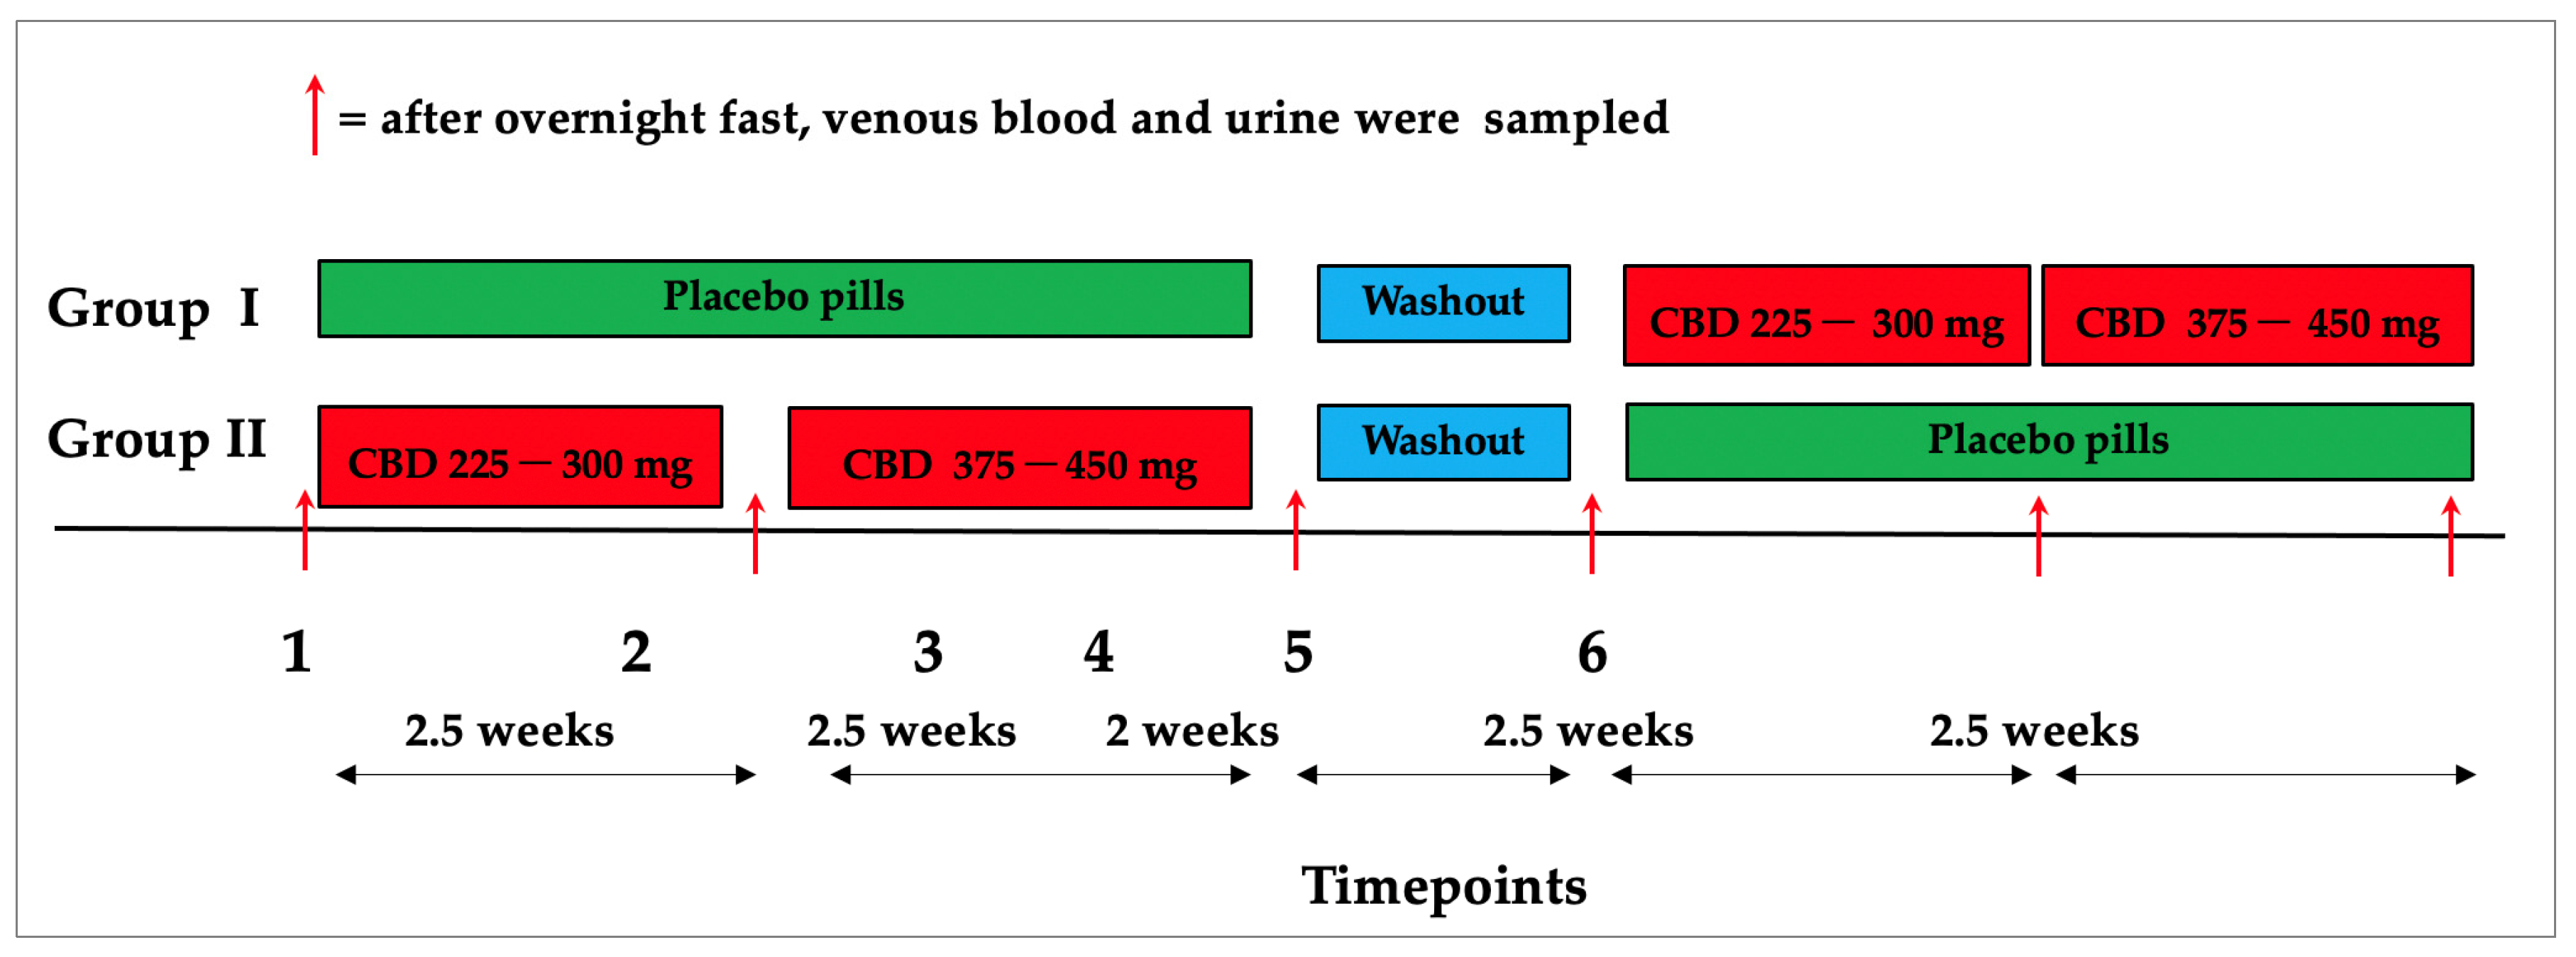
4.3. Research Design
4.4. Sample Collection and Storage
4.5. Plasma and Urine Samples Extraction
4.6. Standard Solutions
4.7. LC-MS Analysis
4.8. DNA Analysis and SNP Genotyping
4.9. Statistical Analysis
5. Conclusions
Author Contributions
Funding
Institutional Review Board Statement
Informed Consent Statement
Data Availability Statement
Conflicts of Interest
References
- Devinsky, O.; Cross, J.H.; Laux, L.; Marsh, E.; Miller, I.; Nabbout, R.; Scheffer, I.E.; Thiele, E.A.; Wright, S.; Cannabidiol in Dravet Syndrome Study Group. Trial of Cannabidiol for Drug-Resistant Seizures in the Dravet Syndrome. N. Engl. J. Med. 2017, 376, 2011–2020. [Google Scholar] [CrossRef] [PubMed]
- Taylor, L.; Gidal, B.; Blakey, G.; Tayo, B.; Morrison, G. A Phase I, Randomized, Double-Blind, Placebo-Controlled, Single Ascending Dose, Multiple Dose, and Food Effect Trial of the Safety, Tolerability and Pharmacokinetics of Highly Purified Cannabidiol in Healthy Subjects. CNS Drugs 2018, 32, 1053–1067. [Google Scholar] [CrossRef]
- Solowij, N.; Broyd, S.J.; Beale, C.; Prick, J.A.; Greenwood, L.M.; van Hell, H.; Suo, C.; Galettis, P.; Pai, N.; Fu, S.; et al. Therapeutic Effects of Prolonged Cannabidiol Treatment on Psychological Symptoms and Cognitive Function in Regular Cannabis Users: A Pragmatic Open-Label Clinical Trial. Cannabis Cannabinoid Res. 2018, 3, 21–34. [Google Scholar] [CrossRef]
- Khalsa, J.H.; Bunt, G.; Blum, K.; Maggirwar, S.B.; Galanter, M.; Potenza, M.N. Review: Cannabinoids as Medicinals. Curr. Addict. Rep. 2022, 9, 630–646. [Google Scholar] [CrossRef]
- Huestis, M.A. Human cannabinoid pharmacokinetics. Chem. Biodivers. 2007, 4, 1770–1804. [Google Scholar] [CrossRef]
- Millar, S.A.; Maguire, R.F.; Yates, A.S.; O’Sullivan, S.E. Towards Better Delivery of Cannabidiol (CBD). Pharmaceuticals 2020, 13, 219. [Google Scholar] [CrossRef] [PubMed]
- Franco, V.; Gershkovich, P.; Perucca, E.; Bialer, M. The Interplay Between Liver First-Pass Effect and Lymphatic Absorption of Cannabidiol and Its Implications for Cannabidiol Oral Formulations. Clin. Pharmacokinet. 2020, 59, 1493–1500. [Google Scholar] [CrossRef] [PubMed]
- Patrician, A.; Versic-Bratincevic, M.; Mijacika, T.; Banic, I.; Marendic, M.; Sutlovic, D.; Dujic, Z.; Ainslie, P.N. Examination of a New Delivery Approach for Oral Cannabidiol in Healthy Subjects: A Randomized, Double-Blinded, Placebo-Controlled Pharmacokinetics Study. Adv. Ther. 2019, 36, 3196–3210. [Google Scholar] [CrossRef]
- Kumric, M.; Bozic, J.; Dujic, G.; Vrdoljak, J.; Dujic, Z. Chronic Effects of Effective Oral Cannabidiol Delivery on 24-h Ambulatory Blood Pressure and Vascular Outcomes in Treated and Untreated Hypertension (HYPER-H21-4): Study Protocol for a Randomized, Placebo-Controlled, and Crossover Study. J. Pers. Med. 2022, 12, 1037. [Google Scholar] [CrossRef]
- Kumric, M.; Dujic, G.; Vrdoljak, J.; Svagusa, K.; Kurir, T.T.; Supe-Domic, D.; Dujic, Z.; Bozic, J. CBD supplementation reduces arterial blood pressure via modulation of the sympatho-chromaffin system: A substudy from the HYPER-H21-4 trial. Biomed. Pharmacother. 2023, 160, 114387. [Google Scholar] [CrossRef] [PubMed]
- Knaub, K.; Sartorius, T.; Dharsono, T.; Wacker, R.; Wilhelm, M.; Schon, C. A Novel Self-Emulsifying Drug Delivery System (SEDDS) Based on VESIsorb® Formulation Technology Improving the Oral Bioavailability of Cannabidiol in Healthy Subjects. Molecules 2019, 24, 2967. [Google Scholar] [CrossRef]
- Dujic, G.; Kumric, M.; Vrdoljak, J.; Dujic, Z.; Bozic, J. Chronic Effects of Oral Cannabidiol Delivery on 24-h Ambulatory Blood Pressure in Patients with Hypertension (HYPER-H21-4): A Randomized, Placebo-Controlled, and Crossover Study. In Cannabis and Cannabinoid Research; Mary Ann Liebert, Inc.: New York, NY, USA, 2023. [Google Scholar] [CrossRef]
- Batinic, A.; Sutlović, D.; Kuret, S.; Matana, A.; Kumric, M.; Bozic, J.; Dujic, Z. Trial of a Novel Oral Cannabinoid Formulation in Patients with Hypertension: A Double-Blind, Placebo-Controlled Pharmacogenetic Study. Pharmaceuticals 2023, 16, 645. [Google Scholar] [CrossRef]
- Fattore, L.; Fratta, W. How important are sex differences in cannabinoid action? Br. J. Pharmacol. 2010, 160, 544–548. [Google Scholar] [CrossRef] [PubMed]
- Arkell, T.R.; Kevin, R.C.; Vinckenbosch, F.; Lintzeris, N.; Theunissen, E.; Ramaekers, J.G.; McGregor, I.S. Sex differences in acute cannabis effects revisited: Results from two randomized, controlled trials. Addict. Biol. 2022, 27, e13125. [Google Scholar] [CrossRef] [PubMed]
- Contin, M.; Mohamed, S.; Santucci, M.; Lodi, M.A.M.; Russo, E.; Mecarelli, O.; Cbd Lice Italy Study Group. Cannabidiol in Pharmacoresistant Epilepsy: Clinical Pharmacokinetic Data From an Expanded Access Program. Front. Pharmacol. 2021, 12, 637801. [Google Scholar] [CrossRef]
- Aviram, J.; Lewitus, G.M.; Vysotski, Y.; Berman, P.; Shapira, A.; Procaccia, S.; Meiri, D. Sex differences in medical cannabis-related adverse effects. Pain 2022, 163, 975–983. [Google Scholar] [CrossRef]
- Child, R.B.; Tallon, M.J. Cannabidiol (CBD) Dosing: Plasma Pharmacokinetics and Effects on Accumulation in Skeletal Muscle, Liver and Adipose Tissue. Nutrients 2022, 14, 2101. [Google Scholar] [CrossRef]
- Maciel, I.S.; Abreu, G.H.D.; Johnson, C.T.; Bonday, R.; Bradshaw, H.B.; Mackie, K.; Lu, H.C. Perinatal CBD or THC Exposure Results in Lasting Resistance to Fluoxetine in the Forced Swim Test: Reversal by Fatty Acid Amide Hydrolase Inhibition. Cannabis Cannabinoid Res. 2022, 7, 318–327. [Google Scholar] [CrossRef]
- Matheson, J.; Bourgault, Z.; Le Foll, B. Sex Differences in the Neuropsychiatric Effects and Pharmacokinetics of Cannabidiol: A Scoping Review. Biomolecules 2022, 12, 1462. [Google Scholar] [CrossRef] [PubMed]
- Bachtiar, M.; Lee, C.G.L. Genetics of Population Differences in Drug Response. Curr. Genet. Med. Rep. 2013, 1, 162–170. [Google Scholar] [CrossRef]
- Davis, B.H.; Beasley, T.M.; Amaral, M.; Szaflarski, J.P.; Gaston, T.; Perry Grayson, L.; Standaert, D.G.; Bebin, E.M.; Limdi, N.A.; Group, U.C.S. Pharmacogenetic Predictors of Cannabidiol Response and Tolerability in Treatment-Resistant Epilepsy. Clin. Pharmacol. Ther. 2021, 110, 1368–1380. [Google Scholar] [CrossRef] [PubMed]
- Scott, S.A.; Sangkuhl, K.; Shuldiner, A.R.; Hulot, J.S.; Thorn, C.F.; Altman, R.B.; Klein, T.E. PharmGKB summary: Very important pharmacogene information for cytochrome P450, family 2, subfamily C, polypeptide 19. Pharm. Genom. 2012, 22, 159–165. [Google Scholar] [CrossRef] [PubMed]
- Kocis, P.T.; Vrana, K.E. Delta-9-Tetrahydrocannabinol and Cannabidiol Drug-Drug Interactions. Med. Cannabis Cannabinoids 2020, 3, 61–73. [Google Scholar] [CrossRef]
- Lucas, C.J.; Galettis, P.; Schneider, J. The pharmacokinetics and the pharmacodynamics of cannabinoids. Br. J. Clin. Pharmacol. 2018, 84, 2477–2482. [Google Scholar] [CrossRef]
- Vaughn, S.E.; Strawn, J.R.; Poweleit, E.A.; Sarangdhar, M.; Ramsey, L.B. The Impact of Marijuana on Antidepressant Treatment in Adolescents: Clinical and Pharmacologic Considerations. J. Pers. Med. 2021, 11, 615. [Google Scholar] [CrossRef]
- Ujvary, I.; Hanus, L. Human Metabolites of Cannabidiol: A Review on Their Formation, Biological Activity, and Relevance in Therapy. Cannabis Cannabinoid Res. 2016, 1, 90–101. [Google Scholar] [CrossRef] [PubMed]
- Perez-Acevedo, A.P.; Busardo, F.P.; Pacifici, R.; Mannocchi, G.; Gottardi, M.; Poyatos, L.; Papaseit, E.; Perez-Mana, C.; Martin, S.; Di Trana, A.; et al. Disposition of Cannabidiol Metabolites in Serum and Urine from Healthy Individuals Treated with Pharmaceutical Preparations of Medical Cannabis. Pharmaceuticals 2020, 13, 459. [Google Scholar] [CrossRef]
- Millar, S.A.; Stone, N.L.; Yates, A.S.; O’Sullivan, S.E. A Systematic Review on the Pharmacokinetics of Cannabidiol in Humans. Front. Pharmacol. 2018, 9, 1365. [Google Scholar] [CrossRef]
- Sachse-Seeboth, C.; Pfeil, J.; Sehrt, D.; Meineke, I.; Tzvetkov, M.; Bruns, E.; Poser, W.; Vormfelde, S.V.; Brockmoller, J. Interindividual variation in the pharmacokinetics of Delta9-tetrahydrocannabinol as related to genetic polymorphisms in CYP2C9. Clin. Pharmacol. Ther. 2009, 85, 273–276. [Google Scholar] [CrossRef]
- Elmes, M.W.; Kaczocha, M.; Berger, W.T.; Leung, K.; Ralph, B.P.; Wang, L.; Sweeney, J.M.; Miyauchi, J.T.; Tsirka, S.E.; Ojima, I.; et al. Fatty acid-binding proteins (FABPs) are intracellular carriers for Delta9-tetrahydrocannabinol (THC) and cannabidiol (CBD). J. Biol. Chem. 2015, 290, 8711–8721. [Google Scholar] [CrossRef]
- Weaving, G.; Batstone, G.F.; Jones, R.G. Age and sex variation in serum albumin concentration: An observational study. Ann. Clin. Biochem. 2016, 53, 106–111. [Google Scholar] [CrossRef] [PubMed]
- Pearlson, G.D.; Stevens, M.C.; D’Souza, D.C. Cannabis and Driving. Front. Psychiatry 2021, 12, 689444. [Google Scholar] [CrossRef]
- McCartney, D.; Suraev, A.S.; Doohan, P.T.; Irwin, C.; Kevin, R.C.; Grunstein, R.R.; Hoyos, C.M.; McGregor, I.S. Effects of cannabidiol on simulated driving and cognitive performance: A dose-ranging randomised controlled trial. J. Psychopharmacol. 2022, 36, 1338–1349. [Google Scholar] [CrossRef] [PubMed]
- Nasrin, S.; Watson, C.J.W.; Perez-Paramo, Y.X.; Lazarus, P. Cannabinoid Metabolites as Inhibitors of Major Hepatic CYP450 Enzymes, with Implications for Cannabis-Drug Interactions. Drug Metab. Dispos. 2021, 49, 1070–1080. [Google Scholar] [CrossRef] [PubMed]
- Watkins, P.B.; Church, R.J.; Li, J.; Knappertz, V. Cannabidiol and Abnormal Liver Chemistries in Healthy Adults: Results of a Phase I Clinical Trial. Clin. Pharmacol. Ther. 2021, 109, 1224–1231. [Google Scholar] [CrossRef]


| Variable | Timepoint 2 (after 2.5 weeks) | Timepoint 3 (after 5 weeks) | |||||
|---|---|---|---|---|---|---|---|
| Min | Max | Median (IQR) | Min | Max | Median (IQR) | ||
| Plasma concentration (ng/mL) | CBD | 10.53 | 329.88 | 23.81 (20.36) | 18.36 | 149.97 | 47.1 (35.53) |
| 7-OH-CBD | 2.72 | 127.23 | 13.15 (13.90) | 6.40 | 109.93 | 30.01 (28.19) | |
| 7-COOH-CBD | 195.79 | 5415.25 | 837.15 (883.48) | 575.72 | 9300.95 | 1589.77 (2786.08) | |
| Plasma ratio | CBD/−7OH-CBD | 0.62 | 5.67 | 1.96 (1.30) | 0.62 | 6.19 | 1.84 (1.87) |
| CBD/7-COOH-CBD | 0.005 | 0.20 | 0.03 (0.02) | 0.007 | 0.12 | 0.03 (0.03) | |
| 7OH-CBD /7COOH-CBD | 0.006 | 0.08 | 0.02 (0.007) | 0.007 | 0.03 | 0.01 (0.008) | |
| Urine concentration (ng/mL) | CBD | 0 | 9.93 | 0 (0) | 0 | 6,59 | 0 (0) |
| 7-OH-CBD | 0 | 81.86 | 0 (11.074) | 0 | 66,35 | 0 (7.43) | |
| 7-COOH-CBD | 0 | 43.87 | 2.92 (5.68) | 0 | 265,15 | 9.06 (9.813) | |
| Variable | Timepoint 4 (after Washout) | After Placebo Capsule Ingestion | ||||||||
|---|---|---|---|---|---|---|---|---|---|---|
| Timepoint 5 (after 2.5 Weeks) | Timepoint 6 (after 5 Weeks) | |||||||||
| Min | Max | Median (IQR) | Min | Max | Median (IQR) | Min | Max | Median (IQR) | ||
| Plasma concentration (ng/mL) | CBD | 1.58 | 10.63 | 4.91 (3.15) | 1.97 | 5.2 | 3.51 (1.34) | 0 | 3.71 | 0 (2.17) |
| 7-OH-CBD | 0 | 1.85 | 0.91 (0.78) | 0 | 1.34 | 0.77 (1.07) | 0 | 1.109 | 0 (0) | |
| 7-COOH-CBD | 3.87 | 66.85 | 18.77 (24.28) | 2.81 | 59.11 | 11.19 (16.05) | 1.42 | 28.94 | 7.36 (8.93) | |
| Urine concentration (ng/mL) | CBD | 0.0 | 0.0 | 0.0 (0.0) | 0.0 | 0.0 | 0.0 (0.0) | 0.0 | 0.0 | 0.0 (0.0) |
| 7-OH-CBD | 0.0 | 1.20 | 0.0 (0.0) | 0.0 | 5.11 | 0.0 (0.0) | 0.0 | 0.93 | 0.0 (0.0) | |
| 7-COOH-CBD | 0.0 | 73.81 | 0.0 (0.69) | 0.0 | 316.24 | 0.0 (0.41) | 0.0 | 8.17 | 0.0 (0.0) | |
| Variable | Min | Max | Median (IQR) | Sex Difference Mann–Whitney Test | |
|---|---|---|---|---|---|
| Age | F | 43 | 70 | 55 (12) | p = 0.230 |
| M | 42 | 69 | 54 (12) | ||
| Weight | F | 62.00 | 101.70 | 78.30 (15.10) | p < 0.001 |
| M | 79.30 | 126.80 | 95.90 (14.30) | ||
| Body Mass index (BMI) | F | 20.88 | 33.87 | 28.43 (4.96) | p = 0.659 |
| M | 24.55 | 34.97 | 28.17 (5.08) | ||
| Fat tissue (%) | F | 24.50 | 47.60 | 36.60 (6.80) | p < 0.001 |
| M | 19.30 | 44.00 | 27.10 (6.20) | ||
| Muscle tissue (%) | F | 49.70 | 71.60 | 60.10 (6.40) | p < 0.001 |
| M | 53.30 | 76.60 | 69.30 (5.60) | ||
| Body water (%) | F | 37.00 | 52.50 | 42.20 (4.60) | p < 0.001 |
| M | 41.00 | 54.90 | 49.40 (3.50) | ||
| Metabolic age (years) | F | 35.00 | 77.00 | 58.00 (14.00) | p = 0.795 |
| M | 40.00 | 82.00 | 60.00 (13.00) | ||
| Fat free mass (kg) | F | 42.30 | 59.40 | 51.10 (8.10) | p < 0.001 |
| M | 60.00 | 89.00 | 70.50 (8.80) | ||
| Visceral fat (kg) | F | 4.00 | 14.00 | 9.00 (4.00) | p < 0.001 |
| M | 8.00 | 31.00 | 12.00 (4.00) | ||
| Compound | Q1 (m/z) | Q3 a (m/z) | Q3 b (m/z) | RF (V) | CE (eV) | CE (eV) | RT (min) |
|---|---|---|---|---|---|---|---|
| CBD | 315.5 | 193.1 | 259.2 | 115 | 21 | 18 | 5.57 |
| 7-OH-CBD | 313.5 | 201.1 | 193.2 | 134 | 22 | 22 | 1.48 |
| 7-COOH-CBD | 345.5 | 327.2 | 299.3 | 109 | 14 | 18 | 1.33 |
| Compound | LOD (ng/mL) | LOQ (ng/mL) | Calibration Curve Equation | R2 |
|---|---|---|---|---|
| CBD | 0.60 | 1.98 | y = 3.1186x | 0.995 |
| 7-OH-CBD | 0.20 | 0.66 | y = 2.7706x | 0.998 |
| 7-COOH-CBD | 0.20 | 0.66 | y = 9.6546x | 0.998 |
Disclaimer/Publisher’s Note: The statements, opinions and data contained in all publications are solely those of the individual author(s) and contributor(s) and not of MDPI and/or the editor(s). MDPI and/or the editor(s) disclaim responsibility for any injury to people or property resulting from any ideas, methods, instructions or products referred to in the content. |
© 2023 by the authors. Licensee MDPI, Basel, Switzerland. This article is an open access article distributed under the terms and conditions of the Creative Commons Attribution (CC BY) license (https://creativecommons.org/licenses/by/4.0/).
Share and Cite
Batinic, A.; Sutlovic, D.; Kuret, S.; Burcul, F.; Kalajzic, N.; Matana, A.; Dujic, G.; Vrdoljak, J.; Kumric, M.; Bozic, J.; et al. Differences in Plasma Cannabidiol Concentrations in Women and Men: A Randomized, Placebo-Controlled, Crossover Study. Int. J. Mol. Sci. 2023, 24, 10273. https://doi.org/10.3390/ijms241210273
Batinic A, Sutlovic D, Kuret S, Burcul F, Kalajzic N, Matana A, Dujic G, Vrdoljak J, Kumric M, Bozic J, et al. Differences in Plasma Cannabidiol Concentrations in Women and Men: A Randomized, Placebo-Controlled, Crossover Study. International Journal of Molecular Sciences. 2023; 24(12):10273. https://doi.org/10.3390/ijms241210273
Chicago/Turabian StyleBatinic, Ana, Davorka Sutlovic, Sendi Kuret, Franko Burcul, Nina Kalajzic, Antonela Matana, Goran Dujic, Josip Vrdoljak, Marko Kumric, Josko Bozic, and et al. 2023. "Differences in Plasma Cannabidiol Concentrations in Women and Men: A Randomized, Placebo-Controlled, Crossover Study" International Journal of Molecular Sciences 24, no. 12: 10273. https://doi.org/10.3390/ijms241210273
APA StyleBatinic, A., Sutlovic, D., Kuret, S., Burcul, F., Kalajzic, N., Matana, A., Dujic, G., Vrdoljak, J., Kumric, M., Bozic, J., & Dujic, Z. (2023). Differences in Plasma Cannabidiol Concentrations in Women and Men: A Randomized, Placebo-Controlled, Crossover Study. International Journal of Molecular Sciences, 24(12), 10273. https://doi.org/10.3390/ijms241210273