
In-Depth Analysis of the Pancreatic Extracellular Matrix during Development for Next-Generation Tissue Engineering

 , , , , , , , and
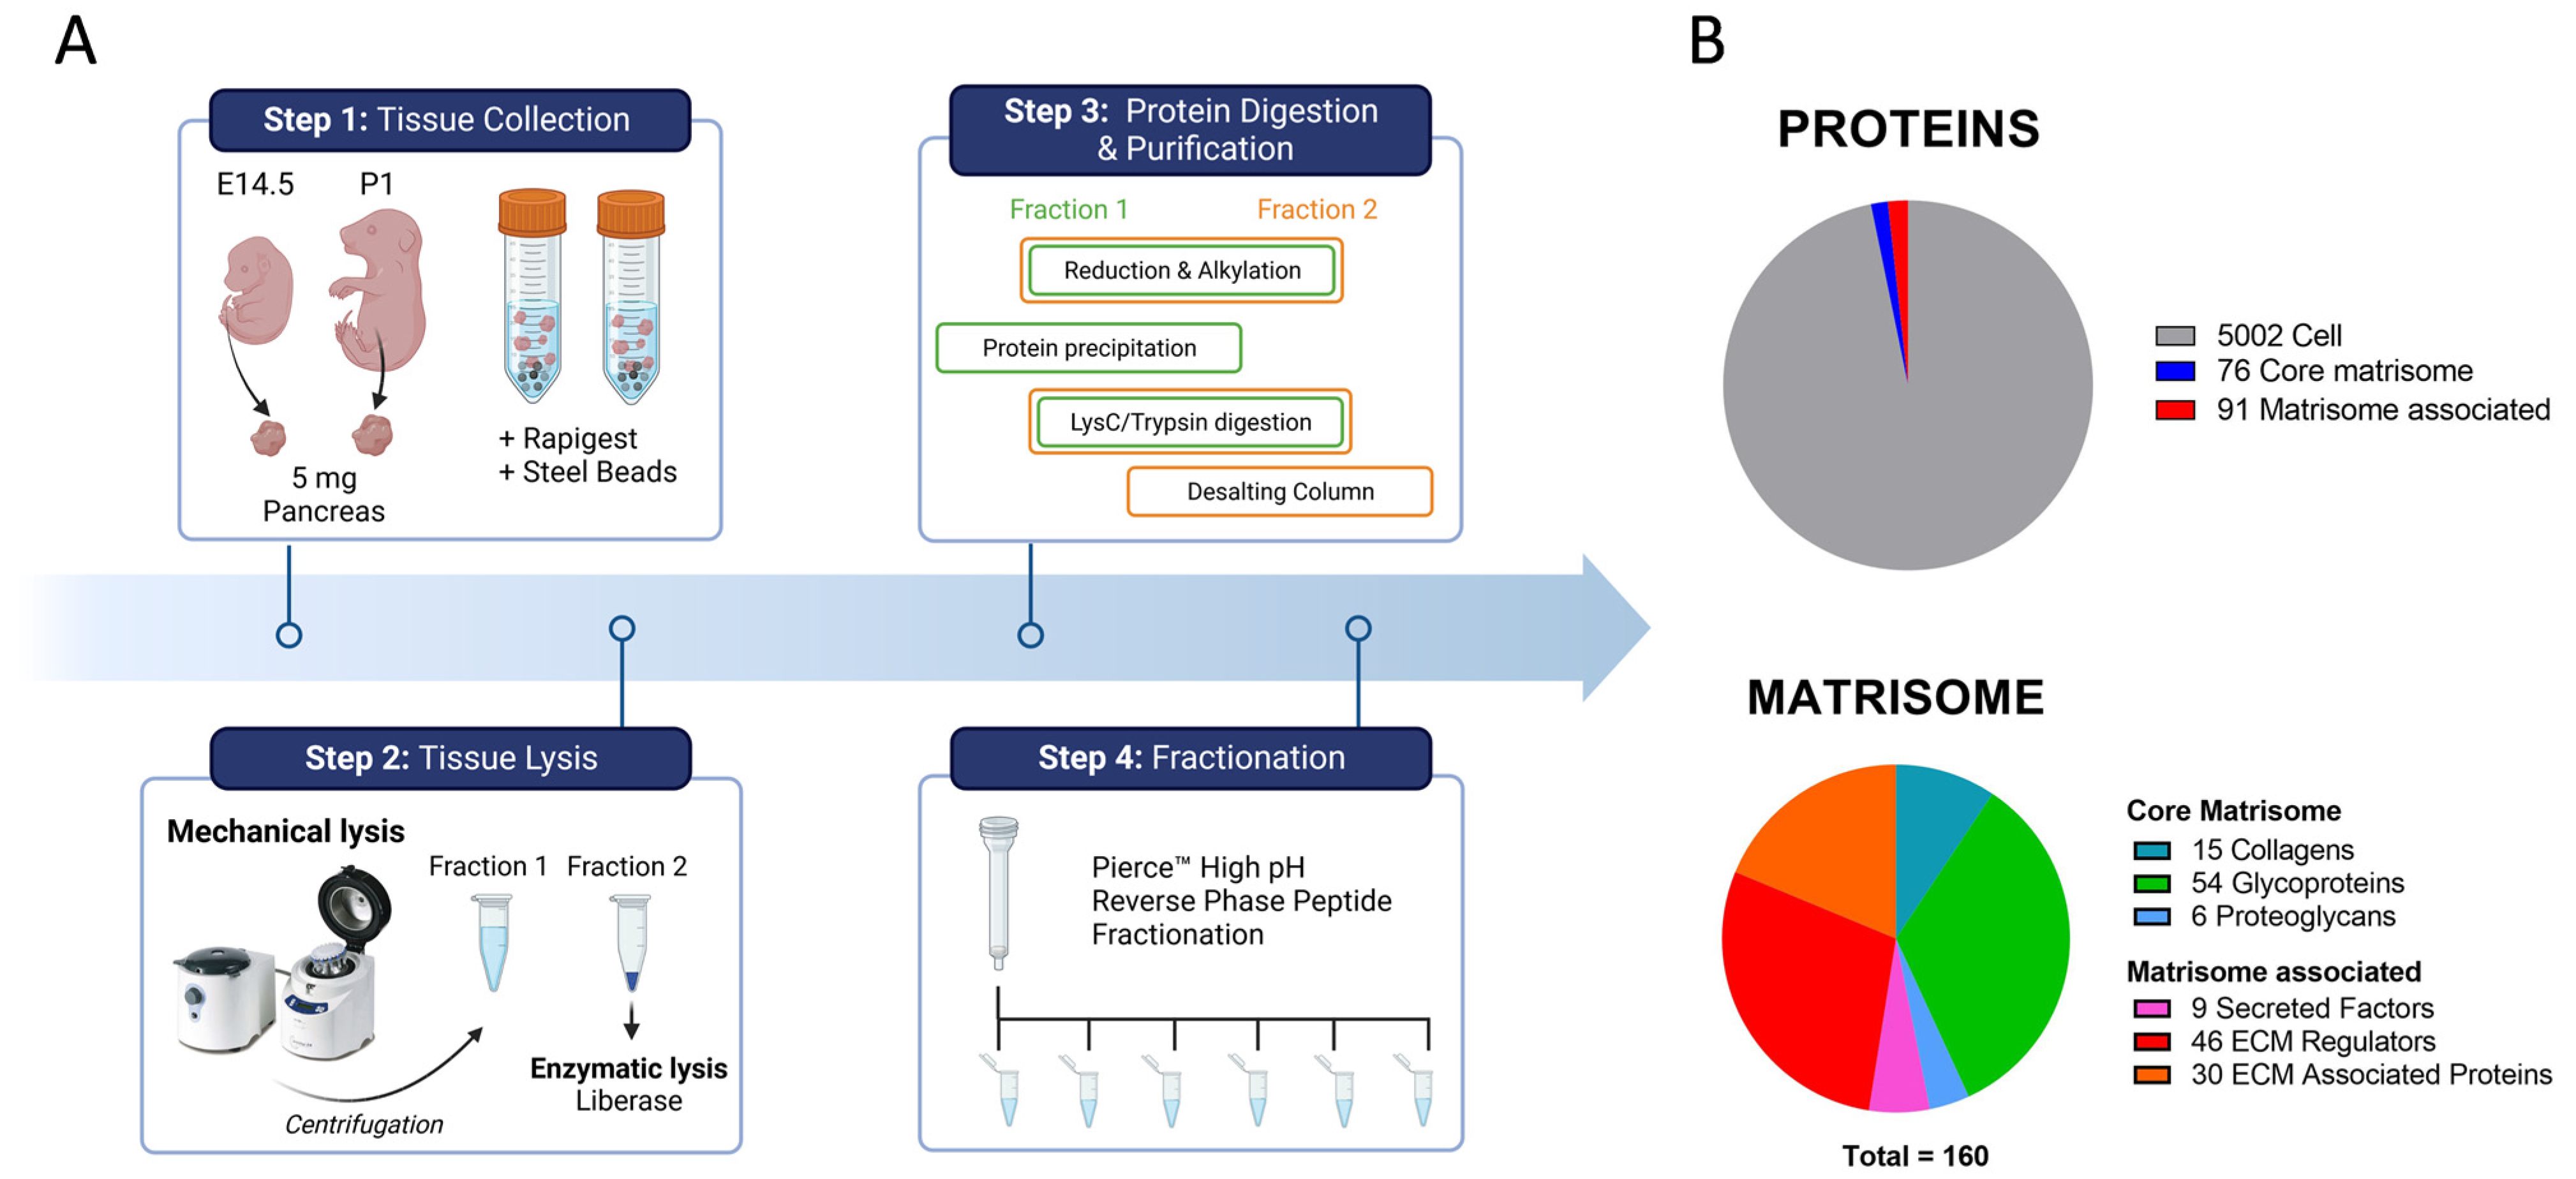
Abstract
1. Introduction
2. Results
2.1. In-Depth Proteome-Wide Identification and Quantification of Pancreatic Matrisome
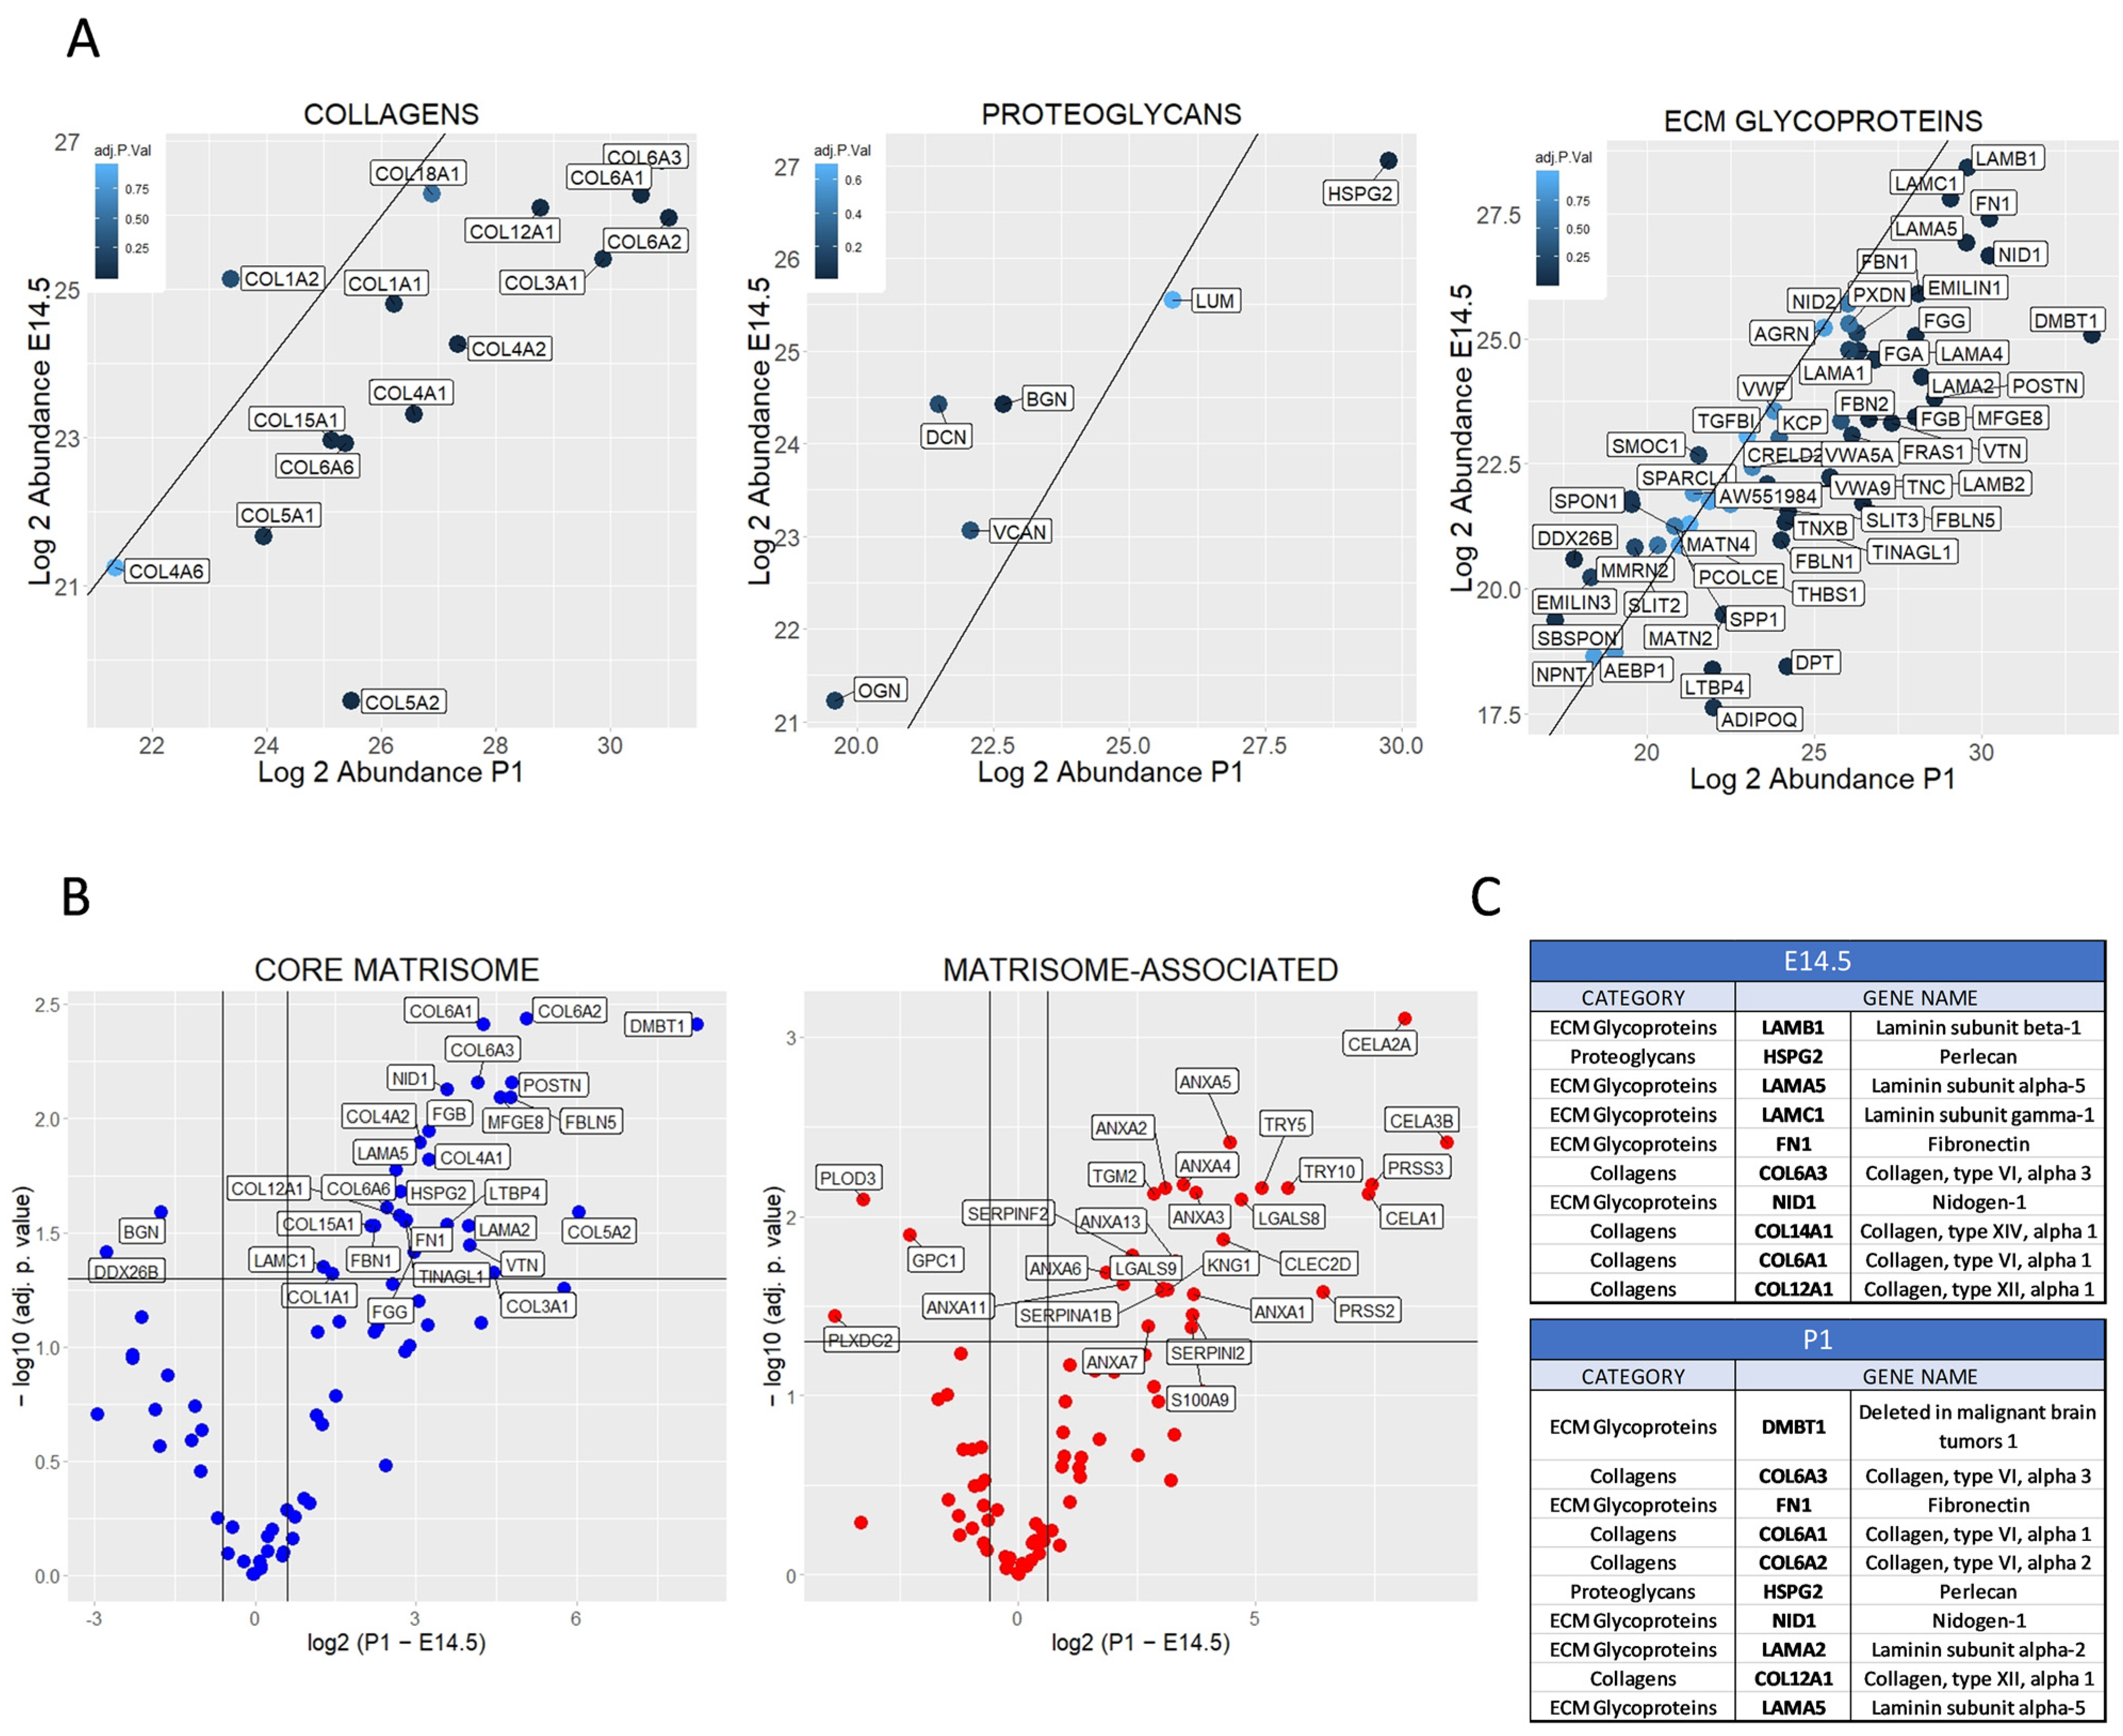
2.2. Differential Matrisome Signature between Embryonic (E) Day 14.5 and Postnatal (P) 1 Pancreas by Label Free Quantification (LFQ)
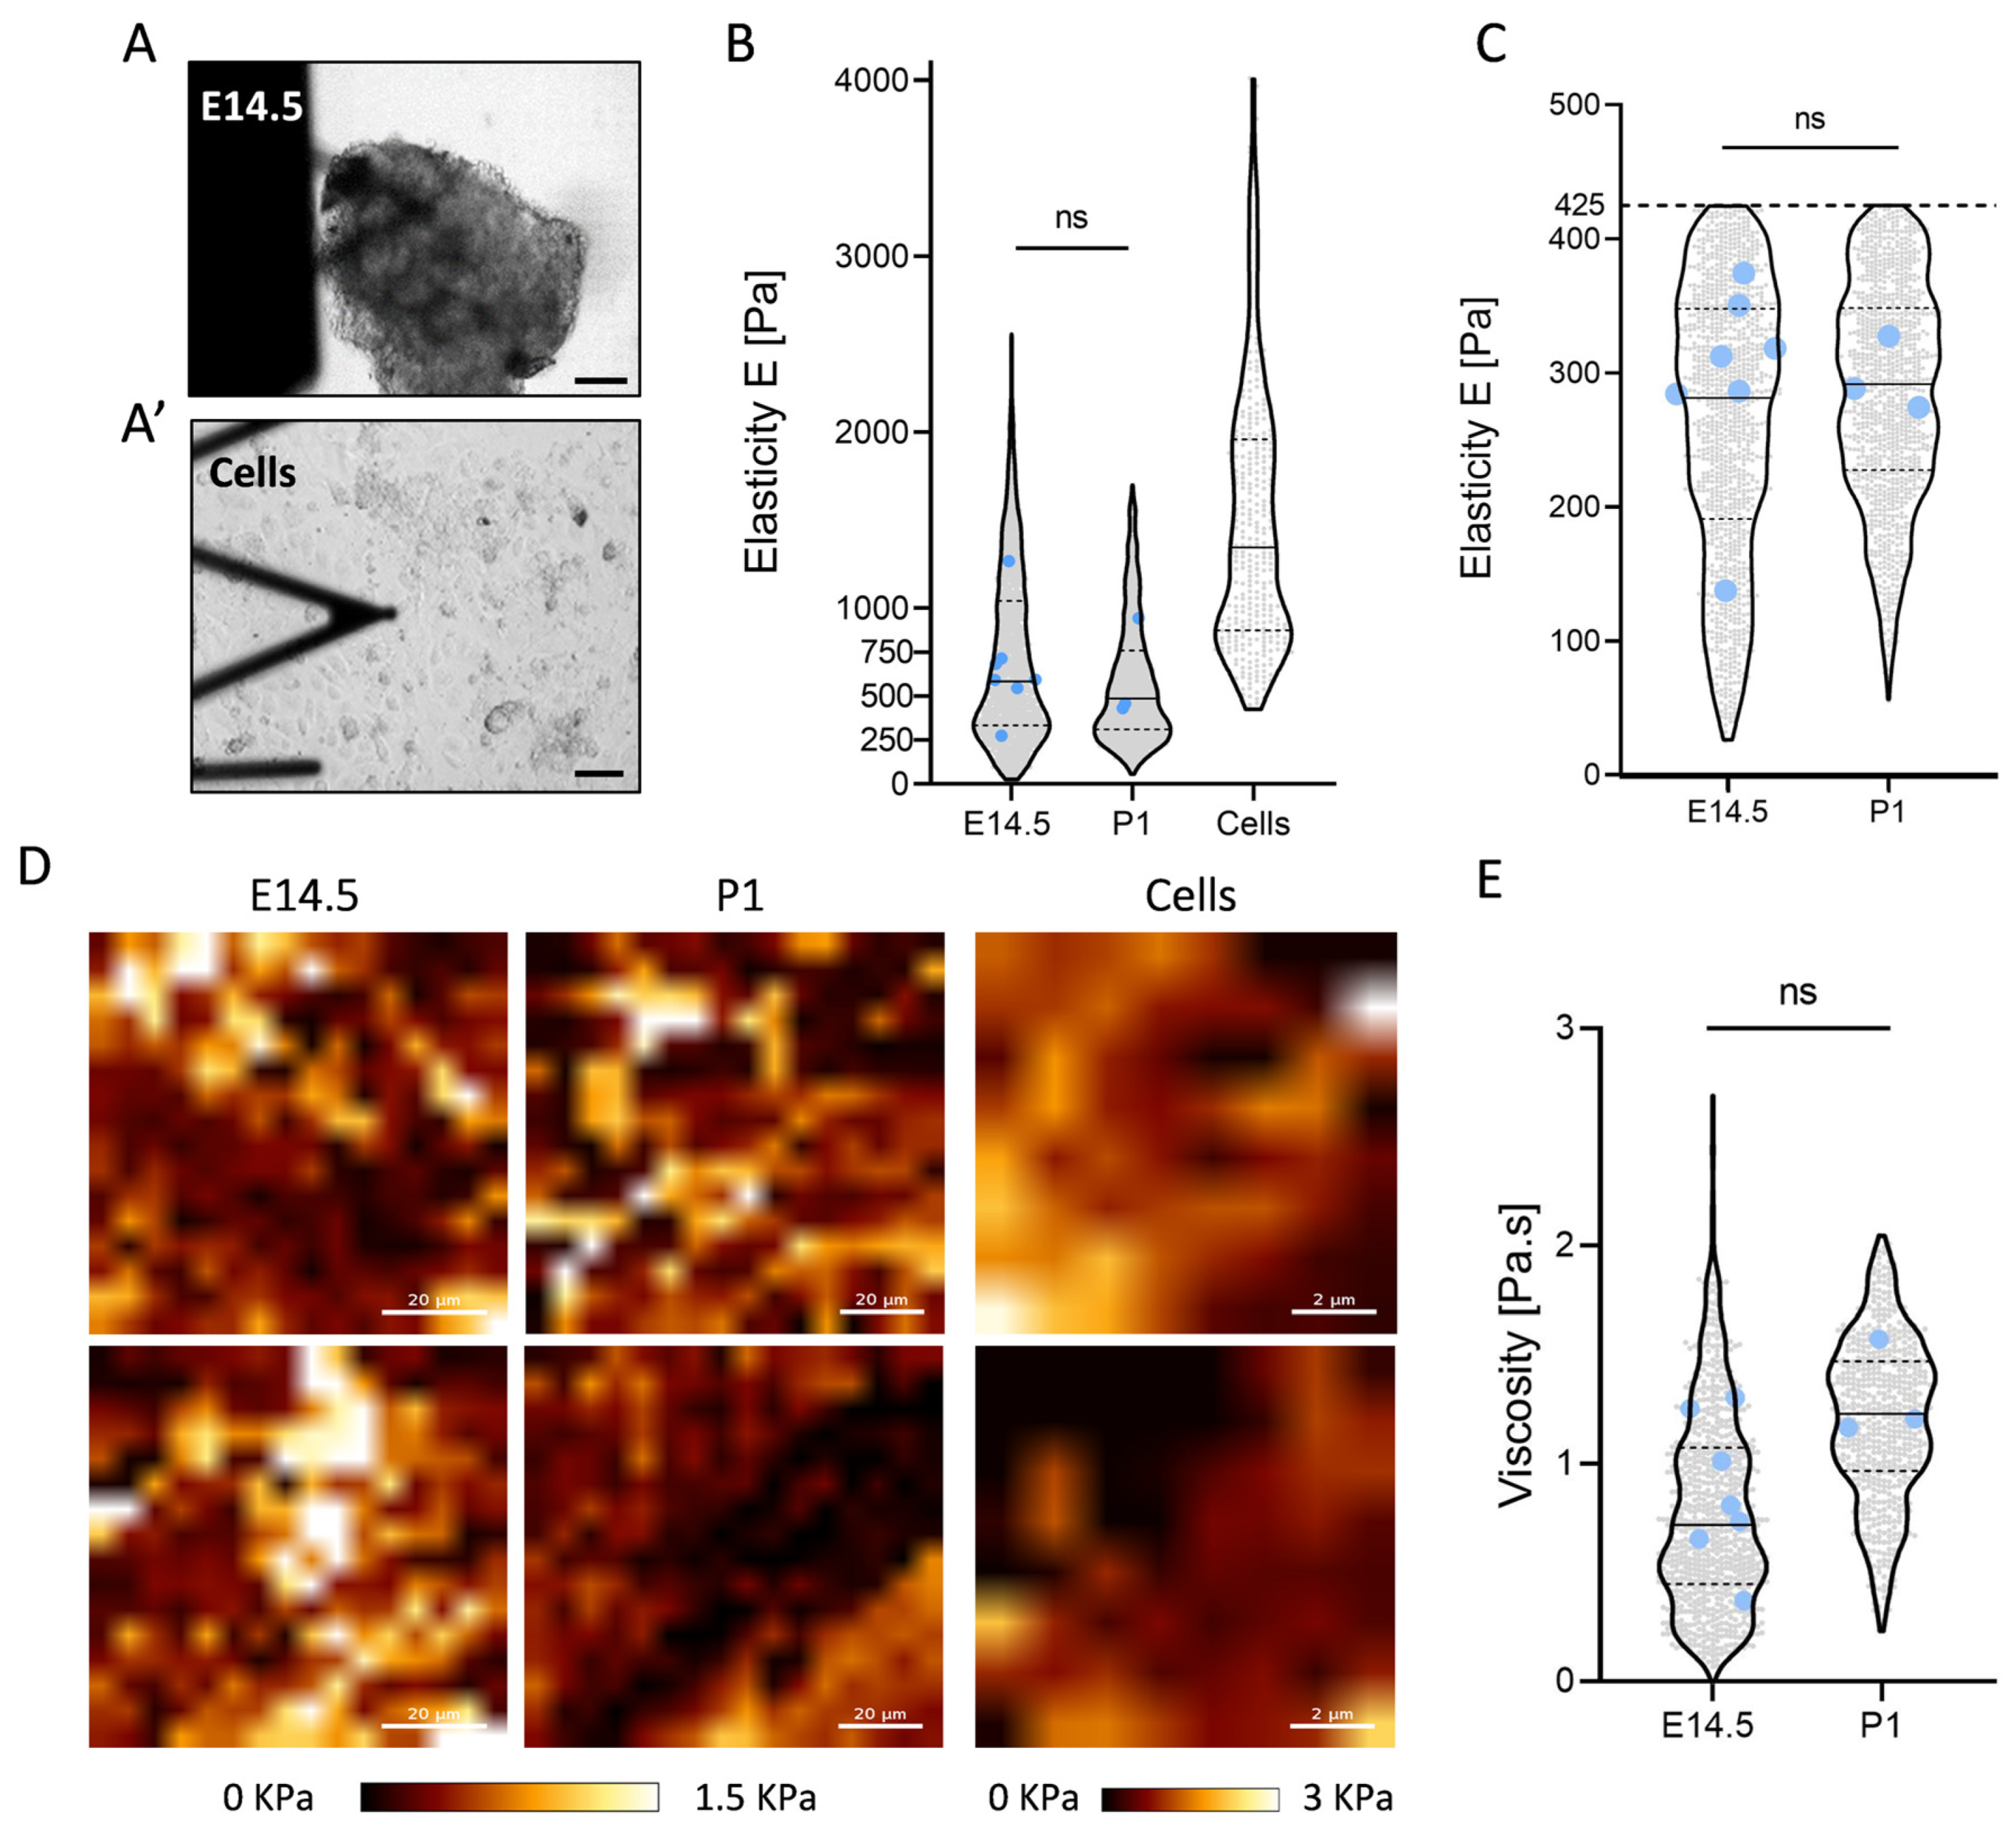
2.3. Constant Elasticity and Viscosity Properties of Pancreatic Extracellular Matrix (ECM) during Development
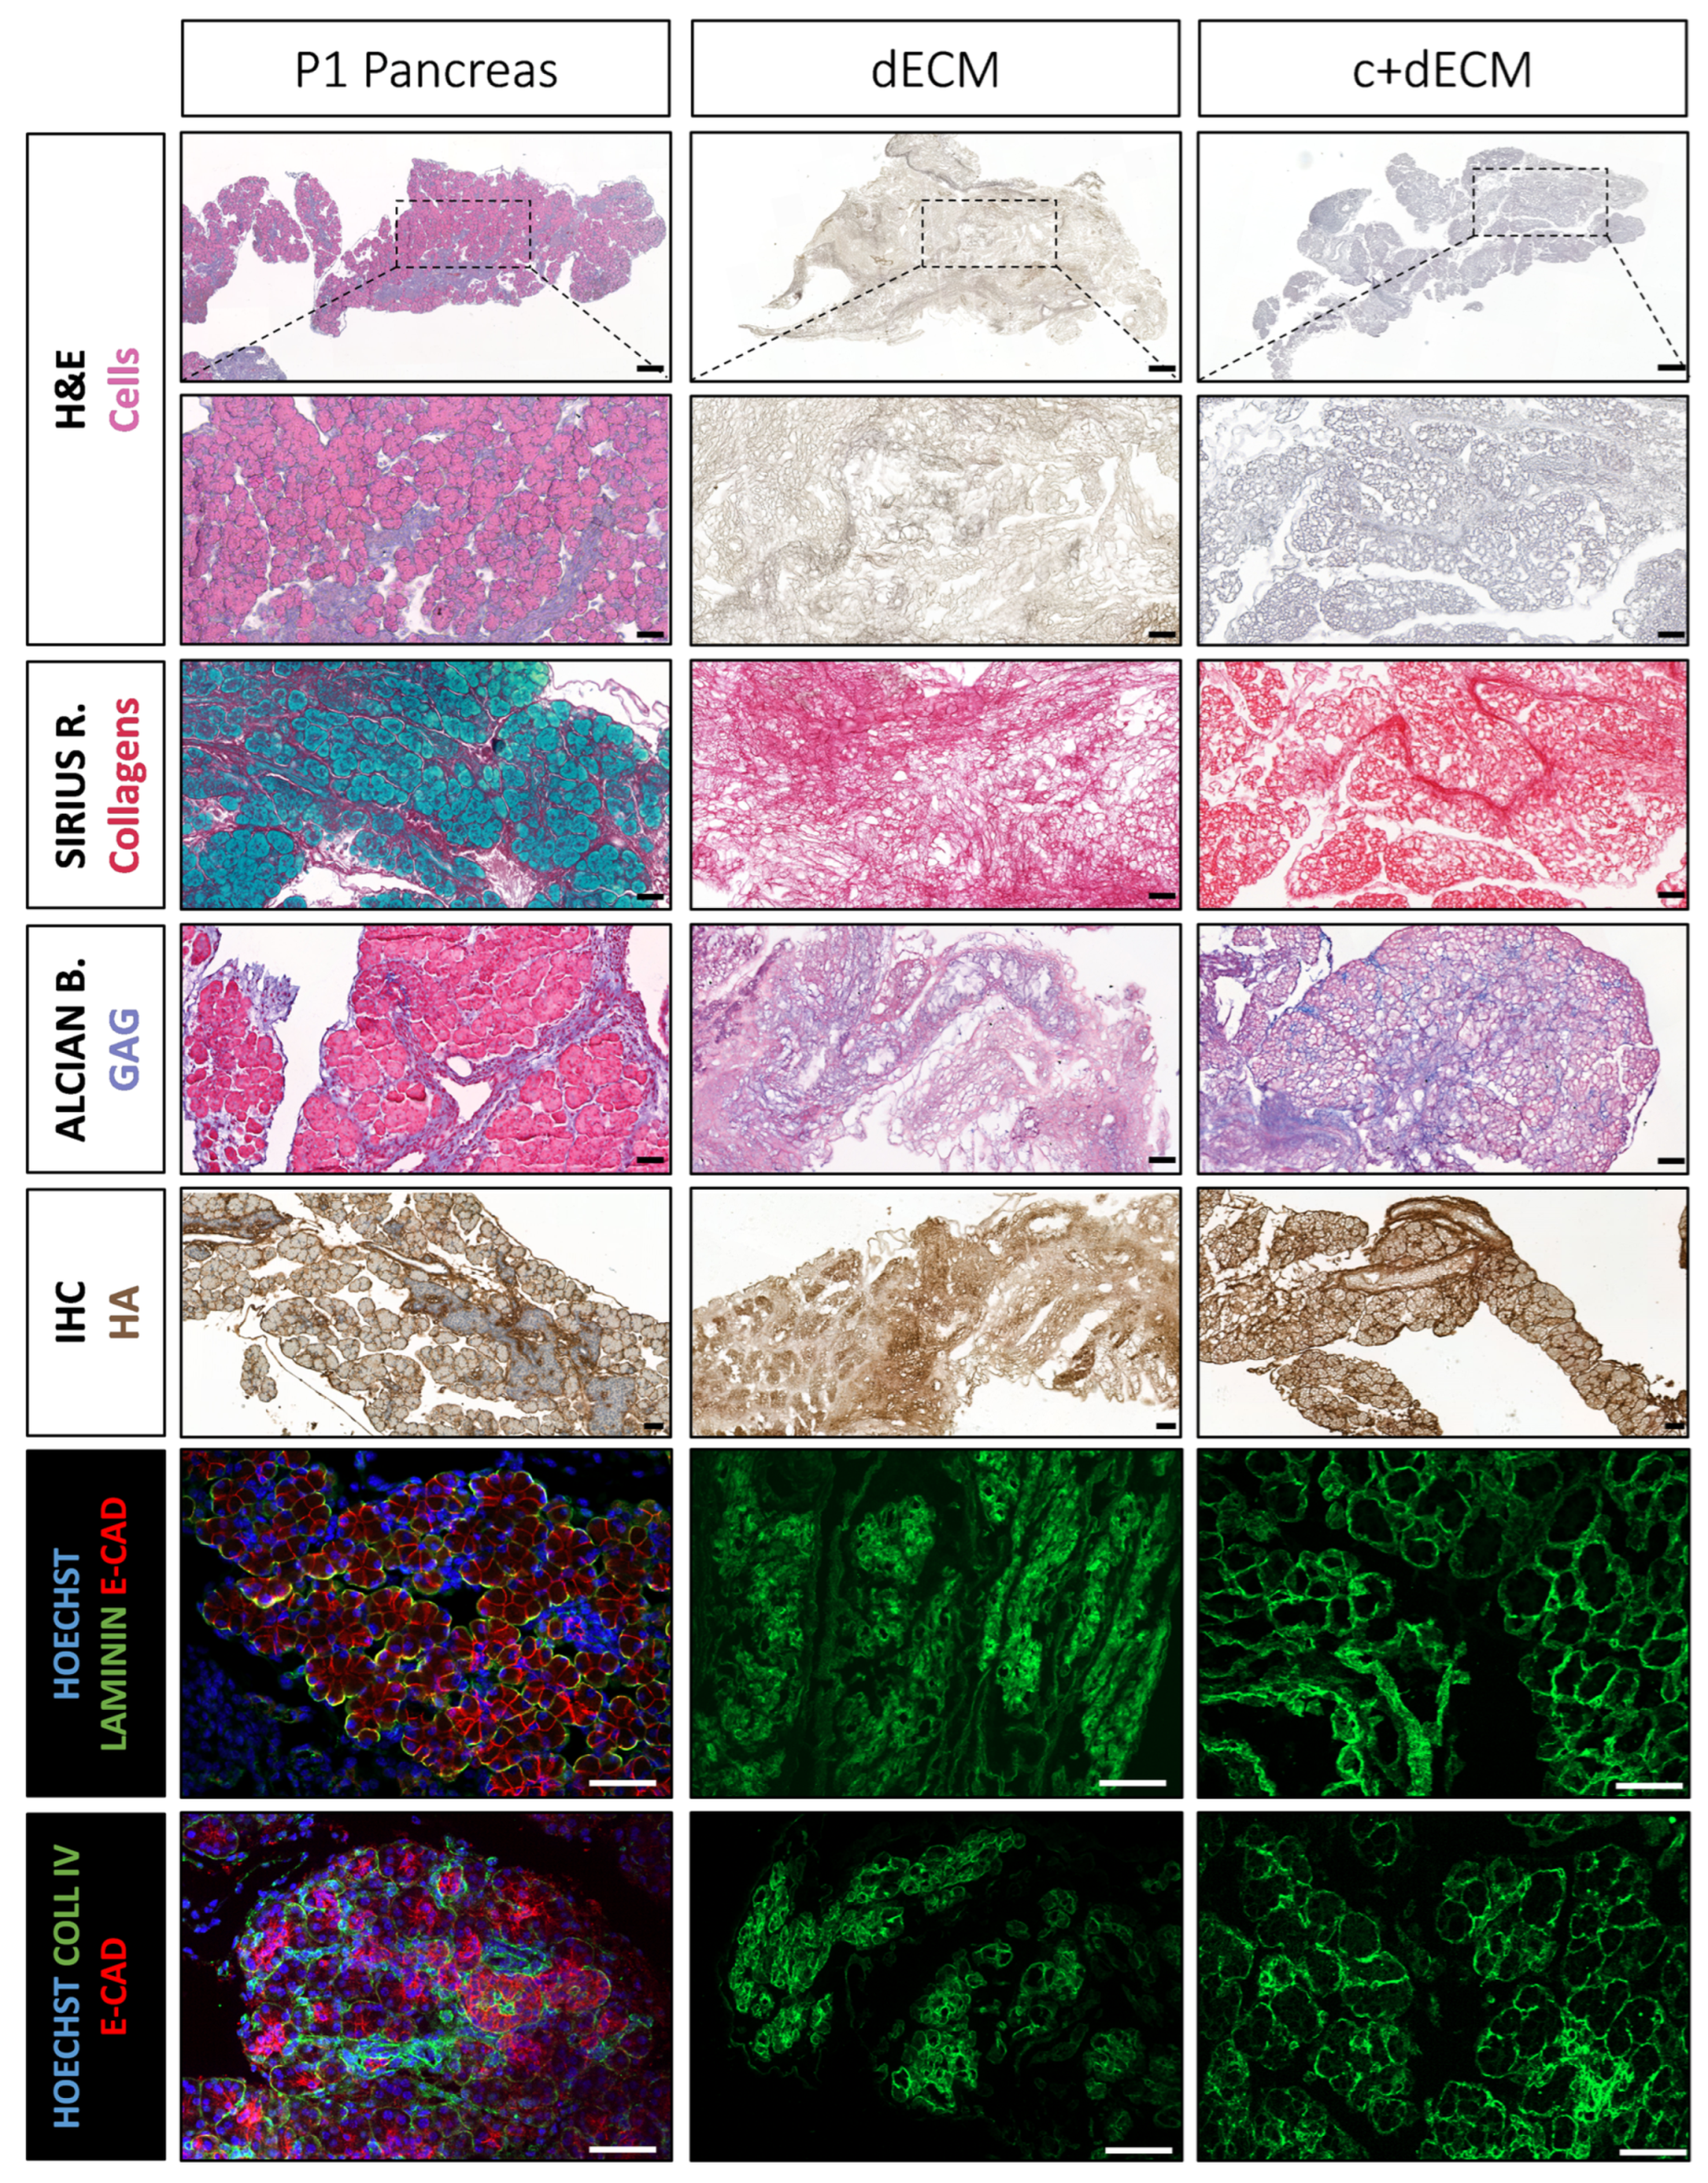
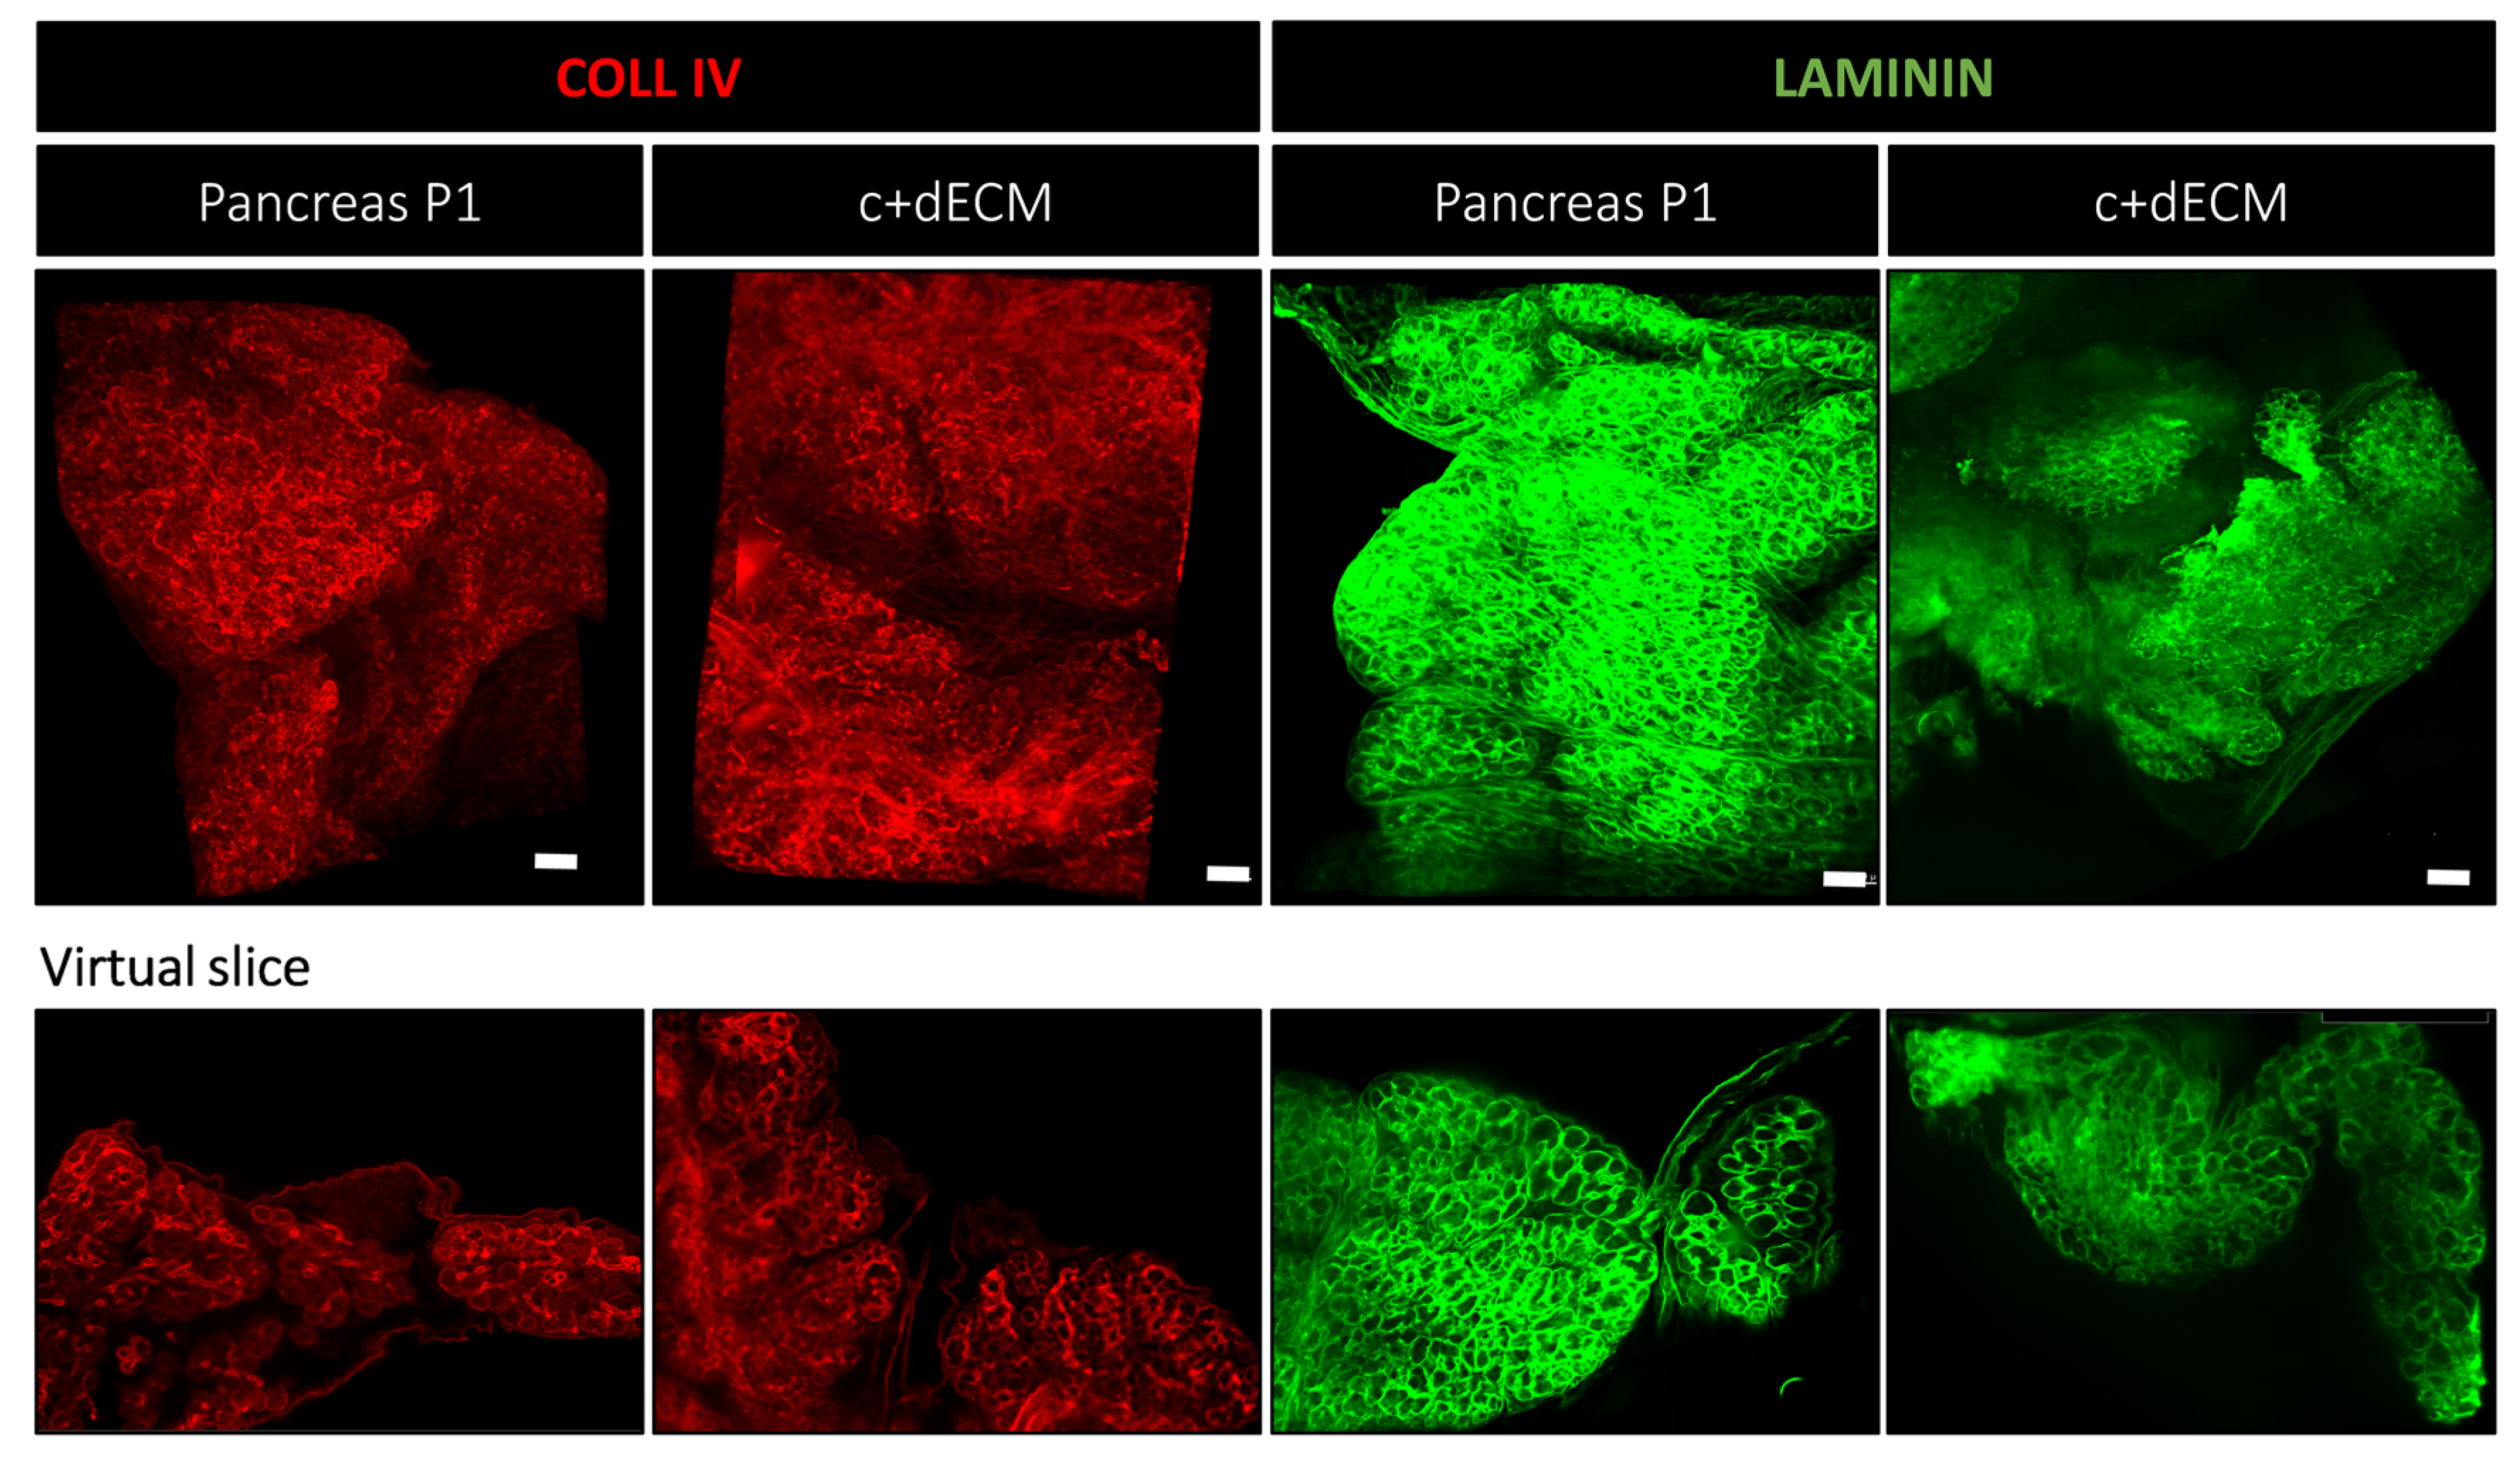
2.4. Preservation of Decellularized ECM Scaffold Organization by Crosslinking
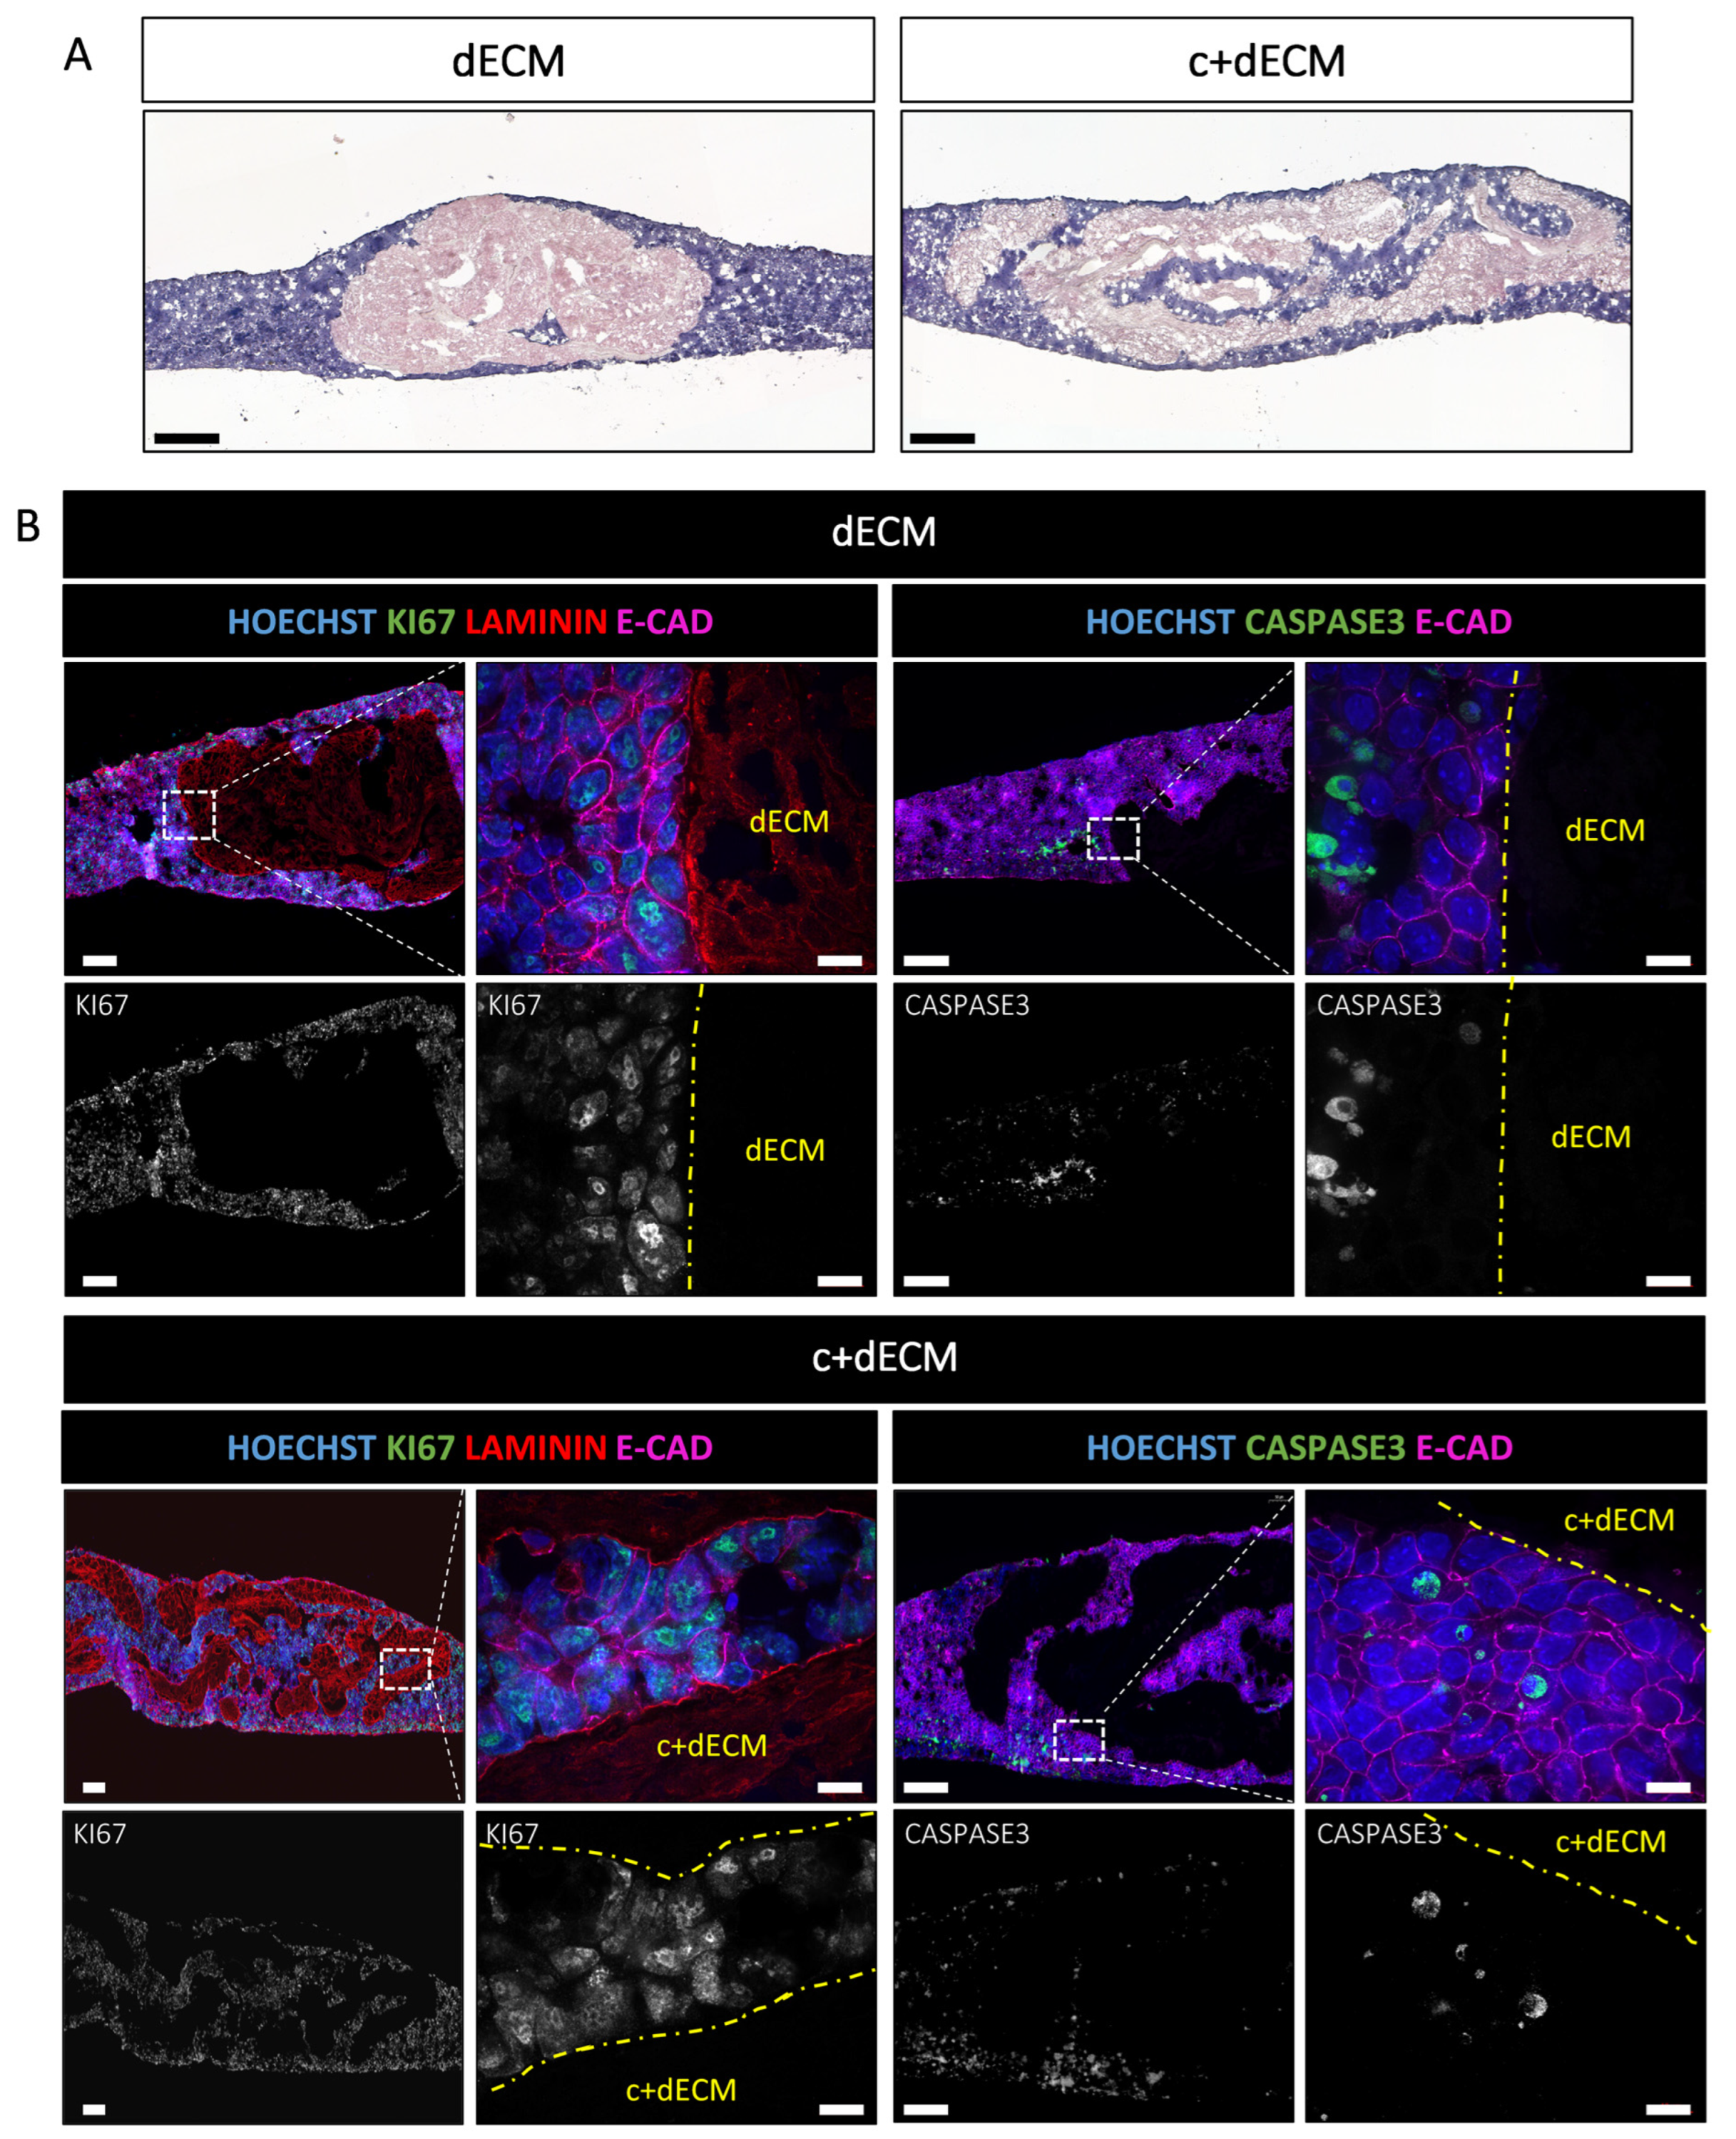
2.5. Crosslinked and Decellularized ECM Scaffold Is Biocompatible and Allows Cell Survival
3. Discussion
4. Materials and Methods
4.1. Animal Experimentation
4.2. Mass Spectrometry (MS)
4.2.1. Sample Preparation for Mass Spectrometry Analysis
4.2.2. Liquid Chromatography-Tandem-Mass-Spectrometry
4.2.3. Protein Identification and Quantification
4.2.4. Data Processing
4.2.5. Statistical Tests
4.3. Atomic Force Microscopy
4.3.1. Preparation of Samples for Atomic Force Microscopy
4.3.2. Atomic Force Microscopy
4.3.3. Data Analysis
4.3.4. Kelvin–Voight–Maxwell Model
4.4. ECM Scaffolds
4.4.1. Crosslinking and Decellularization
4.4.2. GAG Quantification
4.4.3. Cell Culture
4.4.4. Recellularization
4.4.5. Histological Staining and Immunohistochemistry of Mouse Tissue Sections
4.4.6. Immunofluorescence Labelling on Wholemount and Sections of Mouse Tissue
5. Conclusions
Supplementary Materials
Author Contributions
Funding
Institutional Review Board Statement
Informed Consent Statement
Data Availability Statement
Acknowledgments
Conflicts of Interest
References
- Silva, A.C.; Rodrigues, S.C.; Caldeira, J.; Nunes, A.M.; Sampaio-Pinto, V.; Resende, T.P.; Oliveira, M.J.; Barbosa, M.A.; Thorsteinsdottir, S.; Nascimento, D.S.; et al. Three-dimensional scaffolds of fetal decellularized hearts exhibit enhanced potential to support cardiac cells in comparison to the adult. Biomaterials 2016, 104, 52–64. [Google Scholar] [CrossRef]
- Larsen, H.L.; Grapin-Botton, A. The molecular and morphogenetic basis of pancreas organogenesis. Semin Cell Dev. Biol. 2017, 66, 51–68. [Google Scholar] [CrossRef]
- Shih, H.P.; Wang, A.; Sander, M. Pancreas organogenesis: From lineage determination to morphogenesis. Annu. Rev. Cell Dev. Biol. 2013, 29, 81–105. [Google Scholar] [CrossRef]
- Cozzitorto, C.; Spagnoli, F.M. Pancreas organogenesis: The interplay between surrounding microenvironment(s) and epithelium-intrinsic factors. Curr. Top. Dev. Biol. 2019, 132, 221–256. [Google Scholar] [CrossRef] [PubMed]
- Pierreux, C.E.; Cordi, S.; Hick, A.C.; Achouri, Y.; Ruiz de Almodovar, C.; Prevot, P.P.; Courtoy, P.J.; Carmeliet, P.; Lemaigre, F.P. Epithelial: Endothelial cross-talk regulates exocrine differentiation in developing pancreas. Dev. Biol. 2010, 347, 216–227. [Google Scholar] [CrossRef]
- Landsman, L.; Nijagal, A.; Whitchurch, T.J.; Vanderlaan, R.L.; Zimmer, W.E.; Mackenzie, T.C.; Hebrok, M. Pancreatic mesenchyme regulates epithelial organogenesis throughout development. PLoS Biol. 2011, 9, e1001143. [Google Scholar] [CrossRef] [PubMed]
- Karamanos, N.K.; Theocharis, A.D.; Piperigkou, Z.; Manou, D.; Passi, A.; Skandalis, S.S.; Vynios, D.H.; Orian-Rousseau, V.; Ricard-Blum, S.; Schmelzer, C.E.H.; et al. A guide to the composition and functions of the extracellular matrix. FEBS J. 2021, 288, 6850–6912. [Google Scholar] [CrossRef] [PubMed]
- Rozario, T.; DeSimone, D.W. The extracellular matrix in development and morphogenesis: A dynamic view. Dev. Biol. 2010, 341, 126–140. [Google Scholar] [CrossRef]
- Heymans, C.; Degosserie, J.; Spourquet, C.; Pierreux, C.E. Pancreatic acinar differentiation is guided by differential laminin deposition. Sci. Rep. 2019, 9, 2711. [Google Scholar] [CrossRef]
- Crisera, C.A.; Kadison, A.S.; Breslow, G.D.; Maldonado, T.S.; Longaker, M.T.; Gittes, G.K. Expression and role of laminin-1 in mouse pancreatic organogenesis. Diabetes 2000, 49, 936–944. [Google Scholar] [CrossRef]
- Mamidi, A.; Prawiro, C.; Seymour, P.A.; de Lichtenberg, K.H.; Jackson, A.; Serup, P.; Semb, H. Mechanosignalling via integrins directs fate decisions of pancreatic progenitors. Nature 2018, 564, 114–118. [Google Scholar] [CrossRef] [PubMed]
- Han, W.; Singh, N.K.; Kim, J.J.; Kim, H.; Kim, B.S.; Park, J.Y.; Jang, J.; Cho, D.W. Directed differential behaviors of multipotent adult stem cells from decellularized tissue/organ extracellular matrix bioinks. Biomaterials 2019, 224, 119496. [Google Scholar] [CrossRef] [PubMed]
- Choudhury, D.; Yee, M.; Sheng, Z.L.J.; Amirul, A.; Naing, M.W. Decellularization systems and devices: State-of-the-art. Acta Biomater. 2020, 115, 51–59. [Google Scholar] [CrossRef]
- Kim, J.; Shim, I.K.; Hwang, D.G.; Lee, Y.N.; Kim, M.; Kim, H.; Kim, S.W.; Lee, S.; Kim, S.C.; Cho, D.W.; et al. 3D cell printing of islet-laden pancreatic tissue-derived extracellular matrix bioink constructs for enhancing pancreatic functions. J. Mater. Chem. B 2019, 7, 1773–1781. [Google Scholar] [CrossRef] [PubMed]
- Goh, S.K.; Bertera, S.; Olsen, P.; Candiello, J.E.; Halfter, W.; Uechi, G.; Balasubramani, M.; Johnson, S.A.; Sicari, B.M.; Kollar, E.; et al. Perfusion-decellularized pancreas as a natural 3D scaffold for pancreatic tissue and whole organ engineering. Biomaterials 2013, 34, 6760–6772. [Google Scholar] [CrossRef]
- Ouni, E.; Ruys, S.P.D.; Dolmans, M.M.; Herinckx, G.; Vertommen, D.; Amorim, C.A. Divide-and-Conquer Matrisome Protein (DC-MaP) Strategy: An MS-Friendly Approach to Proteomic Matrisome Characterization. Int. J. Mol. Sci. 2020, 21, 9141. [Google Scholar] [CrossRef] [PubMed]
- Naba, A.; Clauser, K.R.; Ding, H.; Whittaker, C.A.; Carr, S.A.; Hynes, R.O. The extracellular matrix: Tools and insights for the “omics” era. Matrix Biol. 2016, 49, 10–24. [Google Scholar] [CrossRef]
- Engler, A.J.; Sen, S.; Sweeney, H.L.; Discher, D.E. Matrix elasticity directs stem cell lineage specification. Cell 2006, 126, 677–689. [Google Scholar] [CrossRef]
- Chaudhuri, O.; Cooper-White, J.; Janmey, P.A.; Mooney, D.J.; Shenoy, V.B. Effects of extracellular matrix viscoelasticity on cellular behaviour. Nature 2020, 584, 535–546. [Google Scholar] [CrossRef]
- Guimarães, C.F. The stiffness of living tissues and its implications for tissue engineering. Nat. Rev. Mater. 2020, 5, 351–370. [Google Scholar] [CrossRef]
- Miri, A.K.; Heris, H.K.; Mongeau, L.; Javid, F. Nanoscale viscoelasticity of extracellular matrix proteins in soft tissues: A multiscale approach. J. Mech. Behav. Biomed. Mater. 2014, 30, 196–204. [Google Scholar] [CrossRef] [PubMed]
- Abuhattum, S.; Mokbel, D.; Muller, P.; Soteriou, D.; Guck, J.; Aland, S. An explicit model to extract viscoelastic properties of cells from AFM force-indentation curves. iScience 2022, 25, 104016. [Google Scholar] [CrossRef]
- van Steenberghe, M.; Schubert, T.; Gerelli, S.; Bouzin, C.; Guiot, Y.; Xhema, D.; Bollen, X.; Abdelhamid, K.; Gianello, P. Porcine pulmonary valve decellularization with NaOH-based vs detergent process: Preliminary in vitro and in vivo assessments. J. Cardiothorac. Surg. 2018, 13, 34. [Google Scholar] [CrossRef] [PubMed]
- Higuchi, Y.; Shiraki, N.; Yamane, K.; Qin, Z.; Mochitate, K.; Araki, K.; Senokuchi, T.; Yamagata, K.; Hara, M.; Kume, K.; et al. Synthesized basement membranes direct the differentiation of mouse embryonic stem cells into pancreatic lineages. J. Cell Sci. 2010, 123, 2733–2742. [Google Scholar] [CrossRef]
- Li, Z.; Tremmel, D.M.; Ma, F.; Yu, Q.; Ma, M.; Delafield, D.G.; Shi, Y.; Wang, B.; Mitchell, S.A.; Feeney, A.K.; et al. Proteome-wide and matrisome-specific alterations during human pancreas development and maturation. Nat. Commun. 2021, 12, 1020. [Google Scholar] [CrossRef]
- Tian, C.; Clauser, K.R.; Ohlund, D.; Rickelt, S.; Huang, Y.; Gupta, M.; Mani, D.R.; Carr, S.A.; Tuveson, D.A.; Hynes, R.O. Proteomic analyses of ECM during pancreatic ductal adenocarcinoma progression reveal different contributions by tumor and stromal cells. Proc. Natl. Acad. Sci. USA 2019, 116, 19609–19618. [Google Scholar] [CrossRef]
- Ma, F.; Tremmel, D.M.; Li, Z.; Lietz, C.B.; Sackett, S.D.; Odorico, J.S.; Li, L. In Depth Quantification of Extracellular Matrix Proteins from Human Pancreas. J. Proteome Res. 2019, 18, 3156–3165. [Google Scholar] [CrossRef]
- Cox, A.R.; Beamish, C.A.; Carter, D.E.; Arany, E.J.; Hill, D.J. Cellular mechanisms underlying failed beta cell regeneration in offspring of protein-restricted pregnant mice. Exp. Biol. Med. (Maywood) 2013, 238, 1147–1159. [Google Scholar] [CrossRef]
- Tani, T.; Ohsumi, J.; Mita, K.; Takiguchi, Y. Identification of a novel class of elastase isozyme, human pancreatic elastase III, by cDNA and genomic gene cloning. J. Biol. Chem. 1988, 263, 1231–1239. [Google Scholar] [CrossRef] [PubMed]
- De Lisle, R.C. Characterization of the major sulfated protein of mouse pancreatic acinar cells: A high molecular weight peripheral membrane glycoprotein of zymogen granules. J. Cell Biochem. 1994, 56, 385–396. [Google Scholar] [CrossRef]
- Pazin, D.E.; Albrecht, K.H. Developmental expression of Smoc1 and Smoc2 suggests potential roles in fetal gonad and reproductive tract differentiation. Dev. Dyn. 2009, 238, 2877–2890. [Google Scholar] [CrossRef]
- Moulis, M.; Runser, S.V.M.; Glorieux, L.; Dauguet, N.; Vanderaa, C.; Gatto, L.; Tyteca, D.; Henriet, P.; Spagnoli, F.M.; Iber, D.; et al. Identification and implication of tissue-enriched ligands in epithelial-endothelial crosstalk during pancreas development. Sci. Rep. 2022, 12, 12498. [Google Scholar] [CrossRef] [PubMed]
- Lamande, S.R.; Bateman, J.F. Collagen VI disorders: Insights on form and function in the extracellular matrix and beyond. Matrix Biol. 2018, 71–72, 348–367. [Google Scholar] [CrossRef] [PubMed]
- Llacua, L.A.; Hoek, A.; de Haan, B.J.; de Vos, P. Collagen type VI interaction improves human islet survival in immunoisolating microcapsules for treatment of diabetes. Islets 2018, 10, 60–68. [Google Scholar] [CrossRef] [PubMed]
- Hu, M.; Bi, H.; Moffat, D.; Blystone, M.; DeCostanza, P.; Alayi, T.; Ye, K.; Hathout, Y.; Jin, S. Proteomic and Bioinformatic Analysis of Decellularized Pancreatic Extracellular Matrices. Molecules 2021, 26, 6740. [Google Scholar] [CrossRef]
- Miron-Mendoza, M.; Seemann, J.; Grinnell, F. The differential regulation of cell motile activity through matrix stiffness and porosity in three dimensional collagen matrices. Biomaterials 2010, 31, 6425–6435. [Google Scholar] [CrossRef]
- Dumitru, A.C.; Stommen, A.; Koehler, M.; Cloos, A.S.; Yang, J.; Leclercqz, A.; Tyteca, D.; Alsteens, D. Probing PIEZO1 Localization upon Activation Using High-Resolution Atomic Force and Confocal Microscopy. Nano Lett. 2021, 21, 4950–4958. [Google Scholar] [CrossRef]
- Keane, T.J.; Swinehart, I.T.; Badylak, S.F. Methods of tissue decellularization used for preparation of biologic scaffolds and in vivo relevance. Methods 2015, 84, 25–34. [Google Scholar] [CrossRef]
- Vyborny, K.; Vallova, J.; Koci, Z.; Kekulova, K.; Jirakova, K.; Jendelova, P.; Hodan, J.; Kubinova, S. Genipin and EDC crosslinking of extracellular matrix hydrogel derived from human umbilical cord for neural tissue repair. Sci. Rep. 2019, 9, 10674. [Google Scholar] [CrossRef]
- Lehmann, N.; Christ, T.; Daugs, A.; Bloch, O.; Holinski, S. EDC Cross-linking of Decellularized Tissue: A Promising Approach? Tissue Eng. Part A 2017, 23, 675–682. [Google Scholar] [CrossRef] [PubMed]
- Conrad, H.E. Beta-elimination for release of O-linked glycosaminoglycans from proteoglycans. Curr. Protoc. Mol. Biol. 1995, 31, 17.15.1–17.15.3. [Google Scholar] [CrossRef] [PubMed]
- Pieper, J.S.; Hafmans, T.; Veerkamp, J.H.; van Kuppevelt, T.H. Development of tailor-made collagen-glycosaminoglycan matrices: EDC/NHS crosslinking, and ultrastructural aspects. Biomaterials 2000, 21, 581–593. [Google Scholar] [CrossRef]
- Berger, C.; Bjorlykke, Y.; Hahn, L.; Muhlemann, M.; Kress, S.; Walles, H.; Luxenhofer, R.; Raeder, H.; Metzger, M.; Zdzieblo, D. Matrix decoded—A pancreatic extracellular matrix with organ specific cues guiding human iPSC differentiation. Biomaterials 2020, 244, 119766. [Google Scholar] [CrossRef] [PubMed]
- Singh, G.; Senapati, S.; Satpathi, S.; Behera, P.K.; Das, B.; Nayak, B. Establishment of decellularized extracellular matrix scaffold derived from caprine pancreas as a novel alternative template over porcine pancreatic scaffold for prospective biomedical application. FASEB J. 2022, 36, e22574. [Google Scholar] [CrossRef] [PubMed]
- Barbosa, I.; Garcia, S.; Barbier-Chassefiere, V.; Caruelle, J.P.; Martelly, I.; Papy-Garcia, D. Improved and simple micro assay for sulfated glycosaminoglycans quantification in biological extracts and its use in skin and muscle tissue studies. Glycobiology 2003, 13, 647–653. [Google Scholar] [CrossRef]
- Glorieux, L.; Sapala, A.; Willnow, D.; Moulis, M.; Salowka, A.; Darrigrand, J.F.; Edri, S.; Schonblum, A.; Sakhneny, L.; Schaumann, L.; et al. Development of a 3D atlas of the embryonic pancreas for topological and quantitative analysis of heterologous cell interactions. Development 2022, 149, 199655. [Google Scholar] [CrossRef]
- Susaki, E.A.; Tainaka, K.; Perrin, D.; Kishino, F.; Tawara, T.; Watanabe, T.M.; Yokoyama, C.; Onoe, H.; Eguchi, M.; Yamaguchi, S.; et al. Whole-brain imaging with single-cell resolution using chemical cocktails and computational analysis. Cell 2014, 157, 726–739. [Google Scholar] [CrossRef]


Disclaimer/Publisher’s Note: The statements, opinions and data contained in all publications are solely those of the individual author(s) and contributor(s) and not of MDPI and/or the editor(s). MDPI and/or the editor(s) disclaim responsibility for any injury to people or property resulting from any ideas, methods, instructions or products referred to in the content. |
© 2023 by the authors. Licensee MDPI, Basel, Switzerland. This article is an open access article distributed under the terms and conditions of the Creative Commons Attribution (CC BY) license (https://creativecommons.org/licenses/by/4.0/).
Share and Cite
Glorieux, L.; Vandooren, L.; Derclaye, S.; Pyr dit Ruys, S.; Oncina-Gil, P.; Salowka, A.; Herinckx, G.; Aajja, E.; Lemoine, P.; Spourquet, C.; et al. In-Depth Analysis of the Pancreatic Extracellular Matrix during Development for Next-Generation Tissue Engineering. Int. J. Mol. Sci. 2023, 24, 10268. https://doi.org/10.3390/ijms241210268
Glorieux L, Vandooren L, Derclaye S, Pyr dit Ruys S, Oncina-Gil P, Salowka A, Herinckx G, Aajja E, Lemoine P, Spourquet C, et al. In-Depth Analysis of the Pancreatic Extracellular Matrix during Development for Next-Generation Tissue Engineering. International Journal of Molecular Sciences. 2023; 24(12):10268. https://doi.org/10.3390/ijms241210268
Chicago/Turabian StyleGlorieux, Laura, Laura Vandooren, Sylvie Derclaye, Sébastien Pyr dit Ruys, Paloma Oncina-Gil, Anna Salowka, Gaëtan Herinckx, Elias Aajja, Pascale Lemoine, Catherine Spourquet, and et al. 2023. "In-Depth Analysis of the Pancreatic Extracellular Matrix during Development for Next-Generation Tissue Engineering" International Journal of Molecular Sciences 24, no. 12: 10268. https://doi.org/10.3390/ijms241210268
APA StyleGlorieux, L., Vandooren, L., Derclaye, S., Pyr dit Ruys, S., Oncina-Gil, P., Salowka, A., Herinckx, G., Aajja, E., Lemoine, P., Spourquet, C., Lefort, H., Henriet, P., Tyteca, D., Spagnoli, F. M., Alsteens, D., Vertommen, D., & Pierreux, C. E. (2023). In-Depth Analysis of the Pancreatic Extracellular Matrix during Development for Next-Generation Tissue Engineering. International Journal of Molecular Sciences, 24(12), 10268. https://doi.org/10.3390/ijms241210268