Article

Iron Availability Influences Protein Carbonylation in Arabidopsis thaliana Plants

by
Adesola J. Tola
and
Tagnon D. Missihoun
*
Groupe de Recherche en Biologie Végétale (GRBV), Department of Chemistry, Biochemistry and Physics, Université du Québec à Trois-Rivières, 3351 Boul. des Forges, Trois-Rivières, QC G9A 5H7, Canada
*
Author to whom correspondence should be addressed.
Int. J. Mol. Sci. 2023, 24(11), 9732; https://doi.org/10.3390/ijms24119732
Submission received: 28 April 2023 / Revised: 30 May 2023 / Accepted: 30 May 2023 / Published: 4 June 2023
(This article belongs to the Section Molecular Plant Sciences)

Abstract

:
Protein carbonylation is an irreversible form of post-translational modification triggered by reactive oxygen species in animal and plant cells. It occurs either through the metal-catalyzed oxidation of Lys, Arg, Pro, and Thr side chains or the addition of α, β-unsaturated aldehydes and ketones to the side chains of Cys, Lys, and His. Recent genetic studies concerning plants pointed to an implication of protein carbonylation in gene regulation through phytohormones. However, for protein carbonylation to stand out as a signal transduction mechanism, such as phosphorylation and ubiquitination, it must be controlled in time and space by a still unknown trigger. In this study, we tested the hypothesis that the profile and extent of protein carbonylation are influenced by iron homeostasis in vivo. For this, we compared the profile and the contents of the carbonylated proteins in the Arabidopsis thaliana wild-type and mutant-deficient in three ferritin genes under normal and stress conditions. Additionally, we examined the proteins specifically carbonylated in wild-type seedlings exposed to iron-deficient conditions. Our results indicated that proteins were differentially carbonylated between the wild type and the triple ferritin mutant Fer1-3-4 in the leaves, stems, and flowers under normal growth conditions. The profile of the carbonylated proteins was also different between the wild type and the ferritin triple mutant exposed to heat stress, thus pointing to the influence of iron on the carbonylation of proteins. Consistent with this, the exposure of the seedlings to iron deficiency and iron excess greatly influenced the carbonylation of certain proteins involved in intracellular signal transduction, translation, and iron deficiency response. Overall, the study underlined the importance of iron homeostasis in the occurrence of protein carbonylation in vivo.

1. Introduction

Protein carbonylation is a post-translational modification that occurs either due to the metal-catalyzed oxidation (MCO) of Lys, Arg, Pro, and Thr side chains or via the Michael addition of lipid peroxidation-derived α, β-unsaturated aldehydes and ketones to the side chains of Cys, Lys, and His [1,2]. Contrary to the mechanism of protein ubiquitination or phosphorylation, protein carbonylation is non-enzymatic and irreversible, but like ubiquitination, it leads to the proteasomal degradation of proteins by the proteasome system [3,4]. Protein carbonylation has been reported to play a role in the growth and development of animals and plants, oxidative stress-related diseases, and cell signalling [5,6,7,8,9]. These observations have so far been difficult to reconcile with the well-known fact that a surge in carbonylated proteins is common under stress conditions, senescence, and ageing, which then leads to cell death. Indeed, protein carbonylation has mostly been evidenced in tissues of stressed plants and in dry seeds; therefore, it is often considered to be a stress marker. However, recent genetic studies pointed to its involvement in signalling through reactive oxygen species (ROS), reactive electrophile species (RES), and phytohormones [5,6,7,8,9,10,11]. Moreover, carbonylated proteins were found to accumulate in the leaves of Arabidopsis thaliana in the absence of stress under normal growth conditions, thus indicating a potential role in cellular functions [12,13,14]. It remains unclear what drives protein carbonylation without oxidative stress. Whether through MCO or via the Michael addition of lipid peroxidation-derived α, β-unsaturated aldehydes and ketones, the occurrence of protein carbonylation is initiated by hydroxyl radicals (HO) mostly derived from the Fenton reaction or from Haber–Weiss reactions between superoxide radicals (O2•−), H2O2, and a transition metal, such as iron (Fe) [10,15,16,17,18]. This suggests that the availability of iron may influence the occurrence of protein carbonylation in vivo.
Iron is a vital element necessary for all forms of living organisms, and iron deficiency has a profound effect on the productivity of photosynthetic organisms [19]. As a cofactor of many proteins, Fe is involved in cellular processes, including cell differentiation, respiration, and photosynthesis [20]. Many of the antioxidant enzymes and catalysts involved in electron transfer reactions require iron as a cofactor. Arabidopsis thaliana and other dicotyledonous species have developed an efficient strategy to acquire Fe from the soil by inducing the expression of root ferric chelate reductase encoded by FRO2 and Fe2+ transporter encoded by IRT1 [21,22]. In plants, cellular iron metabolism is a complex process that maintains an equilibrium between iron uptake, storage, utilization, and transport. However, there are some factors that can affect cellular iron metabolism in plants, including (1) soil pH and iron availability: soil pH can significantly affect the availability and uptake of Fe by plants because plants usually uptake iron mostly in the ferric form (Fe3+), but these ions have low solubility in alkaline soil [23]. Therefore, soil pH values of 5–6 are optimal for facilitating the uptake of Fe by plants. Additionally, Fe concentrations influence iron uptake because soil types with high concentrations and availability of Fe can lead to the increased uptake of Fe by the of plants [24]. (2) Iron chelators and transporters: plants have specific iron transporters, such as FRO3 and IRT1, which import iron from the soil into the root cells in non-graminaceous plants [21,22], while in grasses, iron-chelating phytosiderophores are released into the rhizosphere and form Fe3+-MA (mugineic acid) complexes that are taken up by specific high-affinity transporters [25]. (3) Phytohormones, such as ABA, auxin, and ethylene, can also affect iron metabolism. For example, ABA facilitates Fe-deficient responses [26] and promotes the secretion of phenolics and iron efflux from the vacuole via the upregulation of NRAMP3. Further studies reported that ABA enhances Fe translocation from the root to the shoot [26], while cytokinin and jasmonic acid inhibit Fe-deficient responses [27,28]. Overall, the regulation of cellular iron metabolism in plants is a complex process and could be influenced by a variety of biotic and abiotic factors.
When in excess, Fe can become harmful, triggering oxidative stress via the Fenton reaction. To prevent this from happening, plants have developed some mechanisms. Such mechanisms include the use of different antioxidant systems (enzymatic and non-enzymatic antioxidants). Enzymatic antioxidants, such as superoxide dismutase (SOD), catalase (CAT), and peroxidase (POD), play a vital role in preventing the Fenton reaction by scavenging ROS and converting them to less-toxic molecules [29,30,31]. In plasmatic compartments, thiol peroxidases are more important than catalase (peroxisomes) and heme peroxidases (PODs, cell wall). They keep the hydrogen peroxide concentrations low in the cytosol, matrix, and stroma [32]. Additionally, non-enzymatic antioxidants, such as ascorbate, glutathione, and tocopherol, can directly neutralize the effect of ROS and prevent oxidative stress [33]. Plants produce some metal-chelating agents that form complexes with Fe, including phytosiderophores (Fe3+-mugineic acid), citrates, nicotianamine, and phylates, preventing free Fe2+ from triggering the Fenton reaction [25]. Moreover, plants also induce the expression of iron storage proteins, such as ferritins [34], preventing the Fenton reaction by binding Fe and sequestering it into a safe and easily accessible form [35,36]. Ferritins are conserved storage proteins that act as a dynamic “iron bank” localized within the plastids and mitochondria [37,38,39]. They play a central role in cellular iron metabolism. They can sequester large amounts of iron (up to 4500 atoms), thereby allowing iron to be released to the plant cells when needed [40,41]. For storage, ferritins transform potentially toxic ferrous (Fe2+) iron into a bioavailable but non-toxic ferric (Fe3+) ion [42]. Iron stored in ferritins cannot interact with oxygen to generate reactive oxygen species (ROS) [43]. As such, ferritins protect plants from iron-induced oxidative stress and buffer intracellular iron levels [44,45]. Four genes, AtFer1, AtFer2, AtFer3, and AtFer4, encode ferritin in A. thaliana. AtFer1, AtFer3, and AtFer4 are expressed in vegetative and reproductive tissues, whereas AtFer2 is only present in the seeds [38,46]. The triple-ferritin-mutant Fer1-3-4 plants accumulate excessive iron in flowers and display a high activity of antioxidant enzymes compared to wild-type plants [47]. Considering the link between iron homeostasis and oxidative stress [47], intracellular iron could thus fuel protein carbonylation in vivo.
Previous studies proposed that iron homeostasis influences the extent of protein carbonylation in vivo, but this hypothesis has never been tested [6,48,49]. In this study, we examined this hypothesis by scrutinizing ferritin-deficient mutants and wild-type (WT) plants. Although protein carbonylation is commonly considered to be primarily caused by stress, the contents of carbonylated proteins differed between the wild-type and the ferritin-triple-mutant plants subjected to heat stress. The disruption of ferritin genes appears to alter protein carbonylation in vivo in addition to stress. In agreement with this, our results indicated that both exogenously supplied iron and endogenous iron greatly influence protein carbonylation in the plant under normal and stress conditions. Iron-deficient conditions mostly led to the carbonylation of cytosolic and plasma membrane proteins involved in the regulation of intracellular signal transduction and ribosome functions and chloroplast proteins involved in auxin and chlorophyll metabolism.

2. Results

2.1. Iron Homeostasis Influences the Carbonylation of Proteins in A. thaliana In Vivo under Normal Growth Conditions

To investigate the influence of intracellular iron on the occurrence of protein carbonylation in vivo, we compared the profiles of the carbonylated proteins between the WT and the ferritin triple mutant (Fer-1-3-4) of A. thaliana leaves at 7, 14, 28, and 42 days of plant growth, corresponding to the principal growth stage of 1.0 (early vegetative phase), stage 1.04 (leaf development), stage 3.70 (rosette growth), and stage 6.50 (flower production), respectively, after stratification [50]. Although the level of carbonylated proteins varied in both WT and the mutant depending on the growth stage (Figure 1a,b, Figure S1), the profile of the carbonylated proteins in the leaves of the mutant was similar to that of the WT, except for the samples of the first week post-stratification corresponding to the growth stage of 1.0 (early vegetative phase) [50] (Figure 1a,b, Figure S1). In these seedling samples, the levels of carbonylated proteins were lower in the mutant than in the WT. To assess the link between the intracellular iron content and the level of carbonylated proteins, the total iron content in the plant tissue was measured using a spectrophotometry-based assay that quantifies Fe2+-bathophenanthroline disulfonate (BPDS3) complexes against a set of Fe standards [51,52]. The WT and mutant seedlings (up to 14 days old) have accumulated much more iron than the adult plants, but the iron content was lower in the WT than in the mutant (Figure 1c).
Since the iron pools may vary between the leaves and the other parts of the plant, we examined the profile of the carbonylated proteins in different organs of the plants. We found that the profile and the amount of the carbonylated proteins differed between the leaves, stem, and flowers and between the WT and the triple ferritin mutant Fer-1-3-4. There were more carbonylated proteins in the flowers than in the leaves of the WT and the mutant (Figure 2a,b, Figure S2). In addition to this, the carbonylated proteins were more abundant in the stem samples of Fer-1-3-4 than those of the WT, and a few bands of carbonylated proteins could be distinguished between the WT and the Fer-1-3-4 stem and flower samples. In parallel, the flowers were found to contain much more iron than the leaves and the stems of the two genotypes, and the iron content was slightly more abundant in the leaf, stem, and flower samples of the mutant than in the samples of the WT (Figure 2c). This indicated that some proteins were differentially carbonylated between the WT and the Fer-1-3-4 mutant and between the organs depending on the iron availability.

2.2. Iron Homeostasis Impacts on the Occurrence of Protein Carbonylation under Stress

Protein carbonylation is well known to intensify under stress conditions, but the contribution of intracellular iron is less clear. To verify whether iron availability influences protein carbonylation under stress conditions, the profiles of the carbonylated proteins were compared between the WT and the ferritin-triple-mutant Fer-1-3-4 seedlings exposed to heat stress at 38 °C. There was much difference between the WT and the Fer-1-3-4 as to the amount and profile of the carbonylated proteins that accumulated in response to the heat treatment. As judged by the intensity of the red and green pseudocolor fluorescence derived from the hydrazide probes used for labeling the carbonylated proteins, some fluorescent protein bands were present in the samples of the WT seedlings exposed to heat but absent in the control samples (Figure 3a,b: WT panel, lanes corresponding to Mixed C + heat samples, Figure S3). In contrast to the minor changes observed in the WT, the level of carbonylated proteins markedly increased in the samples of heat-treated Fer-1-3-4 mutant compared to the samples of untreated seedlings (Figure 3: Fer-1-3-4 panel, lanes corresponding to Mixed C + heat samples, Figure S4). The disruption of the major ferritin gene expression in the Arabidopsis shoots thus appeared to enhance protein carbonylation in the seedlings exposed to severe heat stress and underlined the importance of iron homeostasis in the occurrence of protein carbonylation in vivo.

2.3. Iron Excess and Iron-deficient Conditions Influence Protein Carbonylation in the A. thaliana Seedlings

To examine the influence of the iron levels in the growth medium on the carbonylation of cellular proteins, the profile of the carbonylated proteins was analyzed in seedlings that were grown in a standard MS growth medium (iron-sufficient conditions) and then transferred to the same medium supplemented with 500 µM of Fe-EDTA (iron-excess condition) for 72 h. We found that the profile of the carbonylated proteins was similar between the WT and Fer-1-3-4 mutant seedlings for that short period of exposure to excess iron in the growth medium (Figure 4a, Figure S5). However, when the seeds were sown and grown for 10 days on a solid MS medium containing excess iron, the carbonylated proteins accumulated at an important level in both WT and Fer-1-3-4 mutant seedlings compared to the untreated seedlings (Figure 4b,d: compare the lane termed “Mixed” with the two lanes on its left, Figure S6). This indicated that the long-term exposure of Arabidopsis seedlings to excess iron promoted the carbonylation of proteins in vivo. Similarly, we found that the profile of the carbonylated proteins was altered in the WT and the Fer-1-3-4 mutant seedlings exposed to iron deficiency for 10 days (Figure 4c,e: compare the lane termed “Mixed” with the two lanes on its left, Figure S7). Under both iron-excess and iron-deficient conditions, the profile of the carbonylated proteins differed between the WT and the Fer-1-3-4 seedlings (Figure 4d,e, respectively). As described above, we measured the iron content of the samples to assess the link between the intracellular iron content and the level of carbonylated proteins. The iron content was slightly less in the WT than in the mutant under control conditions, but it significantly increased in both the WT and Fer-1-3-4 mutant when exposed to excess iron, although to a lesser extent in the mutant than in the WT (Figure 4f). In contrast, we observed that the iron contents between the WT and mutant seedlings exposed to an iron deficiency treatment were significantly lower than the control, and there was no difference between the genotypes (Figure 4f). Hence, under the excess iron growth conditions, the level of carbonylated proteins increased in parallel with the increased iron content of the seedlings, whereas under iron deficiency, a few proteins became differentially carbonylated in the seedlings, even though the iron content did not change.
As protein carbonylation also requires ROS in addition to iron, we examined the effects of the iron treatments on both the accumulation of hydrogen peroxide (H2O2), superoxide radicals (O2), malondialdehyde (MDA), and on the level of superoxide dismutase and catalase activities. The H2O2 content did not significantly change in the WT, but there was a small decrease in the Fer-1-3-4 ferritin mutant (Fer-1-3-4) under the excess-iron and iron-deficient conditions (Figure 5a). These observations were confirmed after staining the seedlings using 3,3′-Diaminobenzidine (DAB) and nitro blue tetrazolium chloride (NBT) to detect H2O2 and O2, respectively (Figure S8). Consistent with the level of these ROS, there was no significant difference in the level of MDA in the WT and the mutant seedlings (Figure 5b). Moreover, SOD activity was lower under iron-excess and iron-deficient conditions than under the control condition in the WT and Fer-1-3-4 ferritin mutant. CAT activity did not change in the WT but decreased in the Fer-1-3-4 ferritin mutant under both iron treatments, which was in agreement with the measured H2O2 level (Figure 5c,d). These observations indicated that a change in the iron availability in the growth medium greatly influenced the occurrence of protein carbonylation in the Arabidopsis seedlings independent of ROS accumulation and oxidative stress.

2.4. Identification of Carbonylated Proteins in WT in Response to Iron Deficiency by LC-MS/MS Analysis

To examine whether iron promotes the carbonylation of a particular set of proteins, we sought to identify the proteins that are carbonylated in the Arabidopsis seedlings in response to iron (Fe) deficiency. We extracted the proteins and performed a peptide-level enrichment of the carbonylated proteins prior to LC-MS/MS analysis, as described previously (Figure 6) [53,54]. Additional details about the procedures that were used to identify the peptides and proteins are provided in the methods section of this article. We also looked for sites of modifications by searching for adducts with lipid-derived electrophiles malondialdehyde (MDA), 4-hydroxy-2-nonenal (HNE), acrolein, 4-oxo-nonenal (ONE), 4-hydroxy-2-hexenal (HHE), 4-oxo-2-hexenal (OHE), crotonaldehyde, cinnamaldehyde and pentanal based on the expected mass shifts when Lys, Arg, Thr, and Pro are carbonylated.
This approach was shown to facilitate the detection of the modification sites compared to the enrichment of the carbonylated proteins at the protein level [12,53]. A total of 183 carbonylated proteins were identified through the use of LC-MS/MS after manual data curation. Of these, 175 and 91 carbonylated proteins were found in three sample replicates of the control and iron deficiency treatment, respectively (Figure 7).
Interestingly, eight carbonylated proteins were exclusively identified in response to iron deficiency, whereas ninety-two carbonylated proteins were only identified in the control samples (Figure 7). A few selected carbonylated proteins uniquely identified in the control or iron-deficient samples are listed in Table 1 and Table 2, respectively. The eight proteins that were found to be carbonylated specifically in the seedlings under iron-deficient conditions include the plasma membrane H+-ATPase (HA2), NADPH-protochlorophyllide oxidoreductase (PorC), receptor for activated C kinase 1A (RACK1A), nitrilase 1 (NIT1), subtilisin-like protease, 50S ribosomal protein L5, 60S ribosomal protein L15-1, and 30S ribosomal protein S2 (Table 2). The plasma membrane proton pump H+-ATPase (AHA2) is an important P-type proton pump that mediates the acidification of the rhizosphere in response to Fe deficiency. The acidification triggers the solubilization of Fe3+, which helps to free Fe3+ from chelated complexes prior to its reduction into Fe2+ and uptake into the root cells. NIT1 catalyzes the conversion of indole-3-acetonitrile to the auxin indoleacetic acid (IAA) in Arabidopsis, and Fe-deficiency increases auxin levels in the root to induce the formation of branched root hairs [57]. RACK1A is involved in multiple signal transduction pathways, and three isoforms in A. thaliana act redundantly to negatively regulate abscisic acid responses during seed germination and early seedling development [58,59]. Eighty-three (83) carbonylated proteins were simultaneously found in the control and iron deficiency treated plant samples (Table 3).
In addition to identifying proteins carbonylated via direct carbonylation, we looked for modifications by searching for adducts with lipid-derived electrophiles malondialdehyde (MDA), 4-hydroxy-2-nonenal (HNE), acrolein, 4-oxo-nonenal (ONE), 4-hydroxy-2-hexenal (HHE), 4-oxo-2-hexenal (OHE), crotonaldehyde, cinnamaldehyde, and pentanal. We identified five sites modified by OHE, three sites modified by acrolein, four sites modified by ONE, two sites modified by MDA, and one site for the other carbonyl aldehydes (Table S2). A full list of all of the identified proteins in this study is available in the Supplementary Materials.

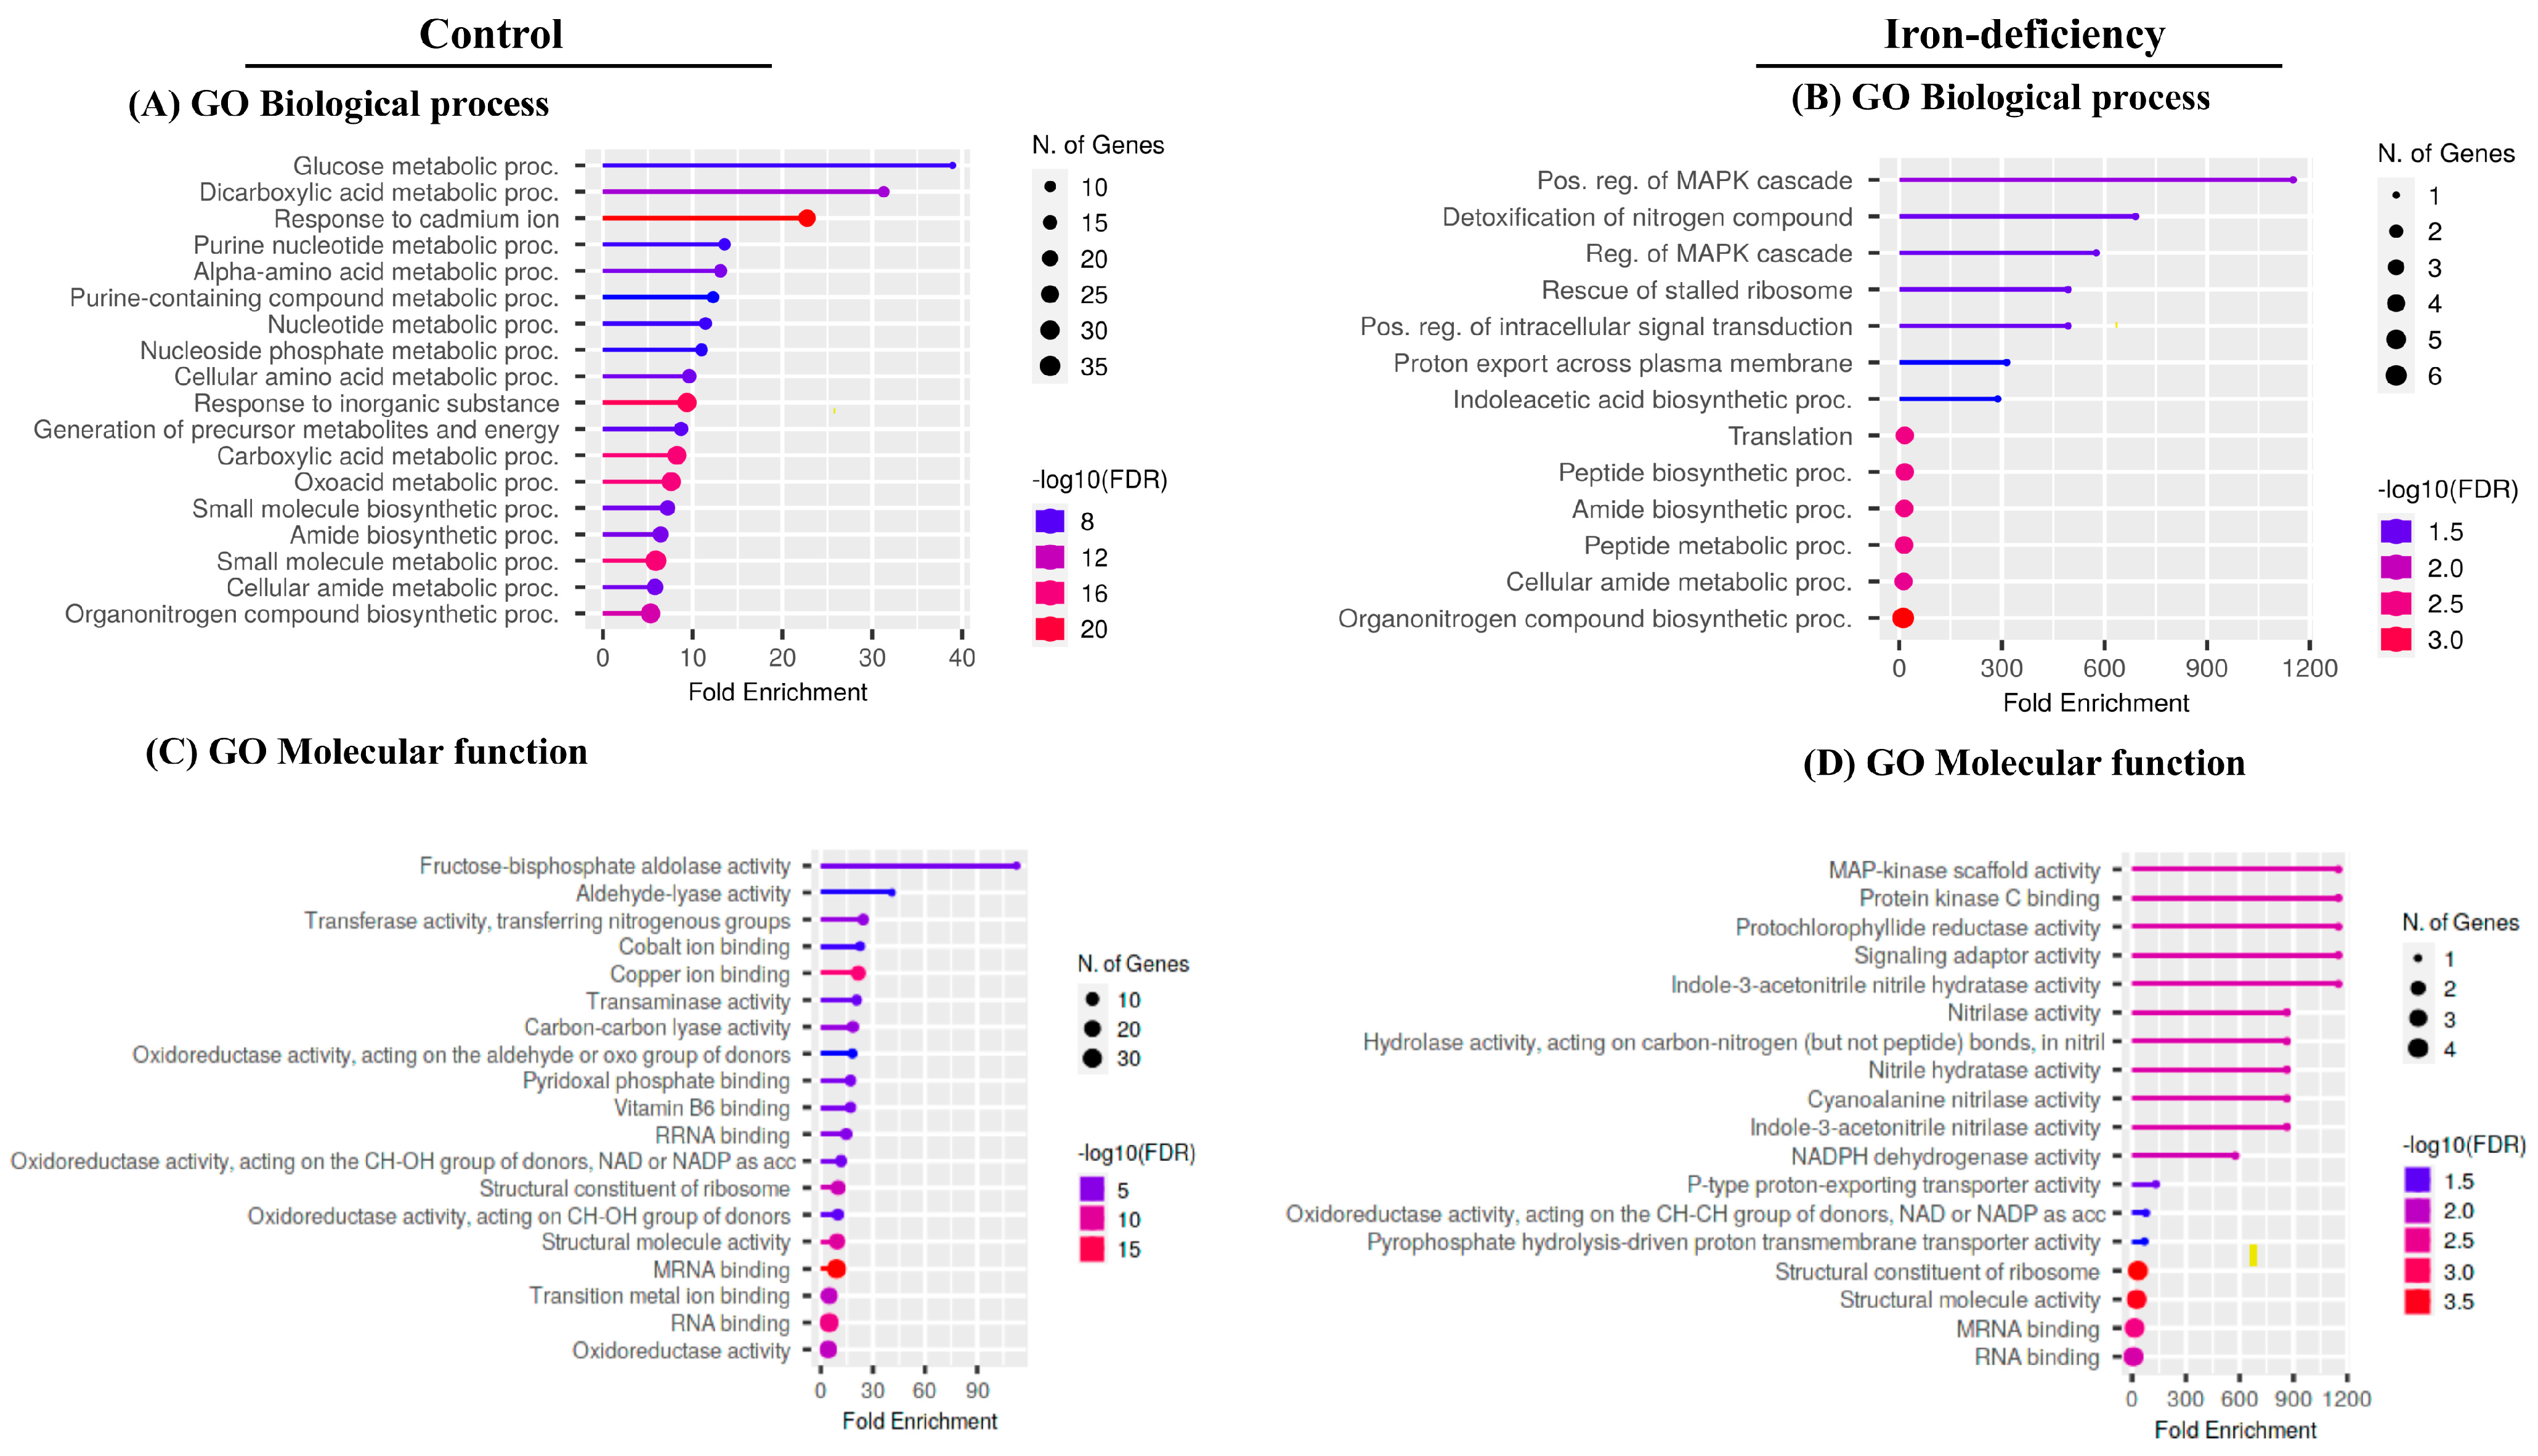
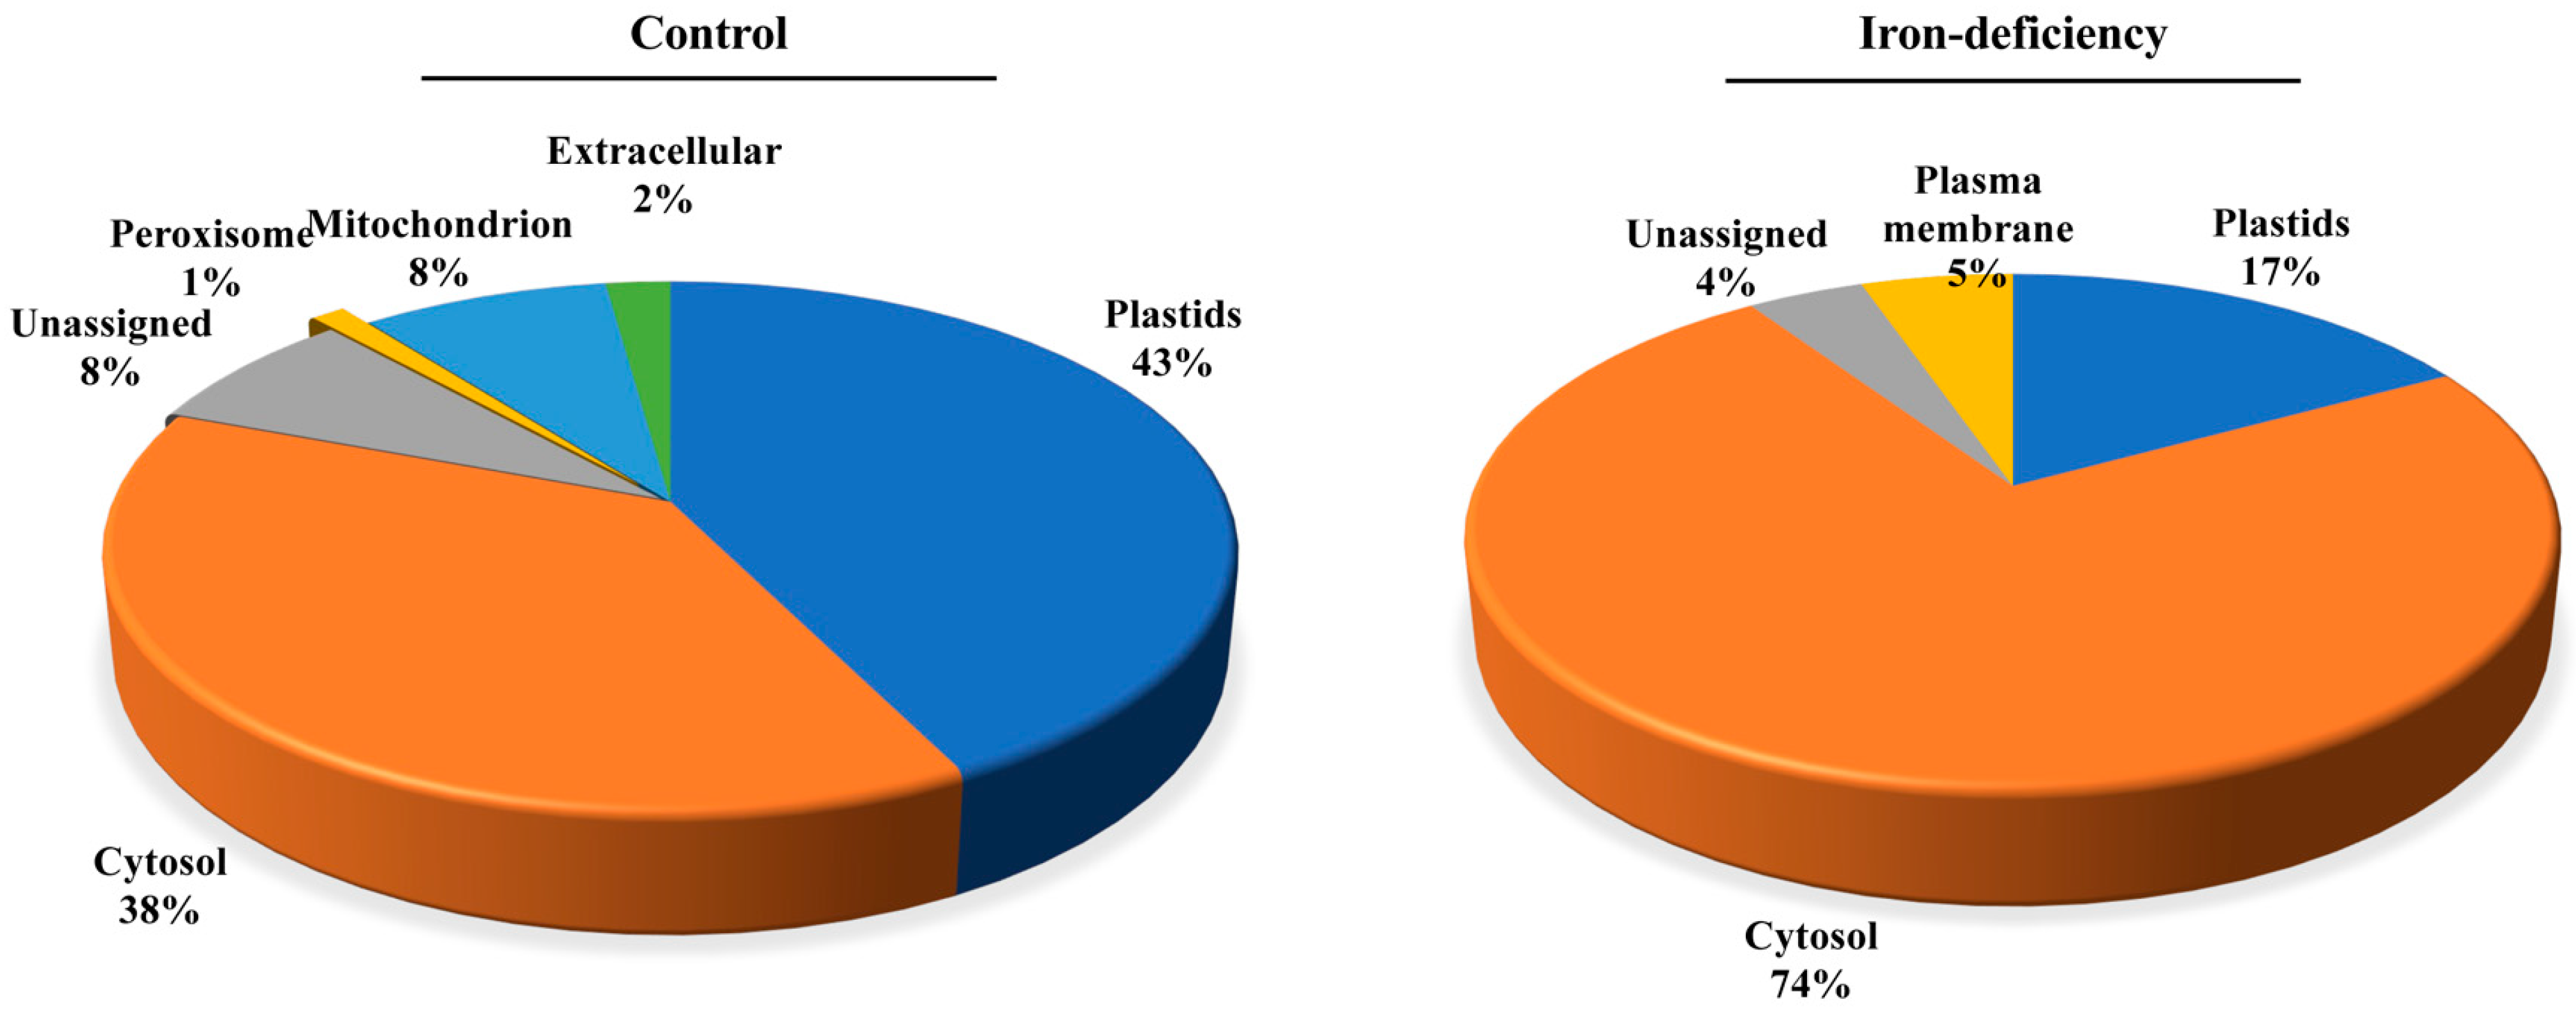
2.5. Protein Carbonylation Targeted Different Processes under Control and Iron-deficient Conditions

To better understand the biological processes affected by protein carbonylation in response to iron deficiency, we performed gene ontology (GO) enrichment analysis on the two lists of carbonylated samples using ShinyGO, a web-based bioinformatics resource [60]. Distinct functional categories were overrepresented in the list of carbonylated proteins derived from the Fe-deficiency-treated samples compared to the control samples (Figure 8). The processes of glucose metabolism (GO:006006), response to cadmium ion (GO:0046686), and dicarboxylic acid metabolism (GO:0043648) were more than 20-fold enriched within the 92 carbonylated proteins uniquely found in the control samples. In contrast, the biological processes related to the positive regulation of MAPK cascade (GO:0043410), the positive regulation of intracellular signal transduction (GO:0120029), proton export across the plasma membrane (GO:0120029), indoleacetic acid biosynthesis (GO:0009684), and rescue stalled ribosome (GO:0072344) were overrepresented in the list of carbonylated proteins in response to Fe deficiency. In agreement with the overrepresented biological processes, fructose–bisphosphate–aldolase activity, aldehyde–lyase activity, transferase activity, and copper and cobalt ion binding were the molecular functions overrepresented in the list of the carbonylated proteins identified in the control samples. In contrast, the enzymes having MAPK scaffold activity, protochlorophyllide reductase activity, indole-3-acetonitrile hydrase activity, nitrilase activity, and P-type proton-exporting transporting activity were overrepresented among the carbonylated proteins in response to Fe-deficient conditions.
We predicted the subcellular localization of the identified carbonylated proteins by using the Subcellular Proteomic Database, SUBA (http://suba.plantenergy.uwa.edu.au; [61]) (Figure 9). The carbonylated proteins specific to the control samples were found to be distributed in mostly all organelles, with a significant number of them being in the chloroplasts (43%) followed by the cytosol (38%). Only 8% of them were assigned to the mitochondria (Figure 9). In comparison, the carbonylated proteins found uniquely in the Fe-deficiency-treated seedlings were mainly enriched in the cytosol (74%), and only 17% and 5% of them were assigned to the plastids and plasma membrane, respectively. It is noteworthy that no plasma membrane localization was assigned to the carbonylated proteins identified in the untreated samples, which suggests that iron deficiency may specifically direct the carbonylation of membrane proteins. We also examined the group of carbonylated proteins that were found both in the control samples and the Fe-deficiency samples. These were mostly involved in the reductive pentose–phosphate cycle (GO:0019253), carbon fixation (GO:0015977), photosynthesis, the dark reaction (GO:0019685), and the response to cadmium ions (GO:0046686) (Figure S9). The over-represented molecular functions included enzyme activator, disordered domain-specific binding, and copper ion binding. The proteins were assigned to different compartments: cytosol (27%), plastid (18%), peroxisome (5%), and mitochondria (3%).
Overall, the gene enrichment analyses indicated that iron deficiency mostly led to the carbonylation of cytosolic and plasma membrane proteins involved in regulation of intracellular signal transduction and ribosome functions, and of chloroplast proteins involved in auxin and chlorophyll metabolism.

3. Discussion

In this study, we investigated how iron influences protein carbonylation in vivo. For that, we compared the carbonylated proteomes of a ferritin triple mutant (Fer-1-3-4) with those of the wild type under heat stress and exposure to iron deficiency and to excess iron.

3.1. Ferritins are More Relevant to the Steady State Occurrence of Protein Carbonylation under Normal Growth Conditions in Plant Organs

Firstly, the results of this study revealed that the major variation in the occurrence of protein carbonylation during vegetative growth is independent of stress. This agrees with the well-documented fact that under normal growth conditions, plants accumulate numerous carbonylated proteins [62,63]. In comparison to the WT, there was a difference in the pattern of carbonylated proteins observed in the ferritin mutant (Fer-1-3-4) during the early growth stage and toward the end of vegetative growth. This indicated that ferritin might play a role in the accumulation of carbonylated proteins during plant growth. Consistently, a difference was seen in the level of carbonylated protein in different organs of the WT and ferritin mutant (Fer-1-3-4). Notably, more carbonylated proteins were accumulated in the stems of Fer-1-3-4 than in the WT. This was in accordance with reports from Ravet and colleagues that suggested the existence of different iron pools in the plant organs [47]. While the results of this study validated this thesis, they also revealed the influence of the iron pools on protein carbonylation in A. thaliana in vivo under normal growth conditions. Beyond this, the results strongly support the fact that iron homeostasis influences protein carbonylation under stress conditions. Previous studies have shown that ferritins are induced by excess iron or abiotic stress but repressed in the case of iron deficiency, leading to increased iron availability [34,46,47,64]. Based on that, we reasoned that the influence of iron on protein carbonylation could be brought up further when accessing the WT and the ferritin mutant under stress conditions. Not only did the heat stress increase the level of carbonylation in the plants, but the changes in the profile of carbonylated proteins were more significant in the ferritin triple mutant (Fer-1-3-4) than in the WT (Figure 3). Collectively, these observations revealed that intracellular iron availability influenced the occurrence of protein carbonylation, and although ferritins may not play a major role in iron storage in the plants [35,47], their disruption had an impact on protein carbonylation. Cryptic iron release by ferritins might serve to induce discrete protein carbonylation events. The question, then, was about the conditions in which iron is released by ferritins to induce carbonylation in vivo as well as the proteins of which the function is influenced by this modification.

3.2. The Induction of Protein Carbonylation by Intracellular Iron Is Independent of An Oxidative Stress

In this study, the result revealed that both excess iron and iron-deficient conditions impact the carbonylation of proteins, as judged through the changes in the profile of the carbonylated proteins (Figure 4). When the exposure to excess iron began from the germination, as would be the case in soils rich in iron, excess iron in the medium increased protein carbonylation in the WT and in Fer-1-3-4. However, the fact that Fer-1-3-4 contained similar and sometimes fewer carbonylated proteins than WT seemed counterintuitive and might stem from a marked decrease in iron uptake by the mutant. Reduced iron uptake in A. thaliana exposed to excess iron has been previously reported [64]. Remarkably, the H2O2 content did not significantly change in the WT and even decreased in the ferritin mutant under both the excess-iron and iron-deficient conditions. The CAT activity was lower in the ferritin mutant, which mirrored the measured H2O2 content. Similarly, there was no significant difference in the level of MDA in the WT and ferritin mutant under both conditions. These indicated that the changes in the profiles of the carbonylated proteins observed under both the excess-iron and iron-deficient conditions would stem from the fluctuations in the iron pools rather than oxidative stress. Indeed, excess iron supply induces ferritin expression, whereas iron deficiency inhibits ferritin expression [47,65,66]. Small variations in intracellular availability likely serve to induce specific events of protein carbonylation independent of oxidative stress.
Furthermore, more carbonylated proteins were identified in the control samples than in the iron deficit-treated samples in this study. This is reminiscent of our previous study, where fewer numbers of proteins were found to be carbonylated in ABA-treated Arabidopsis seedlings than in the untreated seedlings [12]. Most of the carbonylated proteins identified in the control samples were antioxidant enzymes involved in cellular response to stress (catalase 3, monodehydroascorbate reductase 1, and thioredoxin protein), carbohydrate metabolism and energy production (fructose–bisphosphate aldolase 6, malate dehydrogenase, and phosphoglycerate kinase 3), protein folding (Heat shock 70 kDa protein and chaperonin 60), ion channel transport (V-type proton ATPase subunit B1 and C), amino acid metabolism (aspartate aminotransferase and glutamate dehydrogenase 1) and plant defence (Metacaspase-4). These observations suggest that i) numerous enzymes and stress-responsive proteins are carbonylated in the plants under control conditions in the absence of stress, which may contribute to their homeostasis, and ii) the carbonylated proteome is responsive to external cues, such as iron availability.

3.3. Protein Carbonylation Appears as a Candidate Mechanism for the Control of Iron Deficiency Response in A. thaliana

The biological significance of the carbonylation of proteins under iron deficiency remains to be investigated. The findings of this study, which revealed that AHA2 and NIT1 were carbonylated under iron deficiency, appeared counterintuitive. However, evidence that heavy metal stress decreases the activity of H+-ATPase was reported [67], and the activity of the proton pump might be modulated at the protein level through reversible phosphorylation [68,69]. There is limited evidence concerning AHA proteins undergoing another form of PTM other than phosphorylation, but we speculate that the carbonylation of AHA2 and of NIT1 under iron deficiency may serve to modulate their activity and abundance. A quantitative proteomics approach would have helped elucidate this aspect. As for RACK1 and ribosomal proteins (Table 2), it is worth noting that the ribosomal protein L15-1 was reported to be engaged in ribosome binding to mRNA during translation [70]. The binding of the yeast RACK1 to ribosomes represents a crucial way of regulating translation and was shown to be essential for the full translation of capped mRNAs and the efficient recruitment of eukaryotic initiation factor 4E (eIF4E) [71]. Likewise, RACK1 physically interacts with Arabidopsis Eukaryotic Initiation Factor6 (eIF6), whose mammalian homolog is a key regulator of 80S ribosome assembly [72]. More than 80% of the genes co-expressed with RACK1 encode ribosome proteins, implying that RACK1 may be required for the normal production of 60S and 80S ribosomes [72]. In another study of the Arabidopsis transcriptome response to iron deficiency, a gene co-expression analysis revealed a subnetwork containing RACK1A and RACK1B and the four major regulators of Fe homeostasis, including BTS, PYE, bHLH39, and bHLH101 genes as well as several central players in Fe homeostasis, such as OPT3, FRO3, NAS4, IRT1, and MTPA2. These findings underlined the interplay between protein translation and iron homeostasis, and our current results suggest that RACK1 proteins may constitute the node between the two processes. Indeed, yeast cells were shown to activate global repression of protein synthesis after exposure to iron starvation [73]. Whether the same mechanism takes place in Arabidopsis is unknown, but we may speculate that the protein carbonylation of RACK1 and ribosomal proteins might serve to repress translation in plants under iron deficiency.
A limitation of our study is that the results reported here do not answer the key question of the benefits or importance of protein carbonylation in terms of plant response to iron deficiency. Does the carbonylation of certain proteins promote iron uptake or repress it? Our results indicated that certain proteins involved in the iron deficiency response became carbonylated under iron-deficient conditions. However, as we did not use a quantitative proteomics approach, the proportion of the carbonylated versus non-carbonylated version of these proteins is unknown. Since carbonylation a priori inactivates a protein and leads to its degradation (as reviewed in [2]), the carbonylation of a negative regulator of iron uptake under iron deficiency would promote iron uptake. In the literature, the study of Fe-deficiency response genes uncovered BTS as a negative regulator of Fe uptake [74]. BTS is expressed throughout the plant [75,76]. Knockdown mutants of BTS accumulate significant Fe following increased Fe uptake [74]. BTS contains three hemerythrin domains that bind Fe and oxygen and lead to its degradation [75,76]. The deletion of two of these domains (1 and 2) reduces the number of Fe bound by BTS and concurrently renders BTS stable [75,76,77]. In vitro translation experiments using a wheat cell lysate showed that BTS is not targeted by the 26S proteasome since the compound of MG132, a 26S proteasome inhibitor, does not influence its stability. Moreover, in this same system, the addition of Fe leads to the degradation of BTS, while Fe chelators promote its accumulation [75,76]. These showed that the instability of BTS is triggered by the presence of Fe; we speculate that BTS could be carbonylated following iron binding. In our study, we did not identify BTS, but the detection of the full-length BTS protein is known to be very challenging [76]. The precise mode of the regulation of BTS protein level in the plant and the mechanism by which its binding to Fe leads to its degradation in the cell remain to be investigated. In our opinion, testing the hypothesis that Fe regulates its own uptake via the carbonylation of a regulatory factor such as BTS would further broaden our comprehension of the plant’s response to iron deficiency.

4. Materials and Methods

4.1. Plant Materials and Growth Conditions

The seeds of Arabidopsis thaliana were ordered from the stock centre of A. thaliana (ABRC), and the wild type of A. thaliana L. (Col-0) plants were used for all experiments. The ferritin triple mutant (Fer-1-3-4) line was obtained as a gift from Dr Christian Dubos (Biochimie et Physiologie Moleculaire des Plantes, Montpellier, France) and was confirmed through the use of PCR (Polymerase Chain Reaction) screening using T-DNA-specific primers and gene-specific primers, as previously described [47]. The primer sets are listed in Supplementary Table S1. The seeds were surface-sterilised using 70% (v/v) ethanol for 2 min followed by 5% (v/v) NaOCl (bleach) containing 0.02% SDS (Sigma-Aldrich, St. Louis, MS, USA) for 3 min and then rinsed four times with sterile water. The seeds were placed onto half-strength Murashige and Skoog (MS) medium (Phytotechnology Laboratories, Shawnee Mission, KS, USA) supplemented with 0.7% agar and 1% sucrose (pH 5.8) then stratified for 2 days at 4 °C in the dark before the plates were transferred to a growth chamber and grown at 22 °C in a photoperiod of 14 h darkness followed by 10 h of light [78].

4.2. Profiling of Total Carbonylation Levels at Different Growth Phases and in Different Organs of Arabidopsis Plants

To profile the carbonylated proteins within the wild type (WT) and Fer-1-3-4 mutant, the plants were grown for 6 weeks after stratification, and the leaves were collected at 7, 14, 28, and 42 days of plant growth, corresponding to the principal growth stage of 1.0 (early vegetative phase), stage 1.04 (leaf development), stage 3.70 (rosette growth), and stage 6.50 (flower production), respectively, as described by [50]. The leaf samples were harvested under liquid nitrogen prior to storage at −80 °C before protein extraction. Three independent experiments were conducted. To examine the carbonylated protein levels in the different organs of the plant, leaves, stems, and flowers were harvested from six-week-old plants grown on soil at 22 °C with 14 h dark/10 h light period in a controlled growth chamber. The samples were harvested in liquid nitrogen prior storage at −80 °C before protein extraction and three independent experiments were conducted with WT and Fer-1-3-4.

4.3. Heat Stress Treatment

The seedlings were initially grown on half-strength MS plates for 10 days before they were subjected to the heat treatment that consisted of moving the plates at 38 °C for 1 h, 3 h, and 6 h in an incubator in the dark. Then, recovery was performed in a growth chamber at 22 °C for 2 h under a light, as previously described [78]. The control plates were kept at 22 °C under the same conditions. Three different plates of seedlings that were grown under light for 10 days were used in each experiment.

4.4. Iron Treatments

For long-term exposure to excess iron, the seeds were grown on solid half-strength MS medium supplemented with 500 µM Fe (III)-EDTA (Alfa Aesar IL, USA) at 22 °C with 14 h dark/10 h light period for 10 days [64,79]. For short-term excess iron treatment, the seedlings were pre-cultivated on half-strength MS medium for 10 days and then transferred into fresh (1/2 MS) liquid medium supplemented with 500 µM Fe (III)-EDTA for 24 h, 48 h, and 72 h.
For the iron deficiency treatment, the seeds were grown on a half-strength MS plate containing 300 µM 3-(2-pyridyl)-5-6-diphenyl-1,2,4-triazine sulfonate (ferrozine) (Alfa Aesar, Ottawa, ON, Canada). The control experiment was undertaken by growing the seeds on solid half-strength MS medium plates for 10 days [75]. The seedlings were harvested under liquid nitrogen prior to storage at −80 °C before protein extraction. Three independent experiments were conducted.

4.5. H2O2 Content Estimation

The hydrogen peroxide (H2O2) content was measured using the 2,2′-azino-bis (3-ethylbenzthiazoline-6-sulfonic acid) diammonium salt (ABTS; Sigma Aldrich, St. Louis, MO, USA) method, as previously described [80], with slight modifications. Briefly, ten-days-old wild-type and Fer-1-3-4 seedlings grown under excess iron and iron-deficient conditions were harvested, and the H2O2 from the plant extracts was extracted, as described in [81]. H2O2 production was revealed through the use of ABTS, which reacts with H2O2 in the presence of horseradish peroxidase (HRP) to generate a soluble end product (radical monocation ABTS·+). The radical monocation ABTS·+ was detected spectrophotometrically at 405 nm [80].

4.6. DAB and NBT Staining Procedures

3,3-diaminobenzidine (DAB) staining was used to estimate H2O2 accumulation in the seedlings of WT and Fer-1-3-4, as previously described [82,83]. Briefly, the seedlings were incubated in freshly prepared DAB staining solution (1 mg/mL DAB and 0.1% Tween 20 in 10 mM Na2HPO4 for 8 h and further rinsed with 70% ethanol several times to remove chlorophyll.
Nitrotetrazolium blue chloride (NBT) staining was used to detect superoxide radical content (O2), as previously described [84,85]. The seedlings were incubated in NBT staining solution (0.2% NBT in 50 mM sodium phosphate buffer pH 7.5) for 5 h and further rinsed with 70% ethanol several times to remove chlorophyll. The images of the seedlings were captured using a digital camera.

4.7. Lipid Peroxidation Assay

For the measurement of the lipid peroxidation products, the formation of malonaldehyde (MDA) was estimated in the form of TBA-reactive substance (TBARS) and the difference of absorbance of 532 nm and 600 nm using the extinction coefficient of 155 mM−1 cm−1 [86].

4.8. Antioxidant Enzyme Activity of Catalase (CAT) and Superoxide Dismutase (SOD)

Ten-days-old Arabidopsis seedlings grown on half-strength MS medium plates were harvested and homogenized in cold 100 mM phosphate buffer pH 7 containing 1 mM EDTA and 1% polyvinylpyrrolidone and then centrifuged for 10 min at 10,000× g at 4 °C to eliminate plant debris. One hundred milligrams of plant fresh weight (FW) were used for one milliliter of phosphate buffer. The supernatants were collected and used for antioxidant enzyme activity within 4 h. The protein content in the supernatant was estimated using the Bradford assay.
Catalase (CAT) is a common and highly active enzyme that catalyzes the decomposition of H2O2 to nontoxic water and O2 [87]. CAT activity was measured in 50 mM phosphate buffer pH 7.0 containing 1 mM EDTA, 3% H2O2, and crude enzyme solution (the supernatant), as previously described [88]. The decrease in absorbance at 240 nm was monitored for 1 min and the CAT activity was presented as µmol H2O2 decomposed min−1 (unit) mg−1 protein.
Superoxide dismutase (SOD) is one of the important antioxidant enzymes that catalyzes the dismutation of the superoxide anion into hydrogen peroxide and molecular oxygen. SOD activity was analyzed through measuring the ability to inhibit the photochemical reduction of NBT at 560 nm. The reaction mixture was composed of 100 mM phosphate buffer with pH 7.8, 1 mM EDTA, 130 mM L-methionine, 750 µM NBT and 20 µM riboflavin, and 50 µL of crude enzyme extract (supernatant). The samples were illuminated for 15 min, the absorbance was measured at 560 nm, and the amount of SOD corresponding to 50% of the reaction was defined as one unit of the enzyme [88].

4.9. Protein Extraction

The plant protein extraction buffer comprised 50 mM Tris-HCl (pH 8.0) buffer, 0.1% triton X-100, 10 mM EDTA, 50 mM DTT, and 1:100 protease inhibitor. The plant seedlings or leaves were ground into a powdered form using a precooled mortar and pestle under liquid nitrogen prior to storage at −70 °C before protein extraction. The powdered samples were resuspended in the extraction buffer and centrifuged at 20,000× g for 10 min at 4 °C. Afterward, the supernatant was transferred to clean tubes for the subsequent experiments. The total crude protein concentrations (µg/µL) in the extracts were estimated using the Bradford method [89]. Briefly, 5 µL of protein sample was mixed into 1 mL of Bradford reagent (Bio-Rad Protein, Assay) and incubated for 5 min at RT. Absorbance at 595 nm was measured with the aid of a spectrophotometer (UV-VIS 1280 Spectrophotometer, Shimadzu, Japan).

4.10. Derivatization of Total Protein with Fluorescent Hydrazide Dye (Cy5.5 and Cy7.5)

This derivatization method was modified from the protocol previously described by Tamarit et al. [90]. Prior to the derivatization assay, 10 mM stock solution of the dyes was prepared in DMSO from 1 mg fluorescent hydrazide dye powder and then tenfold diluted in 0.1 M sodium acetate with pH 5, 1 mM EDTA and 1% SDS as the corresponding hydrazine working solution. One hundred microliters of Cy5.5-hydrazide working solution was added to 100 µL of total protein sample containing 100 µg of total crude protein (control samples). In parallel, 100 µL of Cy7.5-hydrazide solution was also added to 100 µL of the protein sample containing 100 µg of protein (experimental test sample). Each of the mixtures was incubated at 22 °C and continuously shaken at 500 rpm for 1 h of incubation. Then, 55 µL of 50 mM Phosphate saline buffer (PBS (phosphate-buffered saline)) with pH 7.4 and 15 µL of 0.2 M NaCNBH3 (Thermofisher) were added to stop the reaction, and finally, the mixtures were incubated at room temperature for 15 min. The reaction mixture was further precipitated with 270 µL of 20% trichloroacetic acid (TCA) and kept for 30 min on ice or overnight at 4 °C. The mixture was centrifuged at 10,000× g for 5 min, and the supernatants were discarded. Moreover, the pellets were further briefly sonicated for 3 sec (Eppendorf) and washed thrice with 1 mL of 1:1 (v/v) ethanol: ethyl acetate and centrifuged at 10,000× g for 10 min at 4 °C. After a final washing, the pellets were air-dried and resuspended in a protein extraction buffer with continuous pipetting and spin-down. Thereafter, the supernatant was collected and stored at −80 °C.

4.11. Gel Electrophoresis of Fluorescent Labeled Proteins (1D-PAGE)

For 1D-gel electrophoresis, 10 µg labeled protein were mixed with 4X Laemmli sample buffer (50 mM Tris-HCl pH 6.8, 2% SDS, 10% (v/v) glycerol, 100 mM DTT, and 0.1% bromophenol blue) and analyzed using SDS-PAGE (4% stacking gel and 12.5% resolving gel) after heating the samples at 95 °C for ~5 min. The samples were then initially run at 10 mA for 1 h, and then the current was increased to 20 mA, and the gels were run on the same current until the tracking dye crossed the gels using a vertical Bio-Rad Mini-Protean Tetra Cell.

4.12. In-gel Fluorescence-based Detection of the Total Proteins and the Carbonylated Proteins

The SDS-PAGE gels were stained with AzureRed (Azure Biosystems, Dublin, CA, USA) to visualize the total protein by following the protocol of the manufacturers. The gel was first fixed in fixing solution (1.01 g of AzureRed powder A in 85 mL of ethanol and 15 mL) for 1 h with gentle rocking and further stained with Azure staining solution 1:200 (AzureRed dye: staining buffer (2.34 g of AzureRed powder B in 100 mL of sterile water) for 1 h with gentle rocking. Then, the gel was briefly washed with sterile water and washing solution (85 mL of sterile water and 15 mL of 100% ethanol) for 30 min. The gel was then removed and incubated in a fixing solution for 30 min with gentle rocking before visualization. The carbonylated proteins on the gel were visualized through the use of fluorescence imaging using the Azure SapphireTM Biomolecular imager (Azure Biosystems, CA) with the following specific settings: 100 µm pixel size for resolution scan, 658 nm (red color) for Cy5.5, and 784 nm (green color) near-infra-red for Cy7.5). The total protein was detected at 520 nm. The gel images were visualized using Azure SapphireTM Biomolecular imager (Azure Biosystems, CA) and the fluorescent signal intensity was analyzed using AzureSpot (Azure Biosystems, CA). For quantification, the total fluorescent signal intensity was obtained from each lane after background subtraction across the gel was performed, and the total protein signal intensity was also measured from the entire lane. Then, the fluorescence signal intensity (total carbonyl content) was normalized to the total protein signal intensity.

4.13. Determination of Iron (Fe) Content

The total iron content in the plant tissues (leaves, stems, flowers, and seedlings) was determined using a procedure previously described by [51]. Plant tissues, including the leaves, stems, flowers, and seedlings (10-day-old seedlings), were collected and rinsed with de-ionized water and further oven-dried at 65 °C for 2 days. Then, the dried tissues were digested with 65% (v/v) HNO3 at 95 °C for 6 h, followed by 30% (v/v) H2O2 at 56 °C for 2 h. The iron content in the different samples was analyzed in a mixture of digested samples and assay solution containing 1 mM bathophenanthroline disulfonate (BPDS), 0.6 M sodium acetate, and 0.48 M hydroxylamine hydrochloride [52]. The absorbance of the resulting Fe2+-BPDS3 complex was measured at 535 nm using a microplate reader (Synergy, USA). The standard curve was prepared using FeCl3 as a standard solution, and the Fe content in different samples was calculated by plotting the absorbance values against the standard curve.

4.14. Identification of Carbonylated Proteins and Carbonylated Sites

This method was previously described by [53]. The total crude proteins were extracted from the control and iron-deficient samples of the wild-type seedlings. For trypsin digestion, the samples were denatured with 1% (w/v) deoxycholate sodium salt (Fischer Scientific, Belgium) and further reduced with 5 mM Tris-(2-carboxyethyl)-phosphine (TCI, Miami, FL, USA) at 60 °C for 30 min with constant shaking at 500 rpm. The samples were further alkylated with 10 mM iodoacetamide (Alfa Aesar, CA) at 37 °C for 30 min in the dark. Then, the digestion was performed using 2 µg of Trypsin Gold (Promega) for 16 h at 37 °C with constant shaking at 500 rpm. The digestion was stopped with 1% formic acid, and the resulting peptides were dried under a speed vacuum. To identify the carbonylated peptides, we followed the procedure previously used in our laboratory [91,92]. Briefly, equal volumes of the peptides from the tryptic digestion were labeled with 10 mM O-(biotinylcarbozoylmethyl) hydroxylamine (ARP (aldehyde-reactive probe); Dojindo Laboratories) at 27 °C for 2 h. ARP is a biotinylated hydroxylamine derivative, N′-aminooxy-methylcarbonylhydrazino-D-biotin, selectively used for the derivatization, enrichment, and mass spectrometric characterization of carbonylated proteins [55]. The hydroxylamine group of an ARP specifically forms aldoxime/ketoxime derivatives, with the aldehyde and/or keto group and the intrinsic biotin tag facilitating the good stability of oximes that allows selective detection and enrichment through affinity chromatography and is generally used in LC-MS/MS-based studies for the effective derivatization of carbonylated peptides or proteins [53,56]. Unbound ARP molecules or excess ARP were then removed from the medium through the use of the solid-phase separation method with C18 Agilent columns according to the manufacturer’s recommendations (Agilent Technologies). The labeled peptides were eluted with 70% (v/v) acetonitrile and 0.5% (v/v) formic acid and dried under a speed vacuum. To achieve peptide-level enrichment, ARP-labeled peptides were purified via affinity chromatography using a monomeric avidin agarose slurry (Thermo Scientific) according to the manufacturer’s instructions and eluted with 70% (v/v) acetonitrile and 0.5% (v/v) formic acid. The peptide solution was desalted and dried under a speed vacuum before LC-MS/MS.
Mass spectrometry (MS) analyses were performed using the Proteomics Platform of the CHU de Québec Research Center (Quebec, QC, Canada). The samples were analyzed via nano LC/MSMS using a Dionex UltiMate 3000 nanoRSLC chromatography system (Thermo Fisher Scientific) connected to an Orbitrap Fusion mass spectrometer (Thermo Fisher Scientific, San Jose, CA, USA). The peptides were trapped at 20 μL/min in a loading solvent (2% acetonitrile, 0.05% TFA) on a 5 mm × 300 μm C18 pepmap cartridge pre-column (Thermo Fisher Scientific/Dionex Softron GmbH, Germering, Germany) for 5 min. Then, the pre-column was switched online with a Pepmap Acclaim column (ThermoFisher) 50 cm × 75 µm internal diameter separation column and the peptides were eluted with a linear gradient from 5 to 40% solvent B (A: 0.1% formic acid, B: 80% acetonitrile, and 0.1% formic acid) for 90 min at 300 nL/min for a total run time of 120 min. The mass spectra were acquired using a data-dependent acquisition mode using Thermo XCalibur software version 4.3.73.11. Full-scan mass spectra (350 to 1800 m/z) were acquired in the orbitrap using an AGC target of 4e5, a maximum injection time of 50 ms, and a resolution of 120,000. Internal calibration using lock mass on the m/z 445.12003 siloxane ion was used. Each MS scan was followed with an MS/MS fragmentation of the most intense ions for a total cycle time of 3 s (top speed mode). The selected ions were isolated using the quadrupole analyzer in a window of 1.6 m/z and fragmented through higher-energy collision-induced dissociation (HCD), with 35% collision energy. The resulting fragments were detected through the use of a linear ion trap at a rapid scan rate with an AGC target of 1e4 and a maximum injection time of 50 ms. Dynamic exclusion of previously fragmented peptides was set for a period of 20 sec and a tolerance of 10 ppm.

4.15. Database Searching and Criteria Used for Protein Identification and Data Analysis

Mascot generic file format (MGF) peak list files were created using Proteome Discoverer 2.3 software (Thermo). The MGF sample files were then analyzed using Mascot (Matrix Science, London, UK; version 2.5.1). Mascot was set up to search a contaminant database, and the Uniprot Reference Arabidopsis thaliana database (September 2020), containing 39,449 entries, was set up to evaluate the assumed samples digested with the enzyme trypsin. Mascot was searched with a fragment ion mass tolerance of 0.60 Da and a parent ion tolerance of 10.0 PPM. Carbamidomethyl of cysteine was specified in Mascot as a fixed modification. The deamidation of asparagine and glutamine and the oxidation of methionine were specified in Mascot as variable modifications. Two missed cleavages were allowed.
Scaffold (version Scaffold_5.0.1, Proteome Software Inc., Portland, OR, USA) was used to validate the MS/MS-based peptide and protein identifications. A false discovery rate of 1% was used for the peptides and proteins. The proteins that contained similar peptides and could not be differentiated based on MS/MS analysis alone were grouped to satisfy the principles of parsimony. The analysis results were filtered according to the following set of criteria: a significant threshold of p > 0.05 (with a 95% confidence for protein probability score), the protein required to be present in at least one replicate and the minimum number of unique peptides was set to one, and the maximum false discovery rate (FDR) was set to 1%.

4.16. Gene Ontology Enrichment Analysis (GO Analysis)

The carbonylated proteins identified in the proteome of the control and iron-deficient samples of the WT were analyzed for different gene ontology (GO) terms (biological function, cellular distribution, and molecular function) using the ShinyGO version 0.76 database (www.bioinformatics.sdstate.edu/go/). We filtered the results by using the expressed genome of Arabidopsis thaliana as a reference set to obtain the annotation of the proteins. A p-value of ≤0.05 (FDR) was used as the threshold to determine the significant enrichment of the GO groups.

4.17. Statistical Analysis

The total protein carbonylation of the wild-type and Fer-1-3-4 plants has been compared between treatments and between genotypes using a two-way analysis of variance (ANOVA) and Tukey’s multiple comparison post-test. When multiple t-tests were performed, the Bonferroni–Dunn method was used to calculate the adjusted p-value. Differences were considered to be significant when p < 0.05, and the statistical analyses were performed using GraphPad Prism 7.0 (GraphPad Software Inc., San Diago, CA, USA).

5. Conclusions

The data presented in this study indicate that intracellular iron influences protein carbonylation in A.thaliana in vivo, and iron deficiency triggers the carbonylation of cytosolic and plasma membrane proteins involved in signalling, protein synthesis, auxin, and chlorophyll metabolism, and the response to iron deficiency. Furthermore, our results showed that the occurrence of protein carbonylation is influenced by iron availability and ferritins, even under normal growth conditions. Protein carbonylation may represent a node linking iron deficiency response to translation and iron homeostasis.

Supplementary Materials

The following supporting information can be downloaded at: https://www.mdpi.com/article/10.3390/ijms24119732/s1.

Author Contributions

Conceptualization: A.J.T. and T.D.M.; Methodology, A.J.T.; Supervision, T.D.M.; Formal analysis, A.J.T. and T.D.M.; Funding acquisition, T.D.M.; Investigation, A.J.T.; Writing—review and editing, A.J.T. and T.D.M. All authors have read and agreed to the published version of the manuscript.

Funding

This research was funded by the Natural Sciences and Engineering Research Council of Canada (NSERC), Discovery Grant Program, grant number DGECR-2019-00304 to T.M.D.

Institutional Review Board Statement

Not applicable.

Informed Consent Statement

Not applicable.

Data Availability Statement

The datasets generated during and/or analyzed during the current study are available from the corresponding author upon reasonable request. The proteomics data underlying this article are available in the article and in its online Supplementary Materials. The data can also be found here: MassIVE MSV000090535, ProteomeXchange PXD037445.

Acknowledgments

We would like to thank Christian Dubos (Biochimie et Physiologie Moleculaire des Plantes, Montpellier, France) for kindly providing ferritin triple mutant (Fer-1-3-4) seeds. The authors wish to express their gratitude to Sylvie Bourassa and Victor Fourcassié for the LC-MS/MS data collection at the Proteomics Platform of the CHU de Québec Research Center (Quebec, QC, Canada). A.J.T thank UQTR for their financial support through the Universalis Causa Scholarship.

Conflicts of Interest

The authors declare no conflict of interest.

References

  1. Madian, A.G.; Regnier, F.E. Proteomic Identification of Carbonylated Proteins and Their Oxidation Sites. J. Proteome Res. 2010, 9, 3766–3780. [Google Scholar] [CrossRef] [Green Version]
  2. Tola, A.J.; Jaballi, A.; Missihoun, T.D. Protein Carbonylation: Emerging Roles in Plant Redox Biology and Future Prospects. Plants 2021, 10, 1451. [Google Scholar] [CrossRef]
  3. Ben-Nissan, G.; Sharon, M. Regulating the 20S Proteasome Ubiquitin-Independent Degradation Pathway. Biomolecules 2014, 4, 862–884. [Google Scholar] [CrossRef] [PubMed] [Green Version]
  4. Reichmann, D.; Voth, W.; Jakob, U. Maintaining a Healthy Proteome during Oxidative Stress. Mol. Cell 2018, 69, 203–213. [Google Scholar] [CrossRef] [PubMed] [Green Version]
  5. Dalle-Donne, I.; Aldini, G.; Carini, M.; Colombo, R.; Rossi, R.; Milzani, A.D.G. Protein carbonylation, cellular dysfunction, and disease progression. J. Cell. Mol. Med. 2006, 10, 389–406. [Google Scholar] [CrossRef] [PubMed]
  6. Møller, I.M.; Rogowska-Wrzesinska, A.; Rao, R. Protein carbonylation and metal-catalyzed protein oxidation in a cellular perspective. J. Proteom. 2011, 74, 2228–2242. [Google Scholar] [CrossRef]
  7. Biswas, S.; Mano, J. Lipid Peroxide-Derived Short-Chain Carbonyls Mediate Hydrogen Peroxide-Induced and Salt-Induced Programmed Cell Death in Plants. Plant Physiol. 2015, 168, 885–898. [Google Scholar] [CrossRef] [Green Version]
  8. Islam, M.; Ye, W.; Matsushima, D.; Munemasa, S.; Okuma, E.; Nakamura, Y.; Biswas, S.; Mano, J.; Murata, Y. Reactive Carbonyl Species Mediate ABA Signaling in Guard Cells. Plant Cell Physiol. 2016, 57, 2552–2563. [Google Scholar] [CrossRef] [Green Version]
  9. Biswas, S.; Fukaki, H.; Mori, I.C.; Nakahara, K.; Mano, J. Reactive oxygen species and reactive carbonyl species constitute a feed-forward loop in auxin signaling for lateral root formation. Plant J. 2019, 100, 536–548. [Google Scholar] [CrossRef] [PubMed]
  10. Møller, I.M.; Jensen, P.E.; Hansson, A. Oxidative Modifications to Cellular Components in Plants. Annu. Rev. Plant Biol. 2007, 58, 459–481. [Google Scholar] [CrossRef] [Green Version]
  11. Møller, I.M.; Sweetlove, L.J. ROS signalling—specificity is required. Trends Plant Sci. 2010, 15, 370–374. [Google Scholar] [CrossRef]
  12. Jaballi, A.; Missihoun, T.D. The phytohormone abscisic acid modulates protein carbonylation in Arabidopsis thaliana. Physiol. Plant. 2022, 174, e13658. [Google Scholar] [CrossRef]
  13. Kristensen, B.K.; Askerlund, P.; Bykova, N.V.; Egsgaard, H.; Møller, I.M. Identification of oxidised proteins in the matrix of rice leaf mitochondria by immunoprecipitation and two-dimensional liquid chromatography-tandem mass spectrometry. Phytochemistry 2004, 65, 1839–1851. [Google Scholar] [CrossRef]
  14. Sweetlove, L.J.; Møller, I.M. Chapter 1 Oxidation of Proteins in Plants—Mechanisms and Consequences. Adv. Bot. Res. 2009, 52, 1–23. [Google Scholar] [CrossRef]
  15. Bollineni, R.C.; Fedorova, M.; Hoffmann, R. Qualitative and quantitative evaluation of derivatization reagents for different types of protein-bound carbonyl groups. Analyst 2013, 138, 5081–5088. [Google Scholar] [CrossRef]
  16. Kehrer, J.P. The Haber-Weiss reaction and mechanisms of toxicity. Toxicology 2000, 149, 43–50. [Google Scholar] [CrossRef]
  17. Mène-Saffrané, L.; Davoine, C.; Stolz, S.; Majcherczyk, P.; Farmer, E.E. Genetic Removal of Tri-unsaturated Fatty Acids Suppresses Developmental and Molecular Phenotypes of an Arabidopsis Tocopherol-deficient Mutant: Whole-Body Mapping of Malondialdehyde Pools in a Complex Eukaryote. J. Biol. Chem. 2007, 282, 35749–35756. [Google Scholar] [CrossRef] [PubMed] [Green Version]
  18. Winterbourn, C.C. Toxicity of iron and hydrogen peroxide: The Fenton reaction. Toxicol. Lett. 1995, 82–83, 969–974. [Google Scholar] [CrossRef]
  19. Jeong, J.; Guerinot, M.L. Homing in on iron homeostasis in plants. Trends Plant Sci. 2009, 14, 280–285. [Google Scholar] [CrossRef]
  20. Broadley, M.; Brown, P.; Cakmak, I.; Rengel, Z.; Zhao, F. Function of Nutrients. Marschner’s Miner. Nutr. High. Plants Third Ed. 2012, 191–248. [Google Scholar] [CrossRef]
  21. Vert, G.; Grotz, N.; Dédaldéchamp, F.; Gaymard, F.; Guerinot, M.L.; Briat, J.F.; Curie, C. IRT1, an arabidopsis transporter essential for iron uptake from the soil and for plant growth. Plant Cell 2002, 14, 1223–1233. [Google Scholar] [CrossRef] [PubMed] [Green Version]
  22. Roschzttardtz, H.; Conéjéro, G.; Divol, F.; Alcon, C.; Verdeil, J.-L.; Curie, C.; Mari, S. New insights into Fe localization in plant tissues. Front. Plant Sci. 2013, 4, 350. [Google Scholar] [CrossRef] [Green Version]
  23. Mahender, A.; Swamy, B.P.M.; Anandan, A.; Ali, J. Tolerance of Iron-Deficient and -Toxic Soil Conditions in Rice. Plants 2019, 8, 31. [Google Scholar] [CrossRef] [PubMed] [Green Version]
  24. Becker, M.; Asch, F. Iron toxicity in rice—conditions and management concepts. J. Plant Nutr. Soil Sci. 2005, 168, 558–573. [Google Scholar] [CrossRef]
  25. Kobayashi, T.; Nishizawa, N.K. Iron Uptake, Translocation, and Regulation in Higher Plants. Annu. Rev. Plant Biol. 2012, 63, 131–152. [Google Scholar] [CrossRef] [Green Version]
  26. Lei, G.J.; Zhu, X.F.; Wang, Z.W.; Dong, F.; Dong, N.Y.; Zheng, S.J. Abscisic acid alleviates iron deficiency by promoting root iron reutilization and transport from root to shoot in Arabidopsis. Plant Cell Environ. 2014, 37, 852–863. [Google Scholar] [CrossRef]
  27. Séguéla, M.; Briat, J.-F.; Vert, G.; Curie, C. Cytokinins negatively regulate the root iron uptake machinery in Arabidopsis through a growth-dependent pathway. Plant J. 2008, 55, 289–300. [Google Scholar] [CrossRef]
  28. Maurer, F.; Müller, S.; Bauer, P. Suppression of Fe deficiency gene expression by jasmonate. Plant Physiol. Biochem. 2011, 49, 530–536. [Google Scholar] [CrossRef]
  29. Mittler, R. Oxidative stress, antioxidants and stress tolerance. Trends Plant Sci. 2002, 7, 405–410. [Google Scholar] [CrossRef]
  30. Iwamoto, M.; Maekawa, M.; Saito, A.; Higo, H.; Higo, K. Evolutionary relationship of plant catalase genes inferred from exon-intron structures: Isozyme divergence after the separation of monocots and dicots. Theor. Appl. Genet. 1998, 97, 9–19. [Google Scholar] [CrossRef]
  31. Caverzan, A.; Passaia, G.; Rosa, S.B.; Ribeiro, C.W.; Lazzarotto, F.; Margis-Pinheiro, M. Plant responses to stresses: Role of ascorbate peroxidase in the antioxidant protection. Genet. Mol. Biol. 2012, 35, 1011–1019. [Google Scholar] [CrossRef] [PubMed] [Green Version]
  32. Vogelsang, L.; Dietz, K.-J. Plant thiol peroxidases as redox sensors and signal transducers in abiotic stress acclimation. Free. Radic. Biol. Med. 2022, 193, 764–778. [Google Scholar] [CrossRef] [PubMed]
  33. König, J.; Jung, T.; Grune, T. Protein Carbonylation in Aging and Senescence. Protein Carbonylation Princ. Anal. Biol. Implic. 2017, 272–290. [Google Scholar] [CrossRef]
  34. Massenet, O.; Lobreaux, S.; Briat, J.-F. Iron induces ferritin synthesis in maize plantlets. Plant Mol. Biol. 1992, 19, 563–575. [Google Scholar] [CrossRef]
  35. Briat, J.-F.; Ravet, K.; Arnaud, N.; Duc, C.; Boucherez, J.; Touraine, B.; Cellier, F.; Gaymard, F. New insights into ferritin synthesis and function highlight a link between iron homeostasis and oxidative stress in plants. Ann. Bot. 2010, 105, 811–822. [Google Scholar] [CrossRef] [Green Version]
  36. Balla, G.; Jacob, H.S.; Balla, J.; Rosenberg, M.; Nath, K.; Apple, F.; Eaton, J.W.; Vercellotti, G.M. Ferritin: A cytoprotective antioxidant strategem of endothelium. J. Biol. Chem. 1992, 267, 18148–18153. [Google Scholar] [CrossRef]
  37. Zancani, M.; Peresson, C.; Biroccio, A.; Federici, G.; Urbani, A.; Murgia, I.; Soave, C.; Micali, F.; Vianello, A.; Macrì, F. Evidence for the presence of ferritin in plant mitochondria. Eur. J. Biol. Chem. 2004, 271, 3657–3664. [Google Scholar] [CrossRef]
  38. Tarantino, D.; Casagrande, F.; Soave, C.; Murgia, I. Knocking out of the mitochondrial AtFer4 ferritin does not alter response of Arabidopsis plants to abiotic stresses. J. Plant Physiol. 2010, 167, 453–460. [Google Scholar] [CrossRef]
  39. Theil, E.C. FERRITIN: STRUCTURE, GENE REGULATION, AND CELLULAR FUNCTION IN ANIMALS, PLANTS, AND MICROORGANISMS. Annu. Rev. Biochem. 1987, 56, 289–315. [Google Scholar] [CrossRef]
  40. Briat, J.; Lobreaux, S. Iron transport and storage in plants. Trends Plant Sci. 1997, 2, 187–193. [Google Scholar] [CrossRef]
  41. Curie, C.; Briat, J.-F. Iron Transport and Signaling in Plants. Annu. Rev. Plant Biol. 2003, 54, 183–206. [Google Scholar] [CrossRef]
  42. Harrison, P.M.; Arosio, P. The ferritins: Molecular properties, iron storage function and cellular regulation. Biochim. Biophys. Acta Bioenerg. 1996, 1275, 161–203. [Google Scholar] [CrossRef] [PubMed] [Green Version]
  43. Theil, E.C.; Matzapetakis, M.; Liu, X. Ferritins: Iron/oxygen biominerals in protein nanocages. JBIC J. Biol. Inorg. Chem. 2006, 11, 803–810. [Google Scholar] [CrossRef] [PubMed]
  44. Gaymard, F.; Boucherez, J.; Briat, J.-F. Characterization of a ferritin mRNA from Arabidopsis thaliana accumulated in response to iron through an oxidative pathway independent of abscisic acid. Biochem. J. 1996, 318, 67–73. [Google Scholar] [CrossRef] [Green Version]
  45. Yadav, K.; Patel, P.; Srivastava, A.K.; Ganapathi, T.R. Overexpression of native ferritin gene MusaFer1 enhances iron content and oxidative stress tolerance in transgenic banana plants. PLoS ONE 2017, 12, e0188933. [Google Scholar] [CrossRef] [Green Version]
  46. Petit, J.-M.; Briat, J.-F.; Lobréaux, S. Structure and differential expression of the four members of the Arabidopsis thaliana ferritin gene family. Biochem. J. 2001, 359, 575–582. [Google Scholar] [CrossRef] [PubMed]
  47. Ravet, K.; Touraine, B.; Boucherez, J.; Briat, J.-F.; Gaymard, F.; Cellier, F. Ferritins control interaction between iron homeostasis and oxidative stress in Arabidopsis. Plant J. 2009, 57, 400–412. [Google Scholar] [CrossRef]
  48. Kim, J.-H.; Sedlak, M.; Gao, Q.; Riley, C.P.; Regnier, F.E.; Adamec, J. Oxidative Stress Studies in Yeast with a Frataxin Mutant: A Proteomics Perspective. J. Proteome Res. 2010, 9, 730–736. [Google Scholar] [CrossRef] [PubMed]
  49. Busi, M.V.; Maliandi, M.V.; Valdez, H.; Clemente, M.; Zabaleta, E.J.; Araya, A.; Gomez-Casati, D.F. Deficiency of Arabidopsis thaliana frataxin alters activity of mitochondrial Fe-S proteins and induces oxidative stress. Plant J. 2006, 48, 873–882. [Google Scholar] [CrossRef]
  50. Boyes, D.C.; Zayed, A.M.; Ascenzi, R.; McCaskill, A.J.; Hoffman, N.E.; Davis, K.R.; Görlach, J. Growth Stage-Based Phenotypic Analysis of Arabidopsis: A Model for High Throughput Functional Genomics in Plants. Plant Cell 2001, 13, 1499–1510. [Google Scholar] [CrossRef] [Green Version]
  51. Gautam, C.K.; Tsai, H.-H.; Schmidt, W. IRONMAN tunes responses to iron deficiency in concert with environmental pH. Plant Physiol. 2021, 187, 1728–1745. [Google Scholar] [CrossRef]
  52. Gautam, C.K.; Tsai, H.-H.; Schmidt, W. A Quick Method to Quantify Iron in Arabidopsis Seedlings Iron Transport in Plants View Project PH Sensing in Plants View Project. Bio. Protoc. 2022, 12, e4324. [Google Scholar] [CrossRef]
  53. Matamoros, M.A.; Kim, A.; Peñuelas, M.; Ihling, C.; Griesser, E.; Hoffmann, R.; Fedorova, M.; Frolov, A.; Becana, M. Protein Carbonylation and Glycation in Legume Nodules. Plant Physiol. 2018, 177, 1510–1528. [Google Scholar] [CrossRef] [Green Version]
  54. Rojas Echeverri, J.C.; Milkovska-Stamenova, S.; Hoffmann, R. A workflow towards the reproducible identification and quantitation of protein carbonylation sites in human plasma. Antioxidants 2021, 10, 369. [Google Scholar] [CrossRef] [PubMed]
  55. Chavez, J.; Wu, J.; Han, B.; Chung, W.-G.; Maier, C.S. New Role for an Old Probe: Affinity Labeling of Oxylipid Protein Conjugates by N‘-Aminooxymethylcarbonylhydrazino d-biotin. Anal. Chem. 2006, 78, 6847–6854. [Google Scholar] [CrossRef] [PubMed]
  56. Bollineni, R.C.; Hoffmann, R.; Fedorova, M. Proteome-wide profiling of carbonylated proteins and carbonylation sites in HeLa cells under mild oxidative stress conditions. Free. Radic. Biol. Med. 2014, 68, 186–195. [Google Scholar] [CrossRef] [PubMed]
  57. Müller, M.; Schmidt, W. Environmentally Induced Plasticity of Root Hair Development in Arabidopsis. Plant Physiol. 2004, 134, 409–419. [Google Scholar] [CrossRef] [Green Version]
  58. Chen, J.-G.; Ullah, H.; Temple, B.; Liang, J.; Guo, J.; Alonso, J.M.; Ecker, J.R.; Jones, A.M. RACK1 mediates multiple hormone responsiveness and developmental processes in Arabidopsis. J. Exp. Bot. 2006, 57, 2697–2708. [Google Scholar] [CrossRef] [Green Version]
  59. Guo, J.; Wang, J.; Xi, L.; Huang, W.-D.; Liang, J.; Chen, J.-G. RACK1 is a negative regulator of ABA responses in Arabidopsis. J. Exp. Bot. 2009, 60, 3819–3833. [Google Scholar] [CrossRef] [Green Version]
  60. Ge, S.; Jung, D.; Yao, R. ShinyGO: A Graphical Gene-Set Enrichment Tool for Animals and Plants. Bioinformatics 2020, 36, 2628–2629. [Google Scholar] [CrossRef]
  61. Hooper, C.M.; Castleden, I.R.; Tanz, S.; Aryamanesh, N.; Millar, A.H. SUBA4: The interactive data analysis centre for Arabidopsis subcellular protein locations. Nucleic Acids Res. 2017, 45, D1064–D1074. [Google Scholar] [CrossRef] [PubMed] [Green Version]
  62. Johansson, E.; Olsson, O.; Nyström, T. Progression and Specificity of Protein Oxidation in the Life Cycle of Arabidopsis thaliana. J. Biol. Chem. 2004, 279, 22204–22208. [Google Scholar] [CrossRef] [PubMed] [Green Version]
  63. Xiong, Y.; Contento, A.L.; Bassham, D.C. Disruption of Autophagy Results in Constitutive Oxidative Stress in Arabidopsis. Autophagy 2007, 3, 257–258. [Google Scholar] [CrossRef] [PubMed] [Green Version]
  64. Reyt, G.; Boudouf, S.; Boucherez, J.; Gaymard, F.; Briat, J.-F. Iron- and Ferritin-Dependent Reactive Oxygen Species Distribution: Impact on Arabidopsis Root System Architecture. Mol. Plant 2015, 8, 439–453. [Google Scholar] [CrossRef] [Green Version]
  65. Briat, J.-F.; Duc, C.; Ravet, K.; Gaymard, F. Ferritins and iron storage in plants. Biochim. Biophys. Acta Gen. Subj. 2010, 1800, 806–814. [Google Scholar] [CrossRef]
  66. Tissot, N.; Robe, K.; Gao, F.; Grant-Grant, S.; Boucherez, J.; Bellegarde, F.; Maghiaoui, A.; Marcelin, R.; Izquierdo, E.; Benhamed, M.; et al. Transcriptional integration of the responses to iron availability in Arabidopsis by the bHLH factor ILR3. New Phytol. 2019, 223, 1433–1446. [Google Scholar] [CrossRef]
  67. Fodor, E.; Szabó-Nagy, A.; Erdei, L. The Effects of Cadmium on the Fluidity and H+-ATPase Activity of Plasma Membrane from Sunflower and Wheat Roots. J. Plant Physiol. 1995, 147, 87–92. [Google Scholar] [CrossRef]
  68. Schaller, G.E.; Sussman, M.R. Phosphorylation of the plasma-membrane H+-ATPase of oat roots by a calcium-stimulated protein kinase. Planta 1988, 173, 509–518. [Google Scholar] [CrossRef]
  69. Portillo, F. Regulation of plasma membrane H+-ATPase in fungi and plants. Biochim. et Biophys. Acta (BBA) - Rev. Biomembr. 2000, 1469, 31–42. [Google Scholar] [CrossRef]
  70. Wang, J.; Lan, P.; Gao, H.; Zheng, L.; Li, W.; Schmidt, W. Expression changes of ribosomal proteins in phosphate- and iron-deficient Arabidopsis roots predict stress-specific alterations in ribosome composition. BMC Genom. 2013, 14, 783. [Google Scholar] [CrossRef] [Green Version]
  71. Gallo, S.; Ricciardi, S.; Manfrini, N.; Pesce, E.; Oliveto, S.; Calamita, P.; Mancino, M.; Maffioli, E.; Moro, M.; Crosti, M.; et al. RACK1 Specifically Regulates Translation through Its Binding to Ribosomes. Mol. Cell. Biol. 2018, 38, e00230-18. [Google Scholar] [CrossRef] [Green Version]
  72. Guo, J.; Wang, S.; Valerius, O.; Hall, H.; Zeng, Q.; Li, J.-F.; Weston, D.J.; Ellis, B.E.; Chen, J.-G. Involvement of Arabidopsis RACK1 in Protein Translation and Its Regulation by Abscisic Acid. Plant Physiol. 2011, 155, 370–383. [Google Scholar] [CrossRef] [Green Version]
  73. Romero, A.M.; Ramos-Alonso, L.; Alepuz, P.; Puig, S.; Martínez-Pastor, M.T. Global translational repression induced by iron deficiency in yeast depends on the Gcn2/eIF2α pathway. Sci. Rep. 2020, 10, 233. [Google Scholar] [CrossRef] [Green Version]
  74. Long, T.A.; Tsukagoshi, H.; Busch, W.; Lahner, B.; Salt, D.E.; Benfey, P.N. The bHLH Transcription Factor POPEYE Regulates Response to Iron Deficiency in Arabidopsis Roots. Plant Cell 2010, 22, 2219–2236. [Google Scholar] [CrossRef] [Green Version]
  75. Selote, D.; Samira, R.; Matthiadis, A.; Gillikin, J.W.; Long, T.A. Iron-Binding E3 Ligase Mediates Iron Response in Plants by Targeting Basic Helix-Loop-Helix Transcription Factors. Plant Physiol. 2015, 167, 273–286. [Google Scholar] [CrossRef] [PubMed] [Green Version]
  76. Selote, D.; Matthiadis, A.; Gillikin, J.W.; Sato, M.H.; Long, T.A. The E3 ligase BRUTUS facilitates degradation of VOZ1/2 transcription factors. Plant Cell Environ. 2018, 41, 2463–2474. [Google Scholar] [CrossRef] [PubMed]
  77. Rodríguez-García, A.; Morales, M.L.; Garrido-García, V.; García-Baquero, I.; Leivas, A.; Carreño-Tarragona, G.; Sánchez, R.; Arenas, A.; Cedena, T.; Ayala, R.M.; et al. Protein Carbonylation in Patients with Myelodysplastic Syndrome: An Opportunity for Deferasirox Therapy. Antioxidants 2019, 8, 508. [Google Scholar] [CrossRef] [PubMed] [Green Version]
  78. Zhao, J.; Missihoun, T.D.; Bartels, D. The role of Arabidopsis aldehyde dehydrogenase genes in response to high temperature and stress combinations. J. Exp. Bot. 2017, 68, 4295–4308. [Google Scholar] [CrossRef] [PubMed] [Green Version]
  79. Hindt, M.N.; Akmakjian, G.Z.; Pivarski, K.L.; Punshon, T.; Baxter, I.; Salt, D.E.; Guerinot, M.L. BRUTUS and its paralogs, BTS LIKE1 and BTS LIKE2, encode important negative regulators of the iron deficiency response in Arabidopsis thaliana. Metallomics 2017, 9, 876–890. [Google Scholar] [CrossRef]
  80. Li, Z.-G. Measurement of Signaling Molecules Calcium Ion, Reactive Sulfur Species, Reactive Carbonyl Species, Reactive Nitrogen Species, and Reactive Oxygen Species in Plants. Plant Signal. Mol. Role Regul. Under Stress. Environ. 2019, 83–103. [Google Scholar] [CrossRef]
  81. Brumbarova, T.; Bauer, P.; Ivanov, R. Molecular mechanisms governing Arabidopsis iron uptake. Trends Plant Sci. 2015, 20, 124–133. [Google Scholar] [CrossRef] [PubMed]
  82. Zhang, Y.; Ji, T.-T.; Li, T.-T.; Tian, Y.-Y.; Wang, L.-F.; Liu, W.-C. Jasmonic acid promotes leaf senescence through MYC2-mediated repression of CATALASE2 expression in Arabidopsis. Plant Sci. 2020, 299, 110604. [Google Scholar] [CrossRef] [PubMed]
  83. Sun, W.; Zhang, J.; Ji, X.; Feng, Z.; Wang, X.; Huang, W.; You, C.; Wang, X.; Hao, Y. Low nitrate alleviates iron deficiency by regulating iron homeostasis in apple. Plant, Cell Environ. 2021, 44, 1869–1884. [Google Scholar] [CrossRef]
  84. Tewari, R.K.; Hadacek, F.; Sassmann, S.; Lang, I. Iron deprivation-induced reactive oxygen species generation leads to non-autolytic PCD in Brassica napus leaves. Environ. Exp. Bot. 2013, 91, 74–83. [Google Scholar] [CrossRef] [PubMed] [Green Version]
  85. Kumar, D.; Yusuf, M.; Singh, P.; Sardar, M.; Sarin, N. Histochemical Detection of Superoxide and H2O2 Accumulation in Brassica juncea Seedlings. Bio-Protocol 2014, 8, e1108. [Google Scholar] [CrossRef]
  86. Heath, R.L.; Packer, L. Photoperoxidation in isolated chloroplasts. Arch. Biochem. Biophys. 1968, 125, 189–198. [Google Scholar] [CrossRef] [PubMed]
  87. Ali, M.B.; Hahn, E.-J.; Paek, K.-Y. Effects of temperature on oxidative stress defense systems, lipid peroxidation and lipoxygenase activity in Phalaenopsis. Plant Physiol. Biochem. 2005, 43, 213–223. [Google Scholar] [CrossRef]
  88. Chen, T.; Zhang, B. Measurements of Proline and Malondialdehyde Content and Antioxidant Enzyme Activities in Leaves of Drought Stressed Cotton. Bio-Protocol 2016, 6, e1913. [Google Scholar] [CrossRef] [Green Version]
  89. Bradford, M.M. A rapid and sensitive method for the quantitation of microgram quantities of protein utilizing the principle of protein-dye binding. Anal. Biochem. 1976, 72, 248–254. [Google Scholar] [CrossRef]
  90. Tamarit, J.; de Hoogh, A.; Obis, E.; Alsina, D.; Cabiscol, E.; Ros, J. Analysis of oxidative stress-induced protein carbonylation using fluorescent hydrazides. J. Proteom. 2012, 75, 3778–3788. [Google Scholar] [CrossRef]
  91. Fangue-Yapseu, G.Y.; Tola, A.J.; Missihoun, T.D. Proteome-wide analysis of hydrogen peroxide-induced protein carbonylation in Arabidopsis thaliana. Front. Plant Sci. 2022, 13, 4999. [Google Scholar] [CrossRef] [PubMed]
  92. Tola, A.J.; Missihoun, T.D. Ammonium sulfate-based prefractionation improved proteome coverage and detection of carbonylated proteins in Arabidopsis thaliana leaf extract. Planta 2023, 257, 1–19. [Google Scholar] [CrossRef] [PubMed]
Figure 1. The dynamics of the protein carbonylation in the leaves of the wild-type (WT) plants and of the ferritin-mutant plants Fer-1-3-4 over their growth period. Proteins were extracted from leaf tissues sampled from soil-grown WT and triple-ferritin-mutant Fer-1-3-4 plants over 42 days (6 weeks) after seed stratification. (a) A representative gel picture of carbonylated proteins. Ten micrograms of proteins were labeled with a fluorescent hydrazide probe (Cy5.5-Hz) specific to the carbonylated proteins and then analyzed on 12.5% SDS-PAGE. Upper gel: Cy5.5-Hz fluorescence for the carbonylated proteins; lower gel: AzureRed fluorescence for the total proteins. Mr designates the protein molecular weight marker. (b) The abundance of carbonylated proteins based on their relative fluorescence. The quantification was based on the gel pictures shown in (a). The fluorescence intensity for the carbonylated proteins in each lane of the gel was normalized with the AzureRed fluorescence intensity in the same lane. The experiments were performed in biological triplicate, and the data points show the mean values ± standard error (n = 3) and an asterisk (*) indicates a significant difference between the two genotypes (multiple t-test with Bonferroni–Dunn correction; adjusted p < 0.05) (c) The iron content in the seedlings and leaves of adult plants. The data represent the mean ± SE (n = 3) of three independent experiments. An asterisk (*) indicates a significant difference between the two genotypes (multiple t-test with Bonferroni–Dunn correction; adjusted p < 0.05). DW denotes Dry weight. See Figure S1 in the supplementary file for replicates of Figure 1a,b.
Ijms 24 09732 g001
Figure 2. Protein carbonylation in the different organs of the wild-type (WT) plants and of the ferritin mutant plants Fer-1-3-4. The proteins were extracted from the leaves, stems, and flowers of six-week-old soil-grown WT and triple-ferritin-mutant Fer-1-3-4 plants. The carbonylated proteins in the WT sample and the Fer-1-3-4 samples were labeled with the fluorescent hydrazide probes Cy5.5-Hz (green fluorescence) and Cy7.5-Hz (red fluorescence, pseudocolor), respectively. The samples were then analyzed on 12.5% SDS-PAGE. (a) Each lane contains 10 µg proteins. W: WT sample; F: Fer-1-3-4 sample; W + F: mixture of equal amounts of WT and Fer-1-3-4 sample. Upper gel: Cy5.5-Hz and Cy7.5-Hz fluorescence for the carbonylated proteins; lower gel: AzureRed fluorescence for the total proteins. Mr designates the protein molecular weight marker. (b) The abundance of carbonylated proteins based on their relative fluorescence intensity. The plotted values were obtained as described in Figure 1. The experiments were performed in biological triplicate, and the data points show the mean values ± standard error (n = 3) and an asterisk (*) indicates a significant difference between the two genotypes (multiple t-test with Bonferroni–Dunn correction; adjusted p < 0.05) (c) The iron content in the leaves, stems, and flowers. The data represent the mean ± SE (n = 3) of three independent experiments. An asterisk (*) indicates a significant difference between the two genotypes (multiple t-test with Bonferroni–Dunn correction; adjusted p < 0.05). DW denotes Dry weight. See Figure S2 in the supplementary file for replicates of Figure 2a,b.
Ijms 24 09732 g002
Figure 3. Protein carbonylation in the wild-type and Fer-1-3-4 mutant under heat stress. The proteins were extracted from the wild-type (WT) and Fer-1-3-4 mutant plants germinated on 1/2 MS-agar plates for 10 days. The seedlings were then exposed to a high temperature (38 °C) in the dark for 1, 3, and 6 h. The control (C) plants were kept in the growth chamber at 22 °C. After the heat treatment, the plants were returned to the growth chamber at 22 °C for 2 h before sampling. (a) The carbonylated proteins in the control sample and the heat-treated plant samples were labeled with fluorescent hydrazide probes Cy5.5-Hz (red fluorescence, pseudocolor) and Cy7.5-Hz (green fluorescence), respectively. The samples were then analyzed on 12.5% SDS-PAGE, either alone or mixed in equal amounts. Each lane contains 10 µg of proteins. Upper gels: Cy5.5-Hz and Cy7.5-Hz fluorescence for the carbonylated proteins; lower gels: AzureRed fluorescence for the total proteins. Mr designates the protein molecular weight marker. (b) The abundance of carbonylated proteins based on their relative fluorescence intensity (% of control). The plotted values were obtained as described in Figure 1. The experiments were performed in biological triplicate, and the data points show the mean values ± standard error (n = 3). An asterisk (*) indicates a significant difference between the control and heat stress treatment in the two genotypes (one-way ANOVA, followed by Tukey’s test p < 0.05). See Figures S3 and S4 in the supplementary file for replicates of Figure 3a.
Ijms 24 09732 g003
Figure 4. Protein carbonylation of the wild type and Fer-1-3-4 mutant under excess iron and iron-deficient conditions. The proteins were extracted from the wild type (WT) and Fer-1-3-4 mutant, which were grown on half MS-agar plates. (a) Ten days-old seedlings were transferred into a liquid MS medium supplemented with 500 µM ferric-EDTA (+Fe) for 24, 48 and 72 h. The control treatment designated by the letter C was carried out in the liquid medium without iron supplementation. The carbonylated proteins were labeled with the fluorescent hydrazide probes Cy5.5-Hz (green fluorescence), and the staining of the total proteins was carried out with AzureRed. (b) Exposure to excess-iron conditions. The WT and ferritin triple mutant (Fer-1-3-4) plants were grown on solid half-MS agar plates supplemented with 100 mM Fe-EDTA for 10 days. The letter (c) indicates the control sample from the plants grown on only solid half-MS agar without iron supplementation; the carbonylated proteins were labeled with Cy5.5-Hz. (+Fe), excess-iron treatment; the proteins were labeled with Cy7.5-Hz. (Mixed), a mixture of 5 µg of control sample labeled with Cy5.5-Hz and 5 µg of iron-treatment sample labeled with Cy7.5 hydrazide. (c) Iron deficiency treatment. The WT and ferritin triple mutant (Fer-1-3-4) plants were grown on a solid half-MS agar plate, as described in B. For iron deficiency treatment, the medium was supplemented with 300 mM of ferrozine. Each lane contains 10 µg proteins, and the staining of the total proteins was carried out with AzureRed in all the experiments. The letter (c) indicates the control sample from the plants grown on only solid half-MS agar without iron treatment; the carbonylated proteins were labeled with Cy5.5-Hz. (−Fe), iron deficiency treatment; the proteins were labeled with Cy7.5-Hz. (Mixed), a mixture of 5 µg of control sample labeled with Cy5.5-Hz and 5 µg of iron-treatment sample labeled with Cy7.5 hydrazide. Mr designates the protein molecular weight marker. (d,e) The abundance of carbonylated proteins based on their relative fluorescence intensity (% of control). The plotted values were obtained as described in Figure 4b,c, respectively. The experiments were performed in biological triplicate; the data points show the mean values ± standard error (n = 3), and an asterisk (*) indicates a significant difference between the control and iron stress treatment in the two genotypes (Student’s t-test; p < 0.05). (f) Iron content in the two genotypes under excess iron and iron deficiency treatments. The data represent the mean ± SE (n = 3) of three independent experiments. An asterisk (*) indicates a significant difference between the two genotypes (one-way ANOVA, followed by Tukey test; p < 0.05). DW denotes Dry weight. See Figures S5–S7 in the supplementary file for replicates of Figure 4a–c, respectively.
Ijms 24 09732 g004aIjms 24 09732 g004b
Figure 5. Levels of H2O2, MDA, and the antioxidant enzyme activity in the seedlings kept under excess-iron and iron-deficient conditions. The growth of the seedlings and the treatments were performed as described in Figure 4. (a) Hydrogen peroxide (H2O2) accumulation. (b) Lipid peroxidation level measured in terms of MDA using the TBAR method. (c,d) The measurements of SOD and CAT activity using spectrophotometry methods, respectively. Superoxide dismutase (SOD) and catalase (CAT) activity were measured on the protein extracts taken from the Arabidopsis wild type (WT) and Fer-1-3-4 mutant seedlings exposed to excess iron (+Fe) or iron-deficient (−Fe) conditions for 10 days, as described above. The experiments were performed in biological triplicate, and the data points show the mean values ± standard error (n = 3). Asterisks (*) indicate significantly different values at p < 0.005, one-way ANOVA, and Tukey’s post hoc test. FW denotes fresh weight. See Figure S8 in the supplementary file for supporting evidence for Figure 5a.
Ijms 24 09732 g005
Figure 6. Workflow of the analysis of the carbonylated proteins via LC-MS/MS. The soluble protein extracts of the seedlings were reduced, alkylated, and digested with trypsin. To identify the carbonylated peptides, the peptides from the tryptic digestion were labeled with an aldehyde-reactive probe (ARP) for 2 h. ARP is a biotinylated hydroxylamine derivative, N′-aminooxy-methylcarbonylhydrazino-D-biotin, selectively used for the derivatization, enrichment, and mass spectrometric characterization of carbonylated proteins [55]. The hydroxylamine group of an ARP specifically forms aldoxime/ketoxime derivatives with the aldehyde and/or keto group that allows selective detection and enrichment via affinity chromatography [53,56]. Excess ARP or unbounded ARP was removed through solid phase extraction, and the ARP-derivatized peptides were enriched via biotin-avidin-based affinity chromatography, as described in the Materials and Methods section. The eluted ARP-labeled peptides were desalted and then subjected to LC-MS/MS analysis. Created with BioRender.com.
Ijms 24 09732 g006
Figure 7. A Venn diagram of the carbonylated proteins identified in the samples derived from the control plants and the plants subjected to iron deficiency. The diagram was generated from only the carbonylated proteins identified in all three biological replicates of each group.
Ijms 24 09732 g007
Figure 8. Gene ontology enrichment analysis. The bubble chart of the top 20 Gene Ontology (GO)-terms represented by the carbonylated proteins in the control plant samples and in the samples of the plants subjected to iron deficiency was generated using the ShinyGO web-based bioinformatics resource. The analysis was performed only on the carbonylated proteins identified in all three biological replicates of each treatment. (A,B) biological processes. (C,D) molecular function. The Y-axis represents the GO terms while the X-axis indicates the value of fold enrichment.
Ijms 24 09732 g008
Figure 9. Iron prominently induced protein carbonylation in the cytoplasm. The subcellular localization of the carbonylated proteins in the control samples and the Fe-treated samples was predicted by using the Subcellular Proteomic Database, SUBA.
Ijms 24 09732 g009
Table 1. List of selected carbonylated proteins specifically identified in the control samples.
SNProtein NameAccession NumberTAIR Gene CodeMolecular Mass (kDa)Peptide NumberLocalizationFunctional Category
1Catalase 3B9DG18 AT1G206205612PeroxisomeROS scavenging/stress defense response/Antioxidant enzymes
2Monodehydroascorbate reductase 1Q9LFA3AT3G52880467Peroxisome
3Thioredoxin superfamily proteinF4JBC9AT3G26060247Chloroplast
4NAD(P)H dehydrogenase (quinone) FQR1 Q9LSQ5AT5G54500222Chloroplast
5Alcohol dehydrogenase class-3 Q96533AT5G439404110Cytosol
6V-type proton ATPase subunit B1 P11574 AT1G76030549Plasma membraneIon channel transport
7V-type proton ATPase subunit CQ9SDS7AT1G12840434Plasma membrane
8Heat shock 70 kDa protein 9Q8GUM2AT4G37910736MitochondriaProtein folding
9Chaperonin 60 subunit beta 1P21240AT1G554906415Chloroplast
10Peptidyl-prolyl cis-trans isomerase CYP18-4 Q42406AT4G34870189Cytosol
11Ferredoxin--nitrite reductaseQ39161AT2G15620666ChloroplastNitrate assimilation/Nitrogen metabolism
12Glutamate synthase 1 [NADH]Q9LV03AT5G5346024211ChloroplastAmino acid metabolism
13Aspartate aminotransferaseP46643AT2G30970487Mitochondria
14Glutamate dehydrogenase 1 Q43314AT5G18170455Chloroplast
15Cysteine synthaseP47999AT2G43750427Chloroplast
16Imidazole glycerol phosphate synthase hisHFQ9SZ30AT4G26900646Chloroplast
17Phosphoglycerate kinase 3Q9SAJ4AT1G795504210CytosolCarbohydrate metabolism/Calvin cycle/
18Glucose-6-phosphate 1-dehydrogenaseA0A1I9LLZ6 AT3G27300673Cytosol
19Fructose-bisphosphate aldolase 6Q9SJQ9AT2G36460385Cytosol
20Triosephosphate isomeraseQ9SKP6AT2G21170338Chloroplast
21Malate dehydrogenase 1Q9ZP06AT1G53240367MitochondriaTCA cycle/Energy metabolism
22Adenylyl cyclase-associated protein A0A1P8B7W9 AT4G34490583ChloroplastSignalling
23Metacaspase-4 O64517AT1G79340452CytosolPlant defense
24Biotin carboxylase F4JYE0 AT5G35360619ChloroplastFatty acid metabolism
25Formate dehydrogenaseA0A1P8B9L1AT5G14780414Mitochondria
Table 2. List of carbonylated proteins identified in the iron-deficient samples only.
SNProtein NameAccession NumberTAIR Gene CodeMolecular Mass (kDa)Peptide NumberLocalizationFunctional Category
1Receptor for activated C kinase 1 (RACK1)O24456AT1G18080368CytosolSignal transduction
260S Ribosomal protein L15-1 (RPL15)O23515 AT4G16720244RibosomeTranslation
350S Ribosomal protein L5 (RPL5)O04603AT4G01310286RibosomeTranslation
4Nitrilase 1 (NIT1)P32961AT3G44310386CytosolIndole acetic acid biosynthesis process
5Subtilisin-like protease (SBT1)Q9LVJ1AT3G14067822CytosolProteolysis
6Plasma membrane ATPase (HA2)F4JPJ7 AT4G301901084Plasma membraneProton (H+) transmembrane transport
730S Ribosomal protein S2 (RPS2)P56797ATCG00160274RibosomeTranslation
8NADPH-protochlorophyllide oxidoreductase (POR)F4I2F8 AT1G03630442ChloroplastChlorophyll biosynthesis
Table 3. List of selected carbonylated proteins identified both in the control samples and iron-deficient samples.
SNProtein NameAccession NumberTair Gene CodeMolecular Mass (kDa)Peptide NumberFunctional Category
1Ascorbate peroxidaseF4HU93AT5G0250028 9Stress defense response/Antioxidant enzymes
2Peroxidase 32Q9LHB9AT3G3298039 7
3Monodehyroascorbate reductase 6F41576AT1G6394052 14
4Selenium binding protein 2Q93WNOAT4G1404054 6Metal-binding proteins
5Magnesium chelatase subunite ChII-2Q5XF33AT5G4593046 3
6Glutamate--glyoxylate aminotransferase 1Q9LR30AT1G2331053 18Glyoxylate metabolism
7Oxalate--CoA ligaseQ9SMT7AT3G4899056 7
8TransketolaseF4JBY2AT3G6075080 19Carbohydrate/Energy metabolism
9Pyruvate kinaseQ94KE3AT3G5299057 7
10Sedoheptulose-1,7-bisphosphataseP46283AT3G5580042 10
11Glucose-1-phosphate aldenyltransferase large subunit 1P55229AT5G1922058 10
12PhosphoribulokinaseP25697AT1G3206044 9
13Cytosolic isocitrate dehydrogenase [NADP] Q9SRZ6AT1G6593046 17
14Ferrodoxin-dependent glutamate synthase 1Q9ZNZ7AT5G04140177 19Nitrogen–carbon metabolism
15Nitrile specifier proteinQ9SDM9AT3G1640052 16
16Glutamate-1-semialdehyde-2-aminomutase 1P42799AT5G6357050 7
17Glutamine synthetaseQ43127AT3G5580047 12
18S-adenoyl-L-methionine-dependent methyltrnsferaseAOA1P8B3H0AT4G3405032 4Amino acid metabolism
19S-adenoylmethionine synthase 4Q9LUT2AT5G2072043 10
20Serine hydroxymethyltransferase 1Q9SZJ5AT4G3793057 10
21Glycine dehydrogenase (decarboxylating) 1Q94B78AT4G33010113 17
22Chaperonin 60 subunit alpha 1P21238AT3G092606217Protein folding
23PYK10-binding protein 1 O04314AT4G148803210
24Elongation factor TuP17745AT4G203605211Translation/Protein synthesis
25Elongation factor GQ9SI75AT1G62750869
26Tubulin alpha-2 chain B9DGT7 AT1G500105012Cytoskeleton organization
27Actin-7 P53492AT5G09810427
Disclaimer/Publisher’s Note: The statements, opinions and data contained in all publications are solely those of the individual author(s) and contributor(s) and not of MDPI and/or the editor(s). MDPI and/or the editor(s) disclaim responsibility for any injury to people or property resulting from any ideas, methods, instructions or products referred to in the content.

