
Chronic Exposure to Chlorpyrifos Damages Thyroid Activity and Imbalances Hepatic Thyroid Hormones Signaling and Glucose Metabolism: Dependency of T3-FOXO1 Axis by Hyperglycemia


 ,
, 
 , and
, and 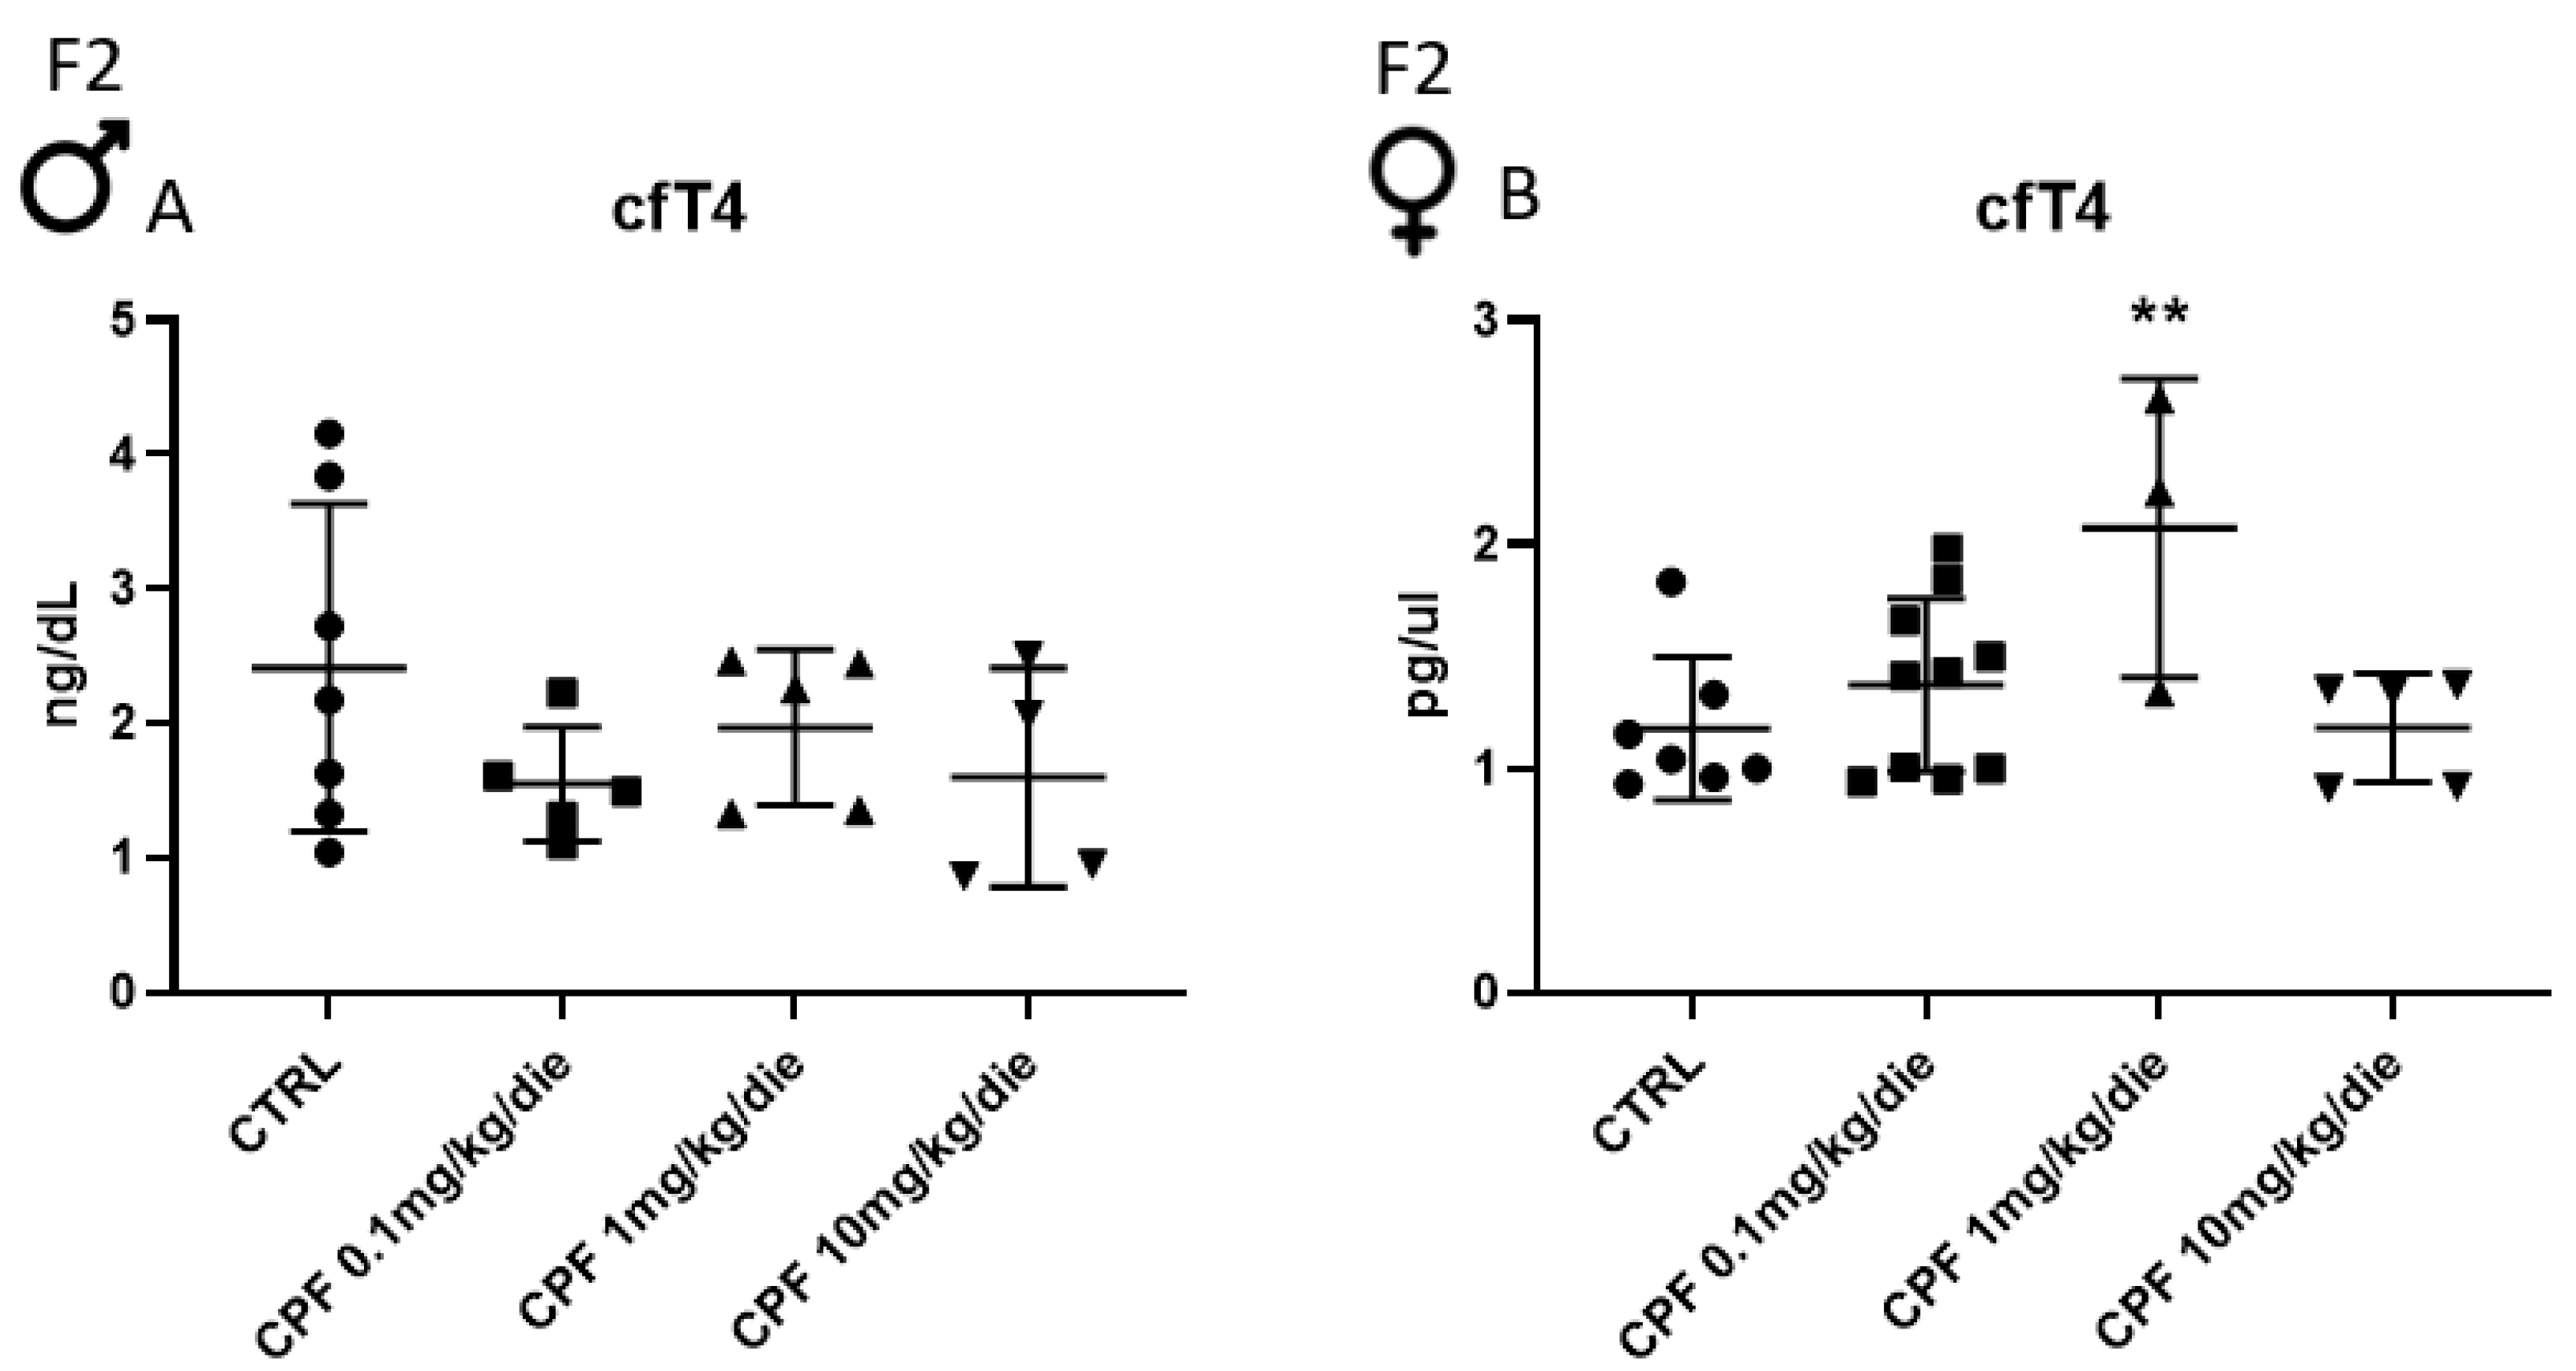
Abstract
1. Introduction
2. Results
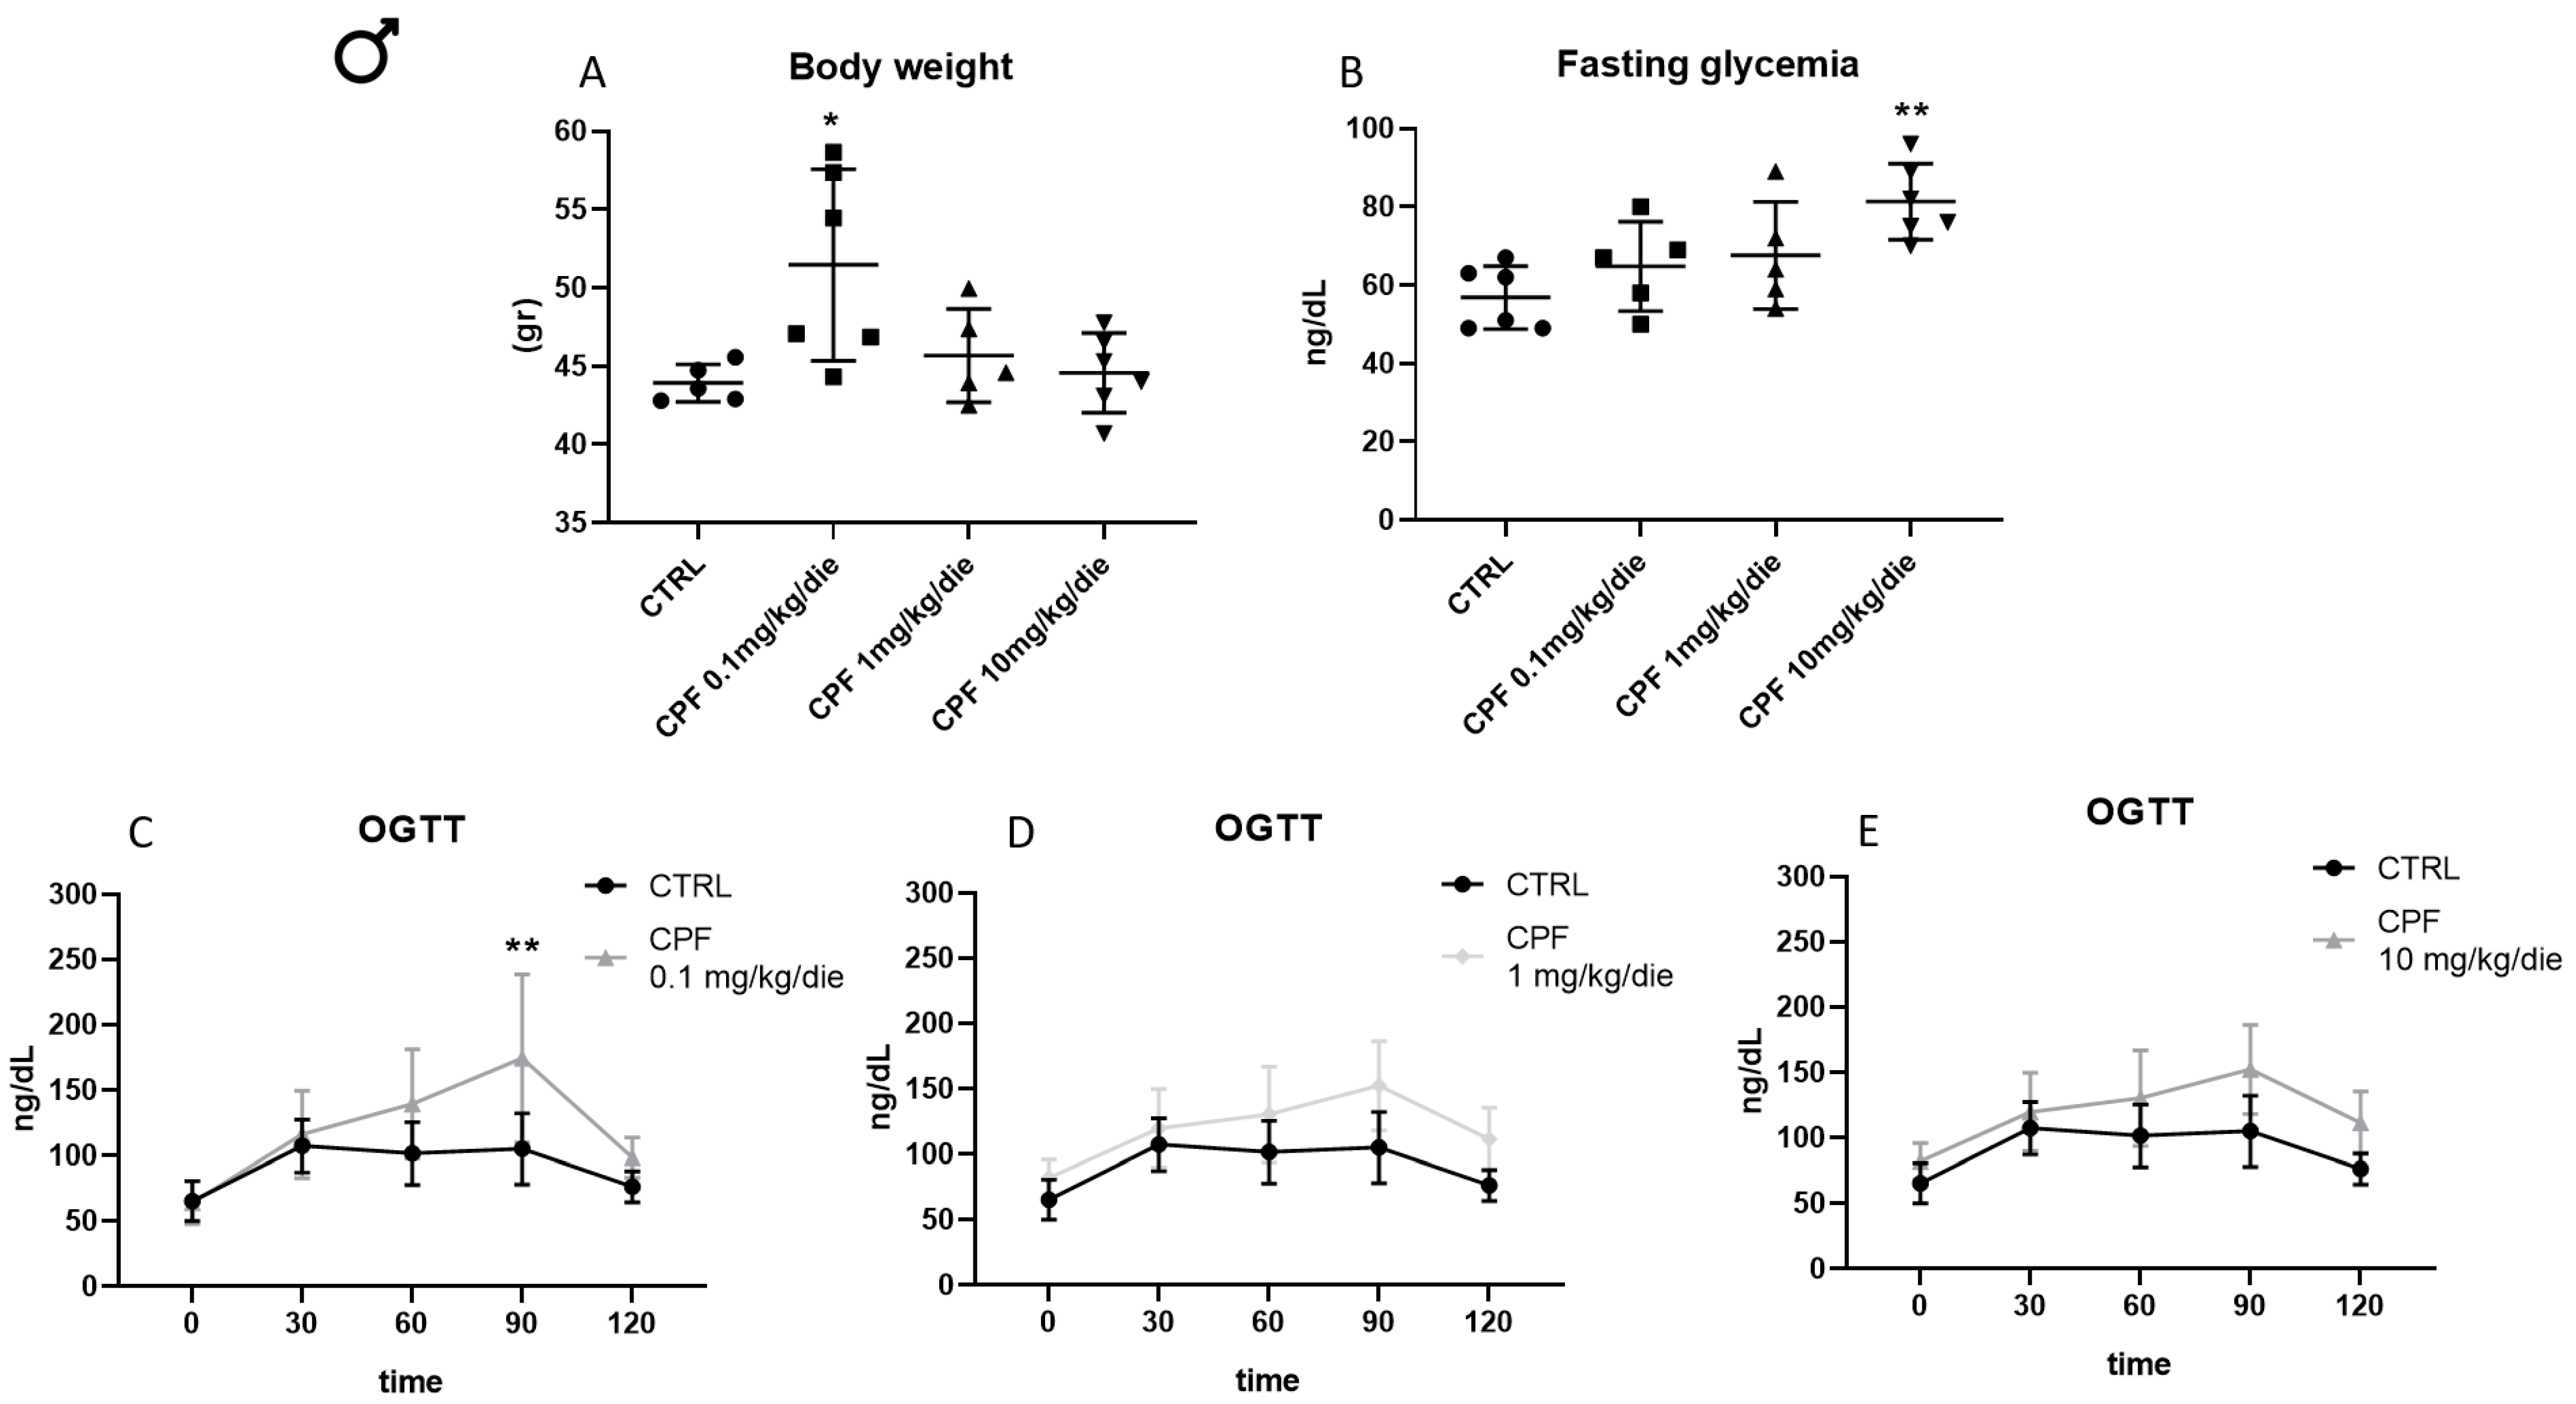
2.1. Developmental and 6-Month Exposure to CPF of Offspring of Dams Similarly Exposed Impair Thyroid and Metabolic Health Only of the Former in Sex-Dependent Manner
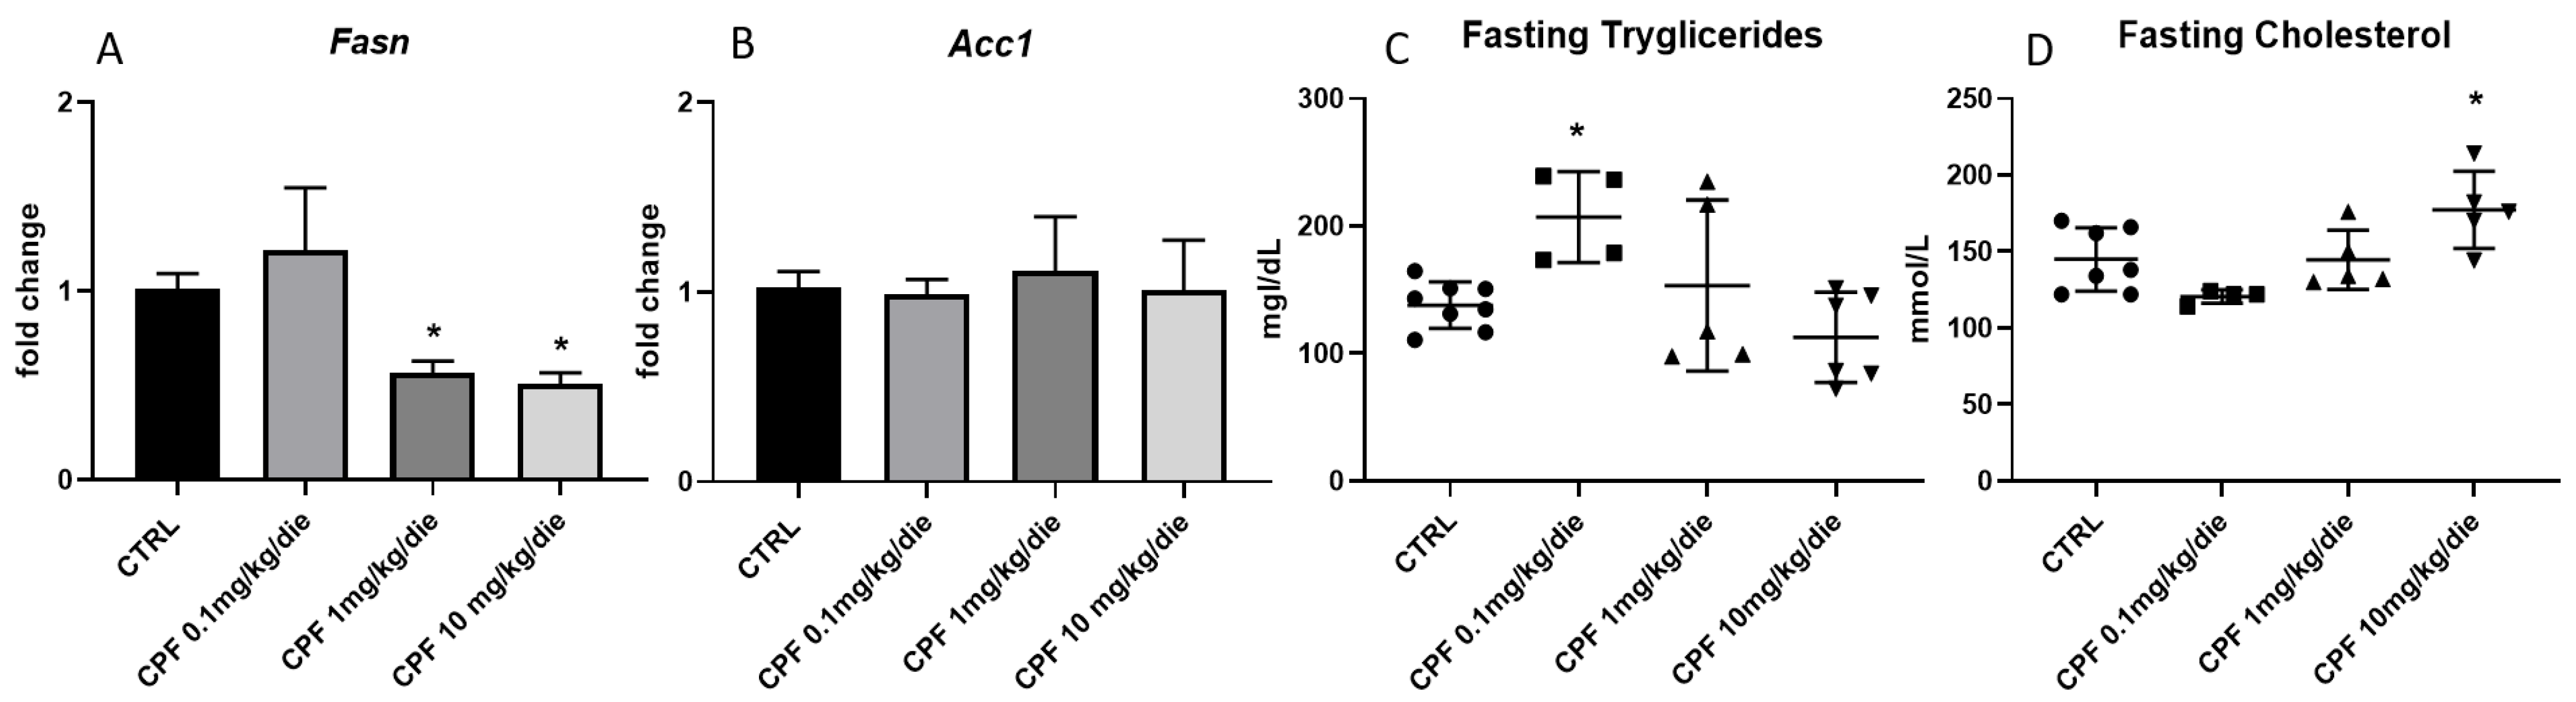
2.2. CPF Weakly Affects Hepatic Lipid Metabolism in Hypothyroid-Exposed F2 Mice Males
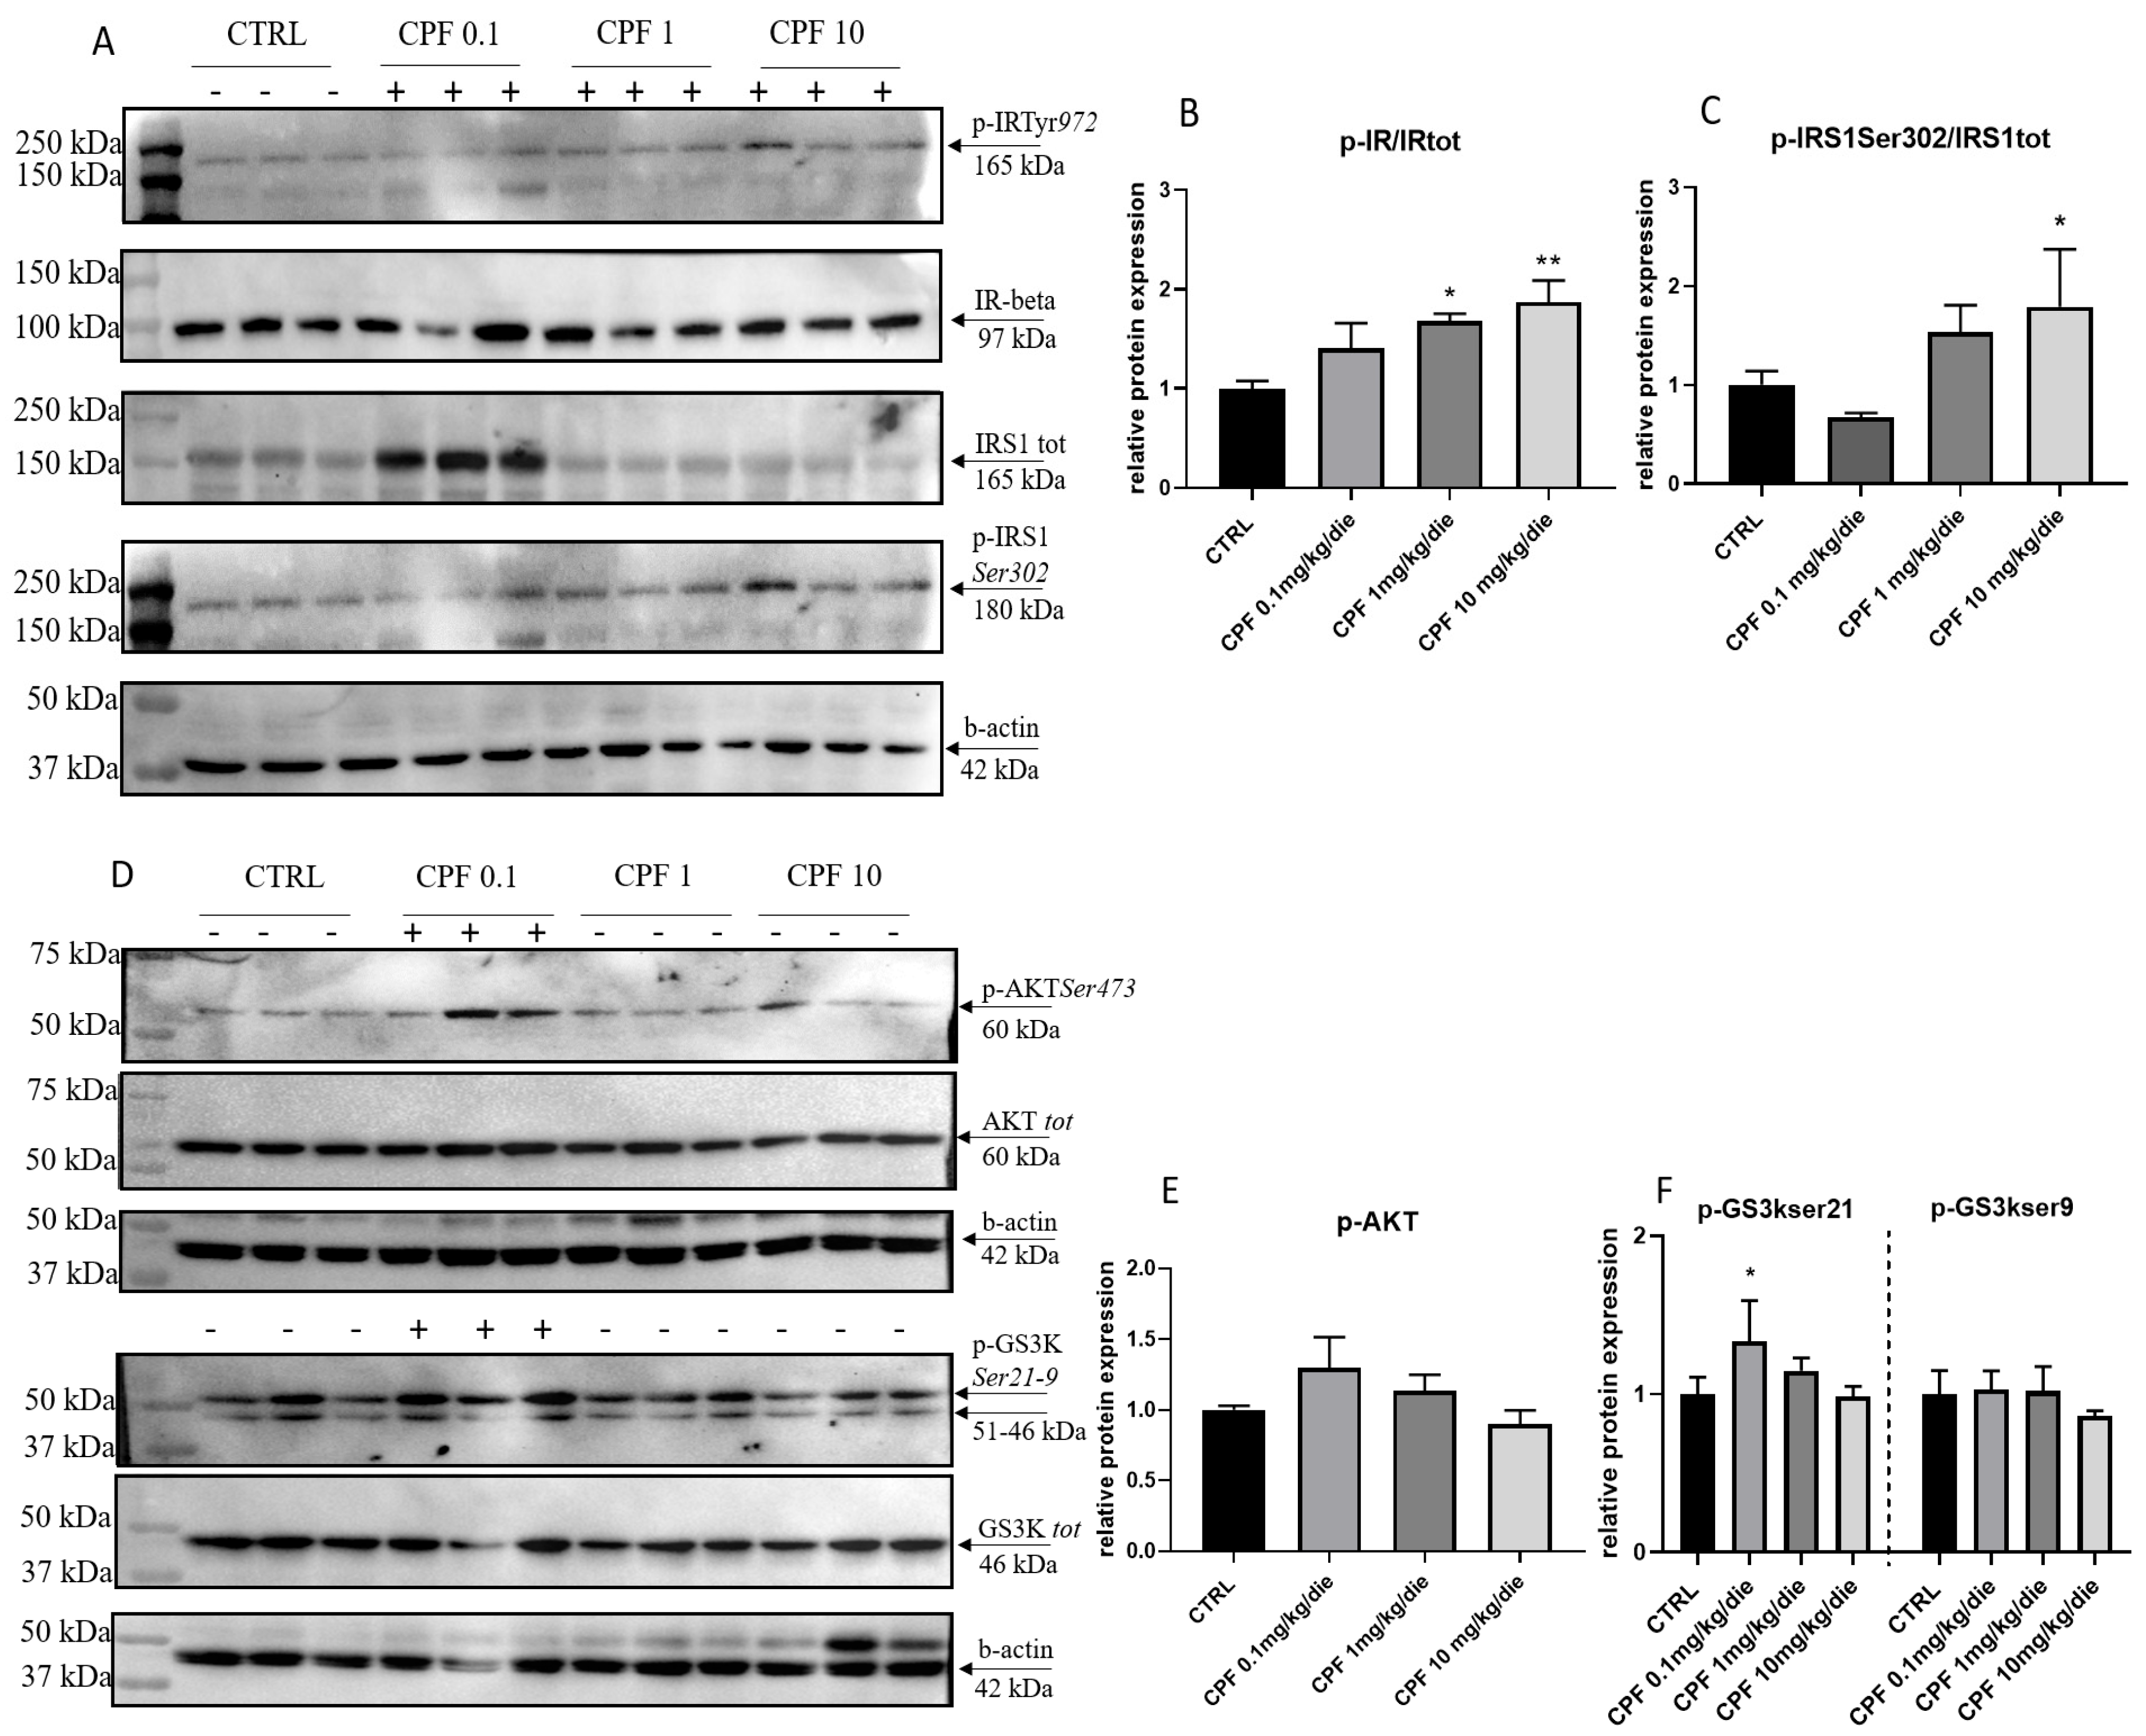
2.3. CPF Alters the Insulin Response in Exposed F2 Livers
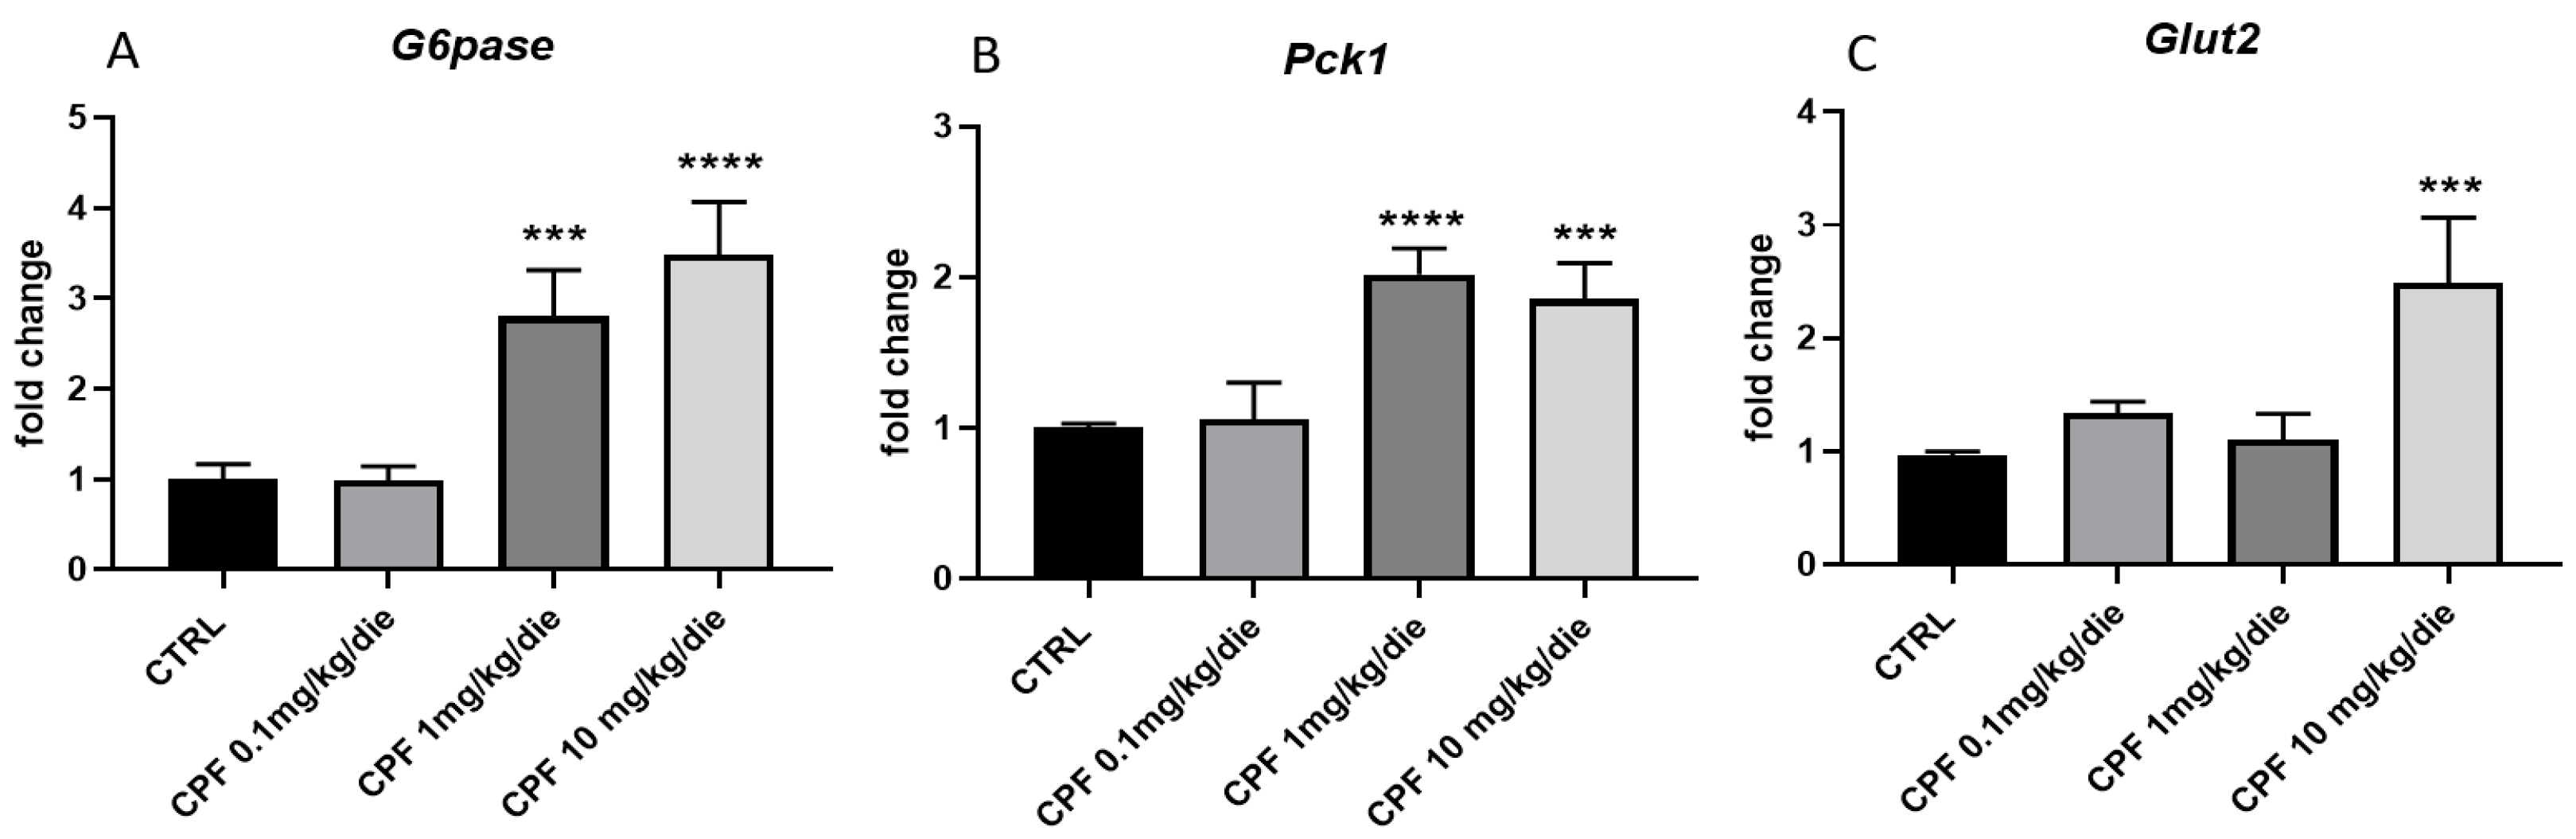
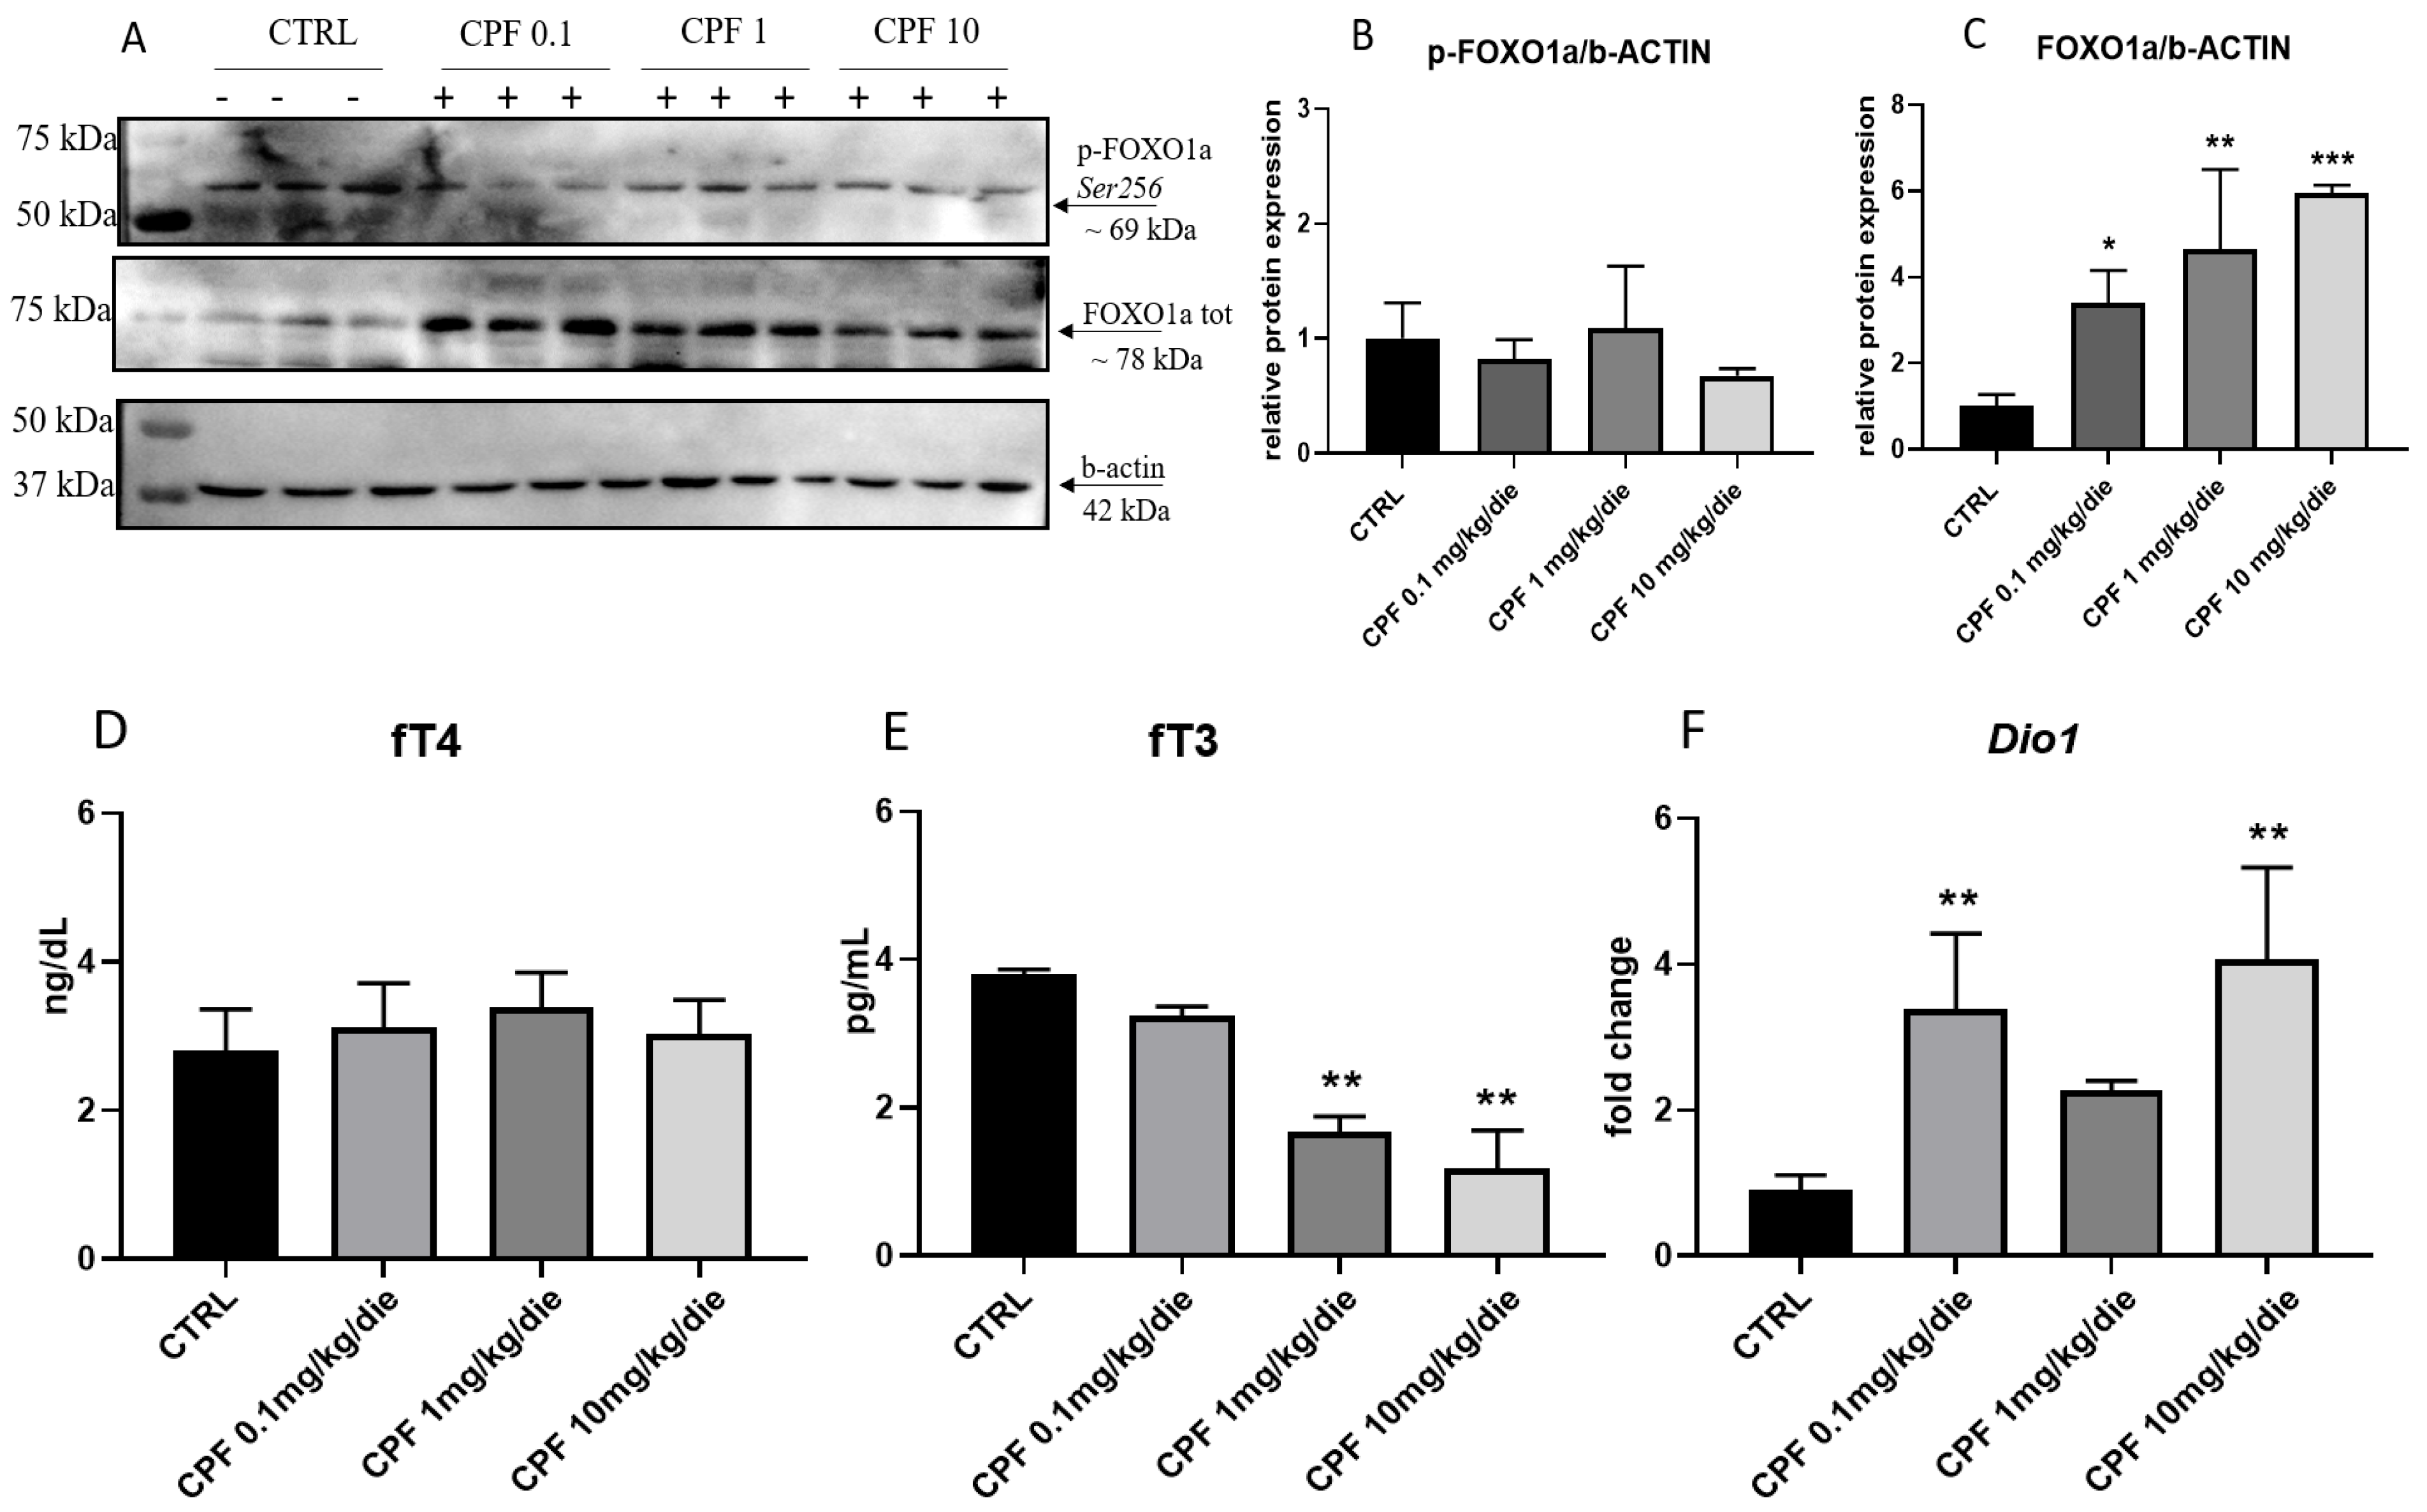
2.4. CPF Modulate Hepatic Glucose Homeostasis by Acting on Local T3-FOXO1 Axis
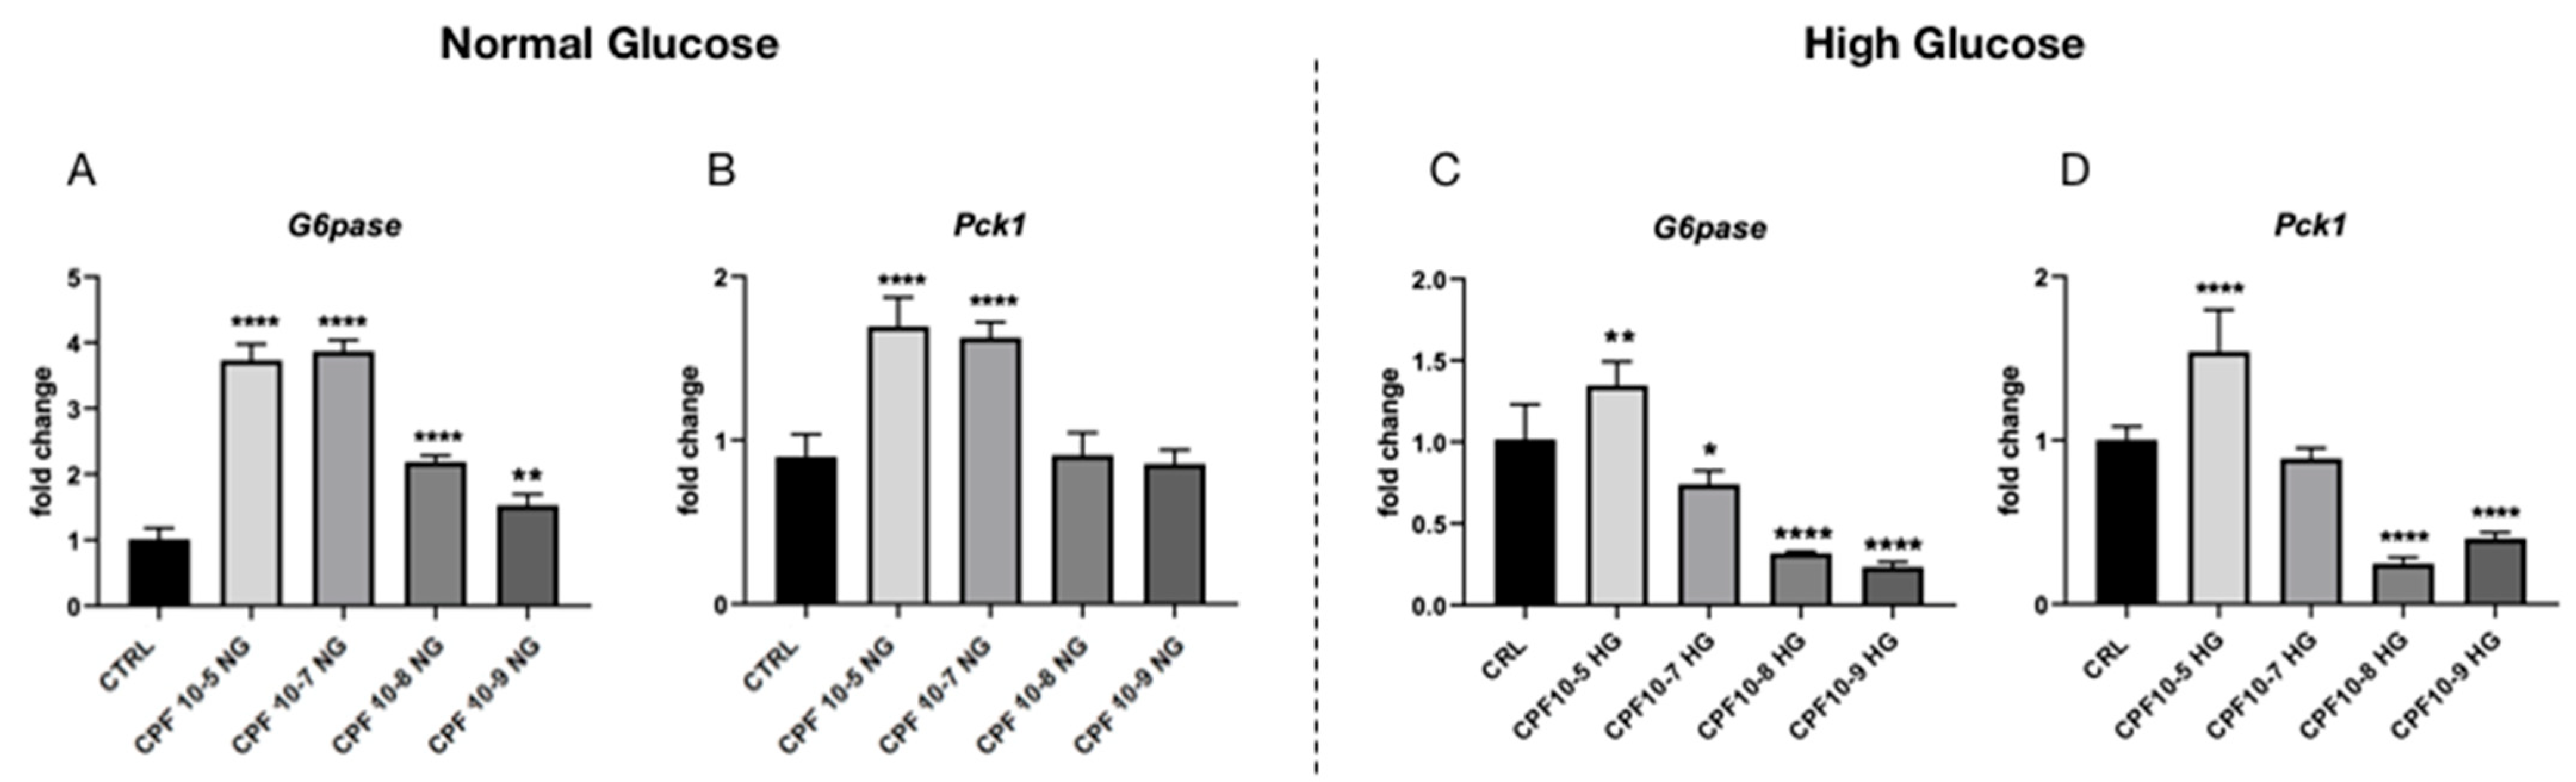
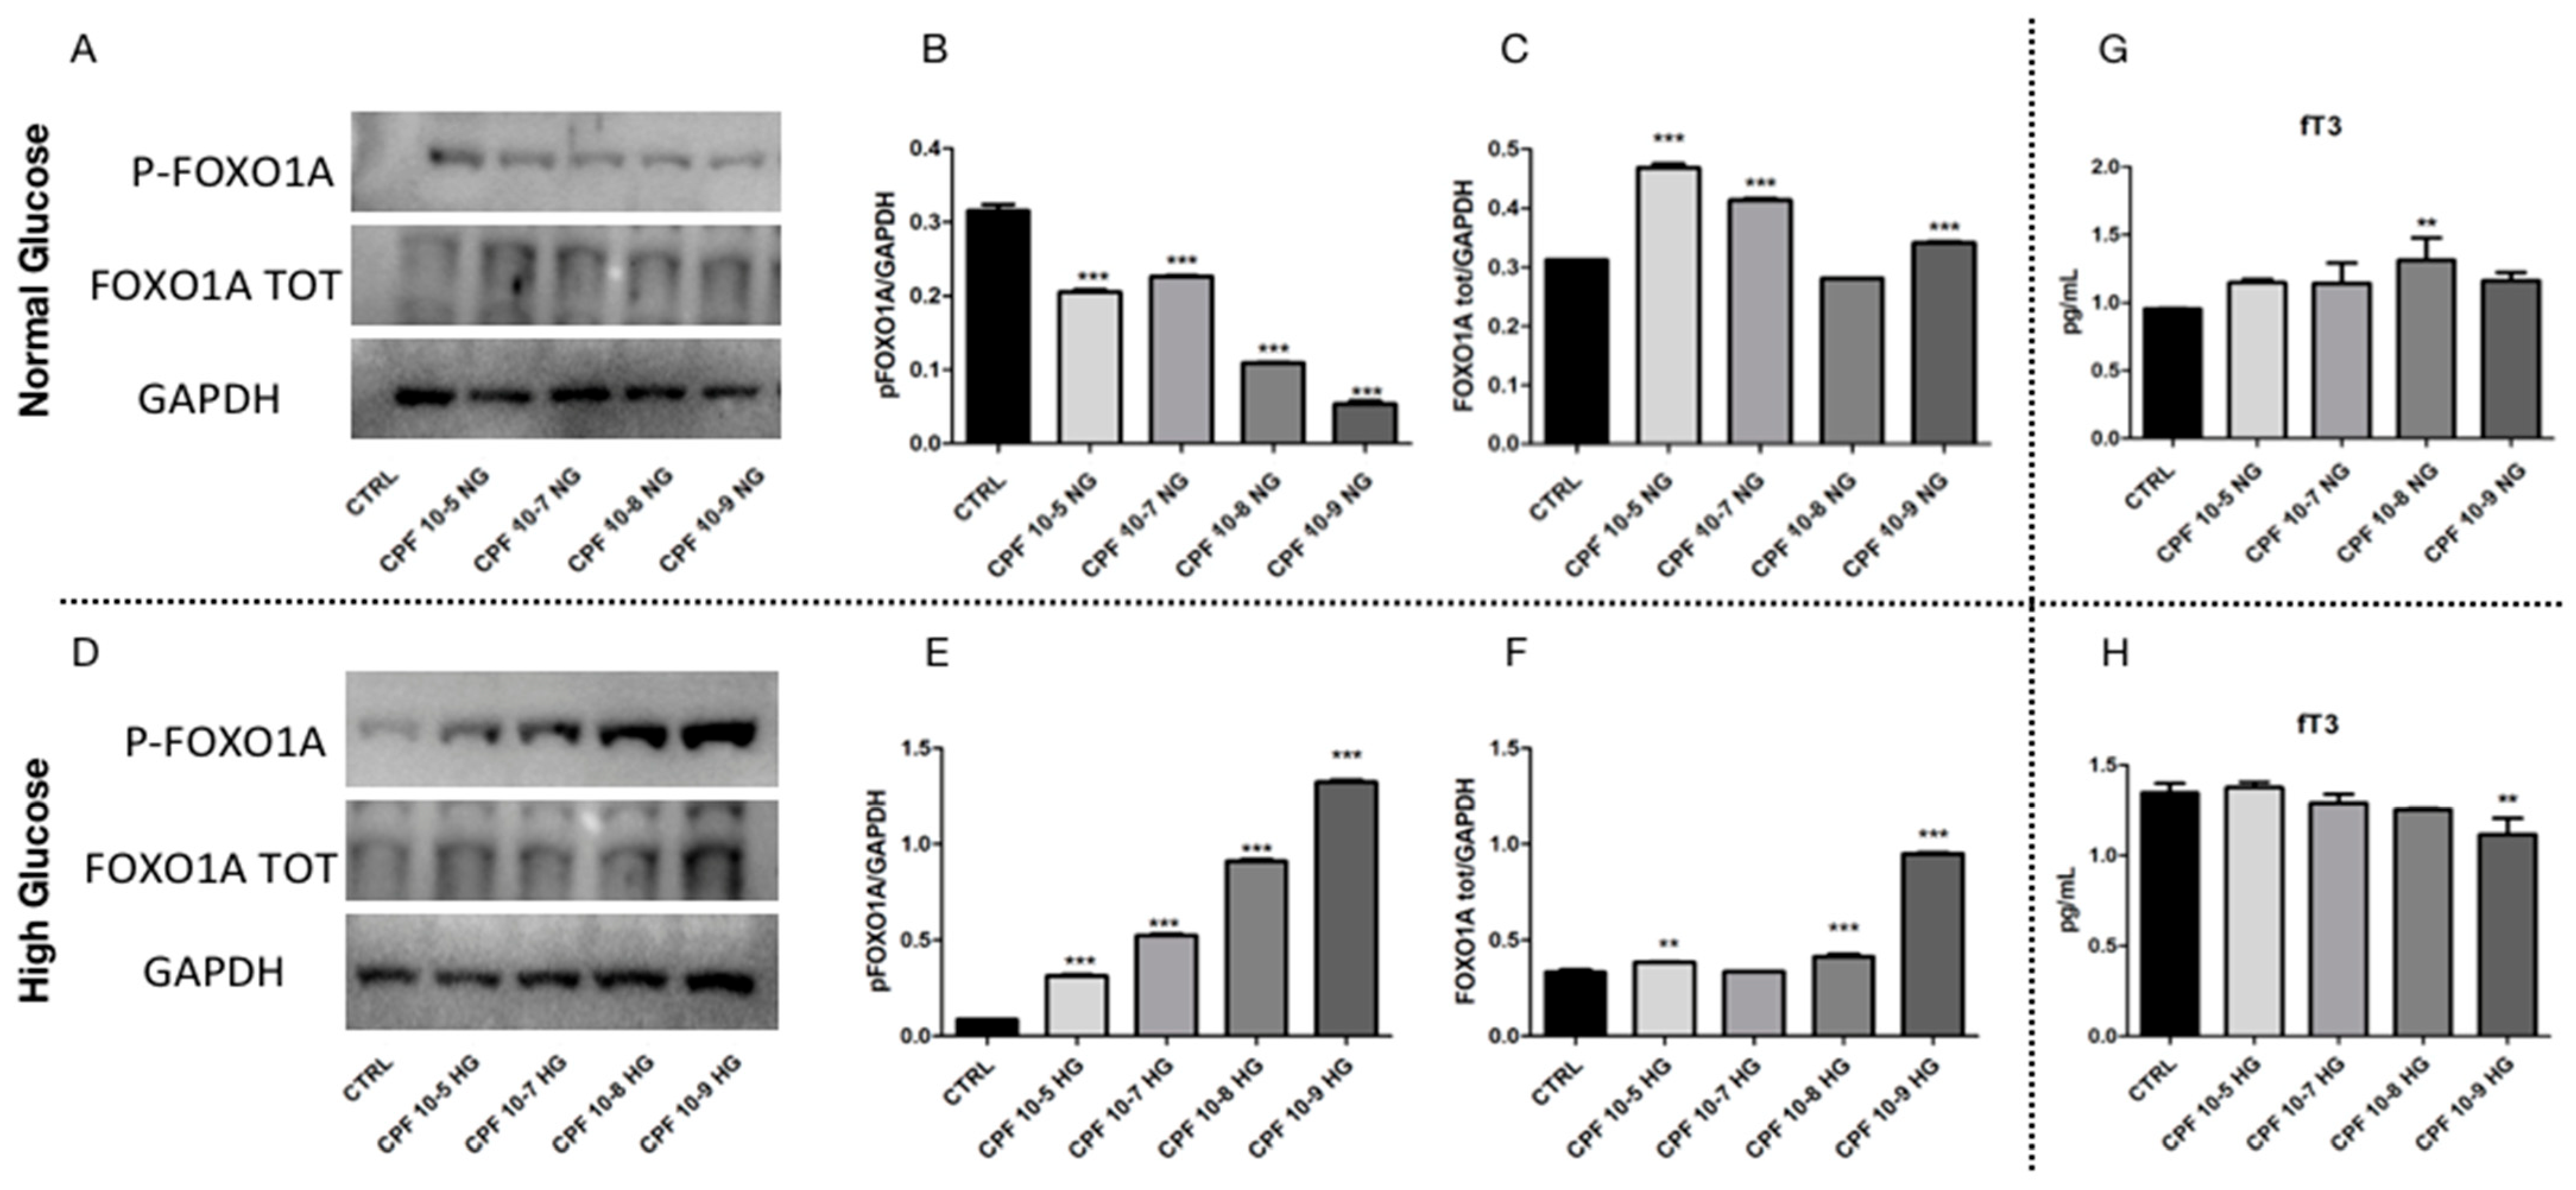
2.5. Higher Doses of CPF Mimic the Presence of T3 Leading to Hyperglycemia
3. Discussion
4. Materials and Methods
4.1. Animal Model
4.2. Cell Line
4.3. Glycemia Measurement
4.4. OGTT Test
4.5. Hormone Measurements
4.6. Reverse Transcription (RT) Quantitative (q) PCR
4.7. Western Blot Analysis
4.8. Statistical Analysis
Supplementary Materials
Author Contributions
Funding
Institutional Review Board Statement
Data Availability Statement
Acknowledgments
Conflicts of Interest
References
- Saklayen, M.G. The Global Epidemic of the Metabolic Syndrome. Curr. Hypertens. Rep. 2018, 20, 12. [Google Scholar] [CrossRef] [PubMed]
- Diamanti-Kandarakis, E.; Bourguignon, J.-P.; Giudice, L.C.; Hauser, R.; Prins, G.S.; Soto, A.M.; Zoeller, R.T.; Gore, A.C. Endocrine-Disrupting Chemicals: An Endocrine Society Scientific Statement. Endocr. Rev. 2009, 30, 293–342. [Google Scholar] [CrossRef] [PubMed]
- Rousselle, C.; Ormsby, J.N.; Schaefer, B.; Lampen, A.; Platzek, T.; Hirsch-Ernst, K.; Warholm, M.; Oskarsson, A.; Nielsen, P.J.; Holmer, M.L.; et al. Meeting Report: International Workshop on Endocrine Disruptors: Exposure and Potential Impact on Consumers Health. Regul. Toxicol. Pharmacol. 2013, 65, 7–11. [Google Scholar] [CrossRef] [PubMed]
- Vandenberg, L.N.; Colborn, T.; Hayes, T.B.; Heindel, J.J.; Jacobs, D.R.; Lee, D.-H.; Shioda, T.; Soto, A.M.; vom Saal, F.S.; Welshons, W.V.; et al. Hormones and Endocrine-Disrupting Chemicals: Low-Dose Effects and Nonmonotonic Dose Responses. Endocr. Rev. 2012, 33, 378–455. [Google Scholar] [CrossRef] [PubMed]
- Zoeller, R.T.; Vandenberg, L.N. Assessing Dose–Response Relationships for Endocrine Disrupting Chemicals (EDCs): A Focus on Non-Monotonicity. Environ. Health 2015, 14, 42. [Google Scholar] [CrossRef] [PubMed]
- Riederer, A.M.; Smith, K.D.; Barr, D.B.; Hayden, S.W.; Hunter, R.E.; Ryan, P.B. Current and Historically Used Pesticides in Residential Soil from 11 Homes in Atlanta, Georgia, USA. Arch. Environ. Contam. Toxicol. 2010, 58, 908–917. [Google Scholar] [CrossRef]
- Arnold, S.M.; Morriss, A.; Velovitch, J.; Juberg, D.; Burns, C.J.; Bartels, M.; Aggarwal, M.; Poet, T.; Hays, S.; Price, P. Derivation of Human Biomonitoring Guidance Values for Chlorpyrifos Using a Physiologically Based Pharmacokinetic and Pharmacodynamic Model of Cholinesterase Inhibition. Regul. Toxicol. Pharmacol. 2015, 71, 235–243. [Google Scholar] [CrossRef]
- Brzak, K.A.; Harms, D.W.; Bartels, M.J.; Nolan, R.J. Determination of Chlorpyrifos, Chlorpyrifos Oxon, and 3,5,6-Trichloro-2-Pyridinol in Rat and Human Blood. J. Anal. Toxicol. 1998, 22, 203–210. [Google Scholar] [CrossRef]
- Goodman, J.E.; Prueitt, R.L.; Rhomberg, L.R. Incorporating Low-Dose Epidemiology Data in a Chlorpyrifos Risk Assessment. Dose-Response 2013, 11, 207–219. [Google Scholar] [CrossRef]
- Poet, T.S.; Timchalk, C.; Hotchkiss, J.A.; Bartels, M.J. Chlorpyrifos PBPK/PD Model for Multiple Routes of Exposure. Xenobiotica 2014, 44, 868–881. [Google Scholar] [CrossRef]
- Saunders, M.; Magnanti, B.L.; Correia Carreira, S.; Yang, A.; Alamo-Hernández, U.; Riojas-Rodriguez, H.; Calamandrei, G.; Koppe, J.G.; Krayer von Krauss, M.; Keune, H.; et al. Chlorpyrifos and Neurodevelopmental Effects: A Literature Review and Expert Elicitation on Research and Policy. Environ. Health 2012, 11, S5. [Google Scholar] [CrossRef]
- Nandi, N.K.; Vyas, A.; Akhtar, M.J.; Kumar, B. The Growing Concern of Chlorpyrifos Exposures on Human and Environmental Health. Pestic. Biochem. Physiol. 2022, 185, 105138. [Google Scholar] [CrossRef]
- Gunier, R.B.; Deardorff, J.; Rauch, S.; Bradshaw, P.T.; Kogut, K.; Sagiv, S.; Hyland, C.; Mora, A.M.; Eskenazi, B. Residential Proximity to Agricultural Pesticide Use and Risk-Taking Behaviors in Young Adults from the CHAMACOS Study. Environ. Res. 2022, 215, 114356. [Google Scholar] [CrossRef]
- Lamat, H.; Sauvant-Rochat, M.-P.; Tauveron, I.; Bagheri, R.; Ugbolue, U.C.; Maqdasi, S.; Navel, V.; Dutheil, F. Metabolic Syndrome and Pesticides: A Systematic Review and Meta-Analysis. Environ. Pollut. 2022, 305, 119288. [Google Scholar] [CrossRef]
- Porreca, I.; D’Angelo, F.; De Franceschi, L.; Mattè, A.; Ceccarelli, M.; Iolascon, A.; Zamò, A.; Russo, F.; Ravo, M.; Tarallo, R.; et al. Pesticide Toxicogenomics across Scales: In Vitro Transcriptome Predicts Mechanisms and Outcomes of Exposure In Vivo. Sci. Rep. 2016, 6, 38131. [Google Scholar] [CrossRef]
- Peng, S.; Li, W.; Hou, N.; Huang, N. A Review of FoxO1-Regulated Metabolic Diseases and Related Drug Discoveries. Cells 2020, 9, 184. [Google Scholar] [CrossRef]
- Petersen, M.C.; Shulman, G.I. Mechanisms of Insulin Action and Insulin Resistance. Physiol. Rev. 2018, 98, 2133–2223. [Google Scholar] [CrossRef]
- Cano, R.; Pérez, J.; Dávila, L.; Ortega, Á.; Gómez, Y.; Valero-Cedeño, N.; Parra, H.; Manzano, A.; Véliz Castro, T.; Albornoz, M.; et al. Role of Endocrine-Disrupting Chemicals in the Pathogenesis of Non-Alcoholic Fatty Liver Disease: A Comprehensive Review. Int. J. Mol. Sci. 2021, 22, 4807. [Google Scholar] [CrossRef]
- Lauretta, R.; Sansone, A.; Sansone, M.; Romanelli, F.; Appetecchia, M. Endocrine Disrupting Chemicals: Effects on Endocrine Glands. Front. Endocrinol. 2019, 10, 178. [Google Scholar] [CrossRef]
- Street, M.; Angelini, S.; Bernasconi, S.; Burgio, E.; Cassio, A.; Catellani, C.; Cirillo, F.; Deodati, A.; Fabbrizi, E.; Fanos, V.; et al. Current Knowledge on Endocrine Disrupting Chemicals (EDCs) from Animal Biology to Humans, from Pregnancy to Adulthood: Highlights from a National Italian Meeting. Int. J. Mol. Sci. 2018, 19, 1647. [Google Scholar] [CrossRef]
- Gentilcore, D.; Porreca, I.; Rizzo, F.; Ganbaatar, E.; Carchia, E.; Mallardo, M.; De Felice, M.; Ambrosino, C. Bisphenol A Interferes with Thyroid Specific Gene Expression. Toxicology 2013, 304, 21–31. [Google Scholar] [CrossRef] [PubMed]
- Carchia, E.; Porreca, I.; Almeida, P.J.; D’Angelo, F.; Cuomo, D.; Ceccarelli, M.; De Felice, M.; Mallardo, M.; Ambrosino, C. Evaluation of Low Doses BPA-Induced Perturbation of Glycemia by Toxicogenomics Points to a Primary Role of Pancreatic Islets and to the Mechanism of Toxicity. Cell Death Dis. 2015, 6, e1959. [Google Scholar] [CrossRef] [PubMed]
- Toraño, E.G.; García, M.G.; Fernández-Morera, J.L.; Niño-García, P.; Fernández, A.F. The Impact of External Factors on the Epigenome: In Utero and over Lifetime. BioMed Res. Int. 2016, 2016, 2568635. [Google Scholar] [CrossRef] [PubMed]
- Colella, M.; Nittoli, V.; Porciello, A.; Porreca, I.; Reale, C.; Russo, F.; Russo, N.A.; Roberto, L.; Albano, F.; De Felice, M.; et al. Peripheral T3 Signaling Is the Target of Pesticides in Zebrafish Larvae and Adult Liver. J. Endocrinol. 2020, 247, 53–68. [Google Scholar] [CrossRef] [PubMed]
- Porreca, I.; Ulloa-Severino, L.; Almeida, P.; Cuomo, D.; Nardone, A.; Falco, G.; Mallardo, M.; Ambrosino, C. Molecular Targets of Developmental Exposure to Bisphenol A in Diabesity: A Focus on Endoderm-Derived Organs: Diabesity and BPA-Induced Damage. Obes. Rev. 2017, 18, 99–108. [Google Scholar] [CrossRef]
- Seifert, J.; Chen, Y.; Schöning, W.; Mai, K.; Tacke, F.; Spranger, J.; Köhrle, J.; Wirth, E.K. Hepatic Energy Metabolism under the Local Control of the Thyroid Hormone System. Int. J. Mol. Sci. 2023, 24, 4861. [Google Scholar] [CrossRef]
- Yuan, C.; Sun, X.; Liu, Y.; Wu, J. The Thyroid Hormone Levels and Glucose and Lipid Metabolism in Children with Type 1 Diabetes: A Correlation Analysis. Transl. Pediatr. 2021, 10, 276–282. [Google Scholar] [CrossRef]
- Sinha, R.A.; Singh, B.K.; Yen, P.M. Direct Effects of Thyroid Hormones on Hepatic Lipid Metabolism. Nat. Rev. Endocrinol. 2018, 14, 259–269. [Google Scholar] [CrossRef]
- Moustaïd, N.; Sul, H.S. Regulation of Expression of the Fatty Acid Synthase Gene in 3T3-L1 Cells by Differentiation and Triiodothyronine. J. Biol. Chem. 1991, 266, 18550–18554. [Google Scholar] [CrossRef]
- Iwen, K.A.; Schröder, E.; Brabant, G. Thyroid Hormones and the Metabolic Syndrome. Eur. Thyroid. J. 2013, 2, 83–92. [Google Scholar] [CrossRef]
- Gual, P.; Le Marchand-Brustel, Y.; Tanti, J.-F. Positive and Negative Regulation of Insulin Signaling through IRS-1 Phosphorylation. Biochimie 2005, 87, 99–109. [Google Scholar] [CrossRef]
- Werner, E.D.; Lee, J.; Hansen, L.; Yuan, M.; Shoelson, S.E. Insulin Resistance Due to Phosphorylation of Insulin Receptor Substrate-1 at Serine 302. J. Biol. Chem. 2004, 279, 35298–35305. [Google Scholar] [CrossRef]
- Zhang, J.; Gao, Z.; Yin, J.; Quon, M.J.; Ye, J. S6K Directly Phosphorylates IRS-1 on Ser-270 to Promote Insulin Resistance in Response to TNF-α Signaling through IKK2. J. Biol. Chem. 2008, 283, 35375–35382. [Google Scholar] [CrossRef]
- Schilling, M.M.; Oeser, J.K.; Boustead, J.N.; Flemming, B.P.; O’Brien, R.M. Re-Evaluating the FOXO1–PGC-1α Connection. Nature 2006, 443, E10–E11. [Google Scholar] [CrossRef]
- Arai, T.; Kano, F.; Murata, M. Translocation of Forkhead Box O1 to the Nuclear Periphery Induces Histone Modifications That Regulate Transcriptional Repression of PCK1 in HepG2 Cells. Genes Cells 2015, 20, 340–357. [Google Scholar] [CrossRef]
- Singh, B.K.; Sinha, R.A.; Zhou, J.; Tripathi, M.; Ohba, K.; Wang, M.-E.; Astapova, I.; Ghosh, S.; Hollenberg, A.N.; Gauthier, K.; et al. Hepatic FOXO1 Target Genes Are Co-Regulated by Thyroid Hormone via RICTOR Protein Deacetylation and MTORC2-AKT Protein Inhibition. J. Biol. Chem. 2016, 291, 198–214. [Google Scholar] [CrossRef]
- Wołejko, E.; Łozowicka, B.; Jabłońska-Trypuć, A.; Pietruszyńska, M.; Wydro, U. Chlorpyrifos Occurrence and Toxicological Risk Assessment: A Review. Int. J. Environ. Res. Public Health 2022, 19, 12209. [Google Scholar] [CrossRef]
- Taheri, E.; Amin, M.M.; Daniali, S.S.; Abdollahpour, I.; Fatehizadeh, A.; Kelishadi, R. Health Risk Assessment of Exposure to Chlorpyrifos in Pregnant Women Using Deterministic and Probabilistic Approaches. PLoS ONE 2022, 17, e0262127. [Google Scholar] [CrossRef]
- Dourson, M.; Gadagbui, B.; Onyema, C.; McGinnis, P. A Commentary on Some Epidemiology Data for Chlorpyrifos. Regul. Toxicol. Pharmacol. 2020, 113, 104616. [Google Scholar] [CrossRef]
- Pallotta, M.; Ronca, R.; Carotenuto, R.; Porreca, I.; Turano, M.; Ambrosino, C.; Capriglione, T. Specific Effects of Chronic Dietary Exposure to Chlorpyrifos on Brain Gene Expression—A Mouse Study. Int. J. Mol. Sci. 2017, 18, 2467. [Google Scholar] [CrossRef]
- Kim, S.-K.; Oh, H.-J.; Oh, S.-S.; Koh, S.-B. Pesticide Exposure in Relation to the Incidence of Abnormal Glucose Regulation: A Retrospective Cohort Study. Int. J. Environ. Res. Public Health 2022, 19, 7550. [Google Scholar] [CrossRef] [PubMed]
- Leonel Javeres, M.N.; Habib, R.; Judith Laure, N.; Abbas Shah, S.T.; Valis, M.; Kuca, K.; Muhammad Nurulain, S. Chronic Exposure to Organophosphates Pesticides and Risk of Metabolic Disorder in Cohort from Pakistan and Cameroon. Int. J. Environ. Res. Public Health 2021, 18, 2310. [Google Scholar] [CrossRef] [PubMed]
- Aktar, W.; Sengupta, D.; Chowdhury, A. Impact of Pesticides Use in Agriculture: Their Benefits and Hazards. Interdiscip. Toxicol. 2009, 2, 1–12. [Google Scholar] [CrossRef] [PubMed]
- Brenta, G. Why Can Insulin Resistance Be a Natural Consequence of Thyroid Dysfunction? J. Thyroid. Res. 2011, 2011, 152850. [Google Scholar] [CrossRef]
- Tikhanovich, I.; Cox, J.; Weinman, S.A. Forkhead Box Class O Transcription Factors in Liver Function and Disease: FOXO and the Liver. J. Gastroenterol. Hepatol. 2013, 28, 125–131. [Google Scholar] [CrossRef]
- Lee, S.; Dong, H.H. FoxO Integration of Insulin Signaling with Glucose and Lipid Metabolism. J. Endocrinol. 2017, 233, R67–R79. [Google Scholar] [CrossRef]
- Ferré, P.; Phan, F.; Foufelle, F. SREBP-1c and Lipogenesis in the Liver: An Update. Biochem. J. 2021, 478, 3723–3739. [Google Scholar] [CrossRef]
- Copps, K.D.; Hançer, N.J.; Qiu, W.; White, M.F. Serine 302 Phosphorylation of Mouse Insulin Receptor Substrate 1 (IRS1) Is Dispensable for Normal Insulin Signaling and Feedback Regulation by Hepatic S6 Kinase. J. Biol. Chem. 2016, 291, 8602–8617. [Google Scholar] [CrossRef]
- Gionfra, F.; De Vito, P.; Pallottini, V.; Lin, H.-Y.; Davis, P.J.; Pedersen, J.Z.; Incerpi, S. The Role of Thyroid Hormones in Hepatocyte Proliferation and Liver Cancer. Front. Endocrinol. 2019, 10, 532. [Google Scholar] [CrossRef]
- Cao, X.; Kambe, F.; Moeller, L.C.; Refetoff, S.; Seo, H. Thyroid Hormone Induces Rapid Activation of Akt/Protein Kinase B-Mammalian Target of Rapamycin-P70 S6K Cascade through Phosphatidylinositol 3-Kinase in Human Fibroblasts. Mol. Endocrinol. 2005, 19, 102–112. [Google Scholar] [CrossRef]
- Chen, L.; Chen, R.; Wang, H.; Liang, F. Mechanisms Linking Inflammation to Insulin Resistance. Int. J. Endocrinol. 2015, 2015, 508409. [Google Scholar] [CrossRef]
- De Angelis, S.; Tassinari, R.; Maranghi, F.; Eusepi, A.; Di Virgilio, A.; Chiarotti, F.; Ricceri, L.; Pesciolini, A.V.; Gilardi, E.; Moracci, G.; et al. Developmental Exposure to Chlorpyrifos Induces Alterations in Thyroid and Thyroid Hormone Levels Without Other Toxicity Signs in Cd1 Mice. Toxicol. Sci. 2009, 108, 311–319. [Google Scholar] [CrossRef]


Disclaimer/Publisher’s Note: The statements, opinions and data contained in all publications are solely those of the individual author(s) and contributor(s) and not of MDPI and/or the editor(s). MDPI and/or the editor(s) disclaim responsibility for any injury to people or property resulting from any ideas, methods, instructions or products referred to in the content. |
© 2023 by the authors. Licensee MDPI, Basel, Switzerland. This article is an open access article distributed under the terms and conditions of the Creative Commons Attribution (CC BY) license (https://creativecommons.org/licenses/by/4.0/).
Share and Cite
Peluso, T.; Nittoli, V.; Reale, C.; Porreca, I.; Russo, F.; Roberto, L.; Giacco, A.; Silvestri, E.; Mallardo, M.; De Felice, M.; et al. Chronic Exposure to Chlorpyrifos Damages Thyroid Activity and Imbalances Hepatic Thyroid Hormones Signaling and Glucose Metabolism: Dependency of T3-FOXO1 Axis by Hyperglycemia. Int. J. Mol. Sci. 2023, 24, 9582. https://doi.org/10.3390/ijms24119582
Peluso T, Nittoli V, Reale C, Porreca I, Russo F, Roberto L, Giacco A, Silvestri E, Mallardo M, De Felice M, et al. Chronic Exposure to Chlorpyrifos Damages Thyroid Activity and Imbalances Hepatic Thyroid Hormones Signaling and Glucose Metabolism: Dependency of T3-FOXO1 Axis by Hyperglycemia. International Journal of Molecular Sciences. 2023; 24(11):9582. https://doi.org/10.3390/ijms24119582
Chicago/Turabian StylePeluso, Teresa, Valeria Nittoli, Carla Reale, Immacolata Porreca, Filomena Russo, Luca Roberto, Antonia Giacco, Elena Silvestri, Massimo Mallardo, Mario De Felice, and et al. 2023. "Chronic Exposure to Chlorpyrifos Damages Thyroid Activity and Imbalances Hepatic Thyroid Hormones Signaling and Glucose Metabolism: Dependency of T3-FOXO1 Axis by Hyperglycemia" International Journal of Molecular Sciences 24, no. 11: 9582. https://doi.org/10.3390/ijms24119582
APA StylePeluso, T., Nittoli, V., Reale, C., Porreca, I., Russo, F., Roberto, L., Giacco, A., Silvestri, E., Mallardo, M., De Felice, M., & Ambrosino, C. (2023). Chronic Exposure to Chlorpyrifos Damages Thyroid Activity and Imbalances Hepatic Thyroid Hormones Signaling and Glucose Metabolism: Dependency of T3-FOXO1 Axis by Hyperglycemia. International Journal of Molecular Sciences, 24(11), 9582. https://doi.org/10.3390/ijms24119582