
Identification of Proteins Involved in Cell Membrane Permeabilization by Nanosecond Electric Pulses (nsEP)

 , , , ,
  and
and 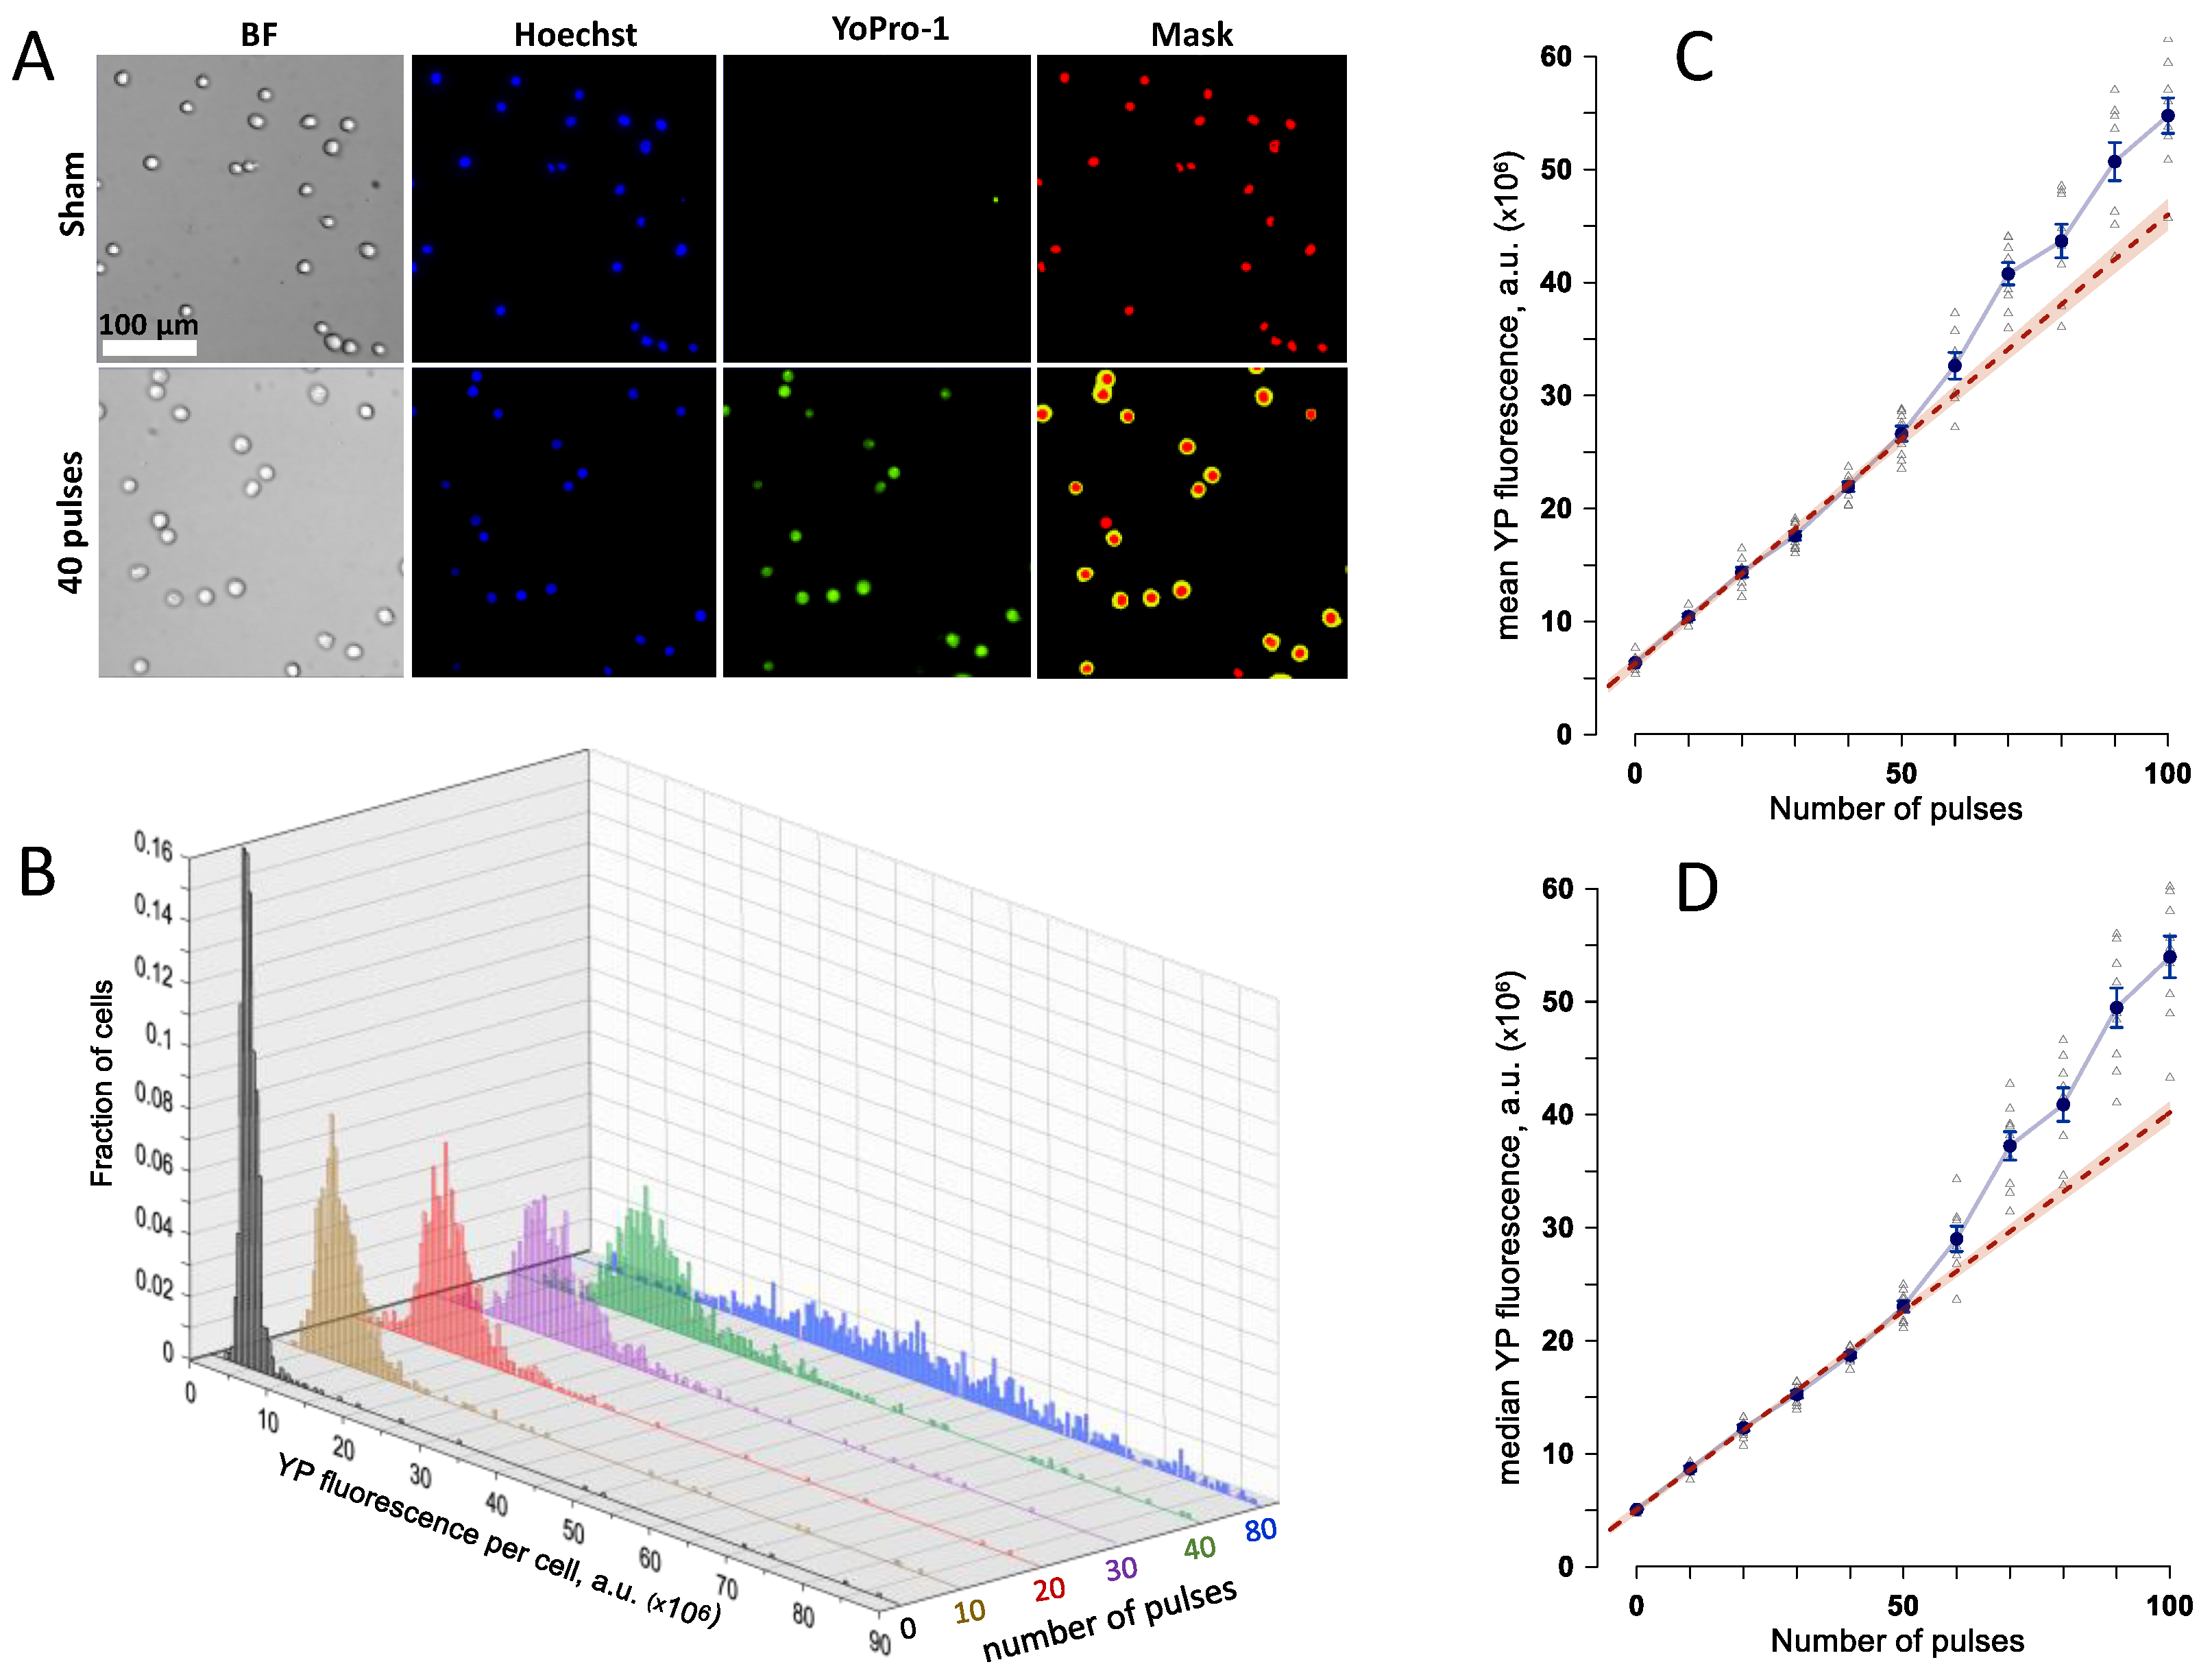
Abstract
1. Introduction
2. Results
2.1. Dose-Response Dependence for Cell Membrane Permeabilization by 7 kV/cm, 300-ns Pulses
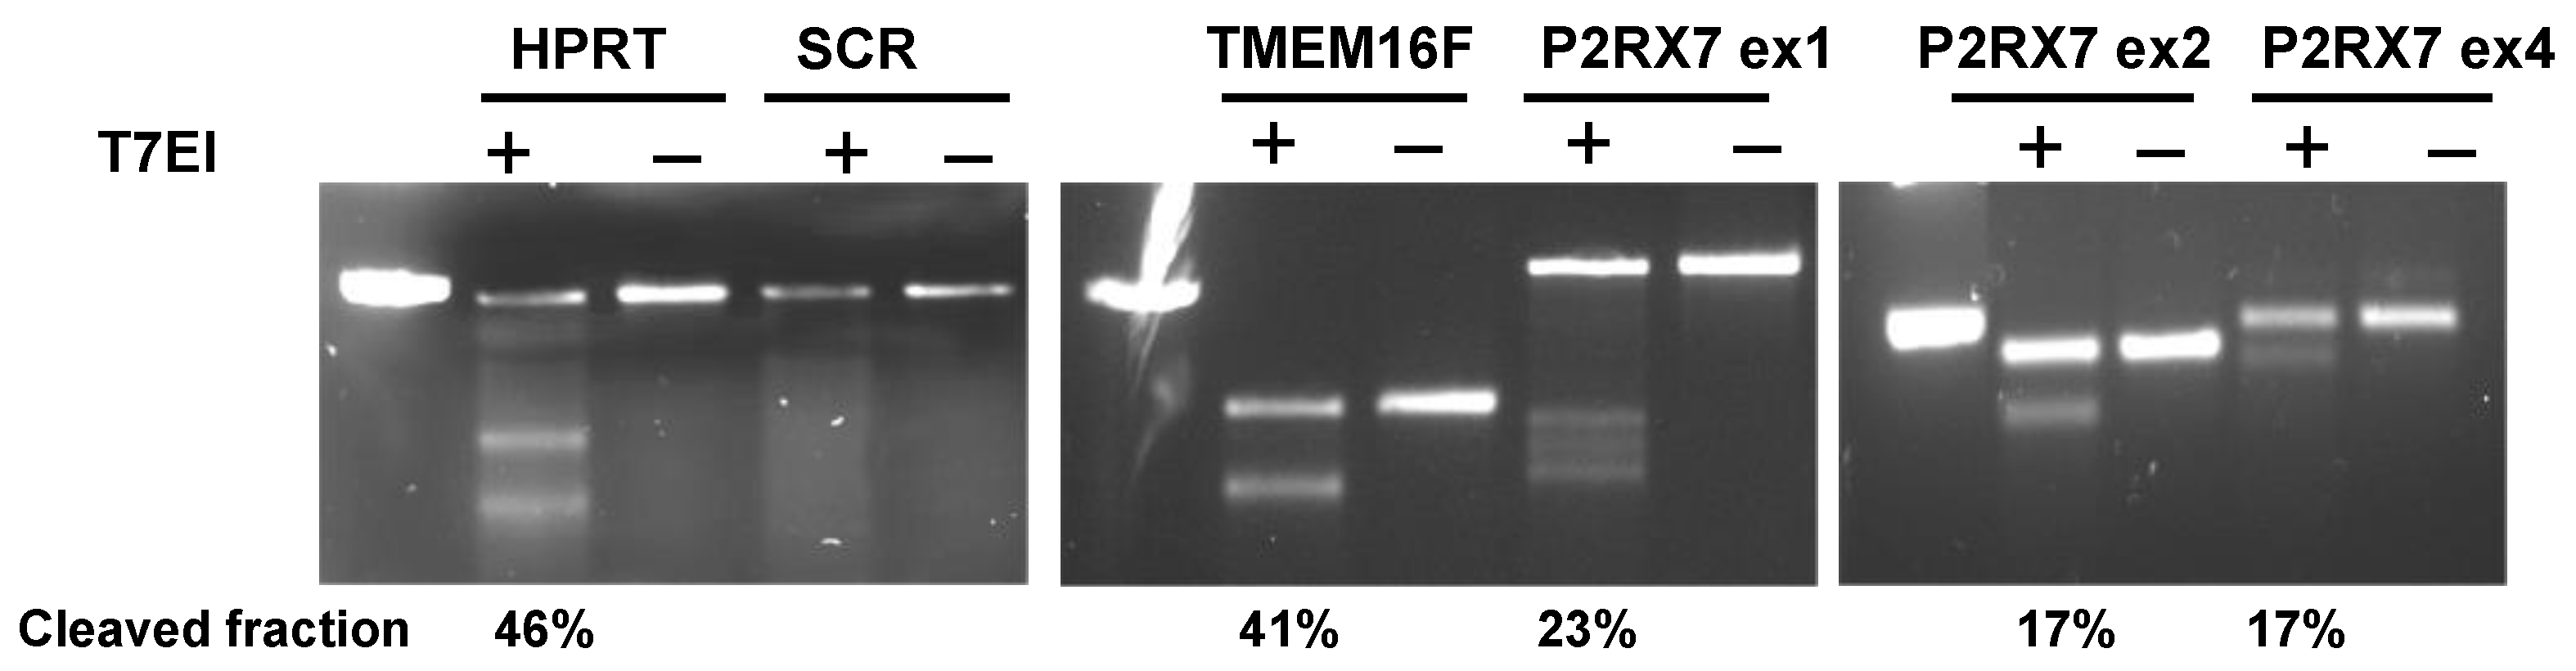
2.2. Validation of CRISPR-Cas9 Genome Editing
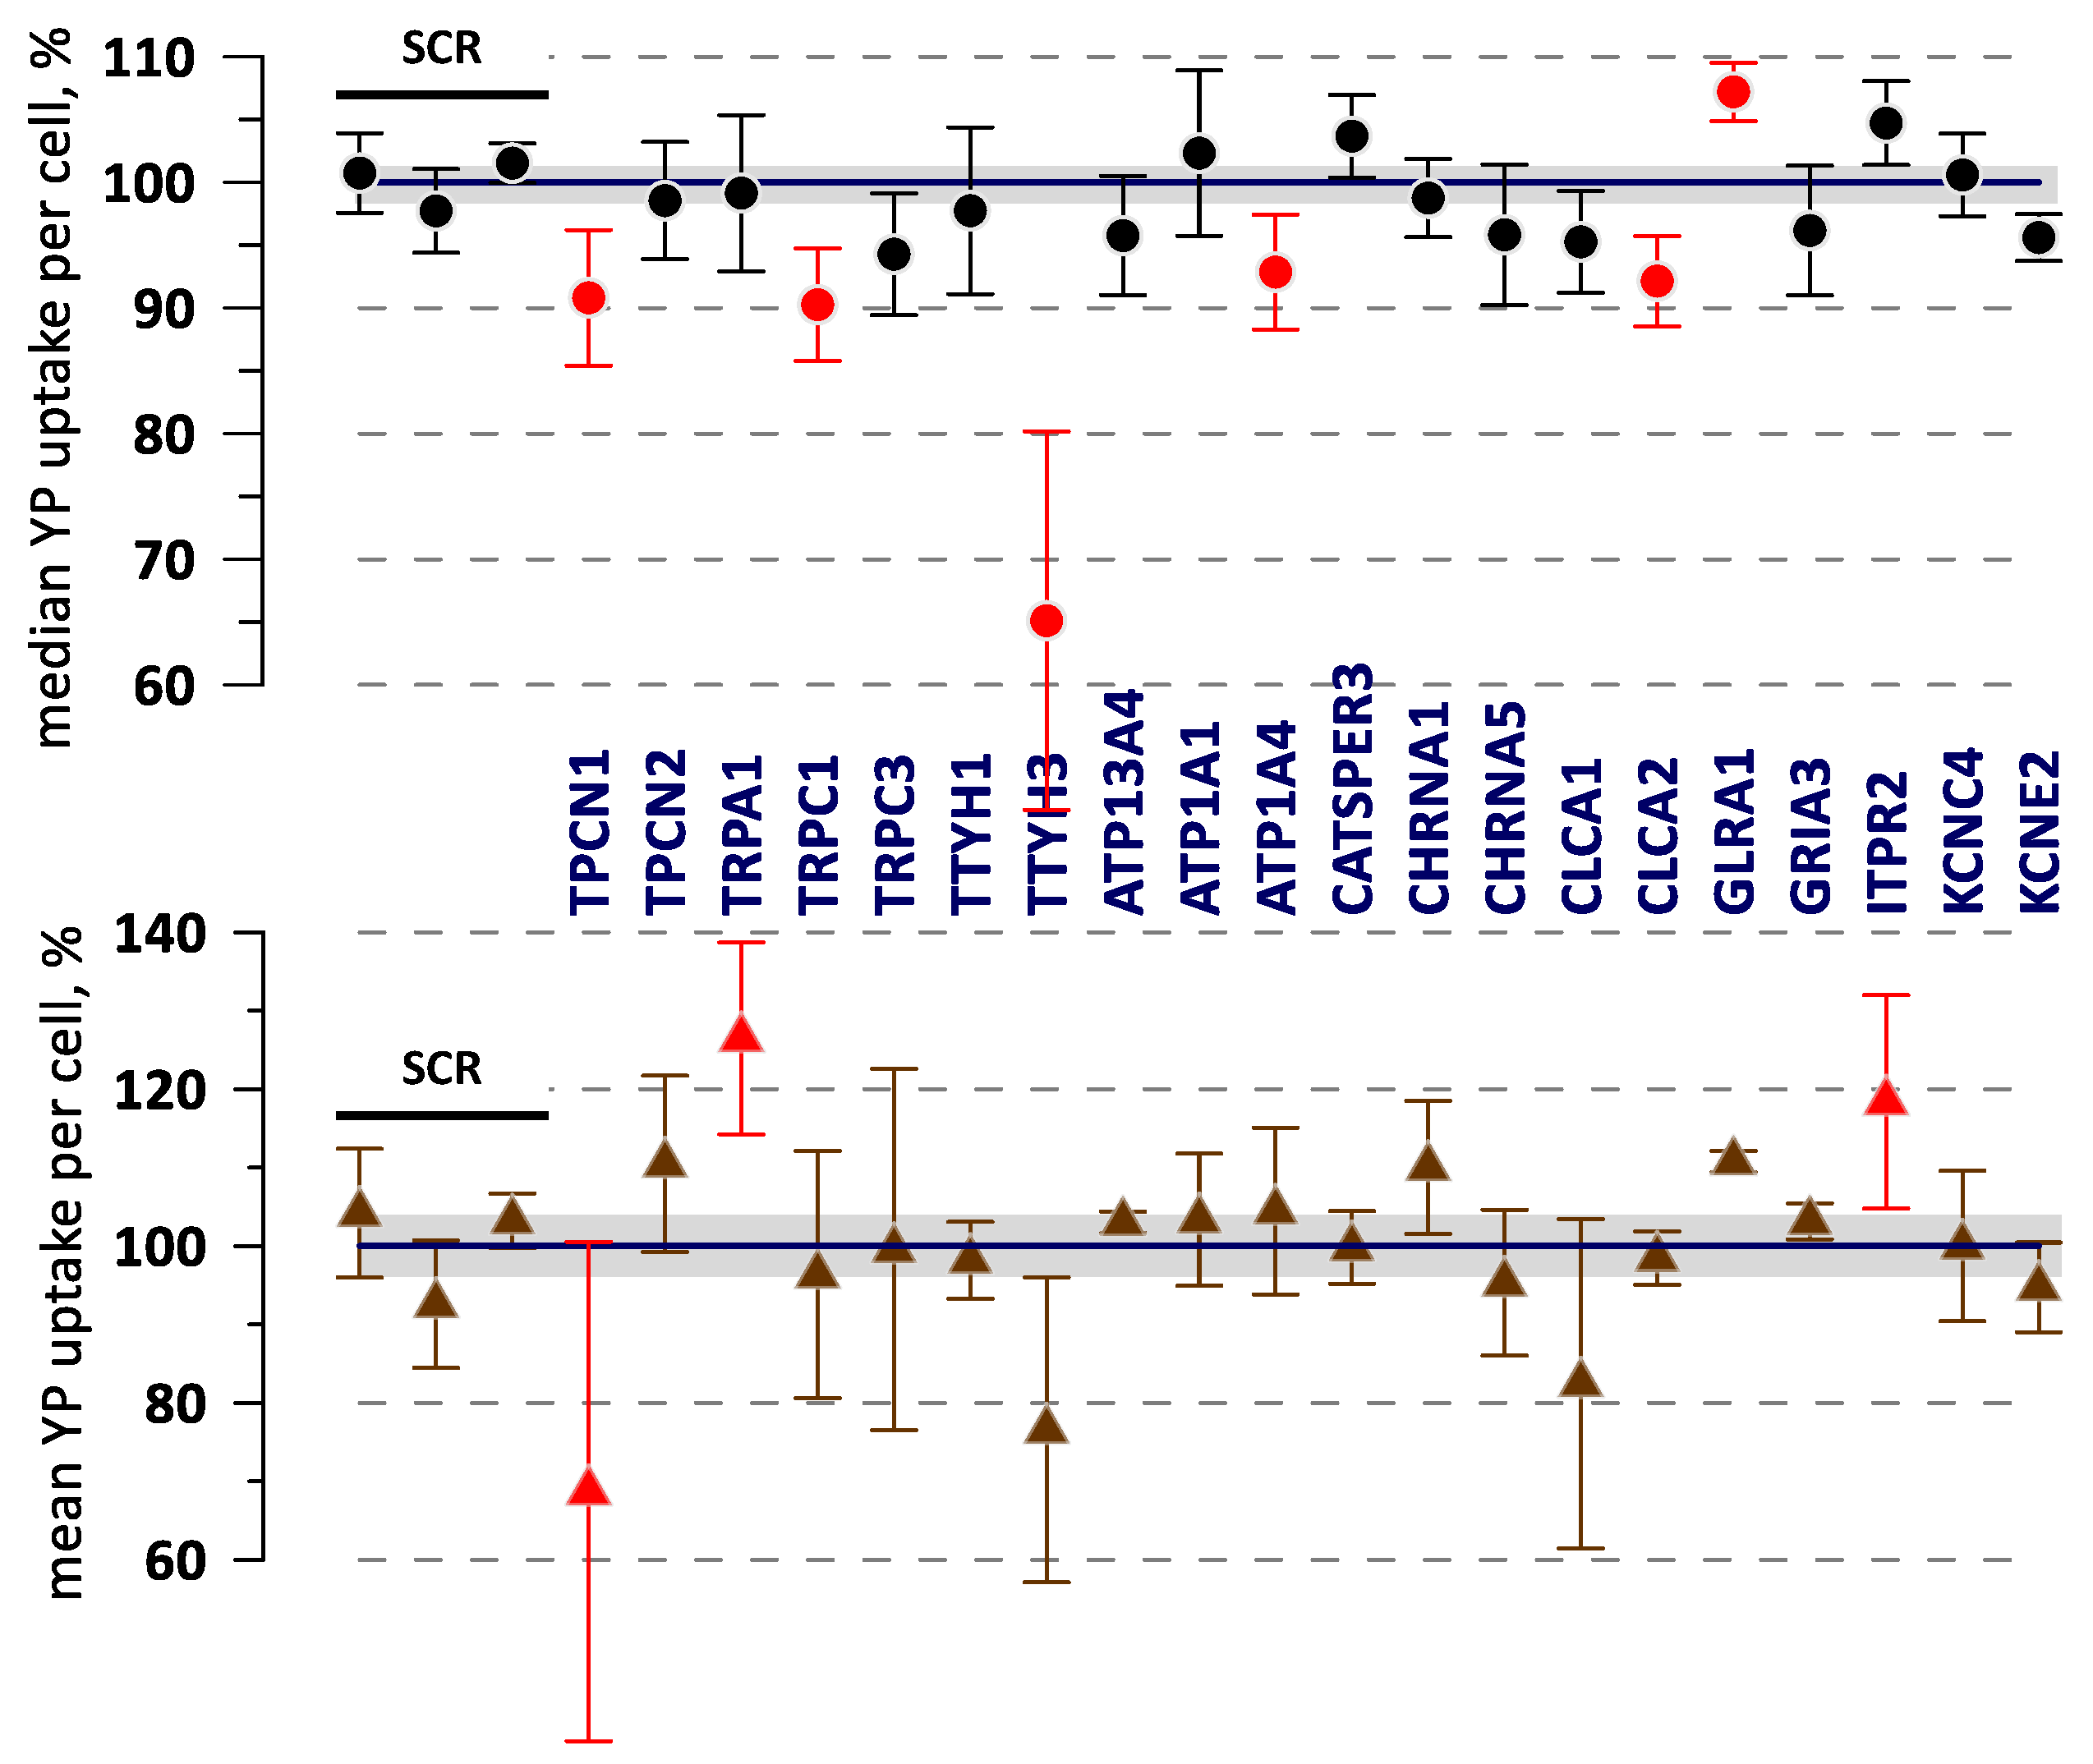
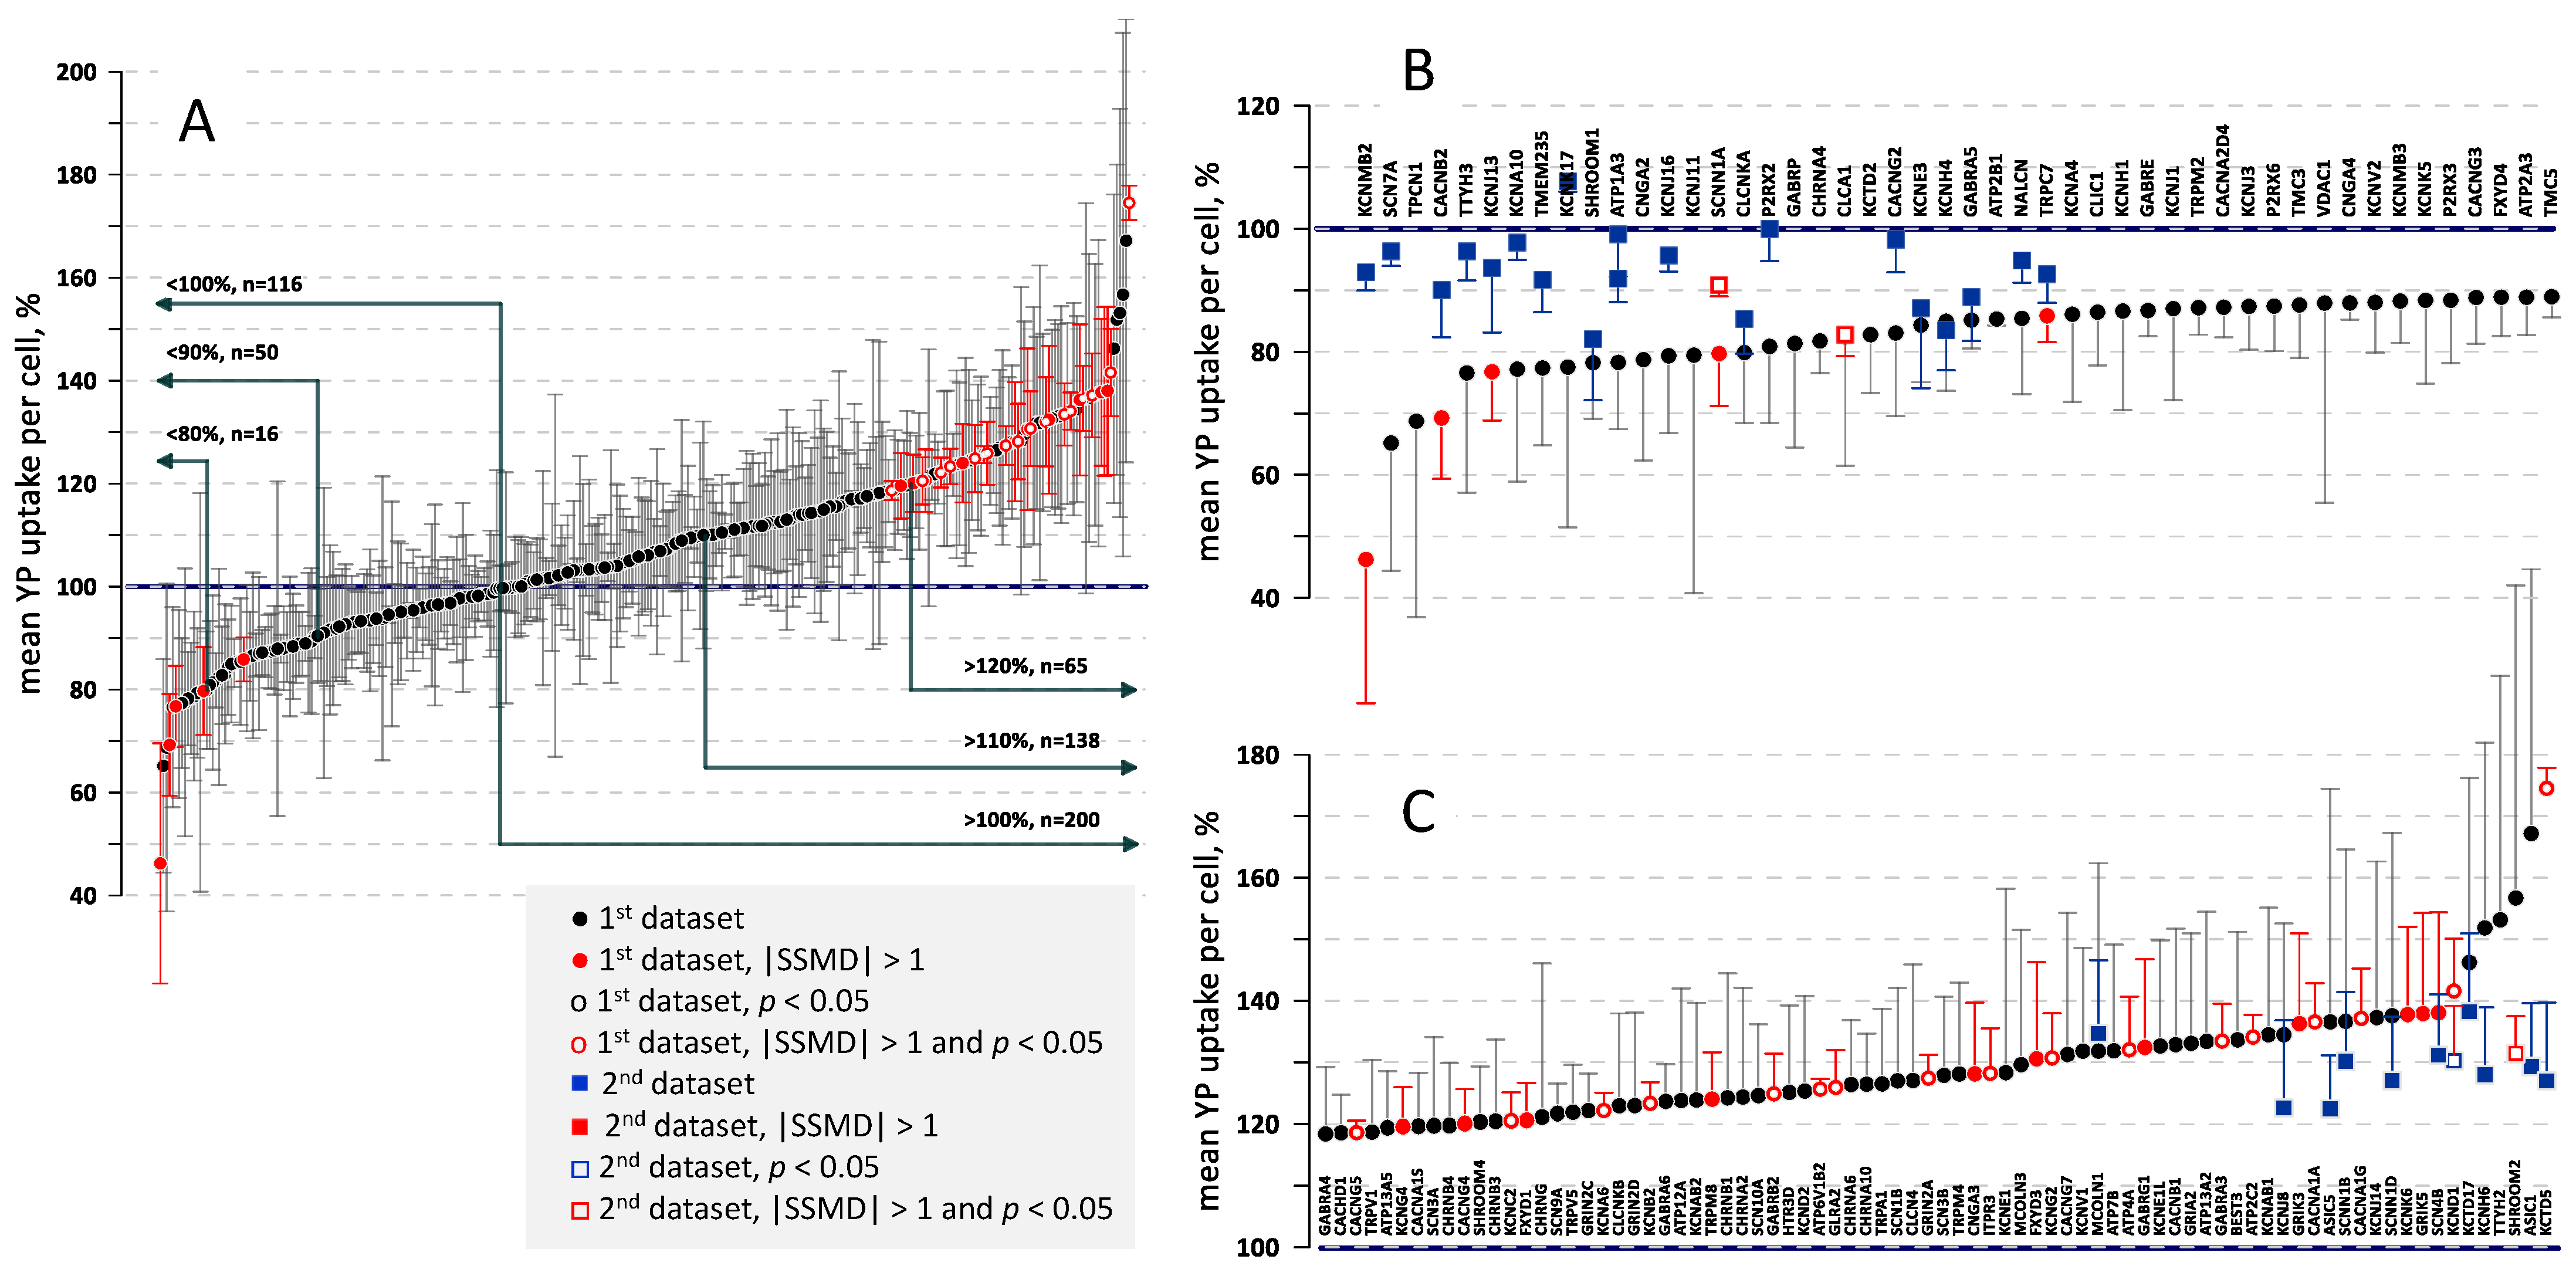
2.3. Effect of Gene KOs on YP Uptake by Electropermeabilized Cells
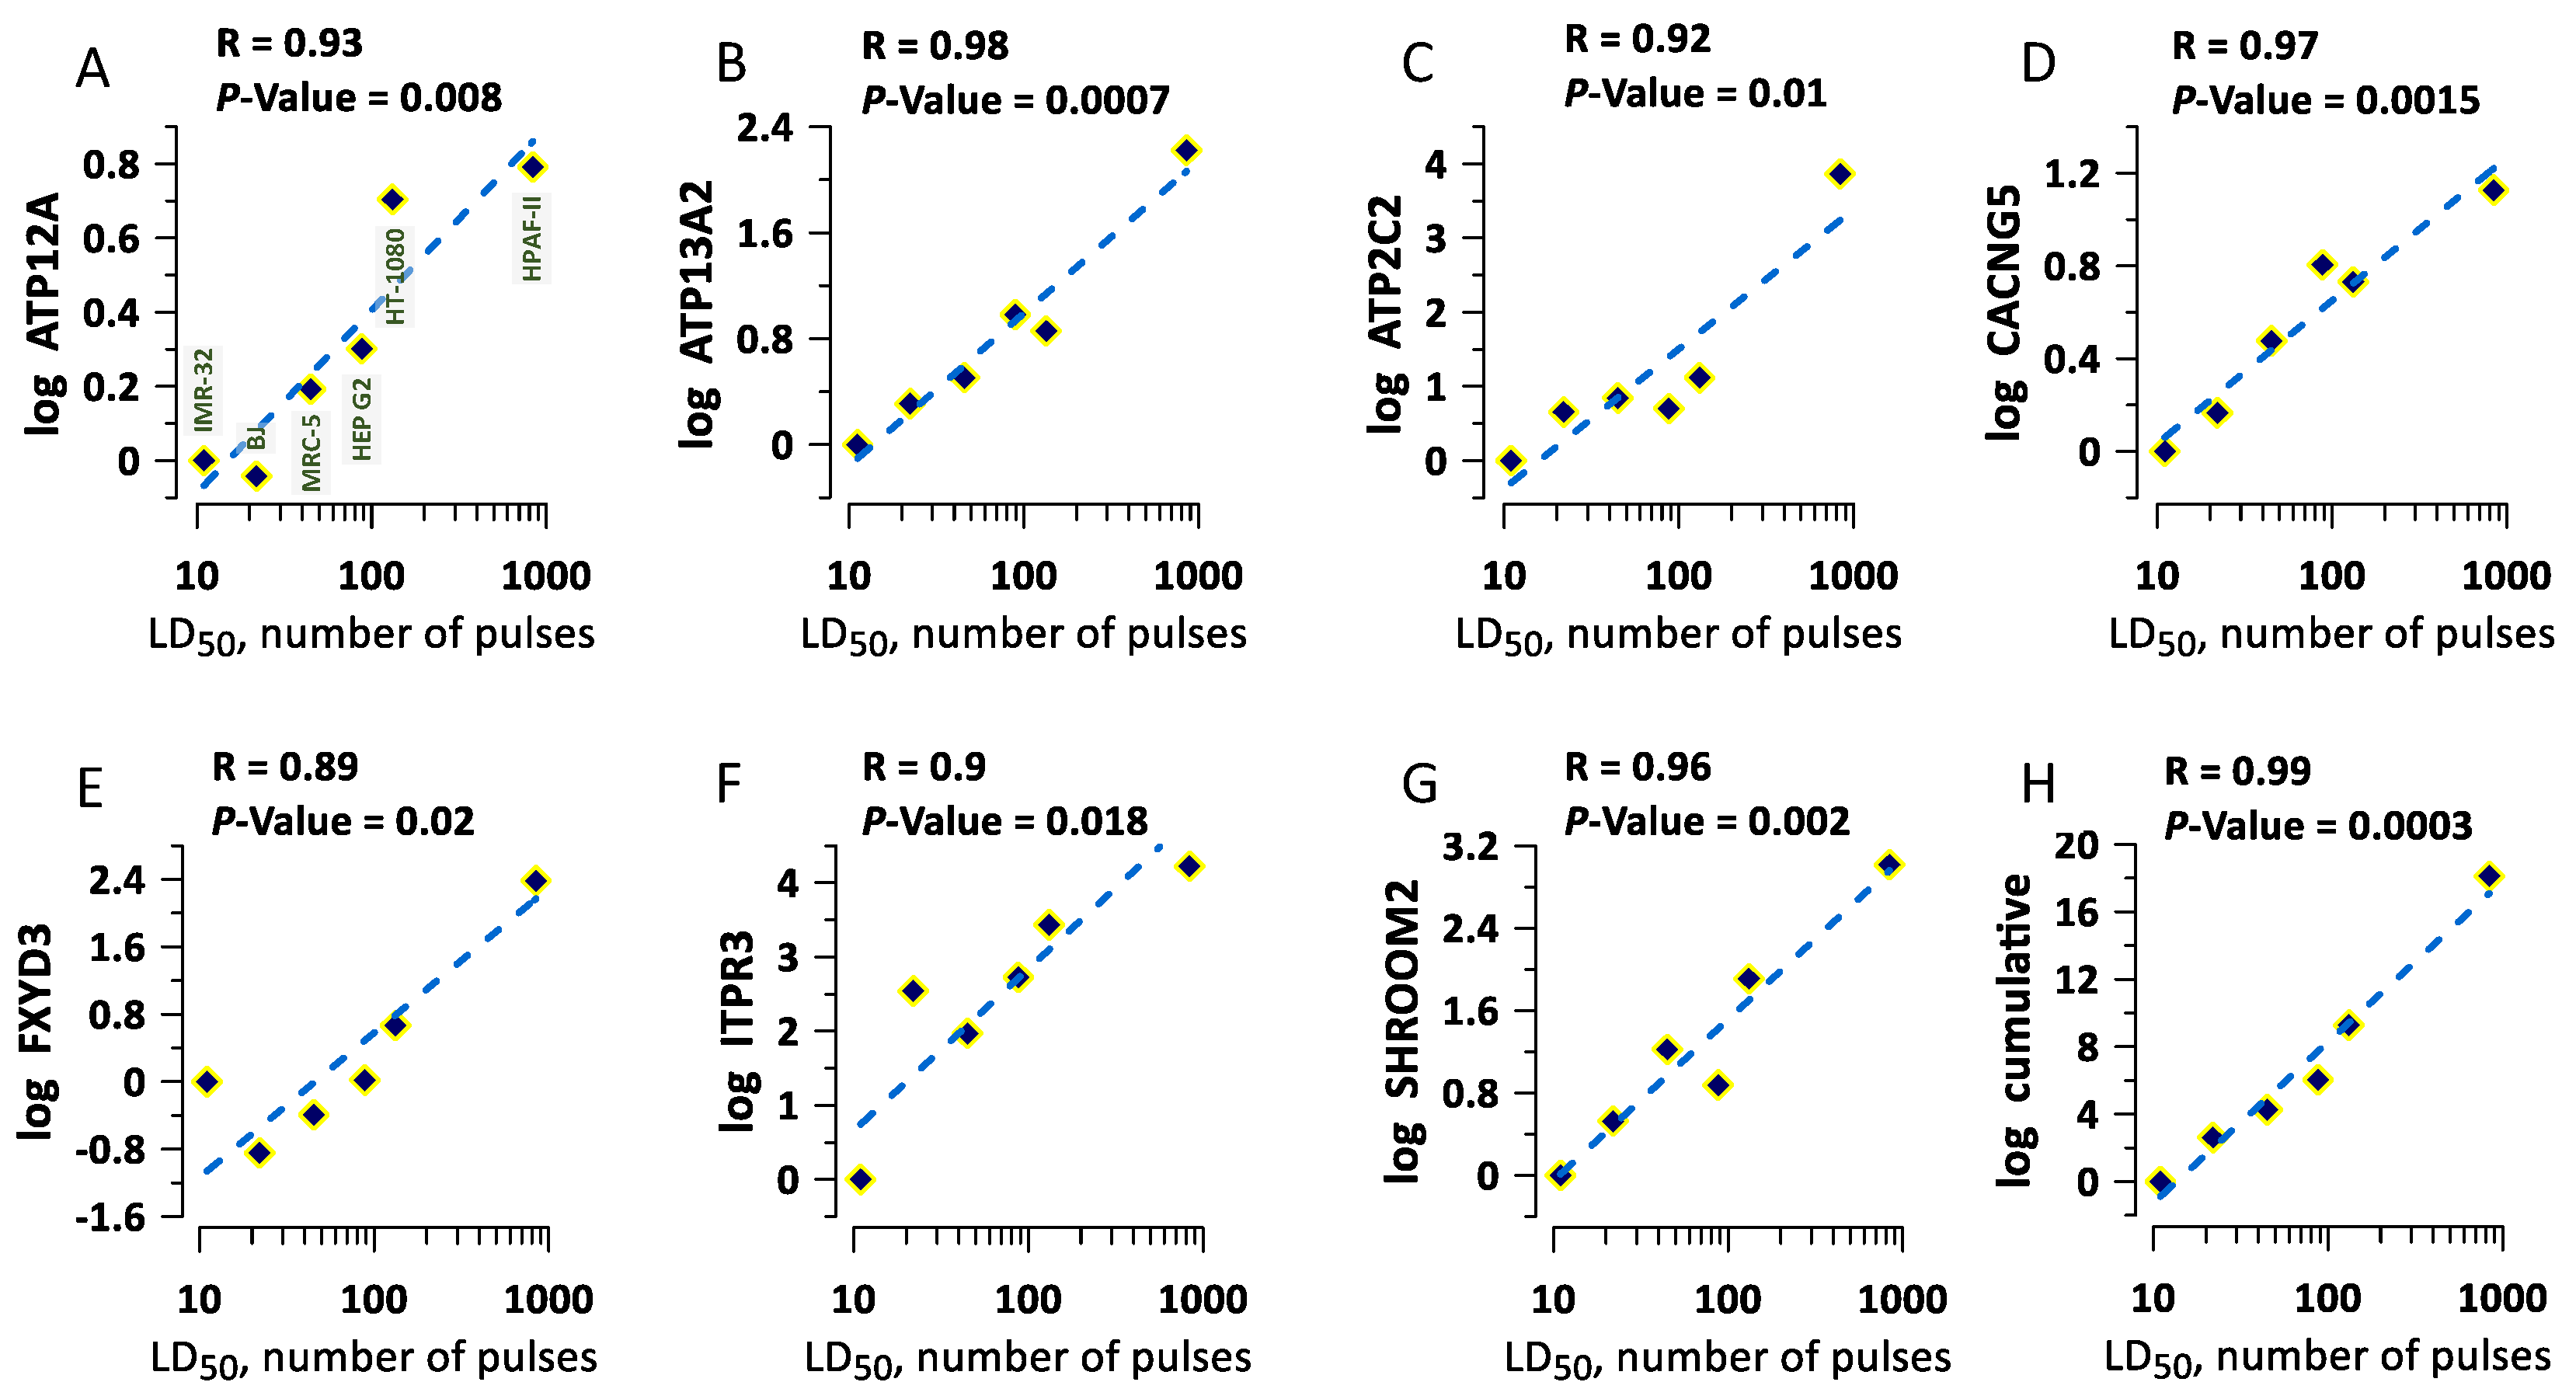
2.4. The Correlation of Gene Expression with Cell Survival
3. Discussion
4. Materials and Methods
4.1. Reagents and Materials
4.2. Cell Culture and Gene Knock-Out Procedures
4.3. Genomic Cleavage Detection
4.4. Electroporation and Detection of Cell Membrane Permeabilization
4.5. Image Analysis, Quantification of Membrane Permeabilization, and Hit Selection
4.6. Gene Expression Analysis in Cell Lines
Supplementary Materials
Author Contributions
Funding
Institutional Review Board Statement
Informed Consent Statement
Data Availability Statement
Conflicts of Interest
References
- Zimmermann, U.; Neil, G.A. Electromanipulation of Cells; CRC Press: Boca Raton, FL, USA, 1996. [Google Scholar]
- Teissie, J.; Golzio, M.; Rols, M.P. Mechanisms of cell membrane electropermeabilization: A minireview of our present (lack of?) knowledge. Biochim. Biophys. Acta 2005, 1724, 270–280. [Google Scholar] [CrossRef]
- Tsong, T.Y. On electroporation of cell-membranes and some related phenomena. Bioelectrochem. Bioenerg. 1990, 24, 271–295. [Google Scholar] [CrossRef]
- Kotnik, T.; Rems, L.; Tarek, M.; Miklavcic, D. Membrane electroporation and electropermeabilization: Mechanisms and models. Annu. Rev. Biophys. 2019, 48, 63–91. [Google Scholar] [CrossRef] [PubMed]
- Neumann, E.; Sowers, A.E.; Jordan, C.A. Electroporation and Electrofusion in Cell Biology; Plenum Press: New York, NY, USA, 1989. [Google Scholar]
- Ruiz-Fernandez, A.R.; Campos, L.; Gutierrez-Maldonado, S.E.; Nunez, G.; Villanelo, F.; Perez-Acle, T. Nanosecond pulsed electric field (nsPEF): Opening the biotechnological Pandora’s box. Int. J. Mol. Sci. 2022, 23, 6158. [Google Scholar] [CrossRef]
- Ozyigit, I.I. Gene transfer to plants by electroporation: Methods and applications. Mol. Biol. Rep. 2020, 47, 3195–3210. [Google Scholar] [CrossRef]
- Belehradek, M.; Domenge, C.; Luboinski, B.; Orlowski, S.; Belehradek, J., Jr.; Mir, L.M. Electrochemotherapy, a new antitumor treatment. First clinical phase I-II trial. Cancer 1993, 72, 3694–3700. [Google Scholar] [CrossRef]
- Muller, H.P.; Sprafke, A.; Neumann, E. Electroporative gene-transfer and mechanism of electropermeabilization. In Biological Chemistry Hoppe-Seyler; Walter De Gruyter & Co: Berlin, Germany, 1989; Volume 370, p. 626. [Google Scholar]
- Ruiz-Fernandez, A.R.; Rosemblatt, M.; Perez-Acle, T. Nanosecond pulsed electric field (nsPEF) and vaccines: A novel technique for the inactivation of SARS-CoV-2 and other viruses? Ann. Med. 2022, 54, 1749–1756. [Google Scholar] [CrossRef]
- Delemotte, L.; Tarek, M. Molecular dynamics simulations of lipid membrane electroporation. J. Membr. Biol. 2012, 245, 531–543. [Google Scholar] [CrossRef] [PubMed]
- Tarek, M. Atomistic simulations of electroporation of model cell membranes. In Transport across Natural and Modified Biological Membranes and Its Implications in Physiology and Therapy; Advances in Anatomy, Embryology and Cell Biology; Springer: Cham, Switzerland, 2017; Volume 227, pp. 1–15. [Google Scholar] [PubMed]
- Levine, Z.A.; Vernier, P.T. Life cycle of an electropore: Field-dependent and field-independent steps in pore creation and annihilation. J. Membr. Biol. 2010, 236, 27–36. [Google Scholar] [CrossRef]
- Melikov, K.C.; Frolov, V.A.; Shcherbakov, A.; Samsonov, A.V.; Chizmadzhev, Y.A.; Chernomordik, L.V. Voltage-induced nonconductive pre-pores and metastable single pores in unmodified planar lipid bilayer. Biophys. J. 2001, 80, 1829–1836. [Google Scholar] [CrossRef]
- Sengel, J.T.; Wallace, M.I. Imaging the dynamics of individual electropores. Proc. Natl. Acad. Sci. USA 2016, 113, 5281–5286. [Google Scholar] [CrossRef]
- Sabri, E.; Aleksanyan, M.; Brosseau, C.; Dimova, R. Effects of solution conductivity on macropore size dynamics in electroporated lipid vesicle membranes. Bioelectrochemistry 2022, 147, 108222. [Google Scholar] [CrossRef]
- Dimova, R.; Riske, K.A.; Aranda, S.; Bezlyepkina, N.; Knorr, R.L.; Lipowsky, R. Giant vesicles in electric fields. Soft Matter 2007, 3, 817–827. [Google Scholar] [CrossRef] [PubMed]
- Tsong, T.Y. Electrical modulation of membrane-proteins—Enforced conformational oscillations and biological energy and signal transductions. Annu. Rev. Biophys. Biophys. Chem. 1990, 19, 83–106. [Google Scholar] [CrossRef] [PubMed]
- Delemotte, L.; Treptow, W.; Klein, M.L.; Tarek, M. Effect of sensor domain mutations on the properties of voltage-gated ion channels molecular dynamics studies of the potassium channel Kv1 2. Biophys. J. 2010, 99, 3859. [Google Scholar] [CrossRef]
- Tombola, F.; Pathak, M.M.; Isacoff, E.Y. Voltage-sensing arginines in a potassium channel permeate and occlude cation-selective pores. Neuron 2005, 45, 379–388. [Google Scholar] [CrossRef]
- Sokolov, S.; Scheuer, T.; Catterall, W.A. Ion permeation through a voltage-sensitive gating pore in brain sodium channels having voltage sensor mutations. Neuron 2005, 47, 183–189. [Google Scholar] [CrossRef] [PubMed]
- Rems, L.; Kasimova, M.A.; Testa, I.; Delemotte, L. Pulsed electric fields can create pores in the voltage sensors of voltage-gated ion channels. Biophys. J. 2020, 119, 190–205. [Google Scholar] [CrossRef] [PubMed]
- Ruiz-Fernandez, A.R.; Campos, L.; Villanelo, F.; Gutierrez-Maldonado, S.E.; Perez-Acle, T. Exploring the conformational changes induced by nanosecond pulsed electric fields on the voltage sensing domain of a Ca2+ channel. Membranes 2021, 11, 473. [Google Scholar] [CrossRef] [PubMed]
- Marracino, P.; Bernardi, M.; Liberti, M.; Del Signore, F.; Trapani, E.; Garate, J.A.; Burnham, C.J.; Apollonio, F.; English, N.J. Transprotein-electropore characterization: A molecular dynamics investigation on human AQP4. ACS Omega 2018, 3, 15361–15369. [Google Scholar] [CrossRef] [PubMed]
- Nesin, V.; Bowman, A.M.; Xiao, S.; Pakhomov, A.G. Cell permeabilization and inhibition of voltage-gated Ca2+ and Na+ channel currents by nanosecond pulsed electric field. Bioelectromagnetics 2012, 33, 394–404. [Google Scholar] [CrossRef]
- Yang, L.; Pierce, S.; Chatterjee, I.; Craviso, G.L.; Leblanc, N. Paradoxical effects on voltage-gated Na+ conductance in adrenal chromaffin cells by twin vs single high intensity nanosecond electric pulses. PLoS ONE 2020, 15, e0234114. [Google Scholar] [CrossRef]
- Yang, L.; Craviso, G.L.; Vernier, P.T.; Chatterjee, I.; Leblanc, N. Nanosecond electric pulses differentially affect inward and outward currents in patch clamped adrenal chromaffin cells. PLoS ONE 2017, 12, e0181002. [Google Scholar] [CrossRef]
- Nesin, V.; Pakhomov, A.G. Inhibition of voltage-gated Na+ current by nanosecond pulsed electric field (nsPEF) is not mediated by Na+ influx or Ca2+ signaling. Bioelectromagnetics 2012, 33, 443–451. [Google Scholar] [CrossRef] [PubMed]
- Pakhomov, A.G.; Pakhomova, O.N. Nanopores: A distinct transmembrane passageway in electroporated cells. In Advanced Electroporation Techniques in Biology in Medicine; Pakhomov, A.G., Miklavcic, D., Markov, M.S., Eds.; CRC Press: Boca Raton, FL, USA, 2010; pp. 178–194. [Google Scholar]
- Pakhomov, A.G.; Bowman, A.M.; Ibey, B.L.; Andre, F.M.; Pakhomova, O.N.; Schoenbach, K.H. Lipid nanopores can form a stable, ion channel-like conduction pathway in cell membrane. Biochem. Biophys. Res. Commun. 2009, 385, 181–186. [Google Scholar] [CrossRef]
- Ibey, B.L.; Mixon, D.G.; Payne, J.A.; Bowman, A.; Sickendick, K.; Wilmink, G.J.; Roach, W.P.; Pakhomov, A.G. Plasma membrane permeabilization by trains of ultrashort electric pulses. Bioelectrochemistry 2010, 79, 114–121. [Google Scholar] [CrossRef]
- Hristov, K.; Mangalanathan, U.; Casciola, M.; Pakhomova, O.N.; Pakhomov, A.G. Expression of voltage-gated calcium channels augments cell susceptibility to membrane disruption by nanosecond pulsed electric field. Biochim. Biophys. Acta (BBA) Biomembr. 2018, 1860, 2175–2183. [Google Scholar] [CrossRef]
- Pakhomov, A.G.; Gianulis, E.; Vernier, P.T.; Semenov, I.; Xiao, S.; Pakhomova, O.N. Multiple nanosecond electric pulses increase the number but not the size of long-lived nanopores in the cell membrane. Biochim. Biophys. Acta (BBA) Biomembr. 2015, 1848, 958–966. [Google Scholar] [CrossRef]
- Pakhomova, O.N.; Gregory, B.; Semenov, I.; Pakhomov, A.G. Calcium-mediated pore expansion and cell death following nanoelectroporation. Biochim. Biophys. Acta (BBA) Biomembr. 2014, 1838, 2547–2554. [Google Scholar] [CrossRef] [PubMed]
- Zhang, X.D. A method for effectively comparing gene effects in multiple conditions in RNAi and expression-profiling research. Pharmacogenomics 2009, 10, 345–358. [Google Scholar] [CrossRef]
- Zhang, X.D. Illustration of SSMD, z score, SSMD*, z* score, and t statistic for hit selection in RNAi high-throughput screens. J. Biomol. Screen. 2011, 16, 775–785. [Google Scholar] [CrossRef] [PubMed]
- Ibey, B.L.; Roth, C.C.; Pakhomov, A.G.; Bernhard, J.A.; Wilmink, G.J.; Pakhomova, O.N. Dose-dependent thresholds of 10-ns electric pulse induced plasma membrane disruption and cytotoxicity in multiple cell lines. PLoS ONE 2011, 6, e15642. [Google Scholar] [CrossRef] [PubMed]
- Ibey, B.L.; Pakhomov, A.G.; Gregory, B.W.; Khorokhorina, V.A.; Roth, C.C.; Rassokhin, M.A.; Bernhard, J.A.; Wilmink, G.J.; Pakhomova, O.N. Selective cytotoxicity of intense nanosecond-duration electric pulses in mammalian cells. Biochim. Biophys. Acta (BBA)-Gen. Subj. 2010, 1800, 1210–1219. [Google Scholar] [CrossRef]
- Gianulis, E.C.; Labib, C.; Saulis, G.; Novickij, V.; Pakhomova, O.N.; Pakhomov, A.G. Selective susceptibility to nanosecond pulsed electric field (nsPEF) across different human cell types. Cell. Mol. Life Sci. 2017, 74, 1741–1754. [Google Scholar] [CrossRef]
- Hruz, T.; Laule, O.; Szabo, G.; Wessendorp, F.; Bleuler, S.; Oertle, L.; Widmayer, P.; Gruissem, W.; Zimmermann, P. Genevestigator v3: A reference expression database for the meta-analysis of transcriptomes. Adv. Bioinform. 2008, 2008, 420747. [Google Scholar] [CrossRef]
- Mutchler, S.M.; Kleyman, T.R. New insights regarding epithelial Na+ channel regulation and its role in the kidney, immune system and vasculature. Curr. Opin. Nephrol. Hypertens. 2019, 28, 113–119. [Google Scholar] [CrossRef]
- Hu, D.; Ansari, D.; Bauden, M.; Zhou, Q.; Andersson, R. The Emerging Role of Calcium-activated Chloride Channel Regulator 1 in Cancer. Anticancer Res. 2019, 39, 1661–1666. [Google Scholar] [CrossRef]
- Sala-Rabanal, M.; Yurtsever, Z.; Nichols, C.G.; Brett, T.J. Secreted CLCA1 modulates TMEM16A to activate Ca2+-dependent chloride currents in human cells. Elife 2015, 4, e05875. [Google Scholar] [CrossRef] [PubMed]
- Yang, H.; Wu, J.J.; Tang, T.; Liu, K.D.; Dai, C. CRISPR/Cas9-mediated genome editing efficiently creates specific mutations at multiple loci using one sgRNA in Brassica napus. Sci. Rep. 2017, 7, 7489. [Google Scholar] [CrossRef] [PubMed]
- Andersson-Rolf, A.; Merenda, A.; Mustata, R.C.; Li, T.; Dietmann, S.; Koo, B.K. Simultaneous paralogue knockout using a CRISPR-concatemer in mouse small intestinal organoids. Dev. Biol. 2016, 420, 271–277. [Google Scholar] [CrossRef]
- Muratori, C.; Pakhomov, A.G.; Gianulis, E.; Meads, J.; Casciola, M.; Mollica, P.A.; Pakhomova, O.N. Activation of the phospholipid scramblase TMEM16F by nanosecond pulsed electric fields (nsPEF) facilitates its diverse cytophysiological effects. J. Biol. Chem. 2017, 292, 19381–19391. [Google Scholar] [CrossRef] [PubMed]
- Ibey, B.L.; Xiao, S.; Schoenbach, K.H.; Murphy, M.R.; Pakhomov, A.G. Plasma membrane permeabilization by 60- and 600-ns electric pulses is determined by the absorbed dose. Bioelectromagnetics 2009, 30, 92–99. [Google Scholar] [CrossRef] [PubMed]
- Dunnett, C.W. A multiple comparison procedure for comparing several treatments with a control. J. Am. Stat. Assoc. 1955, 50, 1096–1121. [Google Scholar] [CrossRef]


Disclaimer/Publisher’s Note: The statements, opinions and data contained in all publications are solely those of the individual author(s) and contributor(s) and not of MDPI and/or the editor(s). MDPI and/or the editor(s) disclaim responsibility for any injury to people or property resulting from any ideas, methods, instructions or products referred to in the content. |
© 2023 by the authors. Licensee MDPI, Basel, Switzerland. This article is an open access article distributed under the terms and conditions of the Creative Commons Attribution (CC BY) license (https://creativecommons.org/licenses/by/4.0/).
Share and Cite
Silkuniene, G.; Mangalanathan, U.M.; Rossi, A.; Mollica, P.A.; Pakhomov, A.G.; Pakhomova, O. Identification of Proteins Involved in Cell Membrane Permeabilization by Nanosecond Electric Pulses (nsEP). Int. J. Mol. Sci. 2023, 24, 9191. https://doi.org/10.3390/ijms24119191
Silkuniene G, Mangalanathan UM, Rossi A, Mollica PA, Pakhomov AG, Pakhomova O. Identification of Proteins Involved in Cell Membrane Permeabilization by Nanosecond Electric Pulses (nsEP). International Journal of Molecular Sciences. 2023; 24(11):9191. https://doi.org/10.3390/ijms24119191
Chicago/Turabian StyleSilkuniene, Giedre, Uma M. Mangalanathan, Alessandra Rossi, Peter A. Mollica, Andrei G. Pakhomov, and Olga Pakhomova. 2023. "Identification of Proteins Involved in Cell Membrane Permeabilization by Nanosecond Electric Pulses (nsEP)" International Journal of Molecular Sciences 24, no. 11: 9191. https://doi.org/10.3390/ijms24119191
APA StyleSilkuniene, G., Mangalanathan, U. M., Rossi, A., Mollica, P. A., Pakhomov, A. G., & Pakhomova, O. (2023). Identification of Proteins Involved in Cell Membrane Permeabilization by Nanosecond Electric Pulses (nsEP). International Journal of Molecular Sciences, 24(11), 9191. https://doi.org/10.3390/ijms24119191