Article

Chronic Kidney Disease Induced by Cadmium and Diabetes: A Quantitative Case-Control Study

by
Supabhorn Yimthiang
1,
David A. Vesey
2,3,
Phisit Pouyfung
1,
Tanaporn Khamphaya
1,
Glenda C. Gobe
2,4,5 and
Soisungwan Satarug
2,*
1
Occupational Health and Safety, School of Public Health, Walailak University, Nakhon Si Thammarat 80160, Thailand
2
The Centre for Kidney Disease Research, Translational Research Institute, Brisbane 4102, Australia
3
Department of Kidney and Transplant Services, Princess Alexandra Hospital, Brisbane 4102, Australia
4
School of Biomedical Sciences, The University of Queensland, Brisbane 4072, Australia
5
NHMRC Centre of Research Excellence for CKD QLD, UQ Health Sciences, Royal Brisbane and Women’s Hospital, Brisbane 4029, Australia
*
Author to whom correspondence should be addressed.
Int. J. Mol. Sci. 2023, 24(10), 9050; https://doi.org/10.3390/ijms24109050
Submission received: 27 April 2023 / Revised: 18 May 2023 / Accepted: 20 May 2023 / Published: 20 May 2023
(This article belongs to the Special Issue Mechanisms of Heavy Metal Toxicity 2.0)

Abstract

:
Kidney disease associated with chronic cadmium (Cd) exposure is primarily due to proximal tubule cell damage. This results in a sustained decline in glomerular filtration rate (GFR) and tubular proteinuria. Similarly, diabetic kidney disease (DKD) is marked by albuminuria and a declining GFR and both may eventually lead to kidney failure. The progression to kidney disease in diabetics exposed to Cd has rarely been reported. Herein, we assessed Cd exposure and the severity of tubular proteinuria and albuminuria in 88 diabetics and 88 controls, matched by age, gender and locality. The overall mean blood and Cd excretion normalized to creatinine clearance (Ccr) as ECd/Ccr were 0.59 µg/L and 0.0084 µg/L filtrate (0.96 µg/g creatinine), respectively. Tubular dysfunction, assessed by β2-microglobulin excretion rate normalized to Ccr(Eβ2M/Ccr) was associated with both diabetes and Cd exposure. Doubling of Cd body burden, hypertension and a reduced estimated GFR (eGFR) increased the risks for a severe tubular dysfunction by 1.3-fold, 2.6-fold, and 84-fold, respectively. Albuminuria did not show a significant association with ECd/Ccr, but hypertension and eGFR did. Hypertension and a reduced eGFR were associated with a 3-fold and 4-fold increases in risk of albuminuria. These findings suggest that even low levels of Cd exposure exacerbate progression of kidney disease in diabetics.

1. Introduction

Cadmium (Cd) is a toxic metal pollutant of global public health concern because even low environmental exposure to this metal promotes high prevalence of diseases, such as chronic kidney disease (CKD) and type 2 diabetes [1]. Prediabetes and diabetes are defined as fasting plasma glucose ≥ 110 mg/dL and 126 mg/dL, respectively. Evidence that environmental exposure to Cd raises fasting blood glucose is apparent from studies in many countries including the U.S. [2,3,4,5,6,7]. The Wuhan–Zhuhai prospective cohort study reported a particularly strong association between Cd exposure and pre-diabetes. Over 3-year period, it reported that for each tenfold increase in urinary Cd, the prevalence of prediabetes increased by 42% [5].
The global prevalence of diabetes, and its major complication, diabetic kidney disease (DKD), have reached epidemic proportions. Of note, DKD, marked by albuminuria and a rapid reduction in estimated glomerular filtration rate (eGFR) is the leading cause of kidney failure, (eGFR below 15 mL/min/1.73 m2), which requires dialysis or kidney transplantation for survival. In cross-sectional and prospective cohort studies of 231 diabetic patients in the Netherlands, both Cd and active smoking were associated with a progressive decline in eGFR [8,9]. These studies support the premise that exposure to even low levels of environmental Cd promote the development and progression of DKD.
Cd accumulates primarily in the proximal tubular epithelial cells of the kidneys, where the burden of Cd as µg/g kidney tissue weight increases with age [10,11]. Approximately 0.001–0.005% of Cd in the body is excreted in the urine each day, and the biological half-life of Cd in the kidney cortex is estimated to be 30 years for non-smokers [12]. Tubular proteinuria, indicated by an increase in the excretion of the low-molecular weight protein, β2-microglobulin (β2M) ≥ 300 µg/g creatinine has been used to indicate Cd-induced kidney disease for many decades [13]. It is noteworthy that exposure to environmental Cd has also been linked to a reduction eGFR in the general population [14,15,16], but reports of tubular proteinuria in people with diabetes who are exposed to Cd is limited. Of concern, data from the 1990 Belgian population study (Cadmibel) first suggested that people with diabetes were susceptible to Cd-induced nephrotoxicity [17]. Similar observations were then made in studies from Sweden [18,19], Australia [20], the U.S. [14], and Korea [21].
The present study aimed to evaluate the effects of diabetes and Cd exposure on kidney outcomes. Thus, we compared Cd exposure levels, tubular proteinuria, albuminuria, and the reduction of eGFR in diabetics and non-diabetics matched by age, gender and residential location. We used the excretion of Cd as a measure of long-term exposure, (body burden), and a sign of its nephrotoxicity. The utility of Cd excretion as an indicator of its toxicity to kidneys is based on a study showing that Cd excreted in complexes with metallothionein (MT) emanated from injured or dying kidney tubular epithelial cells [1,22]. We employed established equations of the Chronic Kidney Disease Epidemiology Collaboration (CKD-EPI) to compute the estimated GFR (eGFR) [23].
For the accurate quantification of the kidney burden of Cd and its effects, we normalized the excretion of Cd, albumin (Alb) and β2M (ECd, EAlb, and Eβ2M) to creatinine clearance (Ccr), denoted as ECd/Ccr, EAlb/Ccr and Eβ2M/Ccr, respectively [19,20]. This Ccr normalization depicts an amount of a given chemical excreted per volume of filtrate, which is at least roughly related to the amount of the chemical excreted per nephron. In effect, Ccr normalization is unaffected by creatinine excretion, but it corrects for differences in the number of surviving nephrons among study subjects [24].

2. Results

2.1. Characteristics of the Study Subjects

This case-control study consisted of 88 non-diabetics, and 88 diabetics of which 48 and 37 had diabetes for less than 10 years or more than 10 years, respectively (Table 1).
Cases and controls were matched by age, gender, and residential locality. The mean age and percentages (%) of females in cases and controls did not differ. The % smoking, hypertension, obesity, and a reduced eGFR across three groups did not differ. The mean BMI, mean blood Cd, mean ECd/Ccr, mean ECd/Ecr, and mean eGFR were similar in the three groups. The mean duration of diabetes in the <10-yr and ≥10-yr groups were 4.2 and 15.8 years, respectively.
Mean Eβ2M/Ccr, mean EAlb/Ccr were higher in cases than controls as was the % of microalbuminuria, defined as (EAlb/Ccr) × 100 ≥ 20 mg/L filtrate. The % of microalbuminuria was lowest in controls, middle in the <10-yr DM and highest in ≥10-year DM groups. The % of microalbuminuria was increased from 10.7% in controls to 33.3% and 45.7% in the <10-yr DM and ≥10-year DM groups, respectively. Macroalbuminuria was not found in controls, but was present in 11.4–13.3% of those with DM. The overall % of mild and severe tubular dysfunction, defined as (Eβ2M/Ccr) × 100 ≥ 300 and ≥1000 µg/L filtrate [25] were 66.2%, and 32.4%, respectively. More than half (57.7%) of the ≥10-DM group has severe tubular proteinuria.
Quantitative results obtained from Ecr-normalized and Ccr-normalized data were similar with respective to mean ECd/Ecr, mean Eβ2M/Ecr and men EAlb/Ecr. However, the Ecr-normalized data gave lower % of microalbuminuria and macroalbuminuria in controls and diabetics, compared to Ccr-normalized data. The overall % of mild and severe tubular dysfunction, defined as Eβ2M/Ecr ≥ 300 and ≥1000 µg/g creatinine [26,27] were 70.5%, and 37.4%, respectively. More than half (65.5%) of the ≥10-DM group has severe tubular defect.

2.2. Independent Associations of Cadmium and Diabetes with Measurement of Kidney Function

We next undertook multivariate analyses to evaluate independent associations of Cd and diabetes with quantitative kidney tubular and glomerular functions reflected by the β2M excretion rate, Alb excretion rate and eGFR. A set of eight independent variables incorporated into the regression model included age, BMI, log10[Cd]b, log2[(ECd/Ccr) × 105], smoking, gender, hypertension, and diabetes (Table 2).
Eight independent variables together accounted for 33%, 17.1% and 14.1% of the variation in the β2M excretion rate (p < 0.001), Alb excretion rate (p = 0.001) and reduction in eGFR (p = 0.001). The excretion rate of β2M as log[(Eβ2M/Ccr) × 103] was associated with age (β = 0.164), urine Cd (β = 0.244) and diabetes (β = 0.432). The other 5 independent variables did not show a significant association with the β2M excretion. The excretion rate of Alb as log [(EAlb/Ccr) × 104] was associated with hypertension (β = 0.259), and diabetes (β = 0.286). In contrast, eGFR was inversely associated with age (β = −0.357) only.

2.3. Effects of Cadmium and Diabetes on Risks of Adverse Kidney Outcomes

We used multivariable logistic regression to determine the prevalence odds ratios (POR) for three adverse kidney outcomes associated with Cd and duration of diabetes. The adverse outcomes of kidney function assessed were a defective tubular re-absorption of β2M, microalbuminuria, and a reduced eGFR, indicated by (Eβ2M/Ccr) × 100 ≥ 300 µg/L, (EAlb/Ccr) × 100 ≥ 20 mg/L, and eGFR ≤ 60 mL/min/1.73 m2, respectively (Table 3).
Age, log2[(ECd/Ccr) × 105] and ≥10-y DM duration were associated with increased risk of tubular dysfunction. Per a 1-year increase in age and doubling urine Cd, the POR for tubular dysfunction rose by 6% (p = 0.029), and 26% (p = 0.044) respectively. Compared to controls, the POR for tubular dysfunction was increased by 4-fold in the ≥10-yr DM group (p = 0.036). The POR for microalbuminuria was associated only with DM duration, where there was a 6.142 (95% CI: 2.004, 18.83, p = 0.001) in those who had DM ≥10 years, compared to controls. The POR for a reduced eGFR was increased by 14.7% (p = 0.029) per a 1-year increase in age (p = 0.001). There was a 6.9-fold (p = 0.009) increase in POR for reduced eGFR in the ≥10 yr-DM group (p = 0.009).

2.4. Quantitation of Effects of Cadmium and Diabetes on Kidney Tubular Reabsorption of β2M

Doubling of Cd body burden and hypertension increased the POR for a severe tubular dysfunction to 1.317 and 2.621, respectively, while eGFR levels of 61−89 and ≤60 mL/min/1.73 m2 were associated with increases in the POR for a severe tubular proteinuria by 14-fold and 84-fold, compared with eGFR ≥ 90 mL/min/1.73 m2 (Table 4).
We further evaluated the effects of Cd and diabetes by scatterplots and covariance analyses, where the mean β2M excretion rates were derived for controls and diabetics adjusted for covariates. Results of these quantitative effect investigations are provided in Figure 1.
Log [(Eβ2M/Ccr) × 103] showed a moderate positive association with Cd body burden measured as log [(ECd/Ccr) × 105] in controls (R2 = 0.151) and diabetics (R2 = 0.110) (Figure 1a). Data from a covariance analysis confirms a dose-effect relationship between β2M excretion rate and Cd body burden in both control and DM groups (Figure 1b). After adjustment for age, BMI and interactions, Cd body burden accounted for 12.2% and 17.3% of the variation β2M excretion rate in control and DM groups, respectively.
Equivalent covariance analysis of Alb excretion rate and eGFR indicate that the associations of these two parameters with Cd body burden were insignificant.

2.5. Quantitation of Effects of GFR on Microalbuminuria

An overall effect of GFR on microalbuminuria was assessed by a logistic regression analysis, where eGFR was categorized into three levels; ≥90, 61−89, ≤60 mL/min/1.73 m2. Among eight independent variables, only hypertension and eGFR levels were associated with the increment of POR for microalbuminuria.
The POR values for albuminuria increased by 3.3-, 4.5- and 4.6-fold in those with hypertension and groups with eGFR 61−89, and ≤60 mL/min/1.73 m2 (Table 5).
The relationships between eGFR excretion of β2M and Alb were assessed with scatterplots and covariance analyses. In these investigations, we compared mean β2M excretion and mean Alb excretion rates in controls and diabetics with adjustment for age, BMI and interaction. Results are provided in Figure 2.
Log[(Eβ2M/Ccr) × 103] showed a moderate inverse association with eGFR in controls (R2 = 0.216), while showing a strong inverse association with eGFR in diabetics (R2 = 0.461) (Figure 2a). A covariance analysis showed a dose-effect relationship between β2M excretion rate and eGFR in both control and DM groups (Figure 2b). After adjustment for age, BMI and interactions, eGFR accounted for 37.6% and 42.6% of the variation β2M excretion rate in control and DM groups, respectively.
Log [(EAlb/Ccr) × 104] was inversely associated with eGFR only in the DM group (R2 = 0.197) in bivariate analysis (Figure 2c). However, after adjustment for age, BMI and interactions, the relationship between Alb excretion rate and eGFR in the DM group became insignificant (Figure 2d).

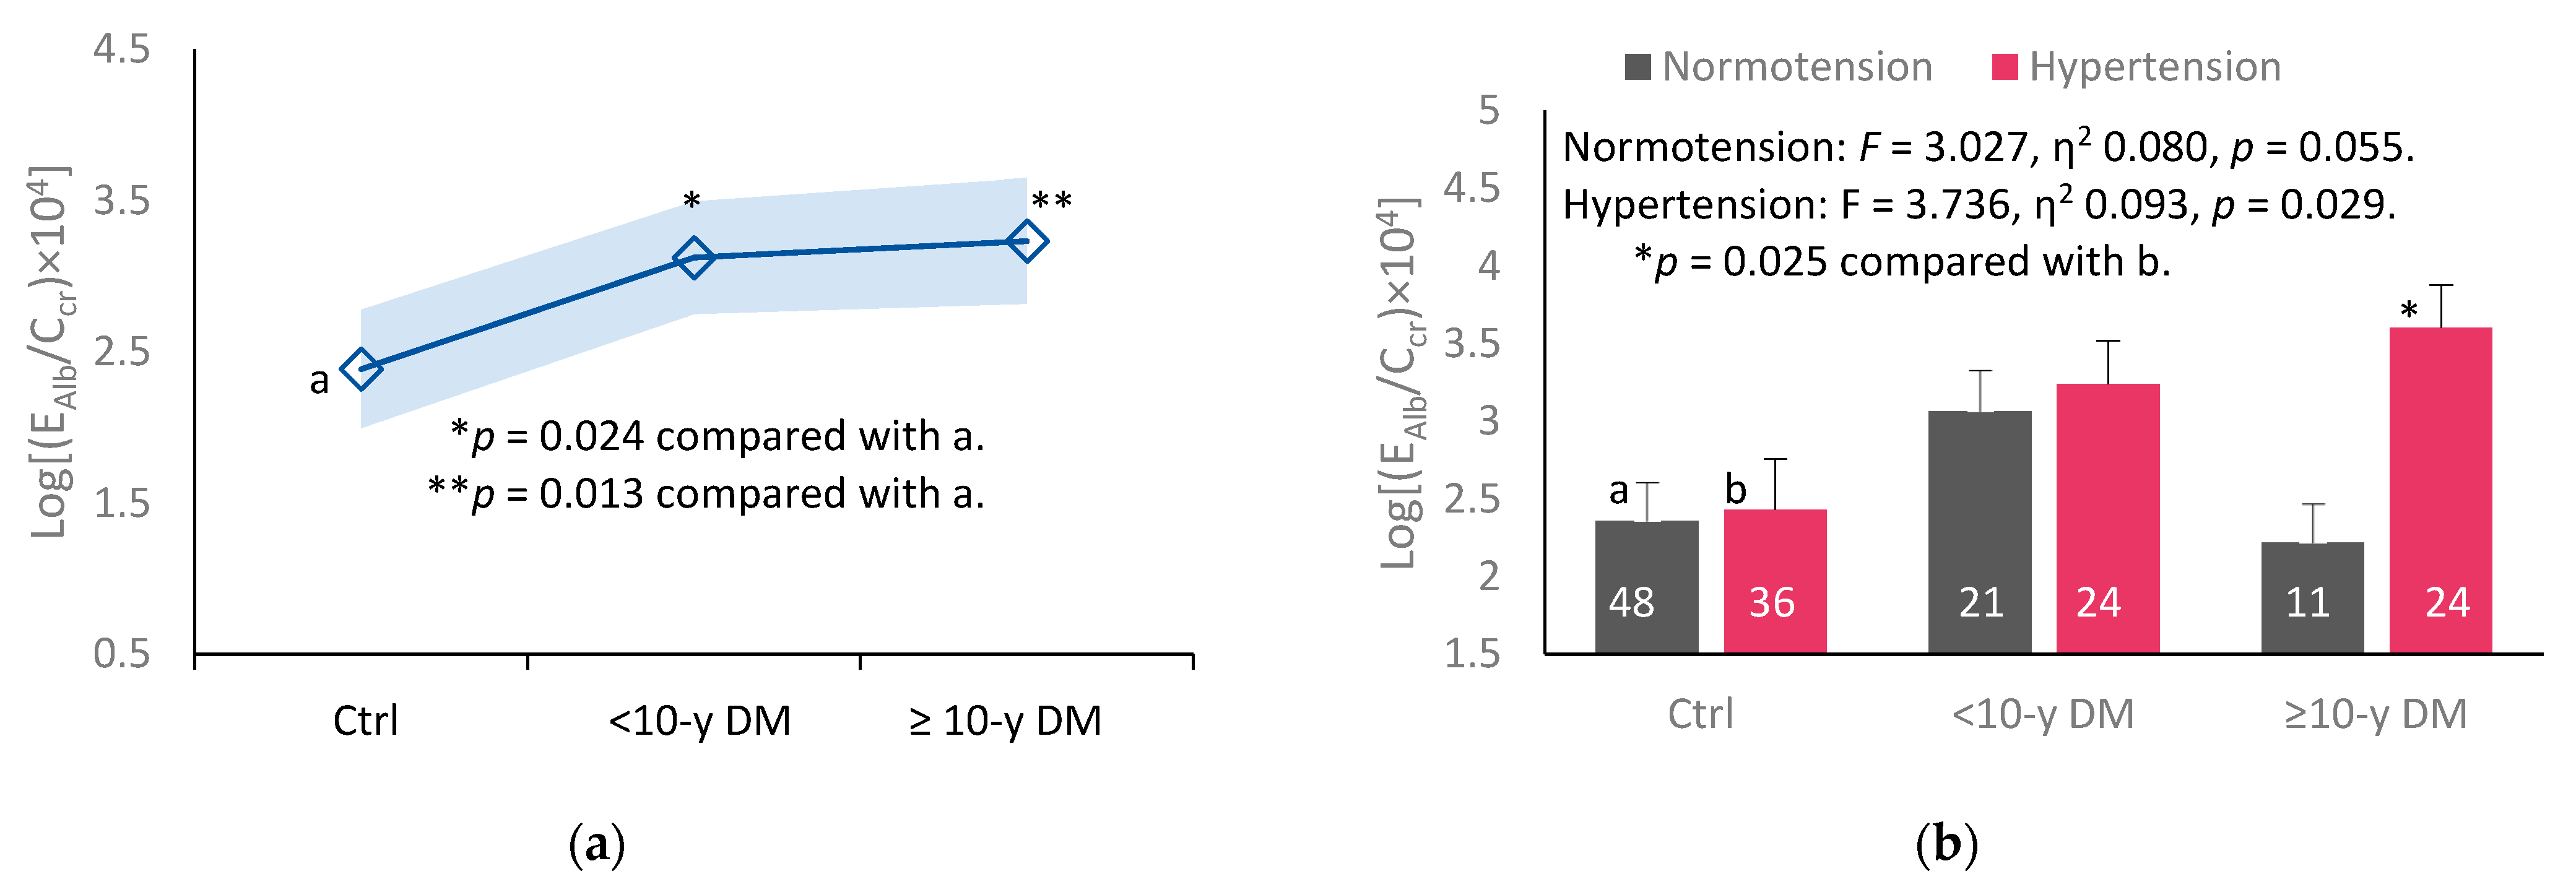
2.6. Quantification of Effects of Diabetes Duration and Hypertension on Alb Excretion Rate

To assess effects of duration of diabetes and hypertension, we compared mean Alb excretion rates in controls, <10-yr DM, and ≥10-y DM groups two diabetics. Results are provided in Figure 3.
The mean values of log[(EAlb/Ccr) × 104] were higher the <10-y and the ≥10-y DM groups, compared to controls (Figure 3a). After adjustment for covariates and interaction, mean log[(EAlb/Ccr) × 104] was higher in ≥10-y DM with hypertension than the hypertensive only control group.

3. Discussion

Environmental Cd exposure experienced by the diabetic and the non-diabetic groups could be considered as low to moderate, evident from the arithmetic means (SD) for blood Cd, ECd/Ccr and ECd/Ecr of 0.59 (0.74) µg/L, 0.0084 (0.0166) µg/L filtrate and 0.96 (1.83) µg/g creatinine respectively. However, these low environmental Cd exposures are associated an adverse outcome (tubular proteinuria) in both diabetic and non-diabetic control groups (Table 2 and Table 3). The risk of tubular proteinuria was increased by 26% (p = 0.044) per doubling of ECd/Ccr, an indicator of cumulative lifetime exposure or body burden. This pathologic outcome was increased by 4-fold in the diabetic group with an average duration of 15 years (p = 0.036, Table 3).
The percentage of a reduced eGFR in controls, <10-y DM and ≥10-y DM groups were 11.4%, 14.6% and 27.0%, respectively (Table 1). The prevalence of a reduced eGFR in the controls of 11.4% is higher than that reported in studies from Spain (7%) [28] and Taiwan (6.3%) [29], but in line with the global prevalence of CKD, which varies between 8% and 16% [30]. None of diabetic cases with reduced eGFR received special treatments other than antidiabetic medication (metformin). Due to a uniform treatment and uniform Cd exposure levels evident from the similar blood and urinary excretion rate across three groups, the higher number of cases with a reduced eGFR in the >10-y DM, compared with the < 10-y DM groups could be attributable to Cd and diabetes.
Evidence linking tubulopathy due to Cd accumulation and diabetes comes from covariance analyses (Figure 1), where a dose-effect relationship between Eβ2M/Ccr and ECd/Ccr was seen in both controls and diabetics. Approximately 12% and 17% of the variation in Eβ2M/Ccr among non-diabetics and diabetics were attributed to Cd after adjustment for age, BMI and interactions. Thus, diabetes may have contributed to 5% of the of the Eβ2M/Ccr variation while another 12% was due to Cd. The mean Eβ2M/Ccr in the diabetics of the high ECd/Ccr tertile was higher, compared to those in the lowest tertile (Figure 1b).
As scatterplots indicated, an inverse relationship between eGFR and Eβ2M/Ccr was particularly strong in the diabetics (R2 = 0.461) than controls (R2 = 0.216) (Figure 2a). An analysis with adjustment for covariates has revealed that 42.6% of Eβ2M/Ccr variation among the diabetics was attributable to the decrease of eGFR. This is a large proportion of the Eβ2M/Ccr variation that was explained by a single variable (eGFR). In the non-diabetic control group, eGFR explained 37.6% of the variation in β2M excretion rate. Thus, an inverse relationship between Eβ2M/Ccr and eGFR was universal.
A strong influence of eGFR levels on Eβ2M/Ccr was indicated also in a logistic regression analysis (Table 4), where a reduced eGFR (≤60 mL/min/1.73 m2) was associated with an 84-fold increase in risk for a severe tubular proteinuria, defined as (Eβ2M/Ccr) × 100 ≥ 1000 µg/L filtrate. The risk of this tubular functional defect was increased by 14-fold in those with eGFR values ranging between 61−89 mL/min/1.73 m2, compared with eGFR ≥ 90 mL/min/1.73 m2.
The protein β2M has a molecular weight in low range (11,800 Da), and is thus filtered freely by the glomeruli, and is reabsorbed almost completely by the kidney’s tubular epithelial cells [13]. Excessive β2M excretion has most frequently been interpreted to be a result of defective tubular re-absorption of proteins from the ultrafiltrate [13,31,32,33]. It is noteworthy, however, that an enhanced β2M excretion can also be a consequence of nephron loss for any reasons [13,33]. When the reabsorption rate of β2M per nephron remains constant, its excretion will vary directly with its production. If the production and reabsorption per nephron remain constant as nephrons are lost, the excretion of β2M will rise [34]. Accordingly, a severe tubular proteinuria, which was 84-fold more prevalent in those with a reduced eGFR could be a consequence of nephron loss due to both Cd and diabetes.
Albumin is not normally filtered by glomeruli, due to its large molecular weight and its negative charge. The small amount of albumin which does enter the urinary space is reabsorbed almost completely and a fraction of this is returned to the systemic circulation [35,36]. In an experimental study, Cd was found to disable the cubilin/megalin receptor system of albumin endocytosis, leading to albuminuria [37]. In addition, Cd diminished expression of megalin and ClC5 channels [38]. Cd may also increase glomerular permeability to albumin, as shown in another study, where a non-cytotoxic concentration of Cd (1 µM) increased the permeability of human renal glomerular endothelial cells in monolayers and caused the redistribution of the adherens junction proteins, vascular endothelial-cadherin and β-catenin [39,40].
Like β2M, the risk of albuminuria was increased as eGFR fell. Compared with eGFR ≥ 90 mL/min/1.73 m2, the risk of albuminuria was increased by 4.5-fold and 4.6-fold in those with eGFR 61−89, and ≤60 mL/min/1.73 m2, respectively (Table 5). However, unlike the excretion rate of β2M, EAlb/Ccr did not show a significant inverse associated with eGFR (Figure 2d), thereby suggesting a specific effect of diabetes. This is consistent with the literature reports suggesting that diabetes may cause injury to podocytes and the glomerular endothelial cells [41,42].
Hypertension was another risk factor for albuminuria in addition to eGFR reduction (Table 5). This was strengthened a covariance analysis with control for age and BMI, which showed higher mean EAlb/Ccr in those who had diabetes ≥ 10 years plus hypertension, compared to those with diabetes only (Figure 2c). Of relevance, a study of the indigenous population of the Torres Strait (Australia), where diabetes was highly prevalent, observed a strong association of ECd/Ecr and albuminuria after controlling for age, gender, BMI, smoking status, and hypertension [20]. In the same study, age- and BMI- adjusted ECd/Ecr was higher in people with diabetes plus albuminuria (1.91 μg/g creatinine), compared to those with diabetes without albuminuria (0.74 μg/g creatinine).
It is noteworthy that Cd exposure quantified with blood Cd, an indicator of exposures within the last three months [43], did not show a significant association with tubular proteinuria, albuminuria or a reduced eGFR in the present study (Table 2 and Table 3). This may have been due to a narrow range of both age and blood Cd levels, often encountered when the sample size is modest (n = 176). Indeed, blood Cd in ranges with participants in our study have been found to be associated with increases in risk of adverse kidney outcomes in other studies using a large samples size. For example, blood Cd levels ≥ 0.61 μg/L were associated with 1.8- and 2.2-fold increases in risk of a reduced eGFR and albuminuria in participants of the U.S. National Health and Nutrition Examination Survey (NHANES 2007–2012, n = 12,577) [14]. Cd-induced eGFR reduction was more pronounced in those with diabetes, hypertension or both [14]. Blood Cd levels ≥ 0.53 μg/L were associated, respectively with 2.21- and 2.04-fold increases in the risk of a reduced eGFR and albuminuria among participants in the U.S. NHANES 2011–2012 (n = 1545) [15]. Of a total 262 chemicals tested, blood Cd was associated with a reduced GFR, albuminuria, and a reduced GFR plus albuminuria among U.S. adults enrolled in NHANES 1999–2016 (n = 46,748) [44].
Both blood Cd and ECd/Ecr have been linked to increased risk of albuminuria among those enrolled in NHANES 1999–2006 (n = 5426), where a 63% increase in risk of albuminuria was associated with ECd/Ecr > 1 µg/g creatinine plus blood Cd > 1 µg/L, and a 48% increase in risk of a reduced eGFR was associated with blood Cd levels > 1 µg/L [16]. The reductions in eGFR due to Cd nephropathy have previously been attributed to glomerular injury. However, current evidence suggests that sufficient tubular cell injury disables glomerular filtration and leads to nephron atrophy, glomerulosclerosis, and interstitial inflammation and fibrosis [45,46,47]. In a histopathological examination of kidney biopsies from healthy kidney transplant donors [48], the degree of tubular atrophy was positively associated with the level of Cd accumulation. Tubular atrophy was observed at relatively low Cd levels [48].
The results of the present study have implicated Cd exposure in the pathogenesis of tubular proteinuria in both non-diabetic and diabetic groups. This tubular proteinuria was indicated by excessive excretion of the low molecular weight filterable protein, β2M is inversely associated with eGFR. In a previous study [49], an inverse association between eGFR and Eβ2M was evident in people with low GFR (β = −0.332), but not in those with GFR >90 mL/min/1.73 m2 (β = −0.008). These data suggested Cd-induced nephron loss and reduced tubular reabsorption of β2M.
Intriguingly, in a Japanese prospective cohort study, tubular proteinuria (Eβ2M/Ecr ≥ 300 μg/g creatinine) was associated a 79% increased risk of a large decline eGFR (10 mL/min/1.73 m2) over a 5-year period [50]. An increase of Eβ2M/Ecr from 84.5 to ≥145 μg/g creatinine predicted hypertension [51]. In the general Japanese population, Eβ2M/Ecr combined with macroalbuminuria was a predictor of a high-rate of eGFR deterioration [52]. Among diabetic patients, those with a DM duration ≥15 years plus hypertension had a high-to-very high risk of CKD progression [53]. Data from the Framingham Heart Study (n = 7065) have linked higher plasma β2M levels to an increased risk of prevalent and incident hypertension [54]. These data demonstrate that β2M could be of utility in early detection of serious outcomes. Given that the global prevalence of diabetes has reached epidemic proportions, research into β2M excretion as an early warning sign of diabetic complications is warranted.

4. Materials and Methods

4.1. Recruitment of Cases and Controls

Diabetic cases were recruited together with age- and gender-matched non-diabetic controls from the health promotion center of Pakpoon Municipality, Nakhon Si Thammarat Province, Thailand. It was undertaken during June 2020 to May 2021. The inclusion criteria were resident in the Pakpoon municipality, 40 years of age or older who were diagnosed with type 2 diabetes or were apparently healthy. The exclusion criteria were non-residents of Pakpoon municipality, pregnancy, breast-feeding, hospital record or physician’s diagnosis of an advanced chronic disease. All subjects were provided with details of study objectives, study procedures, benefits, and potential risks, and they all provided their written informed consents prior to participation. The sociodemographic data, education attainment, occupation, health status, family history of diabetes, and smoking status were obtained by structured interview questionnaires. Diabetes was defined as plasma glucose [Glc]p levels ≥ 126 mg/dL. Hypertension was defined as systolic blood pressure ≥ 140 mmHg, or diastolic blood pressure ≥ 90 mmHg. After excluding subjects with missing data, 176 subjects (88 diabetics and 88 apparently healthy, non-diabetic controls) were included in this study.

4.2. Blood and Urine Sampling and Analysis

Participants were requested to fast overnight, and the collection of blood and urine samples was carried out at a local health center of Pakpoon Municipality in the morning of the following day. For glucose assay, blood samples were collected in tubes containing fluoride as an inhibitor of glycolysis. Blood samples for Cd analysis were collected in separate tubes containing ethylene diamine tetra-acetic acid (EDTA) as an anticoagulant. The blood and urine samples were kept on ice and transported within 1 h to the laboratory of Walailak University, where plasma samples were prepared. Aliquots of urine, whole blood and plasma samples were stored at −80 °C for later analysis. Fasting plasma glucose concentrations ([Glc]p) were measured to ascertain diabetes diagnosis and diabetes free stage of controls. The assay of plasma concentration of glucose was based on colorimetry. Assays of creatinine in urine and plasma ([cr]u, [cr]p]) were based on the Jaffe reaction. Urine concentration of albumin ([Alb]u) was determined using an immunoturbidimetric method. The Beta-2 microglobulin matched ELISA antibody pair set, human (Sino Biological Inc., Wayne, PA, USA) was employed to determine urine concentration of β2M ([β2M]u) with the low detection limit of 3.13 pg/mL.

4.3. Quantiation of Cd in Blood and Urine Samples

Blood Cd concentration ([Cd]b, [Pb]b) was determined with the GBC System 5000 Graphite Furnace Atomic Absorption Spectrophotometer (GBC Scientific Equipment, Hampshire, IL, USA). Multielement standards were used to calibrate metal analysis (Merck KGaA, Darmstadt, Germany). Reference urine and whole blood metal control levels 1, 2, and 3 (Lyphocheck, Bio-Rad, Hercules, CA, USA) were used for quality control, analytical accuracy, and precision assurance. The analytical accuracy of metal detection was checked by an external quality assessment every 3 years. All test tubes, bottles, and pipettes used in metal analysis were acid-washed and rinsed thoroughly with deionized water. When a [Cd]b level was less than its detection limits, the concentration assign was the detection limit divided by the square root of 2 [55]. Sixty-one subjects (34.6%) had [Cd]b below the detection limit of 0.1 µg/L.

4.4. Normalization of ECd, Eβ2M and EAlb to Ecr and Ccr

Ex was normalized to Ecr as [x]u/[cr]u, where x = Cd; β2M or Alb; [x]u = urine concentration of x (mass/volume); and [cr]u = urine creatinine concentration (mg/dL). The ratio [x]u/[cr]u was expressed in μg/g of creatinine.
Ex was normalized to Ccr as Ex/Ccr = [x]u[cr]p/[cr]u, where x = Cd; β2M or Alb; [x]u = urine concentration of x (mass/volume); [cr]p = plasma creatinine concentration (mg/dL); and [cr]u = urine creatinine concentration (mg/dL). Ex/Ccr was expressed as the excretion of x per volume of filtrate [24].

4.5. Estimated Glomerular Filtration Rates (eGFRs)

The GFR is the product of nephron number and mean single nephron GFR, and in theory, the GFR is indicative of nephron function [56,57,58]. In practice, the GFR is estimated from established chronic kidney disease–epidemiology collaboration (CKD-EPI) equations and is reported as eGFR [23,59].
Male eGFR = 141 × [plasma creatinine/0.9]Y × 0.993age, where Y = −0.411 if [cr]p ≤ 0.9 mg/dL, and Y = −1.209 if [cr]p > 0.9 mg/dL. Female eGFR = 144 × [plasma creatinine/0.7]Y × 0.993age, where Y = −0.329 if [cr]p ≤ 0.7 mg/dL, and Y = −1.209 if [cr]p > 0.7 mg/dL. For dichotomous comparisons, CKD was defined as eGFR ≤ 60 mL/min/1.73 m2. CKD stages 1, 2, 3a, 3b, 4, and 5 corresponded to eGFR of 90–119, 60–89, 45–59, 30–44, 15–29, and <15 mL/min/1.73 m2, respectively.

4.6. Statistical Analysis

Data were analyzed with IBM SPSS Statistics 21 (IBM Inc., New York, NY, USA). The Kruskal–Wallis test was used to assess differences in means among three groups, and the Pearson chi-squared test was used to assess differences in percentages. The one-sample Kolmogorov–Smirnov test was used to identify departures of continuous variables from a normal distribution, and logarithmic transformation was applied to variables that showed rightward skewing before they were subjected to parametric statistical analysis. The multivariable logistic regression analysis was used to determine the Prevalence Odds Ratio (POR) for categorical outcomes. Obesity was designated when BMI > 30 kg/m2. Reduced eGFR was assigned when eGFR ≤ 60 mL/min/1.73 m2.
For Ccr-normalized data, kidney tubular dysfunction was defined as (Eβ2M/Ccr) × 100 ≥ 300 µg/L of filtrate [25]. Microalbuminuria and macroalbuminuria were defined as (EAlb/Ccr) × 100 ≥ 20 and 200 mg/L of filtrate, respectively. For Ecr-normalized data, tubular proteinuria was defined as Eβ2M/Ecr ≥ 300 µg/g creatinine [26,27]. Microalbuminuria was defined as EAlb/Ecr ≥ 20 and ≥30 mg/g creatinine in men and women, respectively. Macroalbuminuria was assigned, when EAlb/Ecr > 300 mg/g creatinine. The mean β2M excretion rate and mean Alb excretion rate adjusted for age, BMI, and interaction in groups of subjects were obtained by univariate/covariance analysis with Bonferroni correction in multiple comparisons. For all tests, p-values ≤ 0.05 were considered to indicate statistical significance.

5. Conclusions

The present study shows that environmental exposure to Cd is one of the contributing factors to tubular proteinuria in people with and without diabetes. Chronic exposure to even low levels of environmental Cd contributes, at least in part to diabetic macroalbuminuria. The tubular proteinuria in people with diabetes who are also exposed to Cd is a manifestation of defective kidney tubular protein reabsorption and nephron loss.

Author Contributions

Conceptualization, S.Y. and S.S.; methodology, S.Y., P.P. and T.K.; formal analysis, S.Y., P.P. and S.S.; investigation, S.Y., P.P. and T.K.; resources, S.Y., D.A.V. and G.C.G.; original draft preparation, S.Y. and S.S.; review and editing, D.A.V. and G.C.G. All authors have read and agreed to the published version of the manuscript.

Funding

This research was funded by the Research Grant, WU-IRG-63-026, Walailak University, Nakhon Si Thammarat Province, Thailand.

Institutional Review Board Statement

This study was conducted in accordance with the guidelines of the Declaration of Helsinki and approved by the Office of the Human Research Ethics Committee of Walailak University, Nakhon Si Thammarat Province, Thailand. Approval number WUEC-20-132-01, 28 May 2020.

Informed Consent Statement

All participants provided written informed consent.

Data Availability Statement

All data are contained within this article.

Acknowledgments

We thank the staff of Pakpoon Health Promoting Hospital, Pakpoon Municipality, Nakhon Si Thammarat Province, Thailand for their assistance with data collection.

Conflicts of Interest

The authors declare no conflict of interest.

References

  1. Satarug, S.; Vesey, D.A.; Gobe, G.C.; Phelps, K.R. Estimation of health risks associated with dietary cadmium exposure. Arch. Toxicol. 2023, 97, 329–358. [Google Scholar] [CrossRef] [PubMed]
  2. Schwartz, G.G.; Il’yasova, D.; Ivanova, A. Urinary cadmium, impaired fasting glucose, and diabetes in the NHANES III. Diabetes Care 2003, 26, 468–470. [Google Scholar] [CrossRef] [PubMed]
  3. Wallia, A.; Allen, N.B.; Badon, S.; El Muayed, M. Association between urinary cadmium levels and prediabetes in the NHANES 2005–2010 population. Int. J. Hyg. Environ. Health 2014, 217, 854–860. [Google Scholar] [CrossRef] [PubMed]
  4. Little, B.B.; Reilly, R.; Walsh, B.; Vu, G.T. Cadmium is associated with type 2 diabetes in a Superfund Site Lead Smelter Community in Dallas, Texas. Int. J. Environ. Res. Public Health 2020, 17, 4558. [Google Scholar] [CrossRef] [PubMed]
  5. Xiao, L.; Li, W.; Zhu, C.; Yang, S.; Zhou, M.; Wang, B.; Wang, X.; Wang, D.; Ma, J.; Zhou, Y.; et al. Cadmium exposure, fasting blood glucose changes, and type 2 diabetes mellitus: A longitudinal prospective study in China. Environ. Res. 2021, 192, 110259. [Google Scholar] [CrossRef]
  6. Guo, F.F.; Hu, Z.Y.; Li, B.Y.; Qin, L.Q.; Fu, C.; Yu, H.; Zhang, Z.L. Evaluation of the association between urinary cadmium levels below threshold limits and the risk of diabetes mellitus: A dose-response meta-analysis. Environ. Sci. Pollut. Res. Int. 2019, 26, 19272–19281. [Google Scholar] [CrossRef]
  7. Filippini, T.; Wise, L.A.; Vinceti, M. Cadmium exposure and risk of diabetes and prediabetes: A systematic review and dose-response meta-analysis. Environ. Int. 2022, 158, 106920. [Google Scholar] [CrossRef]
  8. Hagedoorn, I.J.M.; Gant, C.M.; Huizen, S.V.; Maatman, R.G.H.J.; Navis, G.; Bakker, S.J.L.; Laverman, G.D. Lifestyle-related exposure to cadmium and lead is associated with diabetic kidney disease. J. Clin. Med. 2020, 9, 2432. [Google Scholar] [CrossRef]
  9. Oosterwijk, M.M.; Hagedoorn, I.J.M.; Maatman, R.G.H.J.; Bakker, S.J.L.; Navis, G.; Laverman, G.D. Cadmium, active smoking and renal function deterioration in patients with type 2 diabetes. Nephrol. Dial. Transpl. 2023, 38, 876–883. [Google Scholar] [CrossRef]
  10. Satarug, S.; Baker, J.R.; Reilly, P.E.; Moore, M.R.; Williams, D.J. Cadmium levels in the lung, liver, kidney cortex, and urine samples from Australians without occupational exposure to metals. Arch. Environ. Health 2002, 57, 69–77. [Google Scholar] [CrossRef]
  11. Elinder, C.G.; Lind, B.; Kjellström, T.; Linnman, L.; Friberg, L. Cadmium in kidney cortex, liver, and pancreas from Swedish autopsies. Estimation of biological half time in kidney cortex, considering calorie intake and smoking habits. Arch. Environ. Health 1976, 31, 292–302. [Google Scholar] [CrossRef] [PubMed]
  12. Elinder, C.G.; Kjellstöm, T.; Lind, B.; Molander, M.L.; Silander, T. Cadmium concentrations in human liver, blood, and bile: Comparison with a metabolic model. Environ. Res. 1978, 17, 236–241. [Google Scholar] [CrossRef] [PubMed]
  13. Argyropoulos, C.P.; Chen, S.S.; Ng, Y.H.; Roumelioti, M.E.; Shaffi, K.; Singh, P.P.; Tzamaloukas, A.H. Rediscovering beta-2 microglobulin as a biomarker across the spectrum of kidney diseases. Front. Med. 2017, 4, 73. [Google Scholar] [CrossRef]
  14. Madrigal, J.M.; Ricardo, A.C.; Persky, V.; Turyk, M. Associations between blood cadmium concentration and kidney function in the U.S. population: Impact of sex, diabetes and hypertension. Environ. Res. 2018, 169, 180–188. [Google Scholar] [CrossRef]
  15. Lin, Y.S.; Ho, W.C.; Caffrey, J.L.; Sonawane, B. Low serum zinc is associated with elevated risk of cadmium nephrotoxicity. Environ. Res. 2014, 134, 33–38. [Google Scholar] [CrossRef] [PubMed]
  16. Ferraro, P.M.; Costanzi, S.; Naticchia, A.; Sturniolo, A.; Gambaro, G. Low level exposure to cadmium increases the risk of chronic kidney disease: Analysis of the NHANES 1999–2006. BMC Public Health 2010, 10, 304. [Google Scholar] [CrossRef]
  17. Buchet, J.P.; Lauwerys, R.; Roels, H.; Bernard, A.; Bruaux, P.; Claeys, F.; Ducoffre, G.; de Plaen, P.; Staessen, J.; Amery., A.; et al. Renal effects of cadmium body burden of the general population. Lancet 1990, 336, 699–702. [Google Scholar] [CrossRef] [PubMed]
  18. Akesson, A.; Lundh, T.; Vahter, M.; Bjellerup, P.; Lidfeldt, J.; Nerbrand, C.; Samsioe, G.; Strömberg, U.; Skerfving, S. Tubular and glomerular kidney effects in Swedish women with low environmental cadmium exposure. Environ. Health Perspect. 2005, 113, 1627–1631. [Google Scholar] [CrossRef]
  19. Barregard, L.; Bergstrom, G.; Fagerberg, B. Cadmium, type 2 diabetes, and kidney damage in a cohort of middle-aged women. Environ. Res. 2014, 135, 311–316. [Google Scholar] [CrossRef]
  20. Haswell-Elkins, M.; Satarug, S.; O’Rourke, P.; Moore, M.; Ng, J.; McGrath, V.; Walmby, M. Striking association between urinary cadmium level and albuminuria among Torres Strait Islander people with diabetes. Environ. Res. 2008, 106, 379–383. [Google Scholar] [CrossRef]
  21. Hwangbo, Y.; Weaver, V.M.; Tellez-Plaza, M.; Guallar, E.; Lee, B.K.; Navas-Acien, A. Blood cadmium and estimated glomerular filtration rate in Korean adults. Environ. Health Perspect. 2011, 119, 1800–1805. [Google Scholar] [CrossRef] [PubMed]
  22. Satarug, S.; Vesey, D.A.; Ruangyuttikarn, W.; Nishijo, M.; Gobe, G.C.; Phelps, K.R. The source and pathophysiologic significance of excreted cadmium. Toxics 2019, 7, 55. [Google Scholar] [CrossRef] [PubMed]
  23. Levey, A.S.; Stevens, L.A.; Scmid, C.H.; Zhang, Y.; Castro, A.F., III; Feldman, H.I.; Kusek, J.W.; Eggers, P.; Van Lente, F.; Greene, T.; et al. A new equation to estimate glomerular filtration rate. Ann. Intern. Med. 2009, 150, 604–612. [Google Scholar] [CrossRef] [PubMed]
  24. Phelps, K.R.; Gosmanova, E.O. A generic method for analysis of plasma concentrations. Clin. Nephrol. 2020, 94, 43–49. [Google Scholar] [CrossRef] [PubMed]
  25. Satarug, S.; Vesey, D.A.; Gobe, G.C. Dose–response analysis of the tubular and glomerular effects of chronic exposure to environmental cadmium. Int. J. Environ. Res. Public Health 2022, 19, 10572. [Google Scholar] [CrossRef] [PubMed]
  26. JECFA. Evaluation of certain Food Additives and Contaminants. In Proceedings of the Seventy-Third Meeting of the Joint FAO/WHO Expert Committee on Food Additives, Geneva, Switzerland, 8–17 June 2010; Food and Agriculture Organization of the United Nations: Rome, Italy; World Health Organization: Geneva, Switzerland, 2010; Available online: https://apps.who.int/iris/handle/10665/44521 (accessed on 17 May 2023).
  27. Wong, C.; Roberts, S.M.; Saab, I.N. Review of regulatory reference values and background levels for heavy metals in the human diet. Regul. Toxicol. Pharmacol. 2022, 130, 105122. [Google Scholar] [CrossRef]
  28. Grau-Perez, M.; Pichler, G.; Galan-Chilet, I.; Briongos-Figuero, L.S.; Rentero-Garrido, P.; Lopez-Izquierdo, R.; Navas-Acien, A.; Weaver, V.; García-Barrera, T.; Gomez-Ariza, J.L.; et al. Urine cadmium levels and albuminuria in a general population from Spain: A gene-environment interaction analysis. Environ. Int. 2017, 106, 27–36. [Google Scholar] [CrossRef]
  29. Tsai, H.J.; Hung, C.H.; Wang, C.W.; Tu, H.P.; Li, C.H.; Tsai, C.C.; Lin, W.Y.; Chen, S.C.; Kuo, C.H. Associations among heavy metals and proteinuria and chronic kidney disease. Diagnostics 2021, 11, 282. [Google Scholar] [CrossRef]
  30. Kalantar-Zadeh, K.; Jafar, T.H.; Nitsch, D.; Neuen, B.L.; Perkovic, V. Chronic kidney disease. Lancet 2021, 398, 786–802. [Google Scholar] [CrossRef]
  31. Portman, R.J.; Kissane, J.M.; Robson, A.M. Use of B2-microglobulin to diagnose tubulo-interstitial renal lesions in children. Kidney Int. 1986, 30, 91–98. [Google Scholar] [CrossRef]
  32. Gauthier, C.; Nguyen-Simonnet, H.; Vincent, C.; Revillard, J.-P.; Pellet, M.V. Renal tubular absorption of beta 2 microglobulin. Kidney Int. 1984, 26, 170–175. [Google Scholar] [CrossRef] [PubMed]
  33. Peterson, P.A.; Evrin, P.-E.; Berggard, I. Differentiation of glomerular, tubular, and normal proteinuria: Determination of urinary excretion of B2-microglobulin, albumin, and total protein. J. Clin. Investig. 1969, 48, 1189–1198. [Google Scholar] [CrossRef] [PubMed]
  34. Satarug, S.; Vesey, D.A.; Gobe, G.C.; Đorđević, A.B. The validity of benchmark dose limit analysis for estimating permissible accumulation of cadmium. Int. J. Environ. Res. Public Health 2022, 19, 15697. [Google Scholar] [CrossRef]
  35. Molitoris, B.A.; Sandoval, R.M.; Yadav, S.P.S.; Wagner, M.C. Albumin uptake and processing by the proximal tubule: Physiological, pathological, and therapeutic implications. Physiol. Rev. 2022, 102, 1625–1667. [Google Scholar] [CrossRef]
  36. Gburek, J.; Konopska, B.; Gołąb, K. Renal handling of albumin-from early findings to current concepts. Int. J. Mol. Sci. 2021, 22, 5809. [Google Scholar] [CrossRef]
  37. Santoyo-Sánchez, M.P.; Pedraza-Chaverri, J.; Molina-Jijón, E.; Arreola-Mendoza, L.; Rodríguez-Muñoz, R.; Barbier, O.C. Impaired endocytosis in proximal tubule from subchronic exposure to cadmium involves angiotensin II type 1 and cubilin receptors. BMC Nephrol. 2013, 14, 211. [Google Scholar] [CrossRef] [PubMed]
  38. Gena, P.; Calamita, G.; Guggino, W.B. Cadmium impairs albumin reabsorption by down-regulating megalin and ClC5 channels in renal proximal tubule cells. Environ. Health Perspect. 2010, 118, 1551–1556. [Google Scholar] [CrossRef]
  39. Li, L.; Dong, F.; Xu, D.; Du, L.; Yan, S.; Hu, H.; Lobe, C.G.; Yi, F.; Kapron, C.M.; Liu, J. Short-term, low-dose cadmium exposure induces hyperpermeability in human renal glomerular endothelial cells. J. Appl. Toxicol. 2016, 36, 257–265. [Google Scholar] [CrossRef]
  40. Li, Z.; Jiang, L.; Tao, T.; Su, W.; Guo, Y.; Yu, H.; Qin, J. Assessment of cadmium-induced nephrotoxicity using a kidney-on-a-chip device. Toxicol. Res. 2017, 6, 372–380. [Google Scholar] [CrossRef]
  41. Mohandes, S.; Doke, T.; Hu, H.; Mukhi, D.; Dhillon, P.; Susztak, K. Molecular pathways that drive diabetic kidney disease. J. Clin. Investig. 2023, 133, e165654. [Google Scholar] [CrossRef]
  42. Fu, J.; Lee, K.; Chuang, P.Y.; Liu, Z.; He, J.C. Glomerular endothelial cell injury and cross talk in diabetic kidney disease. Am. J. Physiol. Ren. Physiol. 2015, 308, F287–F297. [Google Scholar] [CrossRef] [PubMed]
  43. Järup, L.; Rogenfelt, A.; Elinder, C.G.; Nogawa, K.; Kjellström, T. Biological half-time of cadmium in the blood of workers after cessation of exposure. Scand. J. Work Environ. Health. 1983, 9, 327–331. [Google Scholar] [CrossRef] [PubMed]
  44. Lee, J.; Oh, S.; Kang, H.; Kim, S.; Lee, G.; Li, L.; Kim, C.T.; An, J.N.; Oh, Y.K.; Lim, C.S.; et al. Environment-wide association study of CKD. Clin. J. Am. Soc. Nephrol. 2020, 15, 766–775. [Google Scholar] [CrossRef] [PubMed]
  45. Schnaper, H.W. The tubulointerstitial pathophysiology of progressive kidney disease. Adv. Chronic Kidney Dis. 2017, 24, 107–116. [Google Scholar] [CrossRef]
  46. Chevalier, R.L. The proximal tubule is the primary target of injury and progression of kidney disease: Role of the glomerulotubular junction. Am. J. Physiol. Ren. Physiol. 2016, 311, F145–F161. [Google Scholar] [CrossRef]
  47. Sharma, S.; Smyth, B. From proteinuria to fibrosis: An update on pathophysiology and treatment options. Kidney Blood Press Res. 2021, 46, 411–420. [Google Scholar] [CrossRef]
  48. Barregard, L.; Sallsten, G.; Lundh, T.; Mölne, J. Low-level exposure to lead, cadmium and mercury, and histopathological findings in kidney biopsies. Environ. Res. 2022, 211, 113119. [Google Scholar] [CrossRef]
  49. Satarug, S.; Vesey, D.A.; Nishijo, M.; Ruangyuttikarn, W.; Gobe, G.C. The inverse association of glomerular function and urinary β2-MG excretion and its implications for cadmium health risk assessment. Environ. Res. 2019, 173, 40–47. [Google Scholar] [CrossRef]
  50. Kudo, K.; Konta, T.; Mashima, Y.; Ichikawa, K.; Takasaki, S.; Ikeda, A.; Hoshikawa, M.; Suzuki, K.; Shibata, Y.; Watanabe, T.; et al. The association between renal tubular damage and rapid renal deterioration in the Japanese population: The Takahata study. Clin. Exp. Nephrol. 2011, 15, 235–241. [Google Scholar] [CrossRef]
  51. Mashima, Y.; Konta, T.; Kudo, K.; Takasaki, S.; Ichikawa, K.; Suzuki, K.; Shibata, Y.; Watanabe, T.; Kato, T.; Kawata, S.; et al. Increases in urinary albumin and beta2-microglobulin are independently associated with blood pressure in the Japanese general population: The Takahata Study. Hypertens. Res. 2011, 34, 831–835. [Google Scholar] [CrossRef]
  52. Ikeda, A.; Konta, T.; Takasaki, S.; Hao, Z.; Suzuki, K.; Sato, H.; Shibata, Y.; Takeishi, Y.; Kato, T.; Kawata, S.; et al. In a non-diabetic Japanese population, the combination of macroalbuminuria and increased urine beta 2-microglobulin predicts a decline of renal function: The Takahata study. Nephrol. Dial. Transpl. 2009, 24, 841–847. [Google Scholar] [CrossRef]
  53. Siddiqui, K.; George, T.P.; Joy, S.S.; Alfadda, A.A. Risk factors of chronic kidney disease among type 2 diabetic patients with longer duration of diabetes. Front. Endocrinol. 2022, 13, 1079725. [Google Scholar] [CrossRef] [PubMed]
  54. Keefe, J.A.; Hwang, S.J.; Huan, T.; Mendelson, M.; Yao, C.; Courchesne, P.; Saleh, M.A.; Madhur, M.S.; Levy, D. Evidence for a causal role of the SH2B3-β2M axis in blood pressure regulation. Hypertension 2019, 73, 497–503. [Google Scholar] [CrossRef]
  55. Hornung, R.W.; Reed, L.D. Estimation of average concentration in the presence of nondetectable values. Appl. Occup. Environ. Hyg. 1990, 5, 46–51. [Google Scholar] [CrossRef]
  56. Denic, A.; Elsherbiny, H.; Rule, A.D. In-vivo techniques for determining nephron number. Curr. Opin. Nephrol. Hypertens. 2019, 28, 545–551. [Google Scholar] [CrossRef]
  57. Levey, A.S.; Becker, C.; Inker, L.A. Glomerular filtration rate and albuminuria for detection and staging of acute and chronic kidney disease in adults: A systematic review. JAMA 2015, 313, 837–846. [Google Scholar] [CrossRef] [PubMed]
  58. Soveri, I.; Berg, U.B.; Björk, J.; Elinder, C.G.; Grubb, A.; Mejare, I.; Sterner, G.; Bäck, S.E.; SBU GFR Review Group. Measuring GFR: A systematic review. Am. J. Kidney Dis. 2014, 64, 411–424. [Google Scholar] [CrossRef] [PubMed]
  59. White, C.A.; Allen, C.M.; Akbari, A.; Collier, C.P.; Holland, D.C.; Day, A.G.; Knoll, G.A. Comparison of the new and traditional CKD-EPI GFR estimation equations with urinary inulin clearance: A study of equation performance. Clin. Chim. Acta 2019, 488, 189–195. [Google Scholar] [CrossRef] [PubMed]
Figure 1. Comparing effects of body burden of cadmium and diabetes on β2M excretion rate. Scatterplot (a) relates log[(Eβ2M/Ccr) × 103] to log[(ECd/Ccr) × 105] in non-diabetics and diabetics. Bar graph (b) depicts mean log[(Eβ2M/Ccr) × 103] for the non-diabetics and diabetics grouped by ranges of log[(ECd/Ccr) × 105]. Coefficients of determination (R2) and p-values are provided for all scatterplots. Mean β2M excretion values were adjusted for age, BMI, and interactions. Mean (SD) values for (ECd/Ccr) × 100 tertiles 1, 2 and 3 are 0.046 (0.014), 0.109 (0.030), and 2.316 (2.197), µg/L of filtrate, respectively. The letters a and b denote the non-diabetic controls and the diabetics in the lowest tertile of (ECd/Ccr) × 100, respectively. The numbers of subjects are provided for all subgroups.
Ijms 24 09050 g001
Figure 2. Comparing effects of eGFR on excretion rates of β2M and Alb. Scatterplot (a) relates log[(Eβ2M/Ccr) × 103] to eGFR in non-diabetics and diabetics. Bar graph (b) depicts mean log[(Eβ2M/Ccr) × 104] for the non-diabetics and diabetics grouped by eGFR ranges. Scatterplot (c) relates log[(EAlb/Ccr) × 104] to eGFR in non-diabetics and diabetics. Bar graph (d) depicts mean log[(EAlb/Ccr) × 104] for the non-diabetics and diabetics grouped by eGFR ranges. Coefficients of determination (R2) and p-values are provided for all scatterplots. Mean β2M excretion values were adjusted for age, BMI, and interactions. The letters a and b denote the non-diabetic controls with eGFR ≤ 60 and 61–90 mL/min/1.73 m2, re-spectively. The letters c and d denote the diabetics with eGFR ≤ 60 and 61–90 mL/min/1.73 m2, re-spectively. The numbers of subjects are provided for all subgroups.
Ijms 24 09050 g002
Figure 3. Comparing effects of diabetes and hypertension on albumin excretion rate. Graph (a) depicts mean log[(EAlb/Ccr) × 104] and the variation of each mean in control, <10-y DM and ≥ 10-y DM groups. Bar graph (b) depicts mean log[(EAlb/Ccr) × 104] for controls, <10-y DM and ≥10-y DM with and without hypertension. Coefficients of determination (R2) and p-values are provided for all scatterplots. Mean Alb excretion values were adjusted for age, BMI, and interactions. The letters a and b denote the controls with normotension and hypertension, respectively. The numbers of subjects are provided for all subgroups.
Ijms 24 09050 g003
Table 1. Descriptive Characteristics of Non-diabetic Controls and Diabetic Cases.
ParametersAll Subjects
n = 176
Non-DM
n = 88
<10-yr DM
n = 48
≥10-yr DM
n = 37
p
Duration of diabetes a, yrsn/a04.2 ± 2.115.8 ± 7.2
Fasting plasma glucose, mg/dL131.7 ± 61.394 ± 12177 ± 76161 ± 55<0.001
Blood Cd, µg/L0.59 ± 0.740.64 ± 0.850.52 ± 0.610.57 ± 0.610.677
Female, %80.980.779.283.90.863
Smoking, %9.811.410.45.40.586
Hypertension, %51.844.754.264.90.114
Age, years59.9 ± 9.760.4 ± 9.259.2 ± 9.659.0 ± 11.20.489
BMI, kg/m225.4 ± 4.724.7 ± 4.426.3 ± 5.225.7 ± 4.60.098
Obese b (%)10.45.718.810.30.058
eGFR c, mL/min/1.73 m279.4 ± 18.079.4 ± 14.482.0 ± 19.677.6 ± 23.30.399
Reduced eGFR d (%)15.611.414.627.00.086
Normalized to Ccr as Ex/Ccr e
(ECd/Ccr) × 100, µg/L filtrate0.84 ± 1.660.86 ± 1.690.53 ± 1.131.33 ± 2.210.248
(Eβ2M/Ccr) × 100, µg/L filtrate1313 ± 2396543 ± 6251975 ± 29142294 ± 3725<0.001
(EAlb/Ccr) × 100, mg/L filtrate43.2 ± 127.78.8 ± 17.954.3 ± 99.2112.4 ± 240.90.001
(Eβ2M/Ccr) × 100 ≥ 300 µg/L (%)66.254.278.080.80.008
(Eβ2M/Ccr) × 100 ≥ 1000 µg/L (%)32.415.346.357.7<0.001
EAlb/Ccr) × 100 ≥ 20 mg/L (%)24.410.733.345.7<0.001
EAlb/Ccr) × 100, mg/L (%)
<2075.689.366.754.3<0.001
20–19918.310.720.034.3<0.001
≥2006.1013.311.40.008
Normalized to Ecr as Ex/Ecr f
ECd/Ecr, µg/g creatinine0.96 ± 1.830.99 ± 1.940.69 ± 1.491.36 ± 2.080.376
Eβ2M/Ecr, µg/g creatinine1284 ± 1747633 ± 7622012 ± 25491856 ± 1589<0.001
EAlb/Ecr, mg/g creatinine41 ± 10411 ± 2460 ± 11290 ± 173<0.001
Eβ2M/Ecr ≥ 300 µg/g creatinine (%)70.558.380.588.50.004
Eβ2M/Ecr ≥ 1000 µg/g creatinine (%)37.420.848.865.4<0.001
EAlb/Ecr ≥ 20 or ≥ 30 mg/g creatinine20.77.133.337.1<0.001
EAlb/Ecr, mg/g creatinine (%)
<3079.392.966.762.9<0.001
30–29916.57.126.725.7<0.001
≥3004.306.711.40.001
n, number of subjects; DM, diabetics; BMI, body mass index; eGFR, estimated glomerular filtration rate; n/a, not applicable; Ex, excretion of x; cr, creatinine; Ccr, creatinine clearance; β2M, β2-microglobulin; Alb, albumin, Cd, cadmium; a, among 88 diabetic cases, 85 had data on duration of diabetes; b, obesity was assigned when BMI >30 kg/m2; c eGFR, was evaluated using the established CKD-EPI equations [23]. d Reduced eGFR was defined as eGFR ≤ 60 mL/min/1.73 m2. e Ex/Ecr = [x]u/[cr]u; f Ex/Ccr = [x]u[cr]p/[cr]u, where x = Cd, β2M or Alb [24]. Data for all continuous variables are arithmetic means ± standard deviation (SD). Data for urine Cd and urine Alb are from 141–167 subjects; data for all other variables are from 176 subjects. For each test, p ≤ 0.05 identifies statistical significance, determined by Pearson’s Chi-square test for percentage differences and the Kruskal–Wallis test for mean differences across three groups.
Table 2. Multivariate analyses of Eβ2MG/Ccr, EAlb/Ccr and eGFR.
Independent
Variables/Factors
Log[(Eβ2M/Ccr) × 103]Log[(EAlb/Ccr) × 104]eGFR
βη2pβη2pβη2p
Age0.1640.0340.0430.1040.0080.325−0.3570.131<0.001
BMI −0.1410.0280.065−0.0220.0050.4500.0790.0090.308
Log10[Cd]b 0.1380.0220.1030.0500.0030.527−0.0770.0060.383
Log2[(ECd/Ccr) × 105]0.2440.0770.0020.0330.0000320.950−0.1040.0100.272
Smoking0.0150.0080.339−0.0360.0020.6220.0120.0000710.926
Gender (female)−0.1140.0090.2880.0410.0000250.9550.0890.0100.269
Hypertension0.0480.0240.0880.2590.0360.0350.0230.0010.732
Diabetes0.4320.0830.0010.2860.0420.023−0.0690.0180.138
Interactions a 0.0380.0310.0530.0100.0380.031
Adjusted R20.330<0.0010.1710.0010.1410.001
β, standardized regression coefficient; η2, eta squared; adjusted R2, coefficient of determination; β indicates strength of association of dependent variables with independent variables (first column). Adjusted R2 indicates the fraction of total variation of each dependent variable explained by all independent variables. η2 indicates the fraction of the variability of each dependent variable explained by a corresponding independent variable. a, DM showed significant interactions with hypertension, gender, and smoking in regression analyses of Eβ2M/Ccr, EAlb/Ccr and eGFR, respectively. For each test, p-values ≤ 0.05 indicate a statistically significant contribution of variation of an independent variable to variation of a dependent variable.
Table 3. Prevalence odds ratios for adverse kidney outcomes associated with cadmium and duration of diabetes.
Independent
Variables/Factors
(Eβ2M/Ccr) × 100 ≥ 300 µg/L (Ealb/Ccr) × 100 ≥ 20 mg/L eGFR ≤ 60 mL/min/1.73 m2
POR (95% CI)pPOR (95% CI)pPOR (95% CI)p
Age1.060 (1.006, 1.117)0.0291.038 (0.986, 1.094)0.1541.147 (1.058, 1.244)0.001
BMI0.945 (0.861, 1.038)0.2400.971 (0.888, 1.063)0.5270.981 (0.866, 1.110)0.755
Log10[Cd]b1.859 (0.976, 3.543)0.0591.235 (0.630, 2.422)0.5381.137 (0.475, 2.725)0.773
Log2[(ECd/Ccr) × 105]1.260 (1.007, 1.577)0.0441.025 (0.843, 1.245)0.8071.138 (0.894, 1.449)0.293
Smoking2.643 (0.465, 15.04)0.2731.877 (0.124, 28.49)0.6501.877 (0.124, 28.49)0.650
Gender (female)2.043 (0.605, 6.900)0.2500.301 (0.085, 1.065)0.0620.448 (0.040, 4.989)0.514
Hypertension1.249 (0.521, 2.991)0.6182.317 (0.915, 5.865)0.0760.559 (0.165, 1.895)0.350
Non-diabeticsReferent Referent Referent
<10-yr DM0.842 (0.209, 3.394)0.8092.315 (0.764, 7.016)0.1383.384 (0.736, 15.55)0.117
≥10-yr DM4.035 (1.094, 14.88)0.0366.142 (2.004, 18.83)0.0016.949 (1.613, 29.93)0.009
eGFR, estimated glomerular filtration rate; POR, prevalence odds ratio; CI, confidence interval. (Eβ2M/Ccr) × 100 ≥ 300 µg/L, (EAlb/Ccr) × 100 ≥ 20 mg/L, and eGFR ≤ 60 mL/min/1.73 m2 are indicative of tubular dysfunction, microalbuminuria, and a reduced eGFR, respectively. Data were generated from logistic regression analyses relating the POR for the three indicators of adverse kidney outcomes to the seven independent variables listed in the first column. p-values < 0.05 indicate a statistically significant increase in the POR for adverse effects.
Table 4. Effects of cadmium and GFR on prevalence odds of a severe tubular dysfunction.
Severe Tubular Dysfunction a
Independent Variables/
Factors
β Coefficient
(SE)
POR95% CIp
LowerUpper
Age0.010 (0.027)1.0100.9571.0660.705
BMI0.000019 (0.055)1.0000.8991.1131.000
Log10[Cd]b−0.317 (0.354)0.7280.3641.4570.370
Log2[(ECd/Ccr) × 105]0.276 (0.103)1.3171.0771.6120.007
Gender (female)0.026 (0.742)1.0260.2394.3970.972
Hypertension0.964 (0.476)2.6211.0306.6680.043
Smoking0.598 (1.011)1.8190.25113.1850.554
eGFR, mL/min/1.73 m2
≥90Referent
61−892.646 (0.730)14.0943.36958.971<0.001
≤604.430 (1.004)83.95811.742600.342<0.001
a, Severe tubular dysfunction is defined as (Eβ2M/Ccr) × 100 ≥ 1000 µg/L filtrate; SE, standard error of mean; POR, prevalence odds ratio; CI, confidence interval. Data were generated from multivariable logistic regression analyses relating the POR for tubular dysfunction to eight independent variables (first column). p-values < 0.05 indicate a statistically significant increase in the POR for a defective tubular function.
Table 5. Effects of hypertension and GFR on prevalence odds of microalbuminuria.
Microalbuminuria a
Independent Variables/
Factors
β Coefficient
(SE)
POR95% CIp
LowerUpper
Age0.002 (0.027)1.0020.9511.0560.950
BMI0.039 (0.046)1.0390.9501.1380.401
Log10[Cd]b0.144 (0.341)1.1550.5922.2510.672
Log2[(ECd/Ccr) × 105]0.024 (0.098)1.0250.8451.2420.804
Gender (female)1.022 (0.617)2.7800.8309.3140.097
Hypertension1.199 (0.463)3.3181.3408.2180.010
Smoking0.885 (0.914)2.4230.40414.5310.333
eGFR, mL/min/1.73 m2
≥90Referent
61−891.500 (0.596)4.4831.39414.4210.012
≤601.518 (0.725)4.5651.10318.8880.036
a, Microalbuminuria is defined as (EAlb/Ccr) × 100 ≥ 20 mg/L filtrate; SE, standard error of mean; POR, prevalence odds ratio; CI, confidence interval; eGFR, estimated glomerular filtration rate. Data were generated from logistic regression analyses relating the POR for microalbuminuria to eight independent variables (first column). p-values < 0.05 indicate a statistically significant increase in the POR for microalbuminuria.
Disclaimer/Publisher’s Note: The statements, opinions and data contained in all publications are solely those of the individual author(s) and contributor(s) and not of MDPI and/or the editor(s). MDPI and/or the editor(s) disclaim responsibility for any injury to people or property resulting from any ideas, methods, instructions or products referred to in the content.

