Article

Nanomaterials Based on Collaboration with Multiple Partners: Zn3Nb2O8 Doped with Eu3+ and/or Amino Substituted Porphyrin Incorporated in Silica Matrices for the Discoloration of Methyl Red

1
National Institute for Research and Development in Electrochemistry and Condensed Matter, Plautius Andronescu Street 1, 300224 Timisoara, Romania
2
Institute of Chemistry “Coriolan Dragulescu”, Mihai Viteazu Ave. 24, 300223 Timisoara, Romania
*
Authors to whom correspondence should be addressed.
Int. J. Mol. Sci. 2023, 24(10), 8920; https://doi.org/10.3390/ijms24108920
Submission received: 7 April 2023 / Revised: 9 May 2023 / Accepted: 16 May 2023 / Published: 17 May 2023

Abstract

:
Designing appropriate materials destined for the removal of dyes from waste waters represents a great challenge for achieving a sustainable society. Three partnerships were set up to obtain novel adsorbents with tailored optoelectronic properties using silica matrices, Zn3Nb2O8 oxide doped with Eu3+, and a symmetrical amino-substituted porphyrin. The pseudo-binary oxide with the formula Zn3Nb2O8 was obtained by the solid-state method. The doping of Zn3Nb2O8 with Eu3+ ions was intended in order to amplify the optical properties of the mixed oxide that are highly influenced by the coordination environment of Eu3+ ions, as confirmed by density functional theory (DFT) calculations. The first proposed silica material, based solely on tetraethyl orthosilicate (TEOS) with high specific surface areas of 518–726 m2/g, offered better performance as an adsorbent than the second one, which also contained 3-aminopropyltrimethoxysilane (APTMOS). The contribution of amino-substituted porphyrin incorporated into silica matrices resides both in providing anchoring groups for the methyl red dye and in increasing the optical properties of the whole nanomaterial. Two different types of methyl red adsorption mechanisms can be reported: one based on surface absorbance and one based on the dye entering the pores of the adsorbents due to their open groove shape network.

1. Introduction

Recent research is increasingly focused on hybrid materials containing two or three partners belonging to different chemical classes that bring their best properties to the newly designed material. In this respect, researchers combined mixed oxides, porphyrins, and silica or polymeric materials [1] with the purpose of being used in field emission displays (FED) [2,3]. Especially as cathodoluminescent materials, as adsorbent materials [4,5,6], as sensitive materials for sensor devices [7,8], or as photocatalysts for dye degradation [9]. The properties of these materials depend on their morphology, size, specific surface area, composition, and conductivity. An increased attention is also given to the selection of the host matrix and to the guest active center (luminescent, emitting, or recognizing). The appropriate guests can be mixed oxides, tetrapyrrolic macrocycles (especially porphyrins), or corroles. Much emphasis was placed on the optimization of the doping ratio of oxides in order to improve energy transfer, thermal properties [10], and color stability [11,12,13,14].
The pseudo-binary oxide Zn3Nb2O8 has been reported as a material with excellent luminous performance and even self-excited luminescence [15,16,17]. Zn3Ta2O8 oxides with layered crystal structures were already prepared by a nonconventional hydrothermal method, and their electronic-band structures, optical properties, and photocatalytic activities were investigated. For the obtained materials, the UV–Vis diffuse reflectance spectra revealed that Zn3Ta2O8 exhibited band gaps of 4.5 eV [18]. From the electronic band structure calculations using the DFT method, it was found that the valence band was constructed by the hybridization of Zn 3d and O 2p orbitals, whereas the conduction band consisted of Ta 5d (Zn3Ta2O8) orbitals [19,20].
Quanto-chemical descriptors [21] were able to analyze the involved mechanisms, no matter if molecular, macromolecular, or solid-state structures are considered. As a consequence, the prediction and properties’ design of the pseudo-binary oxides became an intrinsic stage of the development for different applications, such as solar cells [22,23,24], piezoelectronics for sensors [25], hydrogen-storage materials [26], solid-state batteries [27], and controlled explosives [28].
Previous research showed that hybrid materials between mixed oxides such as Zn3Nb2O8 and a large plethora of porphyrins are useful in the corrosion inhibition of steel in different media (acid or salted) based on the involved synergy [29,30,31].
On the other hand, the porphyrin-silica materials exhibit high synergy as adsorbent materials for CO2 gas [32,33] or for different dyes, such as fuchsine B [34], methylene blue [33], and Congo red [35].
In the present work, we were concerned with obtaining a three-partnership nanomaterial composed of silica matrices, Zn3Nb2O8 oxide doped with Eu3+, and an amino-substituted porphyrin to highlight the synergistic effect towards methyl red removal and discoloration from wastewaters. We present a workflow containing the main steps performed in this research in Scheme 1.
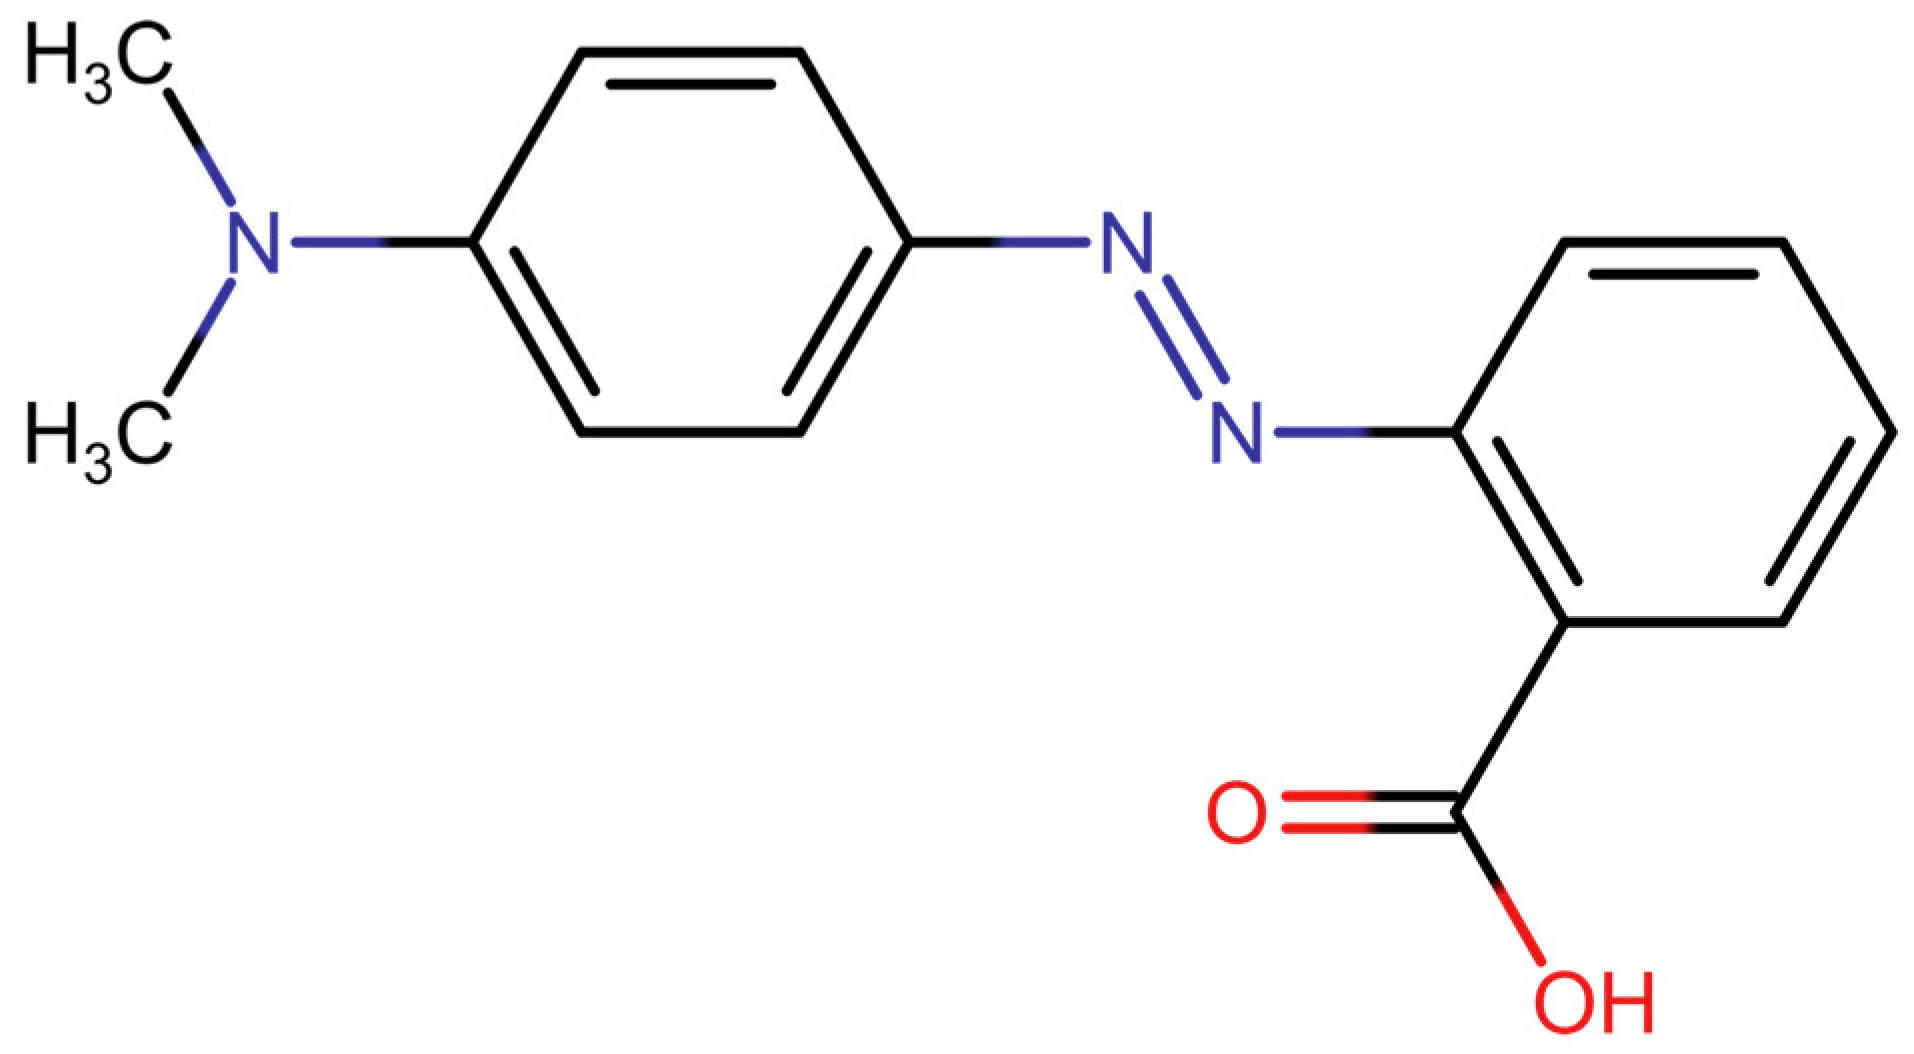
We target methyl red (MR, Figure 1) removal from wastewaters because it is a pollutant that can cause major neurochemical damage to humans, allergies, irritations, infections of the eyes or skin, and infections of the digestive tract [36]. More than these, its oxygen-biodegraded products, 2-aminobenzoic acid and N-N-dimethyl-p-phenylene diamine, are mutagenic [37]. MR is an acidic azo dye used as a pH indicator [38], in the textile, paper, and paint industries, and also as a dopant for improving the electrical properties of nematic liquid crystal cells [39].
Since then, the degradation of MR in 98.20% percentage has been performed using Fe3O4-Fe2O2@SiO2 obtained from natural sources and H2O2 as oxidizers [40]. A quantity of 100 mg catalyst produces, in the presence of hydrogen peroxide, hydroxyl radicals capable of degrading MR at a pH = 3 in 180 min of exposure.
Another method to decolorize MR-contaminated waters is the use of Bacillus thuringiensis RI16 in static conditions [41] or Pseudomonas aeruginosa [42]. This strain proved an 81.49% degradation efficiency in optimized conditions at pH 9 and 3 days of incubation.
The classical method for dye removal is adsorption. Table 1 presents some of the most recent adsorbent materials for the elimination of methyl red from wastewater. As can be seen in Table 1, the adsorption capacity varies largely from 2.15 mg/g to 672.7 mg/g [43,44,45,46,47,48,49].

2. Results

2.1. Characterization of Zn3Nb2O8: Non-Doped and Doped with Eu3+ Ions

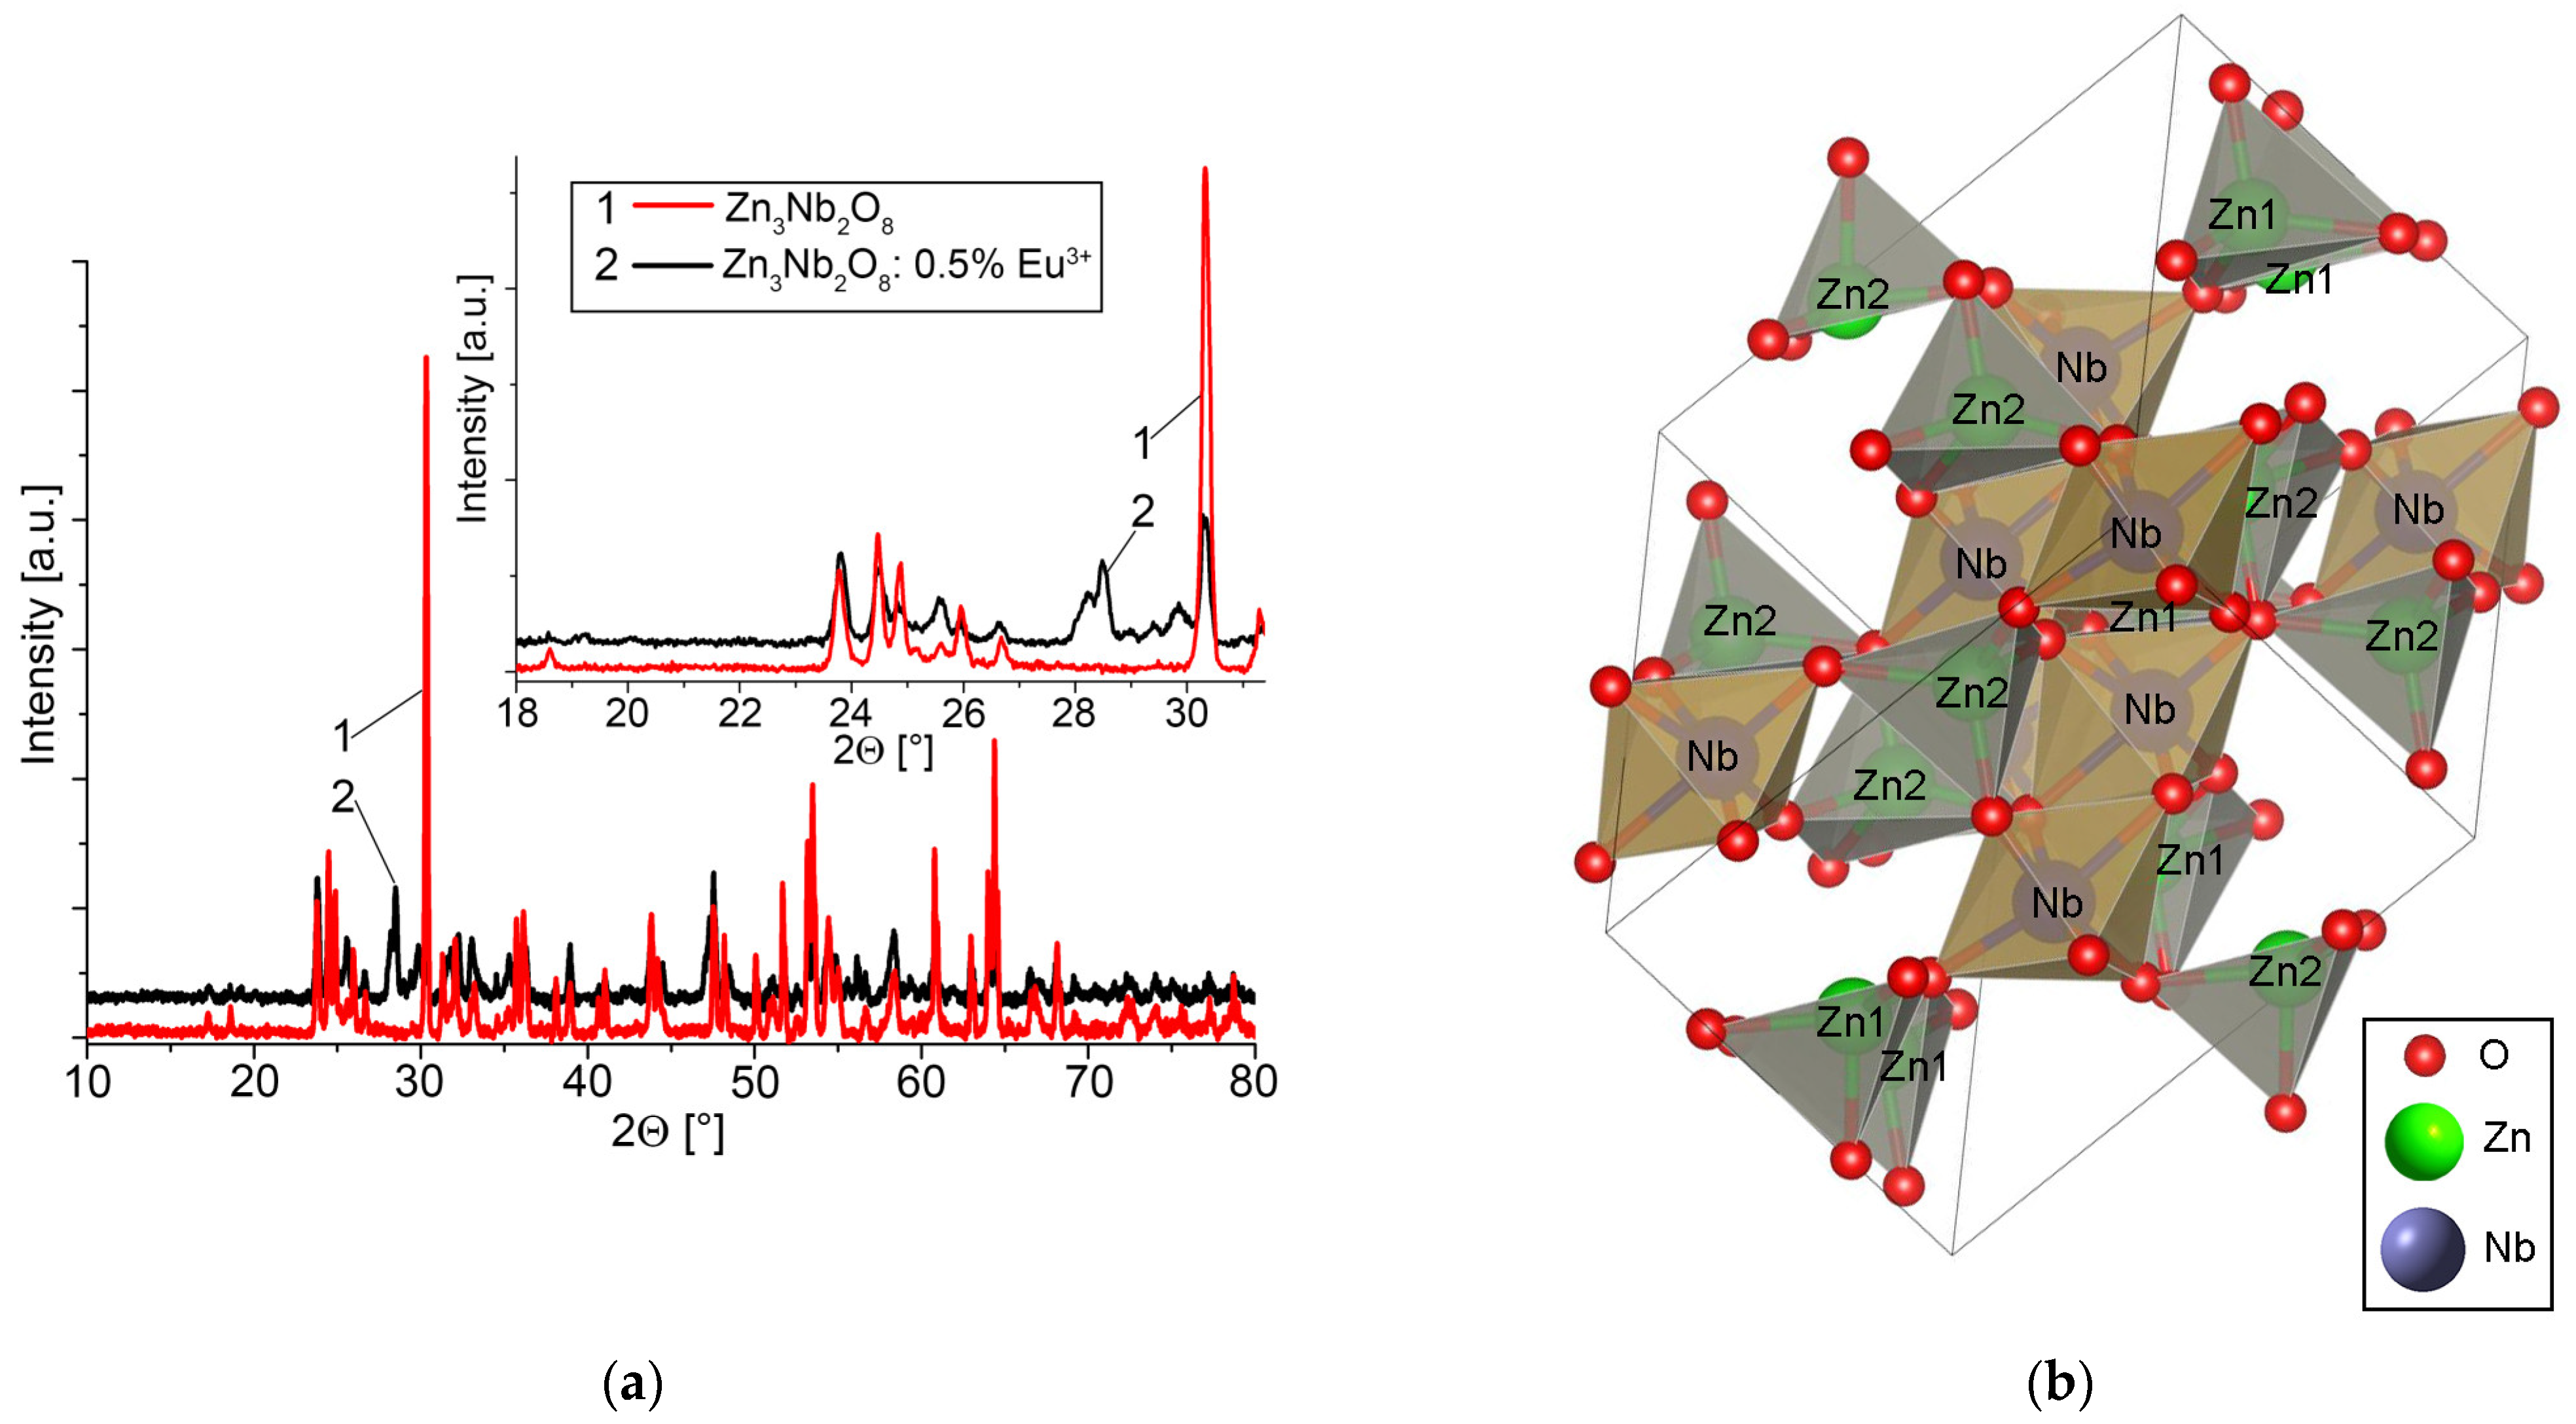
Figure 2a presents the XRD patterns of the pseudo-binary oxide Zn3Nb2O8 nanomaterials, non-doped and doped with Eu3+, and a monoclinic phase of the Zn3Nb2O8 belonging to the C2/c space group (number 15) is revealed. Both nanomaterials were identified using JCPDS, card no. 01-079-1164, in the (−511) plane that is attributed to the highest intensity peak 2θ = 30.32°. Based on X-ray diffraction analysis using the Full Prof Suite computer package, the data lattice constants (Miller indices) for Zn3Nb2O8 were calculated: a = 9.99 Å, b = 9.99 Å, c = 5.22 Å, α = β = 90°, γ = 145.5°, and the elementary cell volume V = 583.48 Å3. In monoclinic symmetry (the C2/c space group), Zn3Nb2O8 forms a complex polyhedral structure with tetrahedral [ZnO4] and octahedral [NbO6] geometry (Figure 2b) [50]. Each NbO6 octahedron (Figure 2b) layer is located in-between Zn(1)O4 and Zn(2)O4 tetrahedron layers by edge sharing, which forms an “O” type arrangement. The Zn(1) and Zn(2) cations prefer to occupy two 4 e symmetric irreducible sites of C2 symmetry, while the Nb and O ions prefer to occupy the 8 f Wyckoff’s positions [51], having C1 symmetry [50].
When the pseudo-binary oxide Zn3Nb2O8 nanomaterials were doped with Eu3+ ions, a shift to the smaller 2Ijms 24 08920 i001 values for the entire XRD spectrum was observed. The shifting of the peak is mainly due to the difference in ionic radii between the initial element and the Eu3+ dopant ion, which introduces different parameters in the lattice [52,53].
Using density functional theory (DFT) with the CRYSTAL14 computer code [54,55,56,57], the preferred occupancy of Zn or Nb in the crystalline sites was calculated. Only the valence electrons were taken into account, the others playing the role of a screen for the charge of the nucleus, resulting in the use of the effective core pseudopotential (ECP). All the crystallographic sites have to be assumed to be fully occupied.
Using the same computer code [58], the ionic configuration of the O2−, Nb5+, and Zn2+ ions was established. The primitive cell comprises (Figure 2b) in its asymmetrical unit positions, irreducible in terms of structure symmetry, seven types of ions, as follows: Nb, Zn1, Zn2, and O1–O4. Consequently, Zn occupies two distinct positions from a symmetrical point of view, and O occupies four such positions that might determine the character of physical-chemical properties. In total, the primitive cell of the Zn3Nb2O8 crystalline structure contains four Nb5+, six Zn2+, and sixteen O2− ions.

2.1.1. Mulliken Analysis of Electron Populations

The Mulliken electron population analysis [59,60] reveals, first of all, a significantly different distribution of the charge of the 300 electrons in the primitive cell among its 26 ionic constituents. If the Nb ion is assigned a partial charge of 10.83 electrons, around the Zn ion there is a much denser electronic spatial charge of 18.8 electrons. Oxygen, with nine electrons distributed within the crystalline structure, is much closer to its oxidation state in the molecular binary combinations. They will find their place on ionic oxygen levels as valence electrons, as can be seen in Table 2.
Mulliken analysis of the electron population was also performed by overlapping the orbitals of two neighboring atoms. The low values highlighted the high degree of ionic character of the chemical bonds in the crystalline lattice as well as the relative strength of the bonds between different atoms in the elementary cell, proving that the Nb-O bond is stronger than the Zn-O one. Zn-Zn overlays of [–0.001] [61,62,63] and those in the range [−0.05–0.025] for Oj-Oj are all negative values, revealing the very low possibility of ionic rejection (Table 3).

2.1.2. Scanning Electron Microscopy Analysis of Pseudo-Binary Oxides

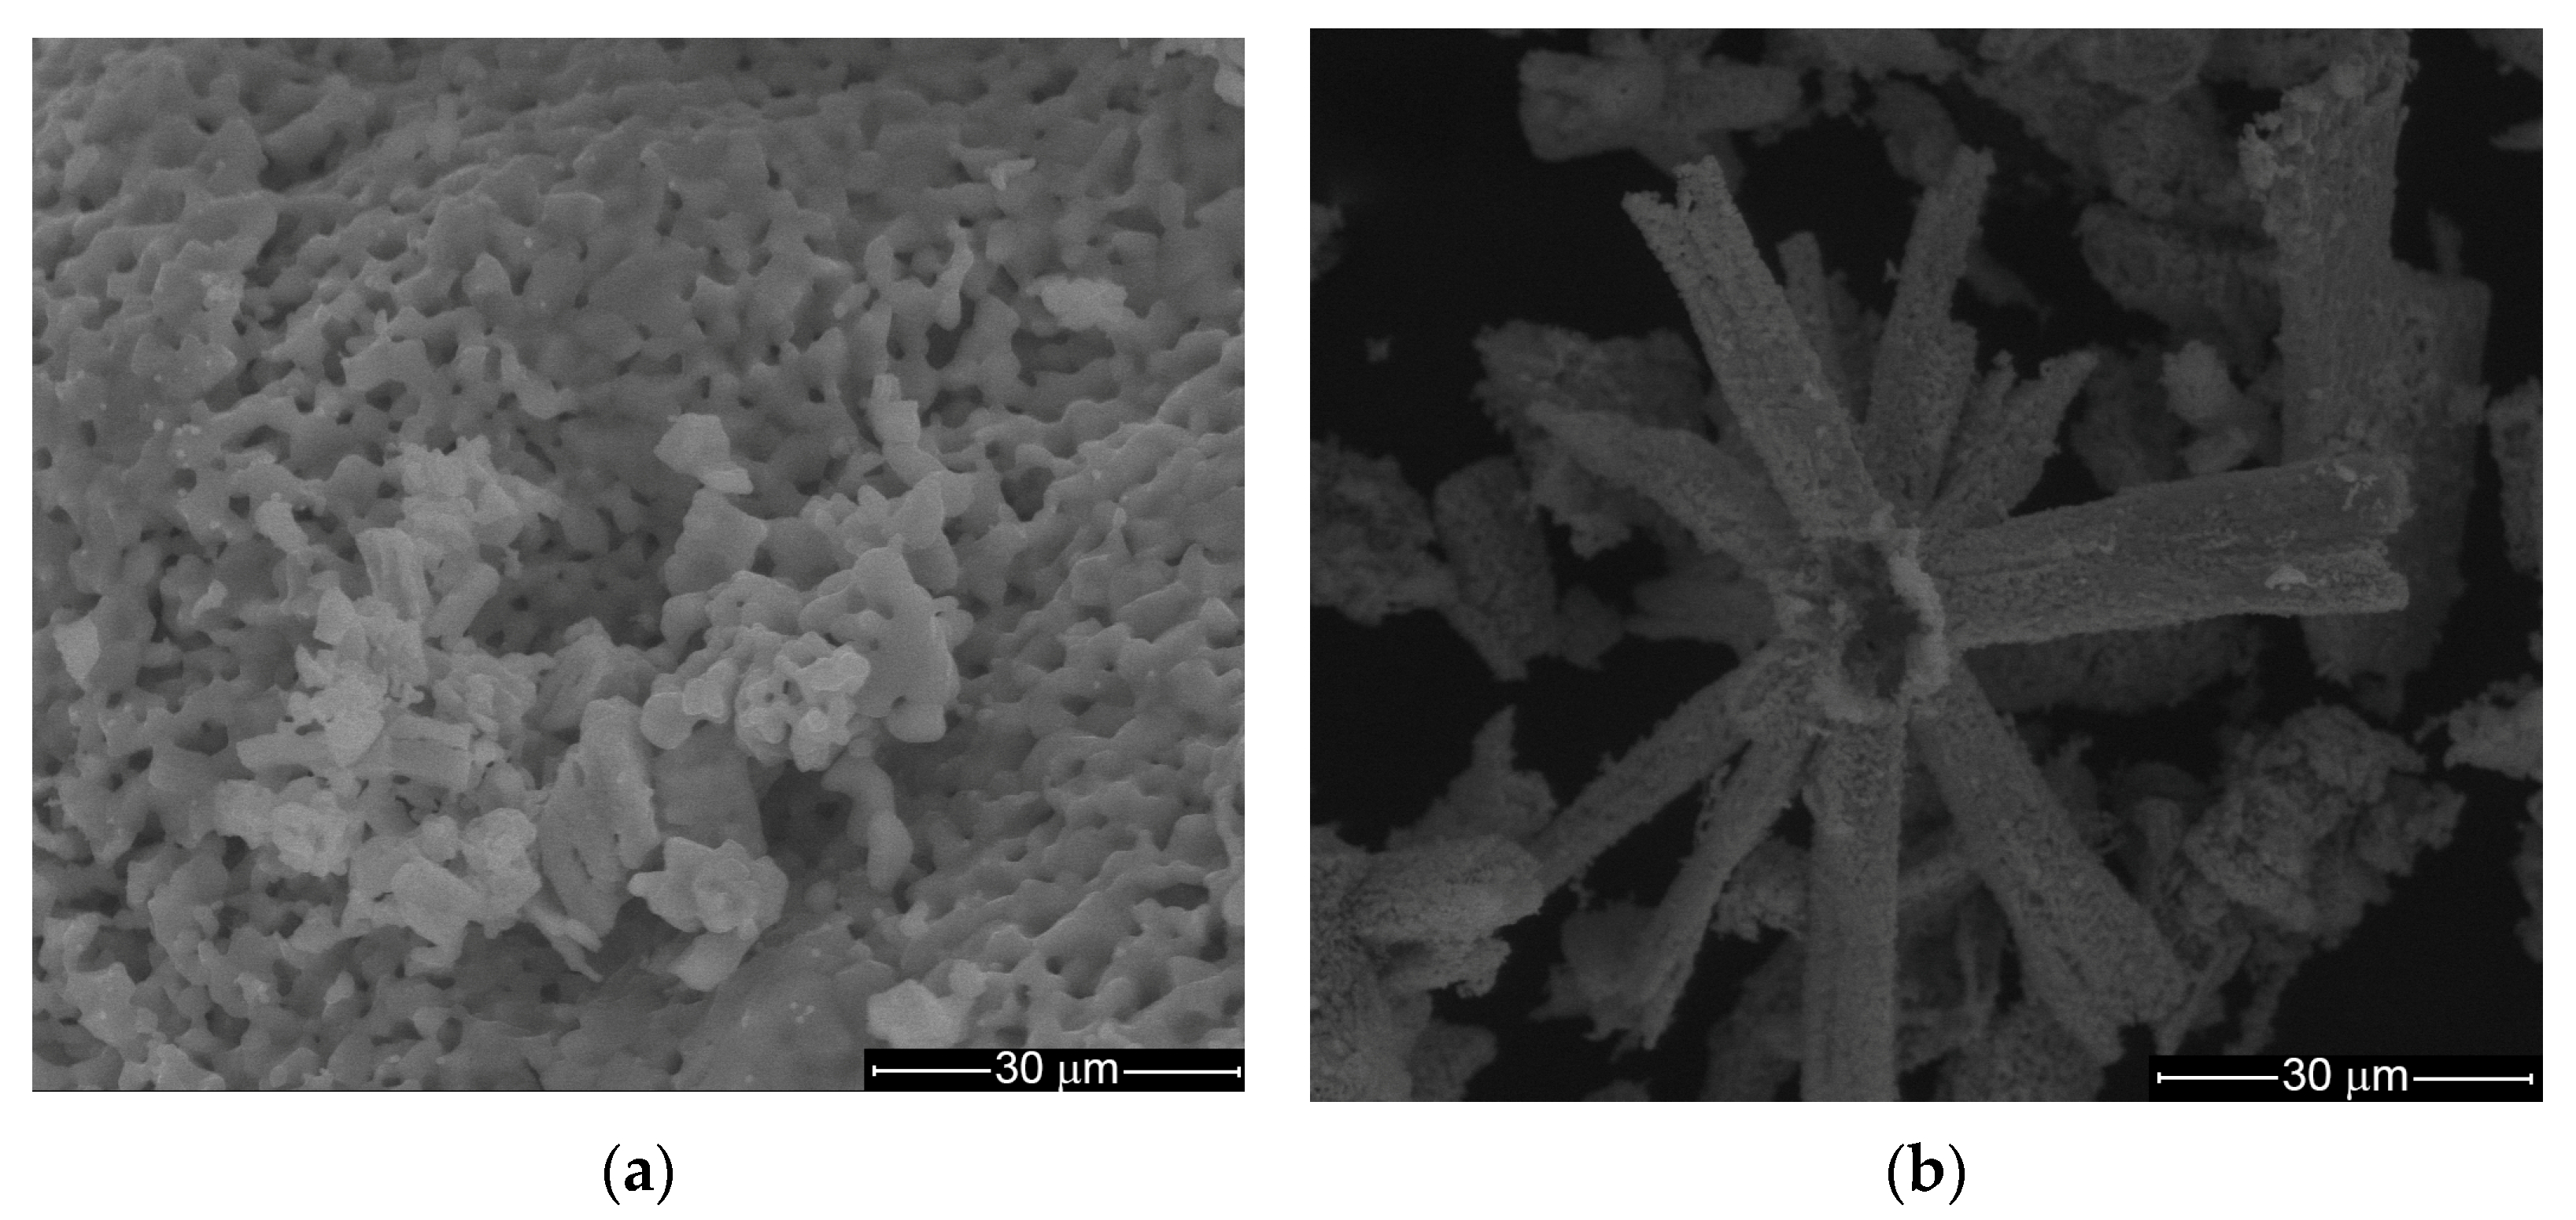
Figure 3 shows the SEM morphology of the non-doped Zn3Nb2O8 and Eu3+-doped Zn3Nb2O8: Eu3+ oxides obtained by the solid-state method. The solid-state method was chosen due to its advantages, such as homogeneity and purity of the nanomaterials and a low reaction time. The magnification used in the SEM analysis was 1600× in a low vacuum. As can be seen from Figure 3a, when the pseudo-binary oxide Zn3Nb2O8 is not doped, it forms sponge-like agglomerates, while when it is doped with Eu3+ ions, it crystallizes in the form of long, thin platelets (Figure 3b) that organize into radial multiple-spoke wheels.

2.1.3. Infrared Spectroscopic Characteristics of the Zn3Nb2O8 Nanomaterials

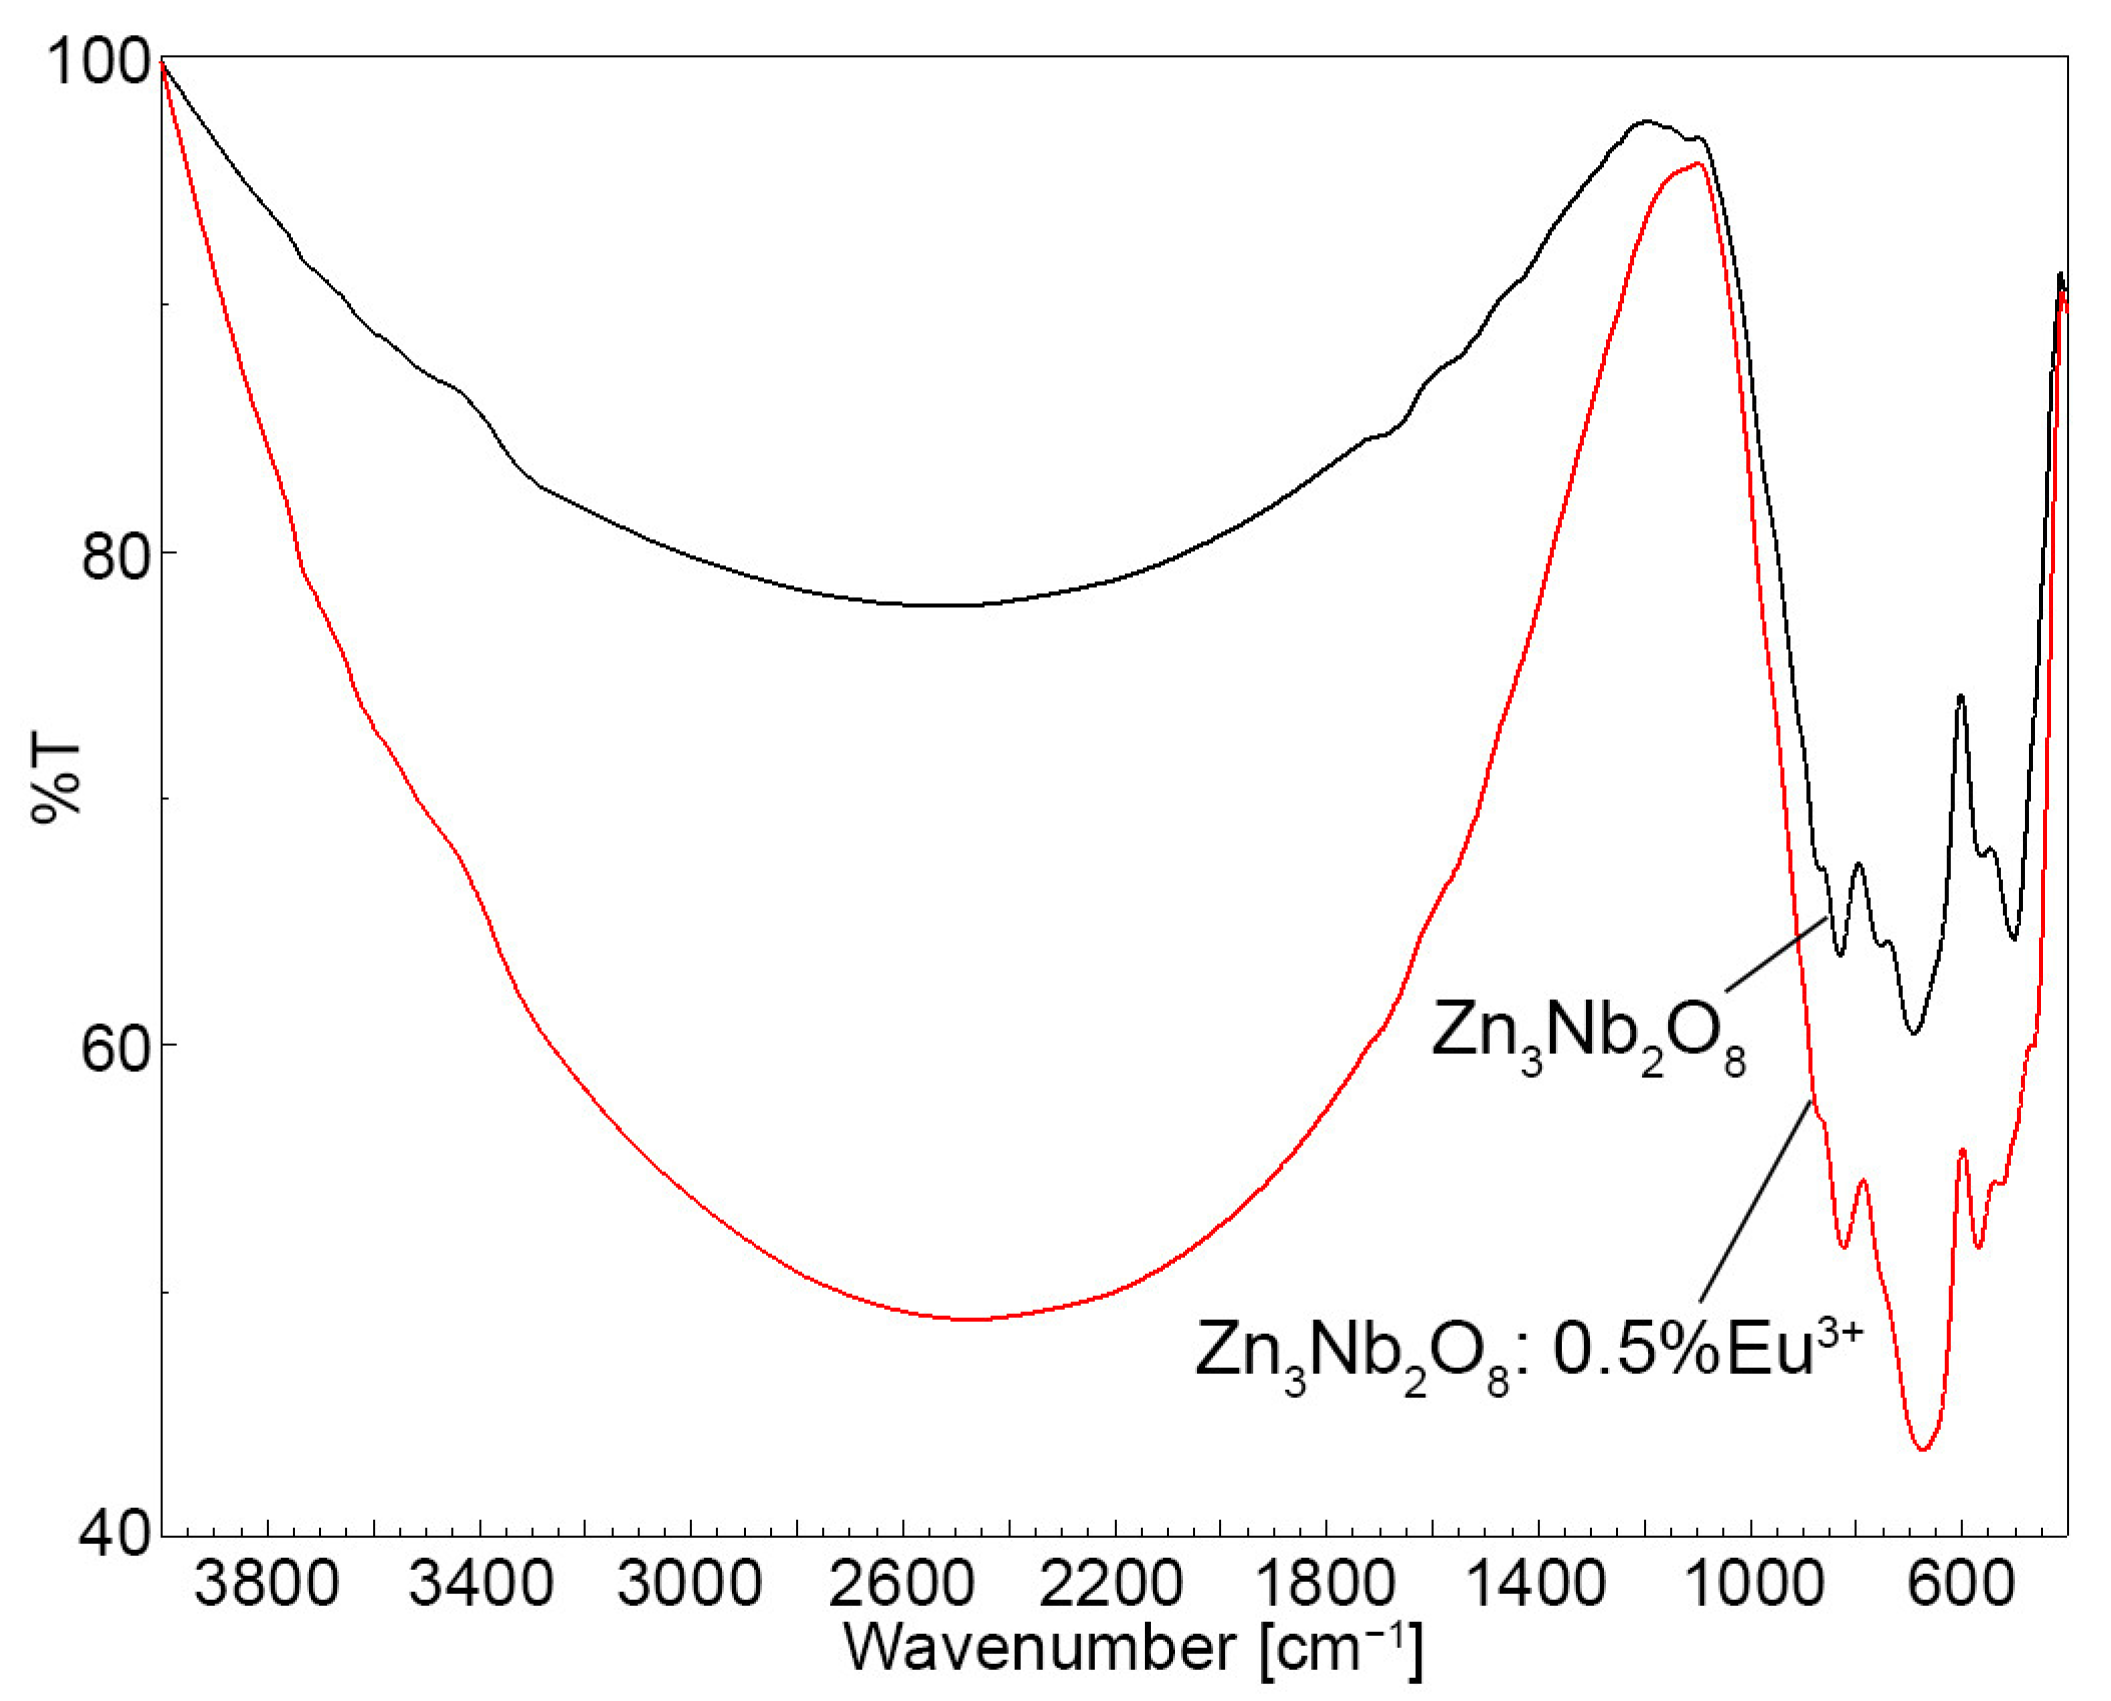
From the FT-IR spectra of pure Zn3Nb2O8 and Eu3+ doped oxide (Figure 4), it can be observed that a shoulder is formed at 449 cm−1 and another one at 735 cm−1, not typical for either Nb2O5 or ZnO or Eu2O3 [64].
The absorption peak at 619 cm−1 corresponds to Zn–O bond stretching vibrations [65,66]. A band located at 501 cm−1 is assigned to ν(Zn–O–Nb) vibration [67], and the one at 563 cm−1 is due to ν3(Nb–O) vibration [68]. The peaks located at 691 cm−1 and at 829 cm−1 can be assigned to symmetric stretching of ν(Nb–O–Nb) [68,69] and to asymmetric stretching of ν(Nb=O) bonds [69]. The signal between 829−990 cm−1 is caused by stretching of the Zn-O bond [70].
The FT-IR spectrum for Zn3Nb2O8: Eu3+ presents a higher wavenumber for the stretching band belonging to Nb-O-Nb, meaning that the bond strength is increased due to the doping with Eu3+ ions.
The advantage of the Eu3+ ion insertion is that, because it has an even number of 4 f electrons, the beginning levels of the transitions in both the luminescence and the absorption spectra are nondegenerate (J = 0), and the interpretation of the ending transition levels is facilitated by the small total angular momentum J of the spectrum. The number of lines noticed for the 5DJ7F0 transitions in the absorption spectra or the 5D07FJ (J = 0–6) transitions in the luminescence spectra allows us to determine the site symmetry of the Eu3+ ions. The very intense and highly sensitive transition 5D07F2 indicates that the Eu3+ is not at the same site with a center of symmetry [71].

2.1.4. Luminescence Spectra of Pseudo-Binary Oxides: Zn3Nb2O8 and Zn3Nb2O8: 0.5% Eu3+

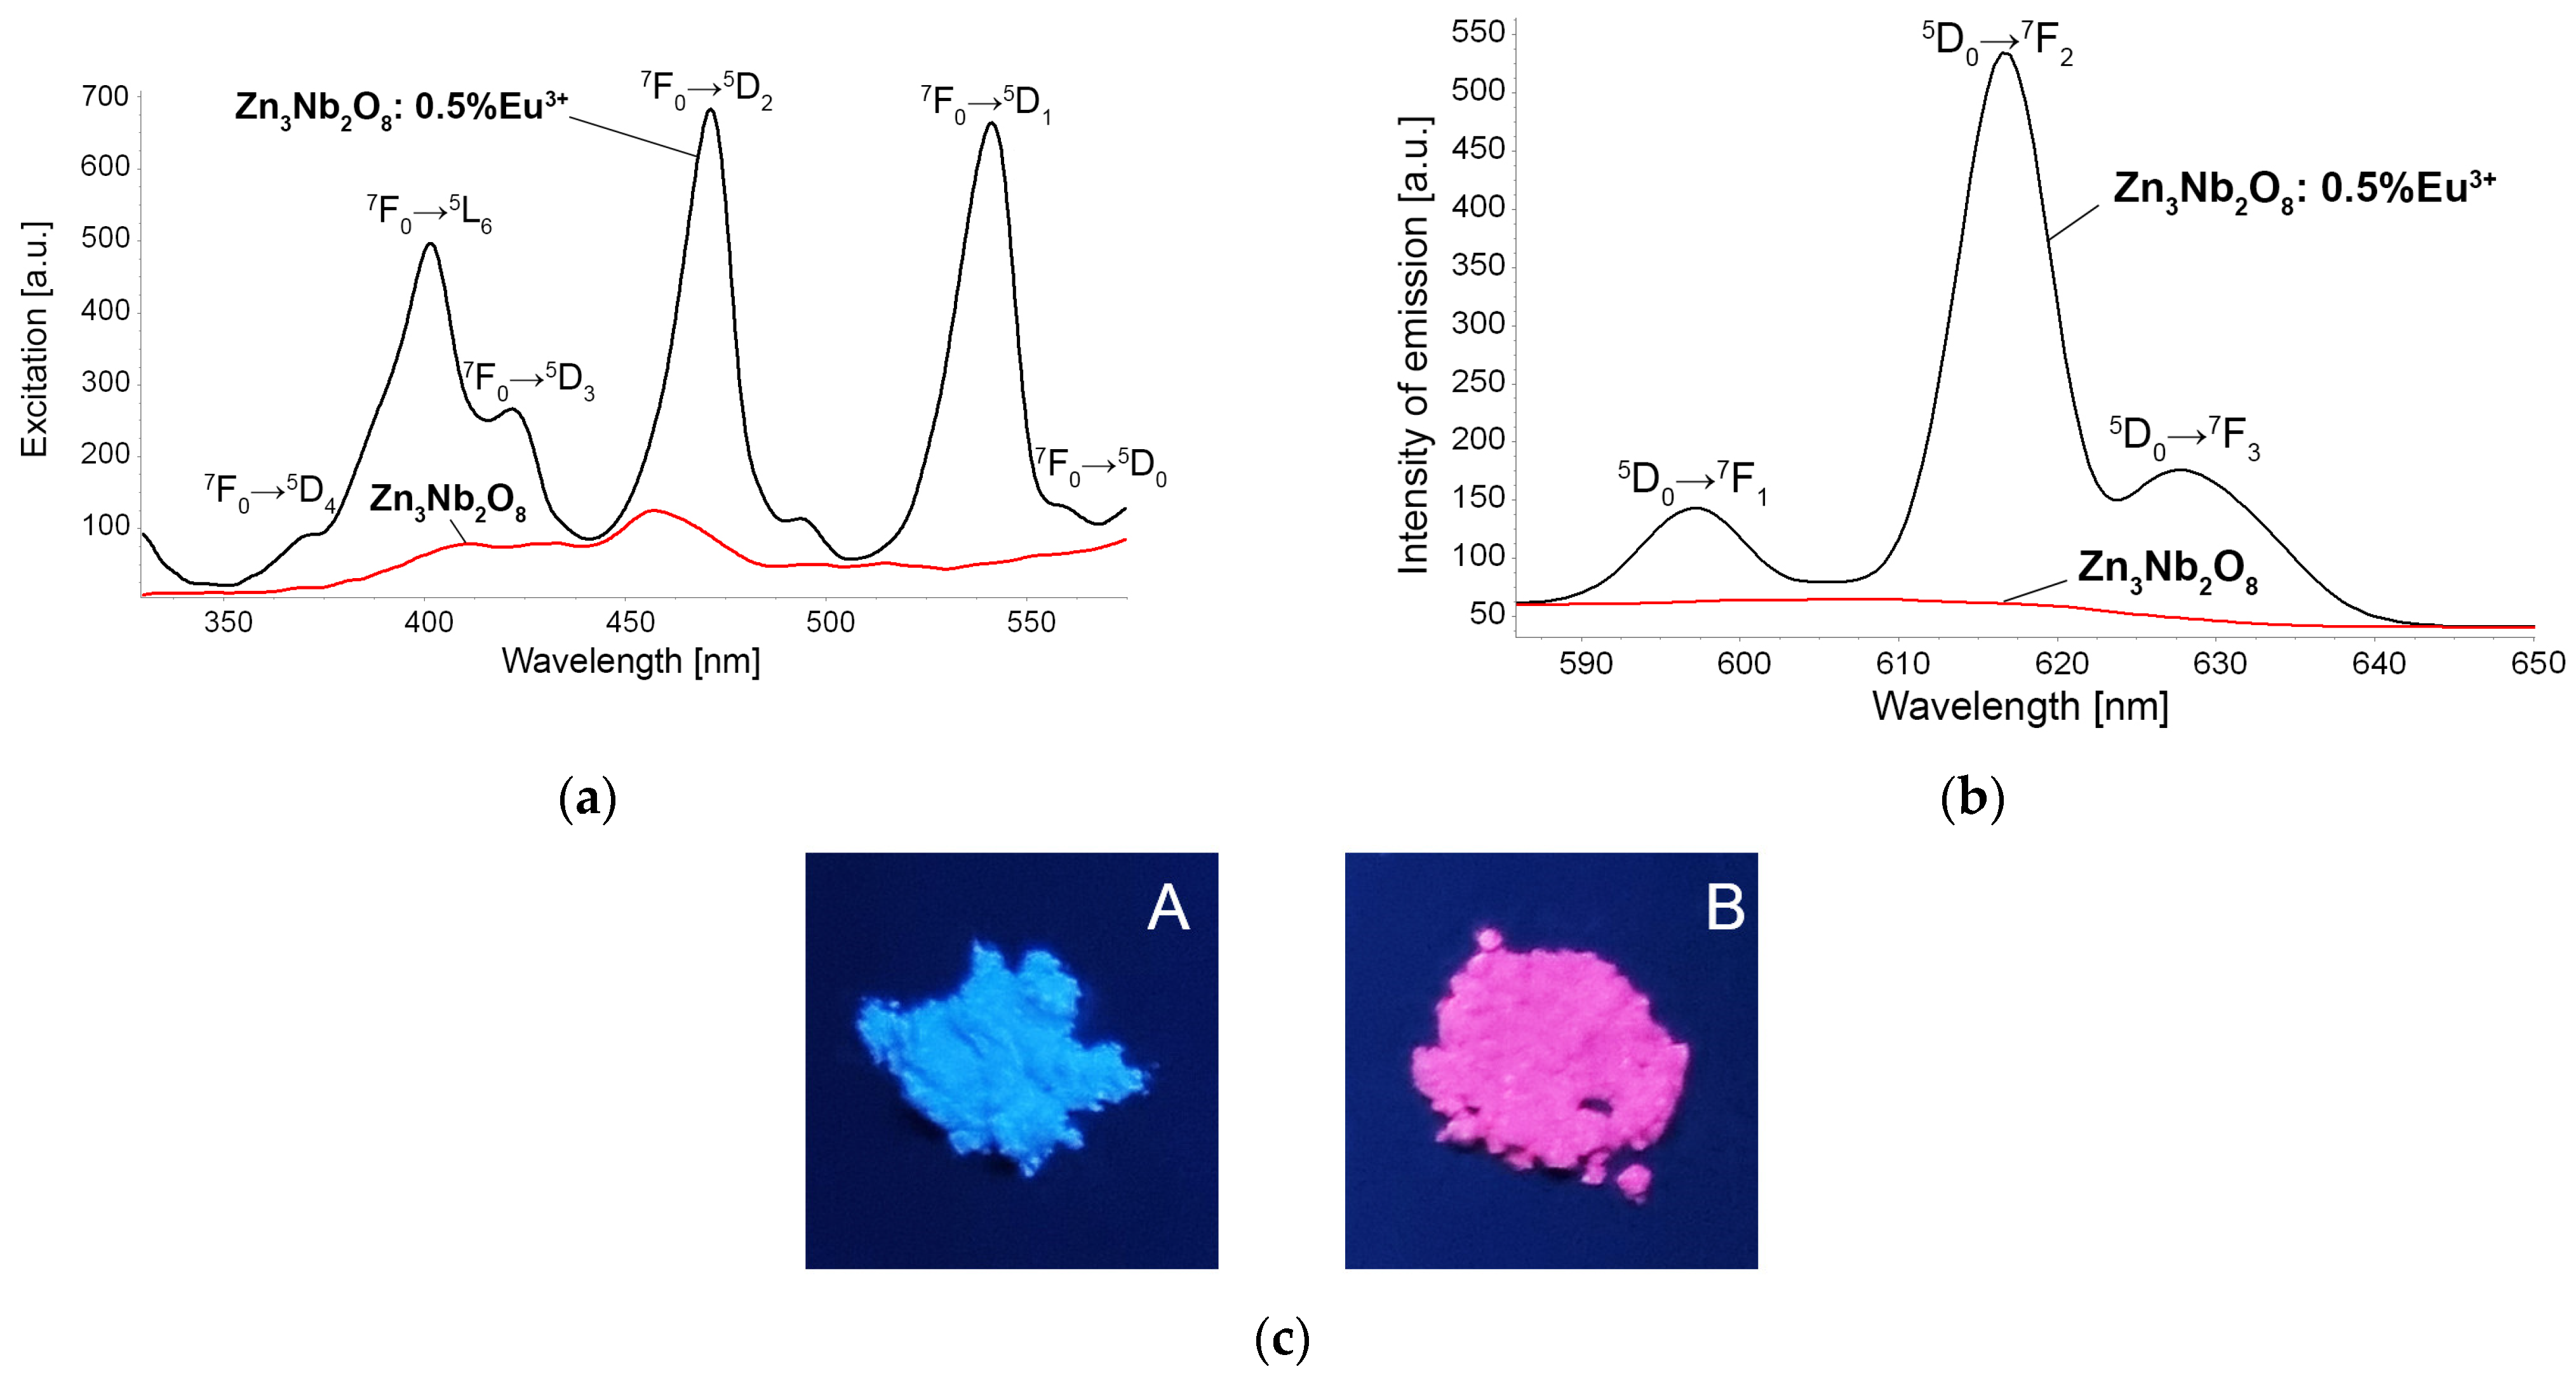
The photoluminescence spectrum (PL) (Figure 5) consists of two emission bands due to the transitions: 5D07FJ (J = 1–3) and 5D07FJ (J = 4), as well as the 5D07F0 (forbidden transition), due to the impurity ion Eu3+. From the experimental PL spectra of the Zn3Nb2O8: 0.5% Eu3+ nanocrystals (Figure 5a,b), the positional symmetry of the Eu3+ ions in the host matrix can be established using the selection rules from group theory [72]. It is known that, due to the absence of the center of symmetry in the host matrix (caused by the 4 f orbital with the opposite even orbital), the appearance of electric dipole transitions premises 5D07FJ (J = even) might result, while the presence of the center of symmetry for impurity ions Eu3+ in the host matrix allows magnetic dipole transitions 5D07FJ (J = odd). The asymmetry ratio R [73], defined as the relative intensity of the electric dipole transition 5D07FJ (J = even) and the magnetic dipole transition 5D07FJ (J = odd), depends on the local symmetry of Eu3+ ions. When Eu3+ ions occupy the central inversion sites, the transition 5D07FJ (J = even) should be relatively strong, while 5D07FJ (J = odd) is partially forbidden and should be relatively weak. Thus, experimentally, the intensity ratio R = 5D07F2/5D07F1 is a measure of the degree of distortion from the local inversion symmetry of the Eu3+ ion in the network. For the calculation of the intensity ratio, we used the peak areas of the transitions 5D07F1 and 5D07F2, respectively, for Eu3+. The intensity ratio R for Eu3+ is 2.6; thus, the local symmetry of Eu3+ ions in the Zn3Nb2O8 host matrix prefers to occupy the tetrahedral (Zn2+) or octahedral (Nb5+) symmetry without an inversion center. The forbidden transitions 5D07F0 are due to the crystal field effect [74], indicating that some impurity ions of Eu3+ are found in an interstitial place with low octahedral symmetry.
The emission spectra of Zn3Nb2O8 proved that this is an intrinsic blue light emitter, but in the case of Zn3Nb2O8: 0.5% Eu3+, an intense emission in the red region is produced due to the 5D07F1,2 that are hypersensitive transitions, being highly influenced by the coordination environment of Eu3+ ions [75] (Figure 5c).

2.2. UV-Vis Characterization of TAPP Porphyrin, Zn3Nb2O8, and Zn3Nb2O8: 0.5% Eu3+

The most significant band of porphyrin is the Soret band, or B band, located around 422 nm and assigned to the electronic transition from A1u orbitals to Eg empty orbitals. In the visible region from 500 to 650 nm, the TAPP porphyrin presents four Q absorption bands (Figure 6). The differences in intensity of these bands depend on the nature of substituents grafted on the pyrrolic ring and are of etiotype in this case, meaning that the intensity is decreasing in the following order: OIV > QIII > QII > QI. The Q bands are assigned to electronic transitions of inner nitrogen atoms of porphyrin from the fully occupied electronic orbitals of A2u to the empty orbitals belonging to the Eg electronic configuration [76].
For absorption spectra investigations, the integrating sphere of the UV-VIS-NIR Lambda 950 spectrophotometer was used, and the diffuse reflectance spectra were obtained at room temperature. From the absorption spectrum presented in Figure 7, it is observed that all the obtained nanocrystals have an absorption band in the UV range. The non-doped Zn3Nb2O8 has an absorption band at a wavelength of 304 nm, and this absorption band is slightly hypsocromically shifted when the nanocrystal is doped with Eu3+ ions (302 nm).
The band gap is estimated from the graph k / s h ν 2 versus hν (energy) in Figure 7, where k is the absorption coefficient, s is the diffusion coefficient, and hν is the photon energy. The band gap for Zn3Nb2O8 is 3.7 eV, and for Zn3Nb2O8: 0.5% Eu3+, it is 3.85 eV. The absorption band is due to the f-f electronic transitions of Eu3+ ions from the 7F0 fundamental level to different excited states (5D4, 5D2, 5D1, and 5D0). If multiple individual transitions between energy levels are occurring, UV-Vis spectral lines are present, and if a sum of simultaneous transitions between very close energy levels is taking place, spectral bands can be discussed, as in this case.
Figure 7. Absorption spectra of 1—Zn3Nb2O8 and 2—Zn3Nb2O8: 0.5% Eu3+. Inset: plot of {(k/s)hν}2 vs. hν (energy) of 1—Zn3Nb2O8 and 2—Zn3Nb2O8: 0.5% Eu3+.
Ijms 24 08920 g007
The optical transitions that occur in the case of Eu3+ ions originate from the same configuration (4 f for trivalent Eu3+ ions) [77]. Quantum mechanics shows that various kinds of isolated microsystems can make transitions between discrete levels of energy. As it is clearly known, transitions to higher vibrational and rotational energy levels take place with energy absorption, and those to lower levels are accompanied by radiation emission. A triplet state (electrons have parallel spins) is lower in energy than the corresponding singlet state (electrons have paired spins). Furthermore, spin-forbidden and symmetry-forbidden selection rules have to be considered [78].

2.2.1. Theoretical DFT Calculation for Zn3Nb2O8

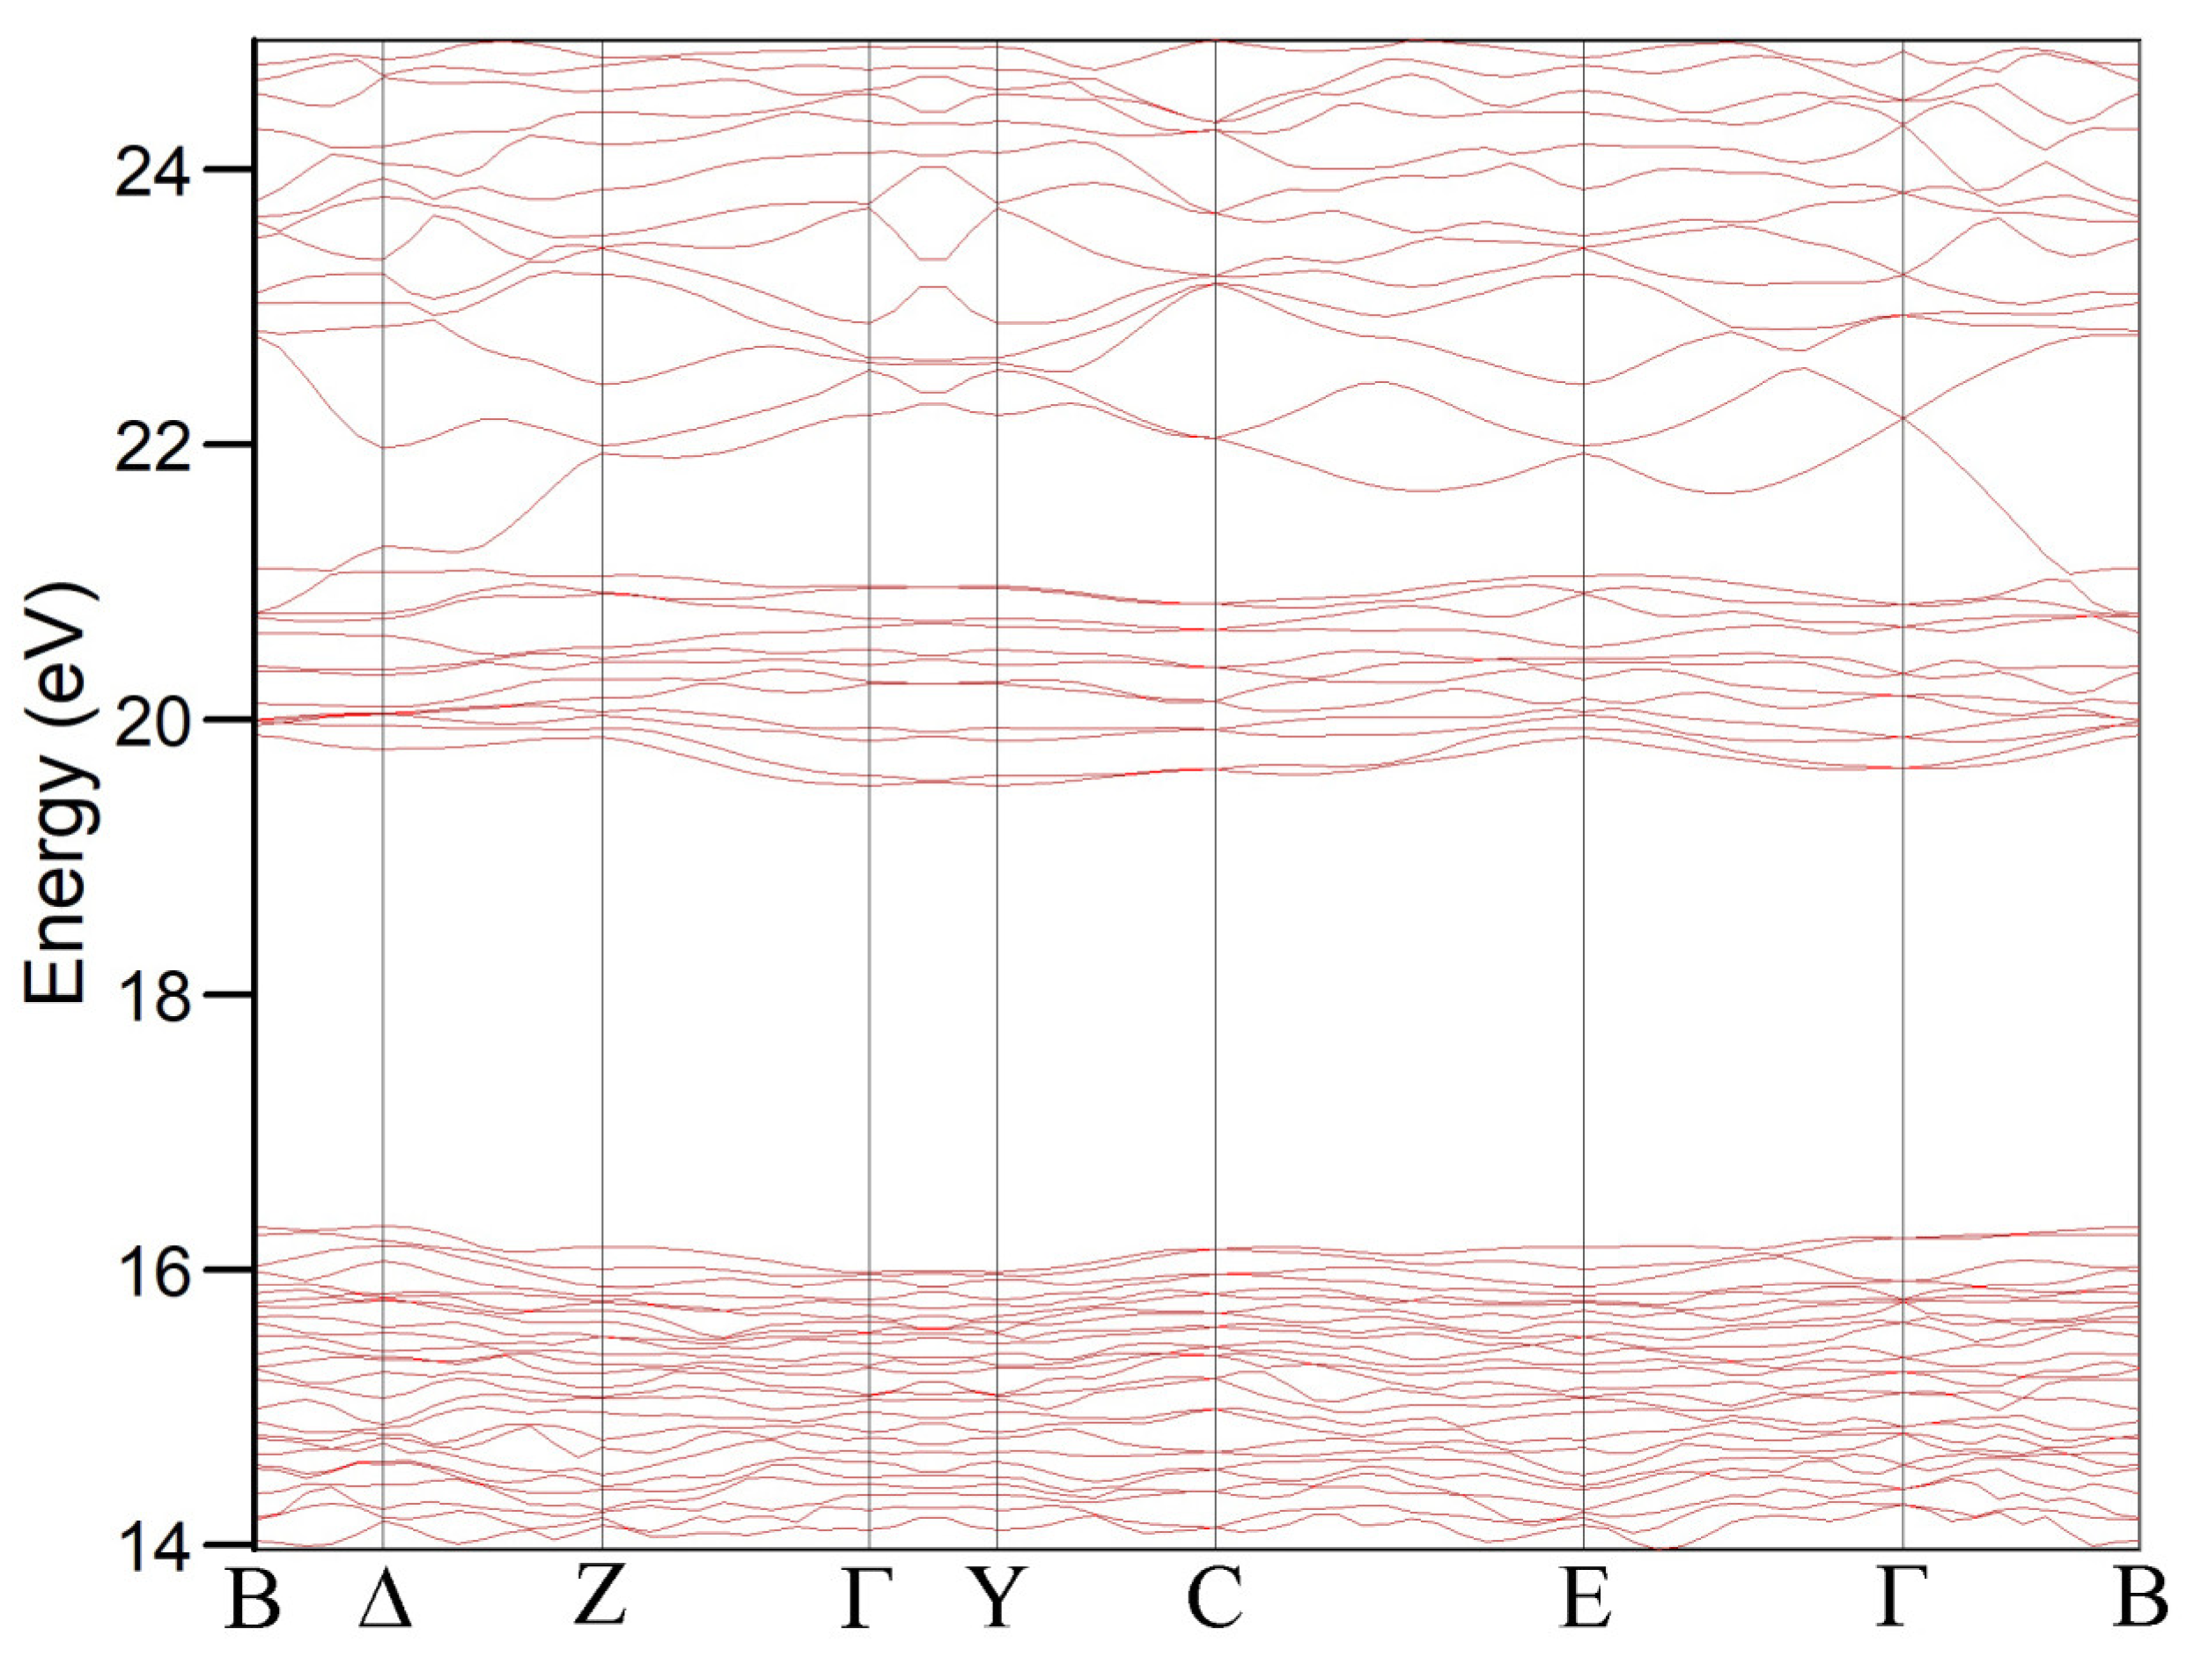
For the calculation of the band structure of Zn3Nb2O8, we used the DFT method. In the primitive cell, there are 300 electrons distributed in 150 of the crystal orbitals. The limits of the band gap are between orbital 150 of the valence band, as the last occupied one, and orbital 151 of the conduction band, as the first unoccupied one. The calculated value of the band gap is about 3.7 eV, in accordance with the experimentally determined value (Figure 8).
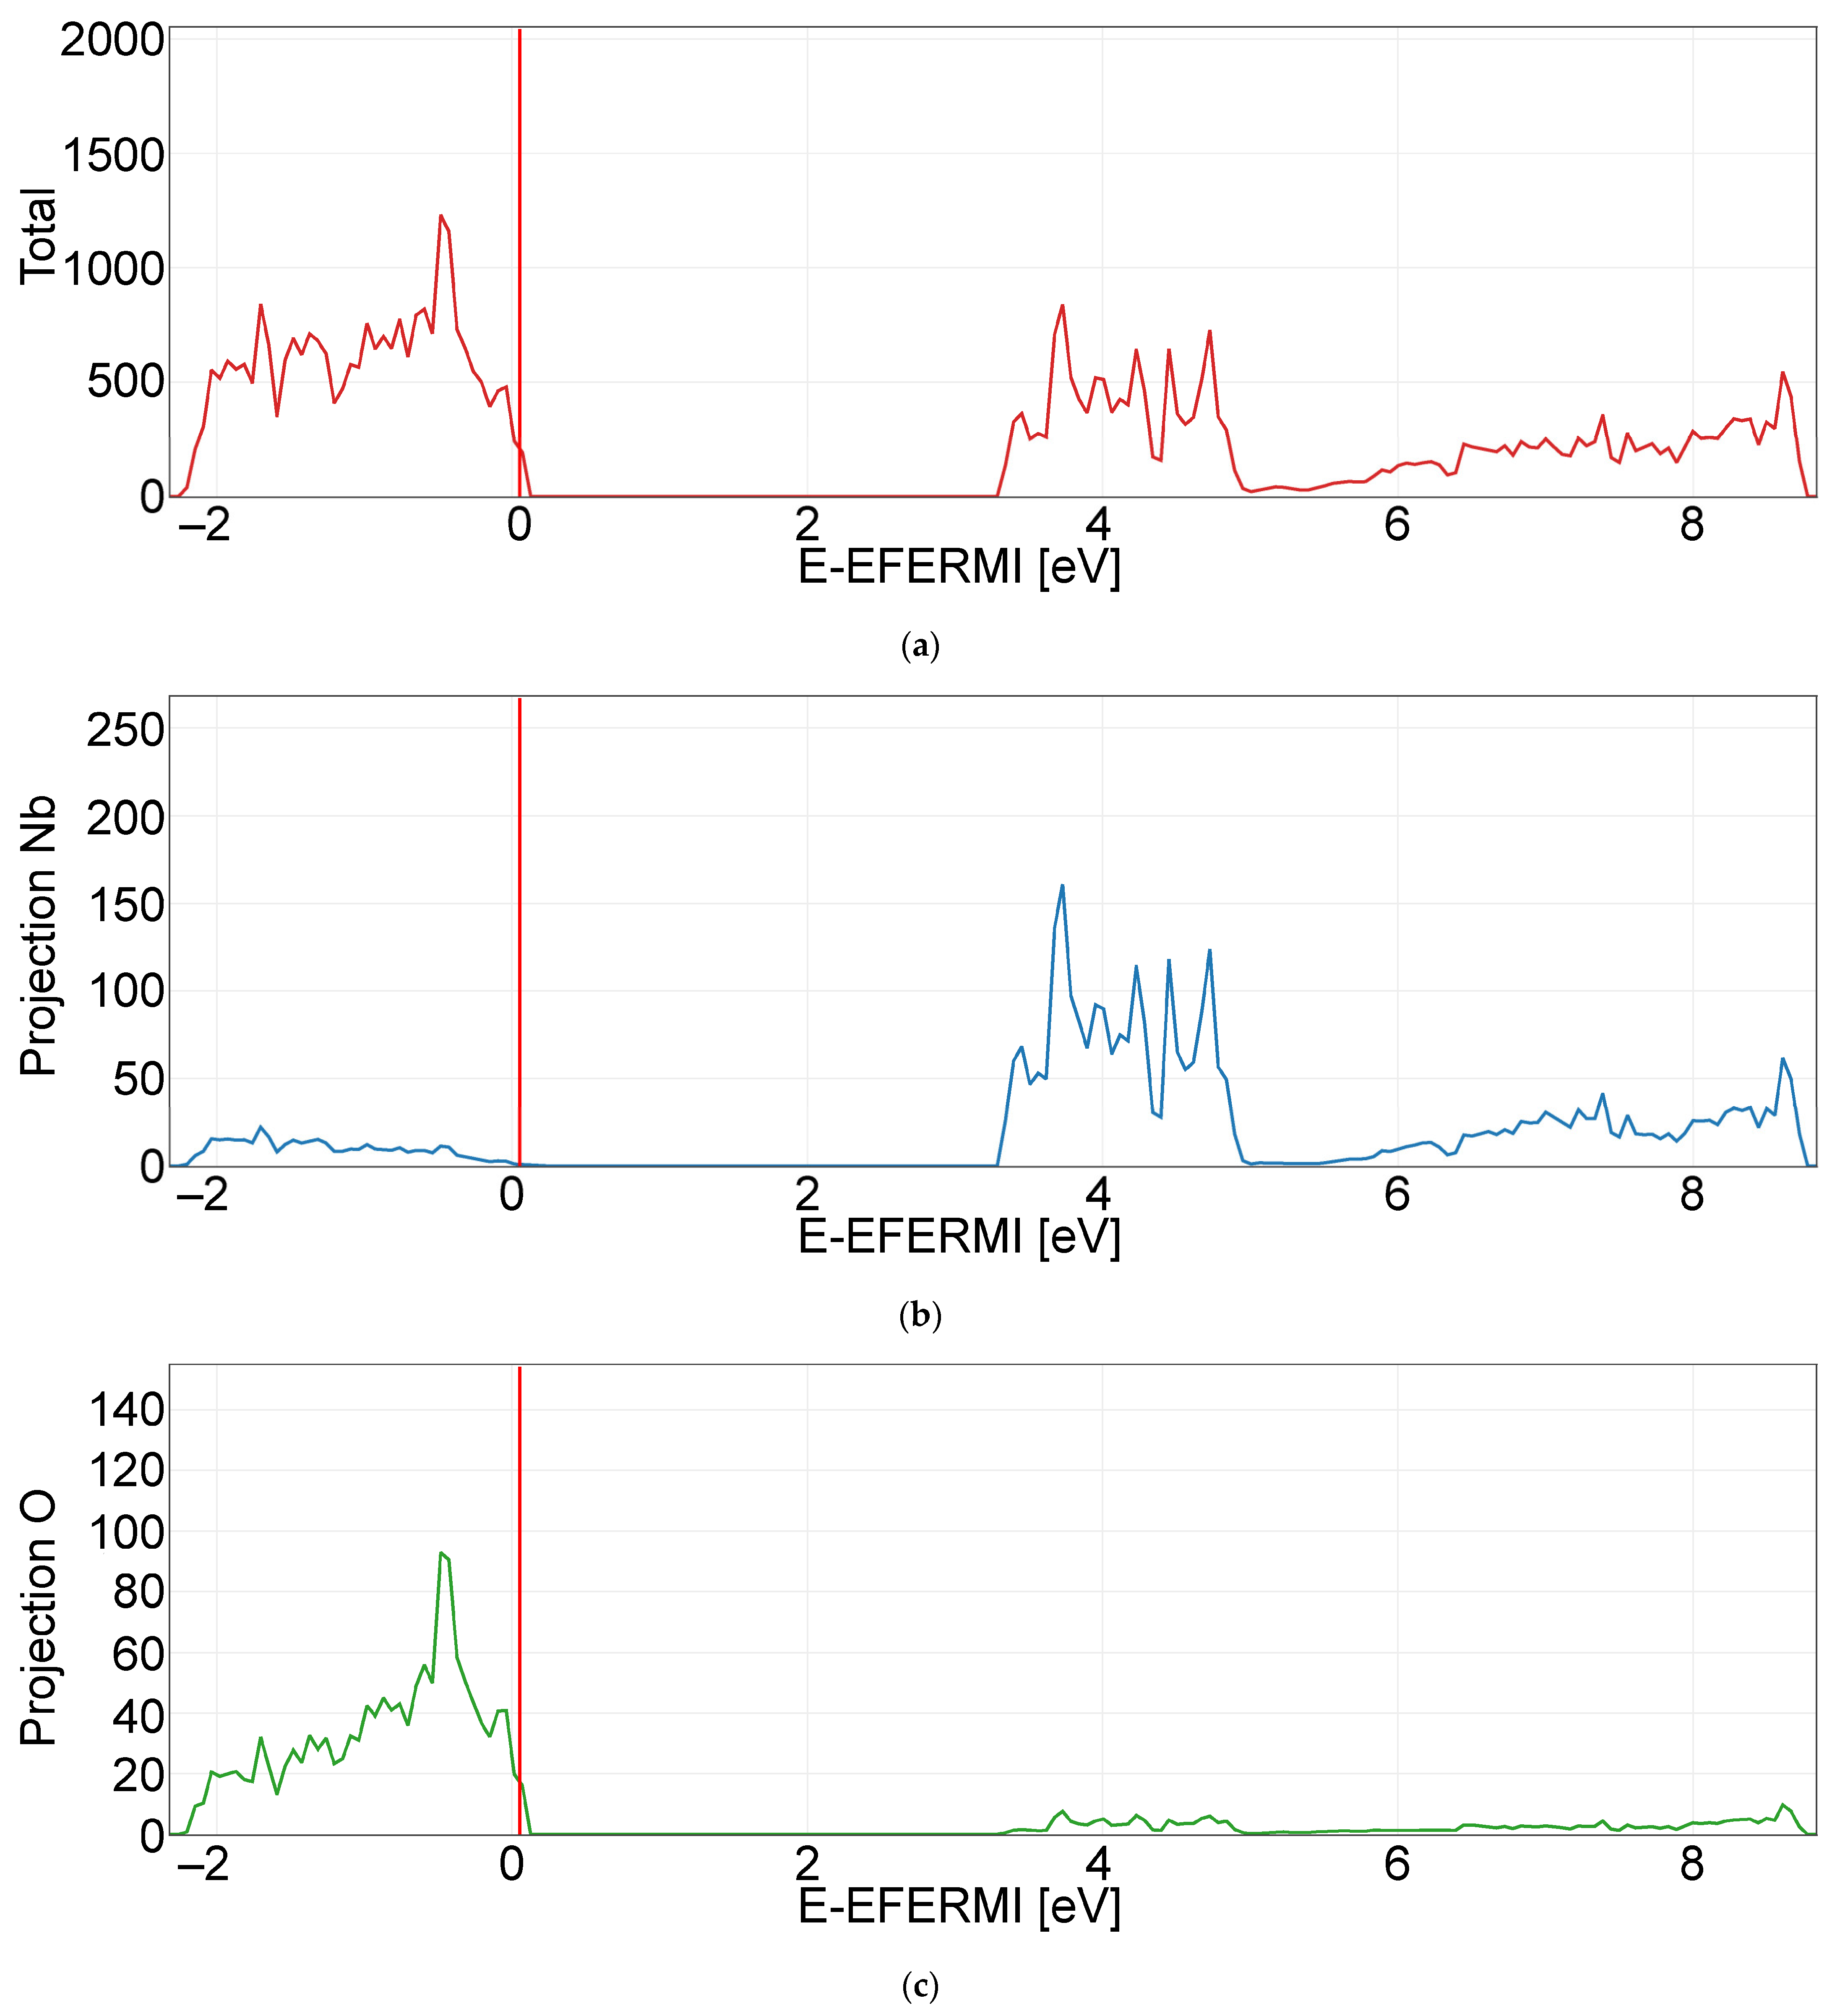
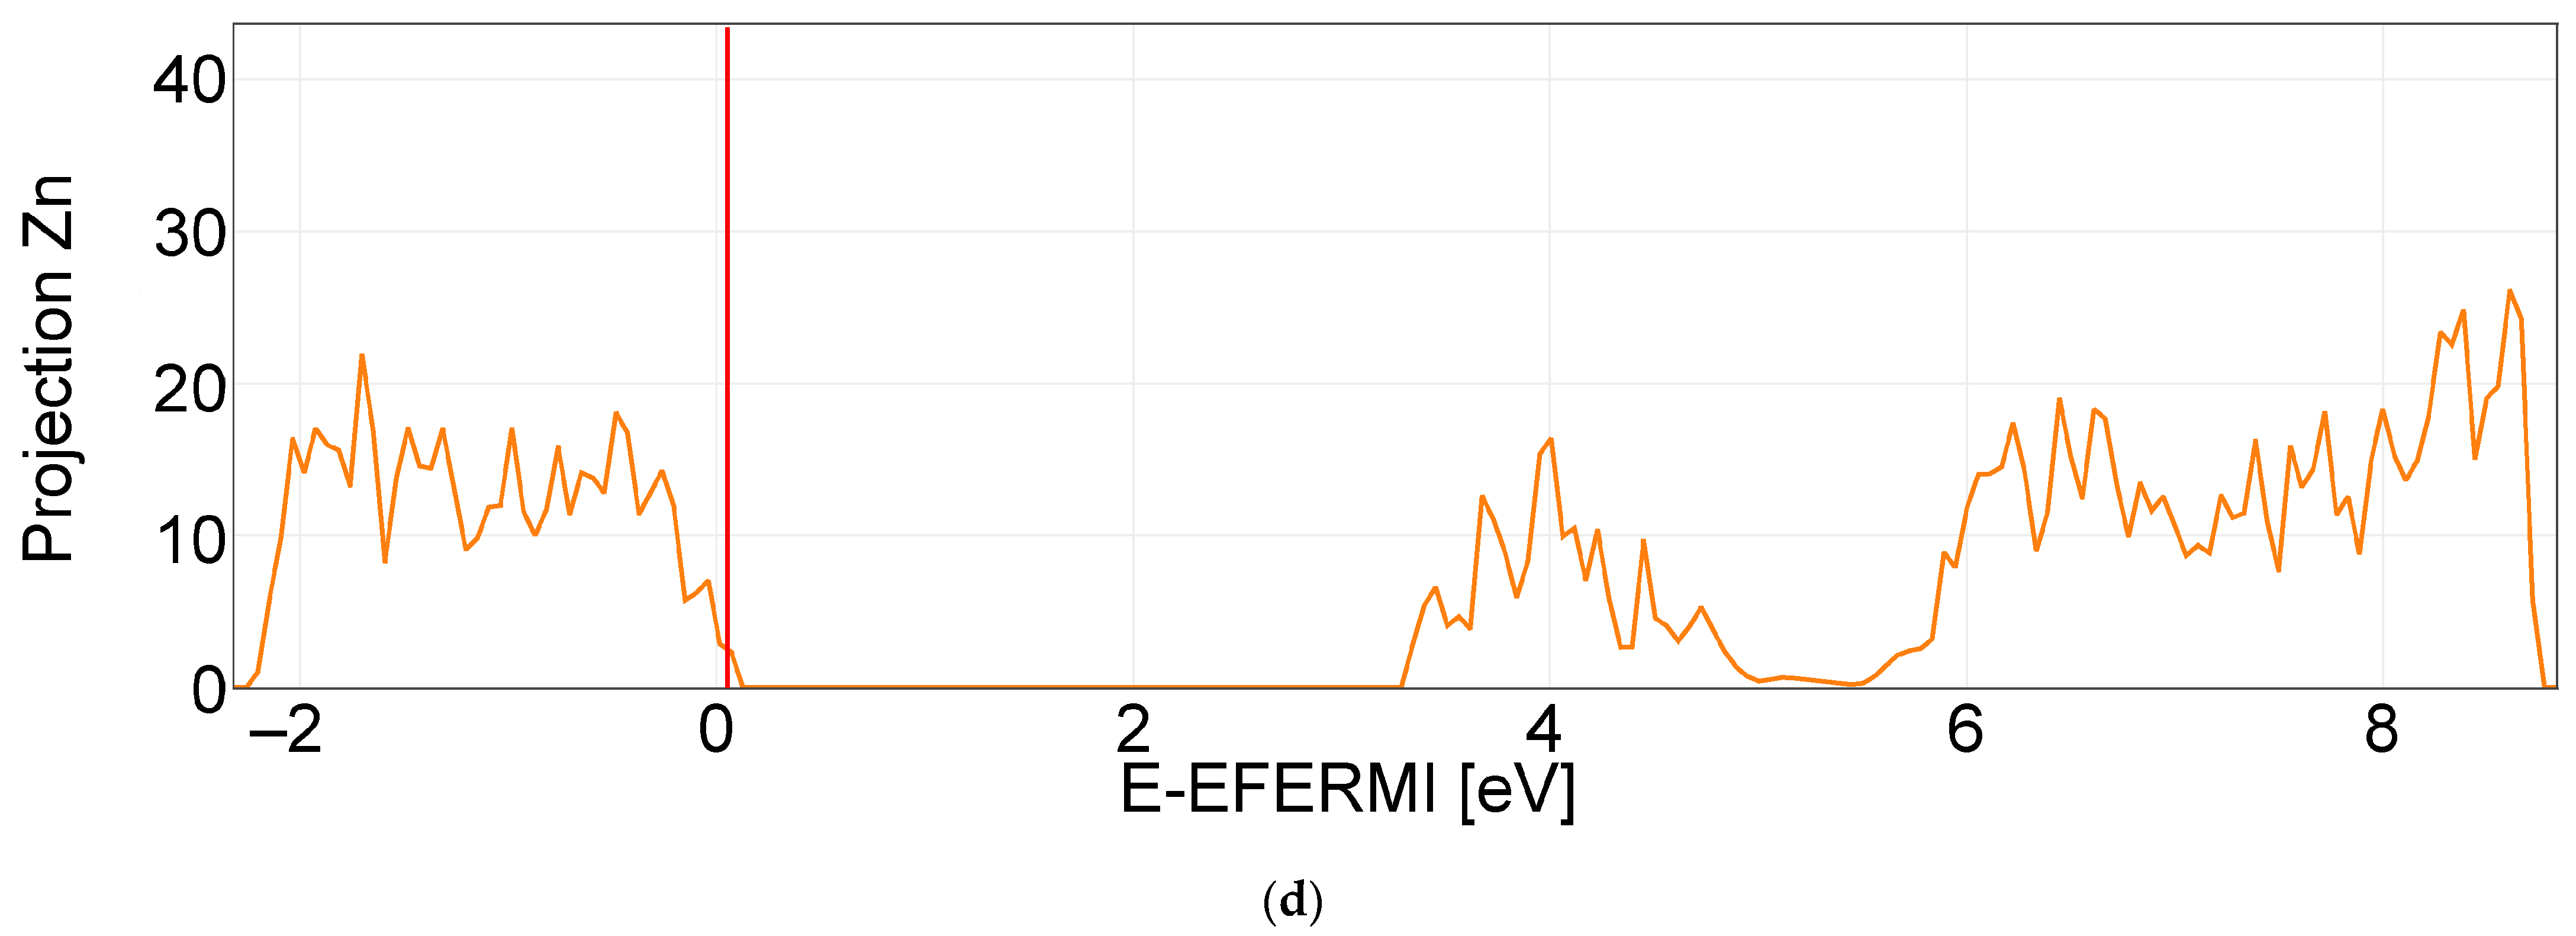
Figure 9 presents the total densities of the electronic state function (Figure 9a) and the same for each of the three types of ions constituting the lattice. In Figure 9b, it is observed that Nb has a minor contribution in the valence band compared to that in the conduction band due to electrons identified by previous Mulliken analysis assigned within the lattice. Similarly, in Figure 9c, the contribution of the oxygen ion, especially in the valence band, is revealed. Figure 9d shows that around the Zn ion there is an appreciable density of electronic states, given by those 18 electrons, as previously highlighted by the Mulliken analysis. All the values and conclusions that emerge are in good agreement with the previous DFT analyses [79].

2.2.2. DFT Analysis of the Crystalline Structure Zn3Nb2O8 in Order to Dope with Eu3+: Interstitial vs. Substitutional Chemical Choice
The main criterion for determining the existence of a crystalline structure using the DFT is the determination of its stability state by the convergence of its energy towards a minimum value.
From the very beginning, it should be emphasized that calculating and designing a crystalline material using DFT methods is more difficult as the doping level is lower. In principle, the method is simple in the case of substitutional doping and more difficult in the case of interstitial doping, in which the position in the asymmetric unit of the cell must be assigned so that the symmetry operations might correctly reconstitute the structure as a whole. The difficult issue lies in the fact that at low concentrations of doping, a multiplication of the primitive cell is mandatory to lead to the construction of a supercell, preserving the initial symmetry in which the doping ion is introduced. In this case, the 26 atoms present in the primitive cell with the 300 afferent electrons will supply in the smallest symmetrical supercell 208 atoms with a prohibitive number of electrons, requiring an extremely high computing power. Thus, the method is only feasible in the case of structures and symmetries that involve a limited number of ions in the primitive cell. The specific logistical effort and the allotted time are unjustifiable in this case.
DFT analysis is required and allows estimating the place that the doping ion can occupy in the crystalline structure, constituting a complementary method to the experimental data of spectral type.
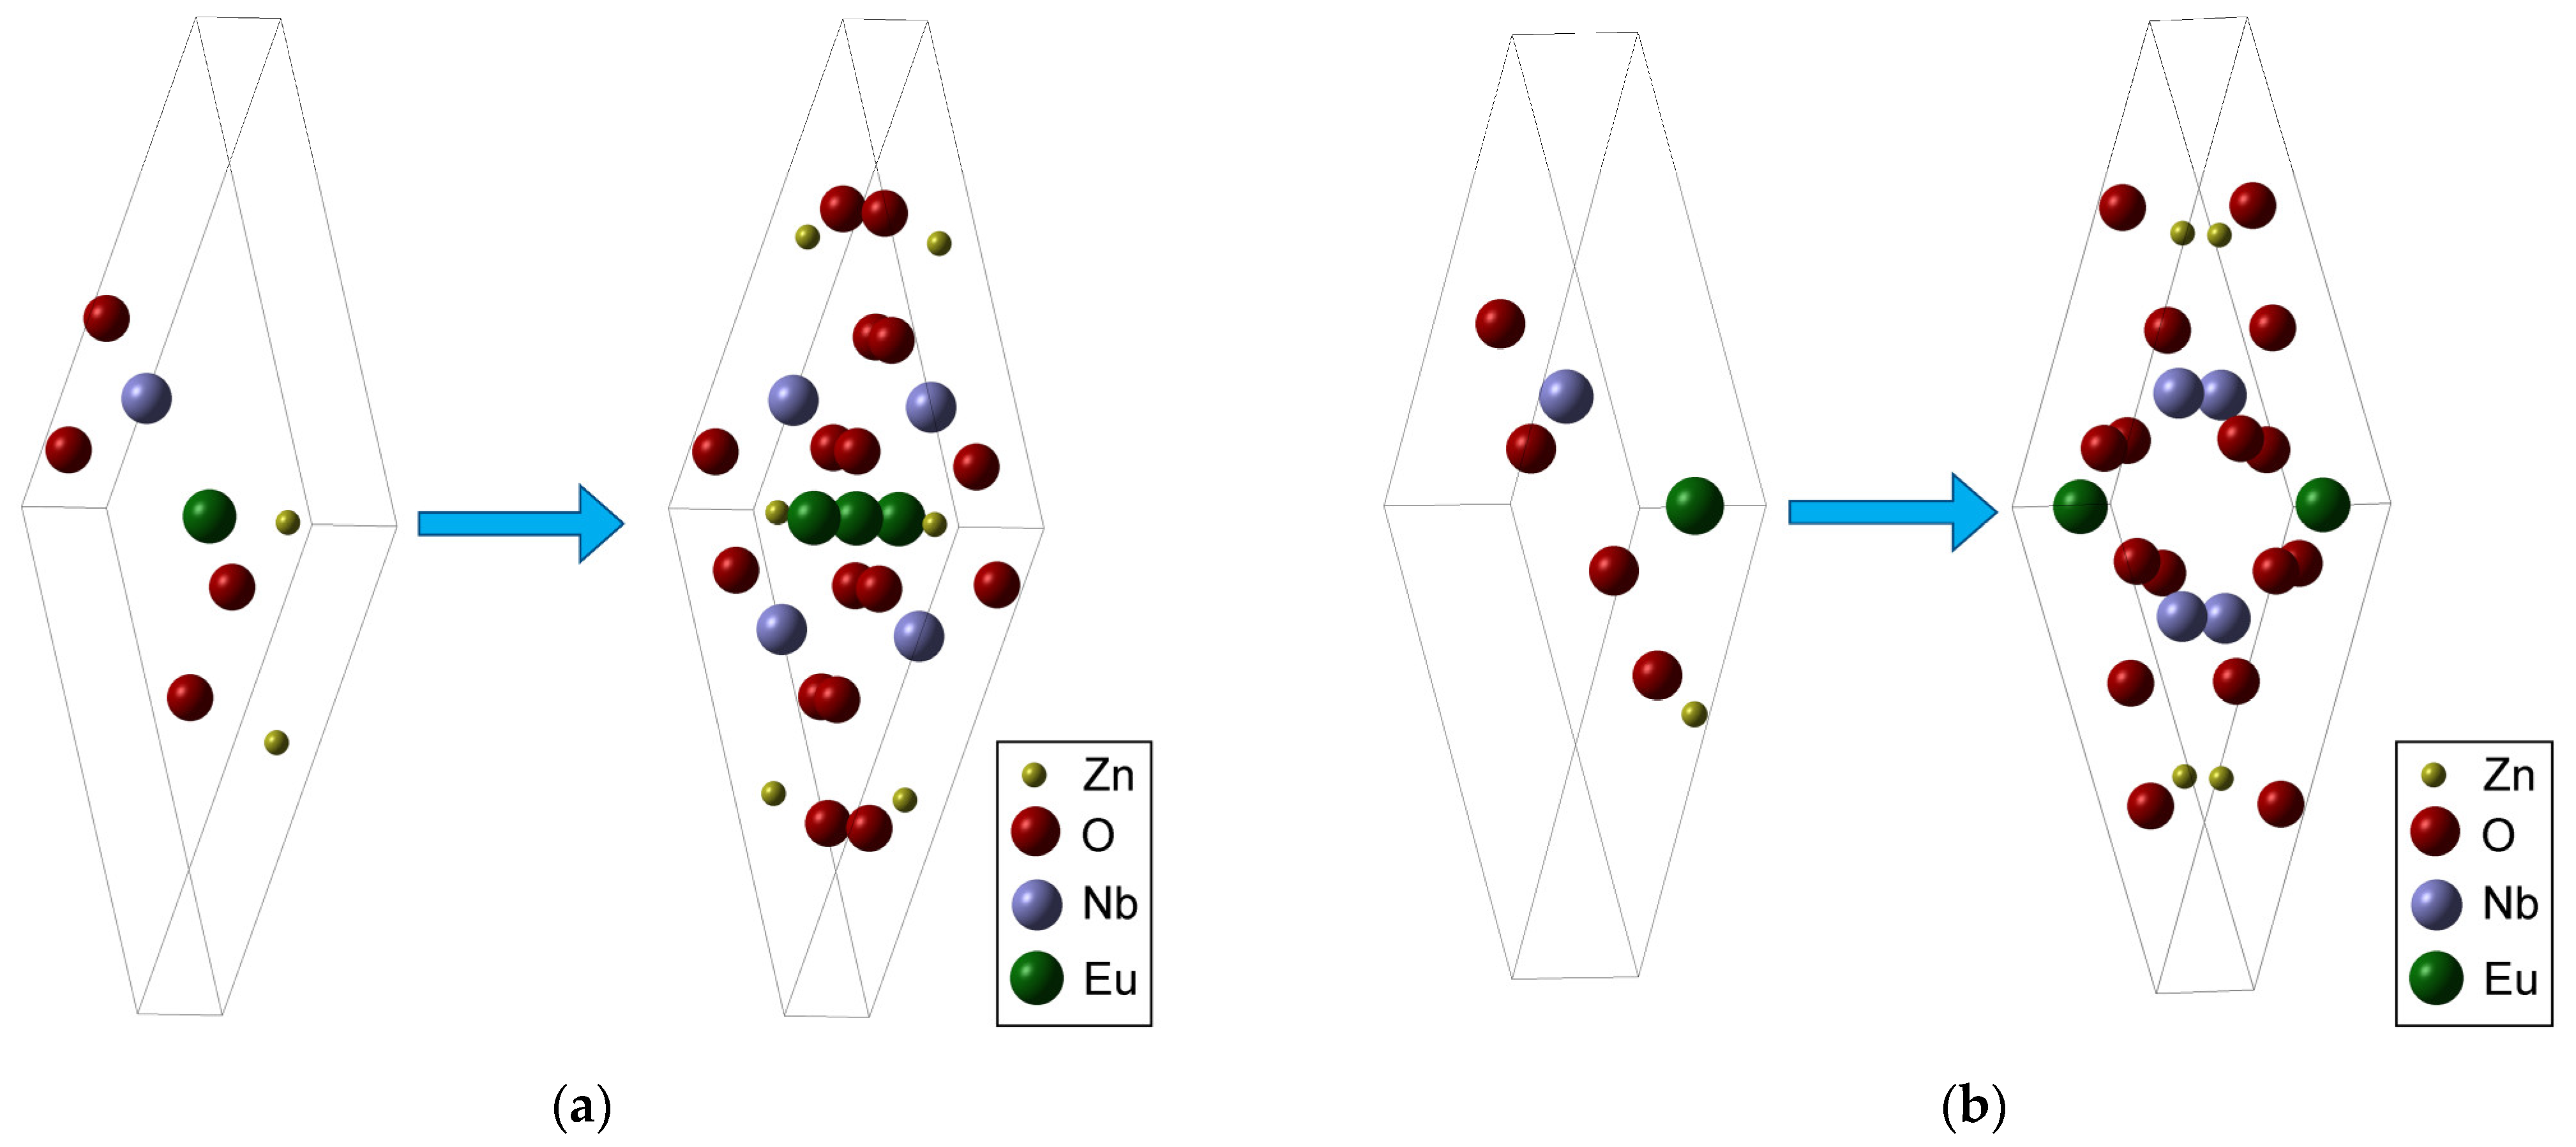
Figure 10a,b show two types of positions of the Eu in the crystal lattice, equivalent in terms of the type of crystal lattice, both belonging to the same group of symmetry. They are practically achievable positions because, during the synthesis process, the two elements, Eu and Zn, react simultaneously and competitively with oxygen due to the fact that Eu gives up its electrons more easily than Zn. This is the reason why Eu will take its place in the lattice with a certain priority over Zn so that, from the morphostructural point of view, both its interstitial and substitutional positions will be, more or less, equally accessible to it.
Due to the fact that Eu3+ is coordinated in an octahedral system in EuO6, as it is in Eu2O3 used as a reactant, we are also suggesting the possibility of Eu3+ substituting Nb5+ ions in the lattice.
The DFT calculation of the Zn3Eu2O8 compound meets both the symmetry conditions of the lattice, in high similitude to that of Zn3Nb2O8, as well as the demanded requirement of convergence towards a minimum energy (major stability criterion), with a band gap of only about 2.5 eV, much smaller than the 3.7 eV that is the value of Zn3Nb2O8.
Figure 10. (a) Eu3+ in the interstitial position—the asymmetrical unit with the primitive cell; (b) Eu3+ in the substitutional Zn(1) position—the asymmetrical unit with the primitive cell.
Ijms 24 08920 g010
As can be seen in Figure 11, where three adjacent (primitive cells) were exposed in a favorable plane to a relevant observation, it can be noted that the size of the Eu3+ with ionic radius R = 0.947 Å does not cause a major differentiation in the process of occupying either of the two types of positions (Table 4).
Along with the geometric arguments given by the DFT analysis and presented in Figure 10a and Figure 11a and Table 4, justifying the interstitial position of Eu3+, the FT-IR spectrum for doped Zn3Nb2O8 (Figure 4) revealed an increasing wavenumber for the stretching band belonging to the Nb–O–Nb bond as compared to the length of the same bond in the un-doped lattice.
Therefore, in the case of doping, both variants are basically indiscernible in the XRD spectrum (Figure 2a), because the reticular planes are identical in position in the lattice. From the point of view of calculating the DFT for the above-mentioned structures, at a much higher concentration than that specific to doping, the energy convergence in the substitutional case was achieved, while in the interstitial case it was not. However, this fact is unquestionably caused by the interactions between the positive Eu3+ ions placed in the median plane of the elementary cell, which are too close to each other.
Thus, in the case of syntheses at higher concentrations, according to the DFT analysis, only the structure shown in Figure 11b is possible. In this case, which is not doping but a structure of the type Zn3-xEuxNb2O8, the band gap is canceled, the material becoming a conductor. The Eu3+ ion contributes to the lattice with a large number of conduction electrons, but the lattice is, according to the calculation results, indeed possible.
In the case of low concentrations, as in this case, where these interactions on the middle area are practically non-existent, both types of positions in the lattice are available without canceling the band gap.

2.3. Characterization of Silica Materials by UV-Vis Spectroscopy
The resulting silica materials were ground to a final fineness ~10 μm and analyzed by UV-Vis and fluorescent spectroscopy in the solid state.
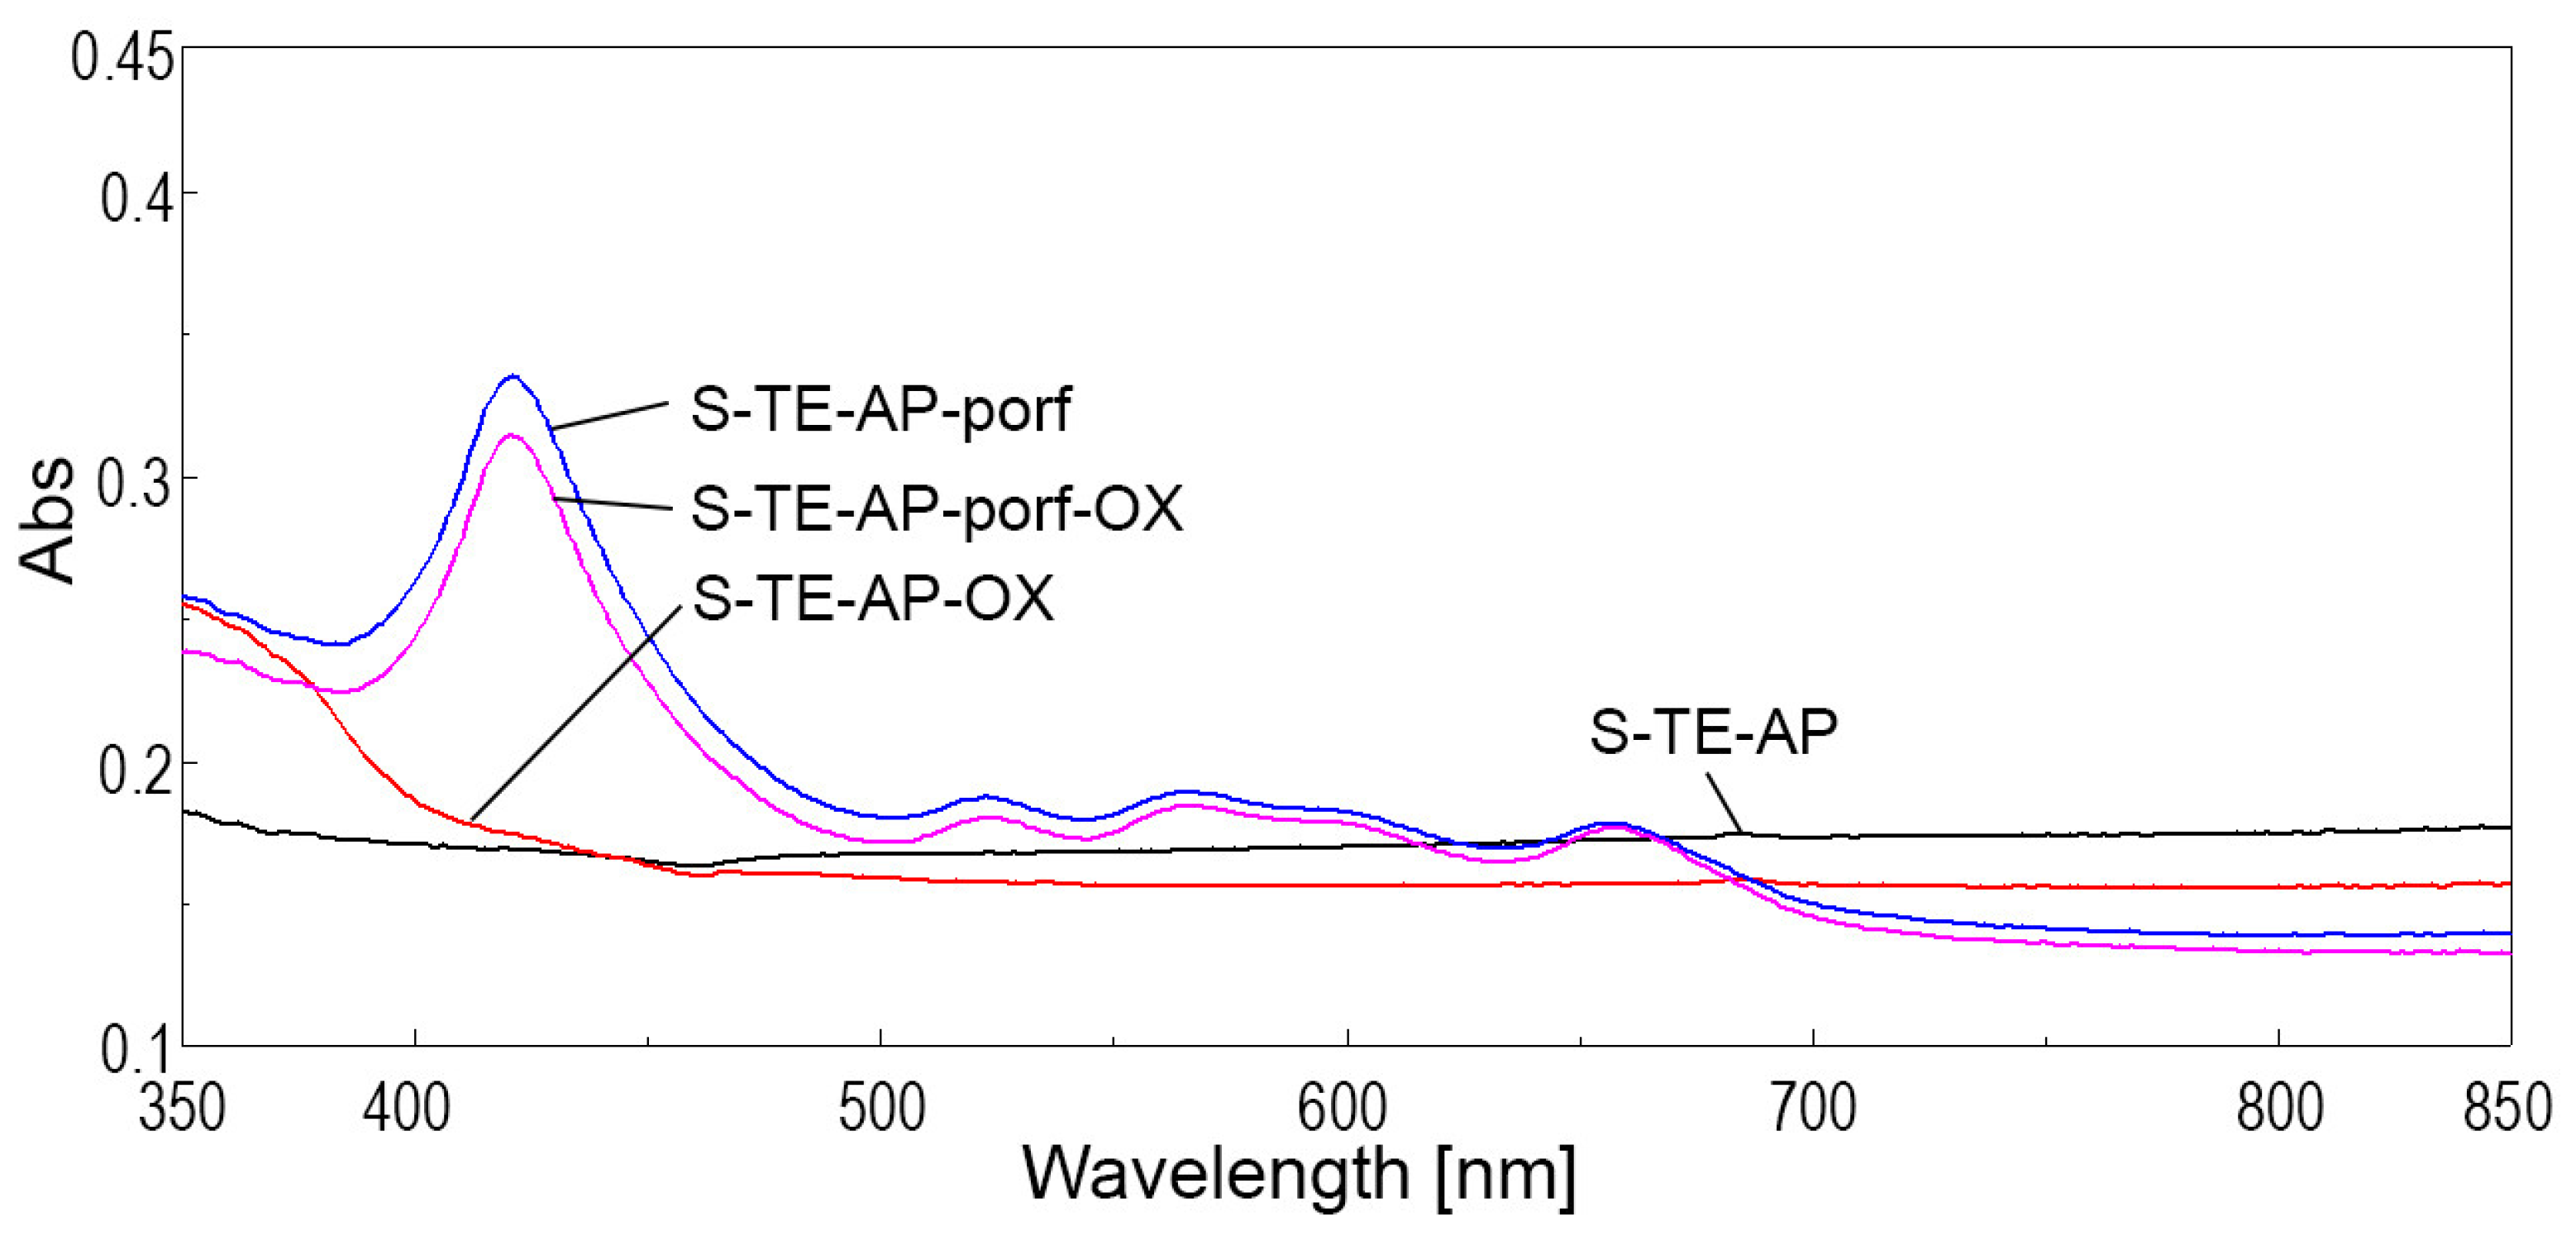
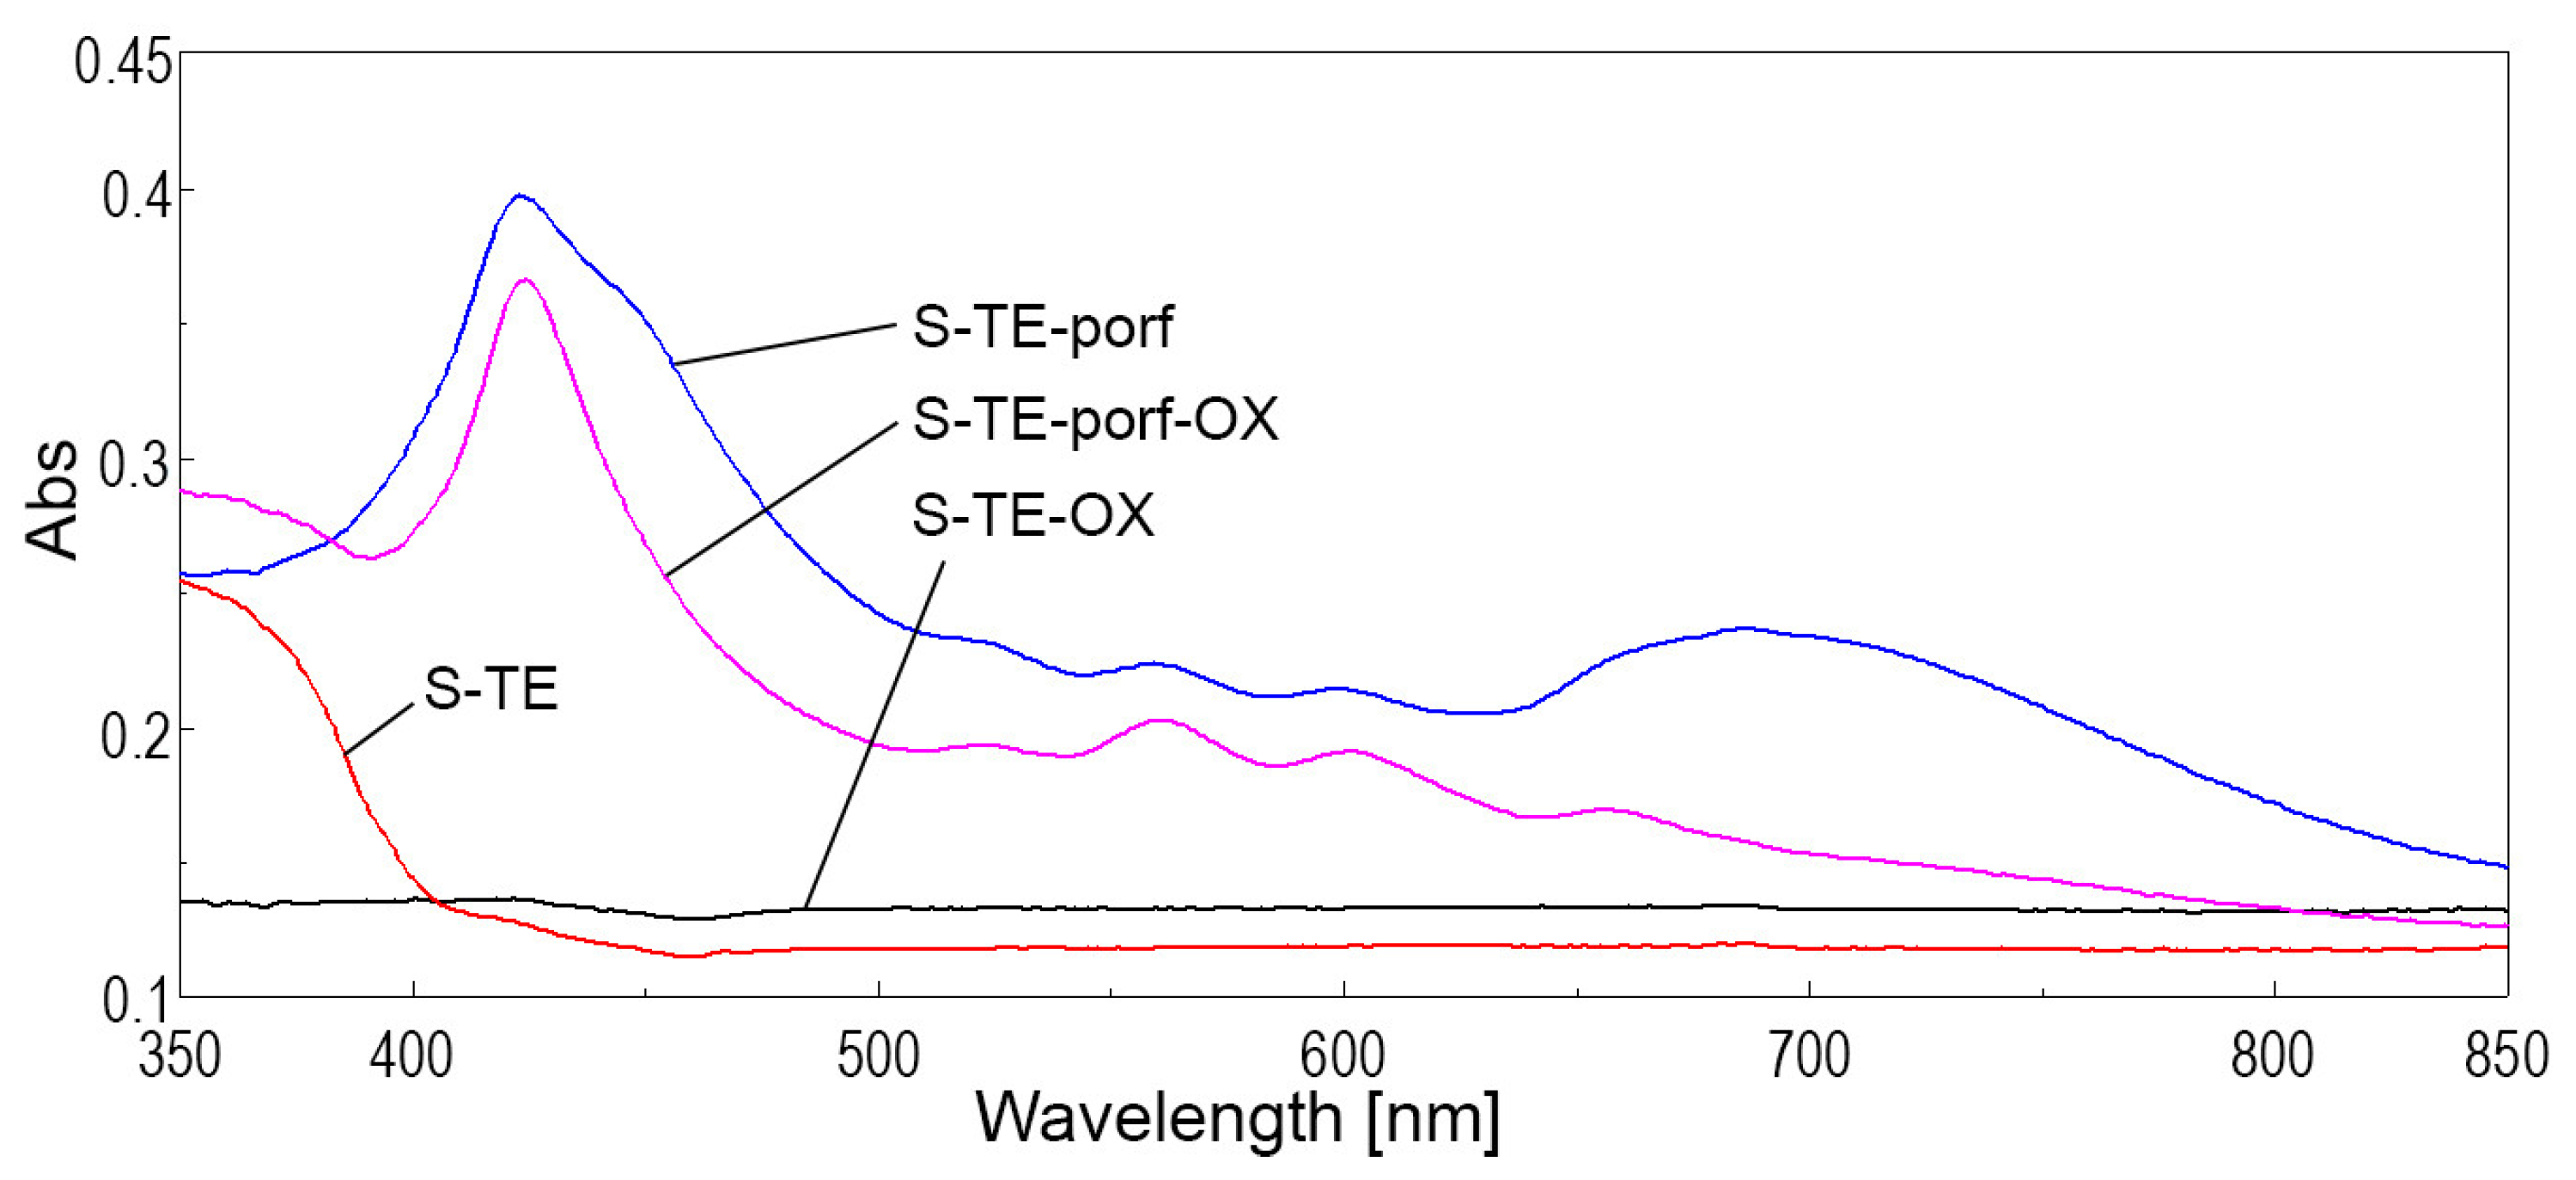
By analyzing the overlapped spectra for solid silica samples containing porphyrin alone, pseudo-binary oxide alone, or a mixture of the two materials, shown in Figure 12 and Figure 13, it can be noticed, as expected, that both types of silica materials containing porphyrin (samples S-TE-porf and S-TE-AP-porf) present the highest absorption intensity at 423 nm.
The synergism between TAPP porphyrin and the TEOS-based and TEOS-AP based silica matrices is related, along with the hyperchromic effect, to the widening of the visible domain of absorption. In comparison, the presence of Zn3Nb2O8 doped with 0.5% Eu3+ in S-TE-porf-OX (Figure 12) and S-TE-AP-porf-OX (Figure 13), slightly diminishes both of these effects.
Figure 12. Overlapped UV-Vis spectra in the solid state for silica samples obtained from solely TEOS.
Ijms 24 08920 g012
Figure 13. Overlapped UV-Vis spectra in the solid state for silica samples obtained from TEOS and APTMOS precursors in a 9:1 molar ratio.
Ijms 24 08920 g013
The UV-Vis spectra performed in solid state for the two types of silica materials containing TAPP porphyrin (Figure S1) were also analyzed and are presented in the Supplementary Material.

2.4. Characterization of Silica Materials by Fluorescence Spectroscopy

The emission spectra for solid samples were registered using a wavelength λex = 400 nm, an excitation slit = 15 nm, and an emission slit = 5 nm.
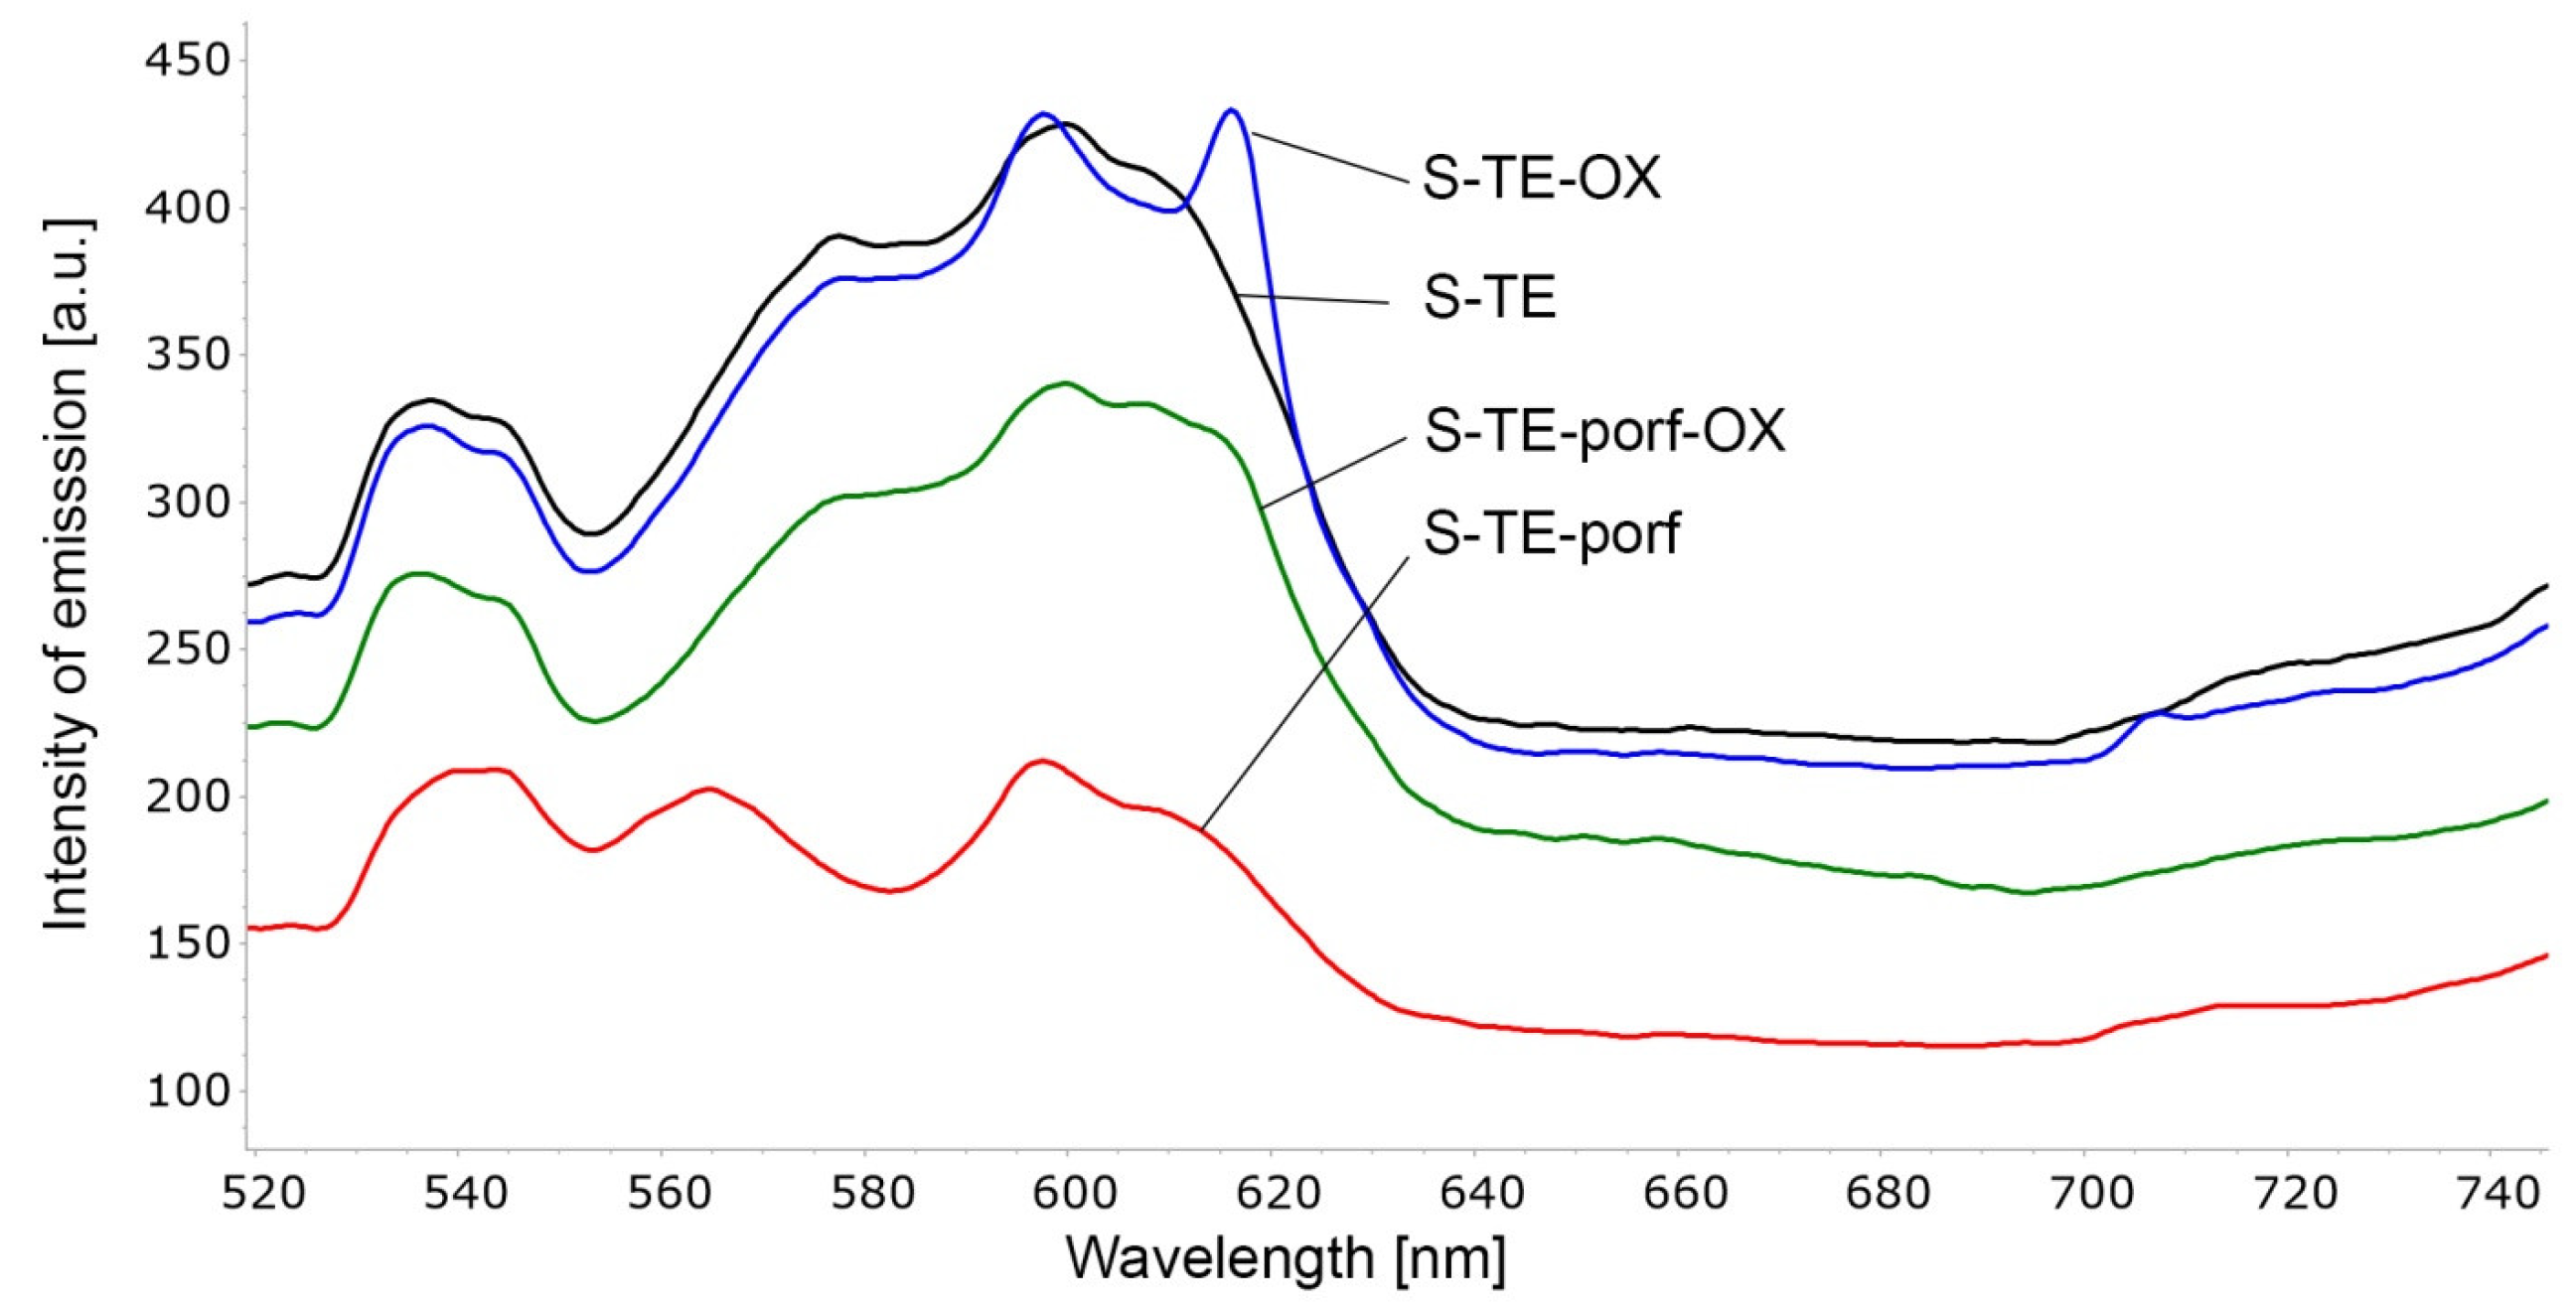
A completely different behavior than in UV-Vis spectra can be observed in fluorescence spectra, where the major influence is given by Zn3Nb2O8 doped with Eu3+. The widest and most intense band belongs to the emission of the S-TE-OX sample.
The location and intensity of the silica samples, apart from the nature of the hybrid components, are dependent on the sample porosity. It is known that the porosity characteristics of the samples influence the number and location of the emitting centers and also the OH-groups on the silica surface [80]. Studies in the field established that the increasing pore size of a silica material determines the decrease of its hydrophilic character because the distance between different species of Si-OH groups is larger [81].
Except for the S-TE-OX sample containing Zn3Nb2O8 doped with Eu3+ that has the highest intensity of emission at 616 nm (Figure 14), the same as in the pseudo-binary oxide, all the other silica samples show a progression of peaks from 540 nm to 560 nm and 580 nm, with the main peaks positioned around 600 nm [82].
This situation clearly demonstrated that the emission of TEOS-based silica hybrid materials is dominated by TEOS-based silica emitting centers, no matter the incorporated dye or oxide.
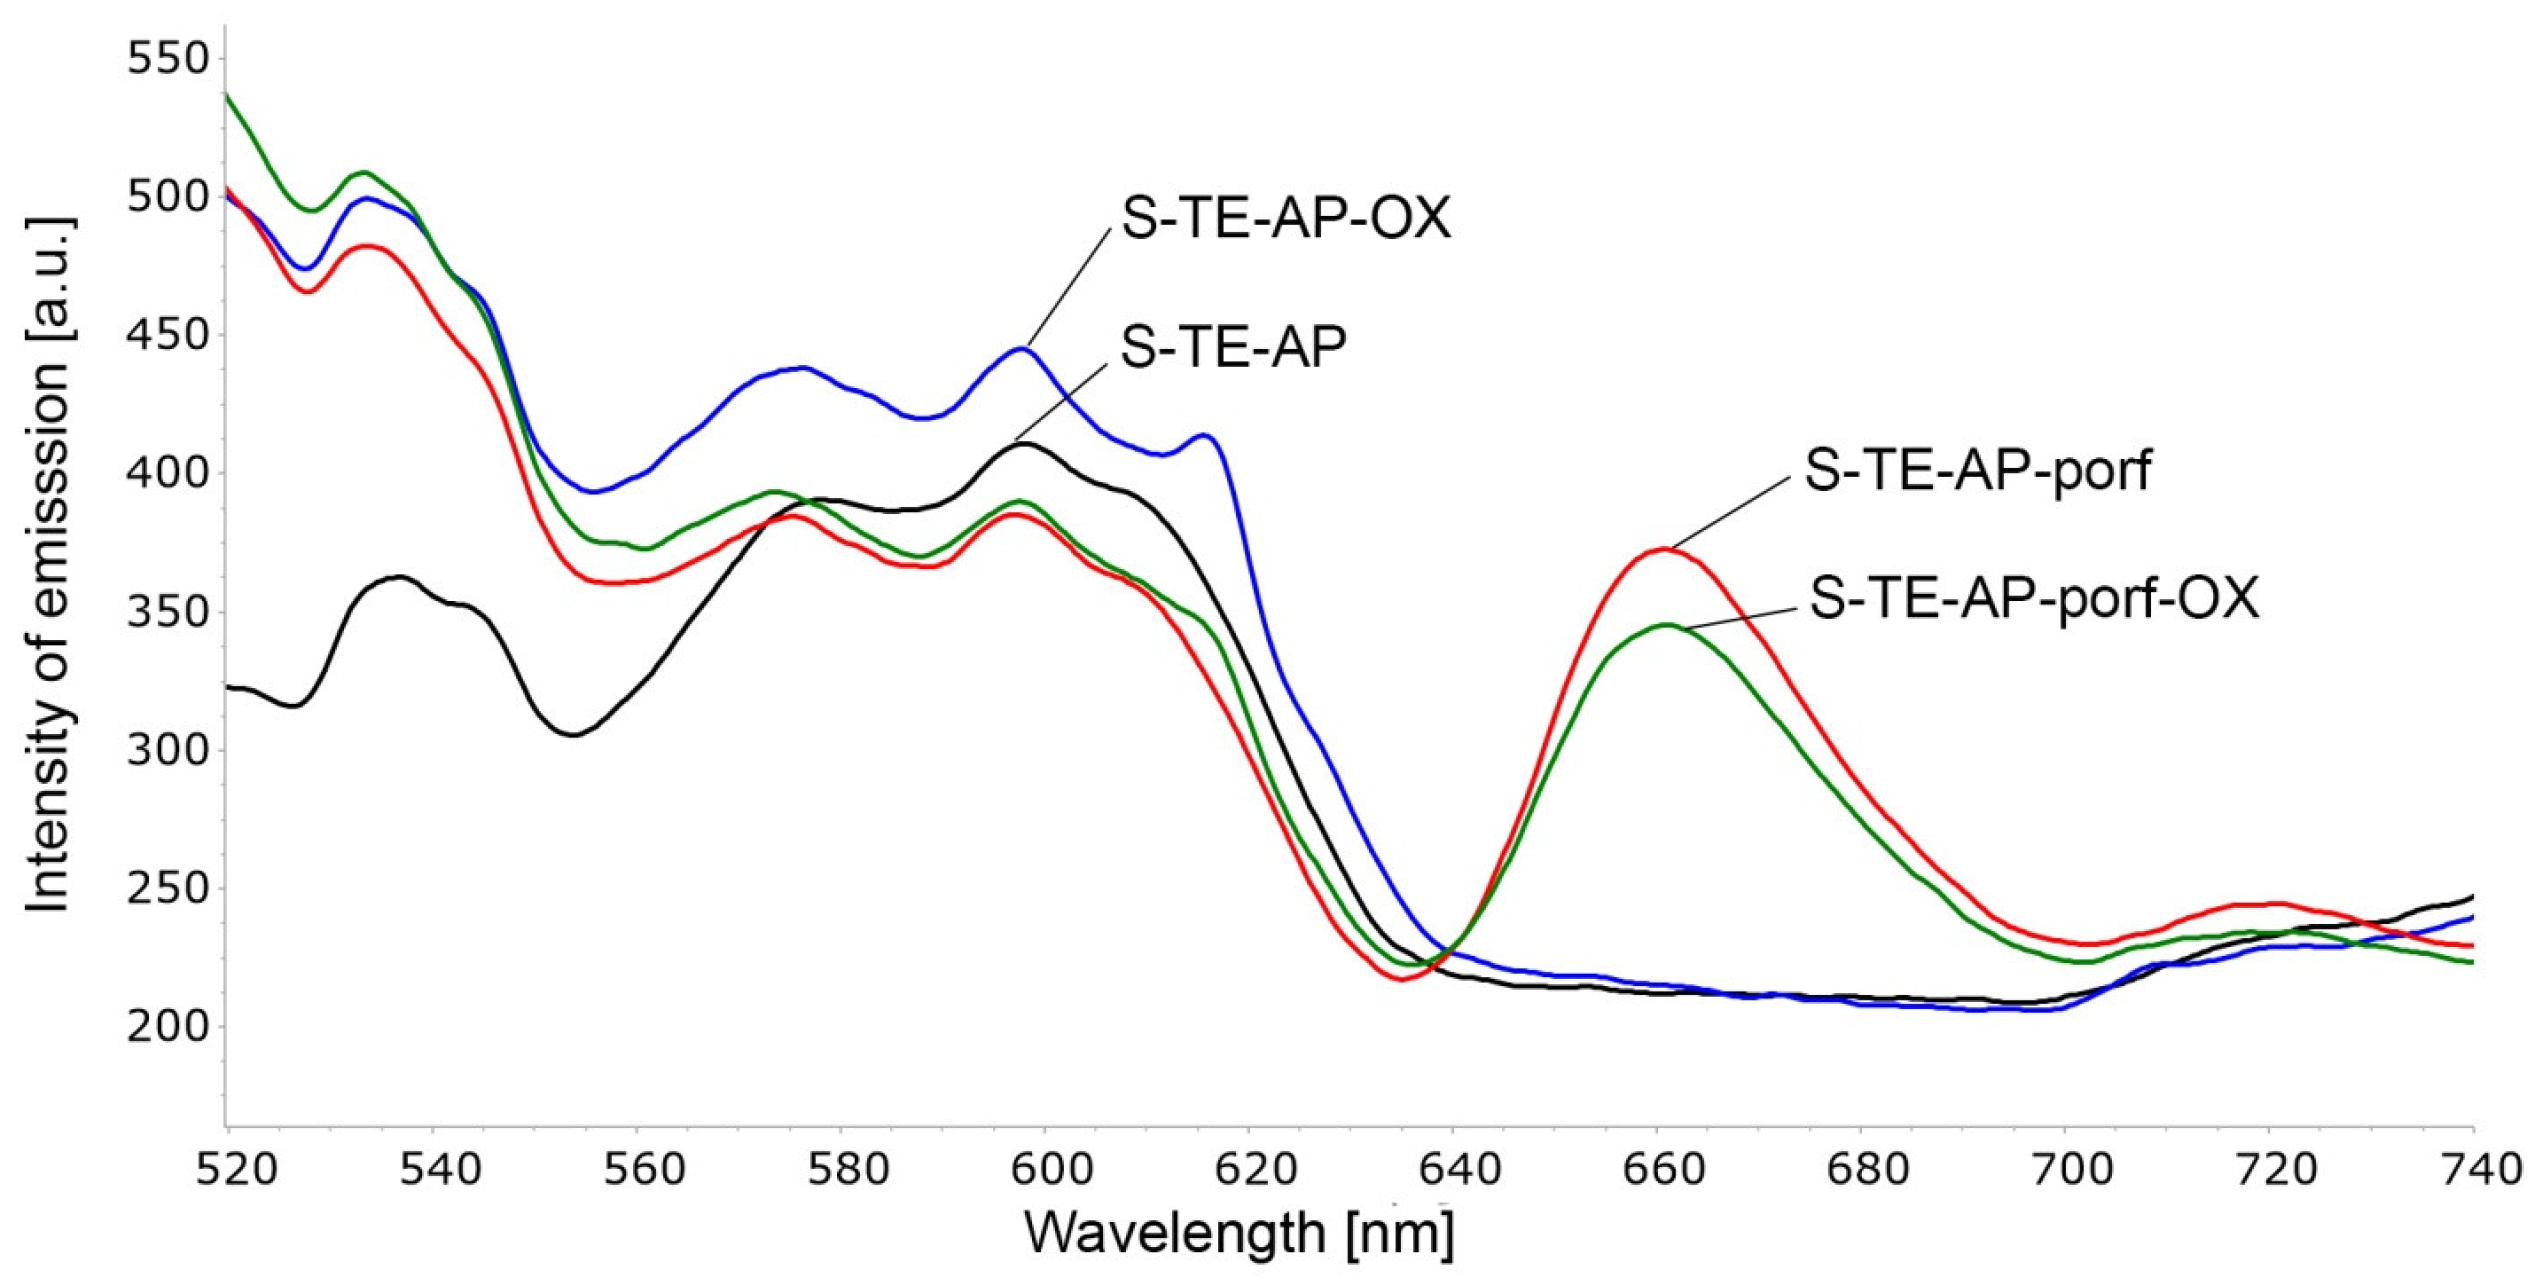
In Figure 15, the emission spectra of the materials based on TEOS and APTMOS precursors in a 9:1 molar ratio present the same progression of bands from 540 nm to 600 nm as in the case of TEOS-based silica. What differentiates these sets of spectra is the presence of intense emission bands due to the presence of TAPP porphyrin, as expected: a large and intense Q(0,0) band around 660 nm is associated with a lower intensity band in the red region around 720 nm assigned to Q(0,1) [32,83,84]. This widened type of emission from green to yellow, orange, and finally red extended the possibility of applications of these two materials: S-TE-AP-porf and S-TE-AP-porf-OX, which are highly present and reported in Eu2+ activated oxides [85], but the effect is also present and in an improved way in the sample that does not contain Eu2+ ions, namely: S-TE-AP-porf. This situation can be explained by the different polarity inside the silica pores when the AP precursor is the bridge between TAPP porphyrin and the pore walls. In such lower-polarity’ environments, the light emission process of the porphyrin is more facile [86].
So, it is clear that encapsulation of porphyrin dyes in silica matrices provides new photosensitive materials [87].
On excitation at 400 nm, the TAPP porphyrin shows two emission bands at 660 nm (Q(0,0) and another weaker emission at 720 nm (Q(0,1), corresponding to the S1→S0 transition. These bands are broadened and red shifted in the silica matrices as compared with the porphyrin spectrum in solution because of interactions with the silica network and differences in the environment. Furthermore, the aggregation seems to significantly contribute to the tendency toward red shifting of the bands [88].
As can be seen in Figure 15, the difference between excitation wavelength and emission wavelength for both S-TE-AP-porf and S-TE-AP-porf-OX samples, known as the Stokes shift, is larger than 240 nm, so that they can be considered isolated, which is a benefit for diminution of background signals for sensing applications [89].
Fluorescence (Figure 16) is generated by the fluorophore emission of a photon from the lowest excited state S1 to the ground state S0, in which simultaneously transitions from different vibrational levels will occur, having energies lower than those of the emitted photon [90].

2.5. Methyl Red (MR) Adsorption Investigations Using Hybrid Silica Materials

All the silica matrices obtained in this work were tested for their capacity to adsorb methyl red from synthetic water-based solutions. The concentrations of MR tested were 1 × 10⁻⁴ M and 1 × 10⁻⁵ M. The loadings of adsorbent material were 5 g/L, 10 g/L, and 20 g/L, respectively. The adsorption experiments were performed at room temperature (295 K) for an exposure time of 120 min.
The effect of pH was also tested by adjusting the MR solution c = 1 × 10⁻⁴ M to pH = 1.5 with HCl solution (c = 0.5 M) and to pH = 8.5 with NaOH solution (c = 0.5 M) with a loading of 2 g/L S-TE control adsorbent material. It was concluded that the natural pH of the MR solution (pH = 5.5) leads to the best adsorption.
The amount of adsorbed dye per unit of mass adsorbent, qe [mg/g], was calculated according to Equation (1) [44]:
q e = c 0 c e m ×   V
where c 0 = initial dye concentration [mg/L]
c e = final dye concentration at equilibrium [mg/L]
m = mass of adsorbent [g]
V = volume of dye solution [L]
The removal efficiency was calculated according to Equation (2):
R . E .   % = c 0   c e c 0 × 100
These calculated results are presented in Table 5, Table 6 and Table 7.
The UV-Vis spectra given below (Figure 17, Figure 18 and Figure 19) illustrate the best results (adsorption and discoloration) obtained for water containing methyl red of concentration 1 × 10⁻⁵ M. Figure S2, Figure S3, Figure S4 from Supplementary Materials present the UV-Vis spectra of the supernatant after 120 min exposure to MR solution at higher concentration for different loadings of adsorbent materials.
A comparison between the performances of different adsorbents shows clearly that S-TE-porf-OX (at loadings of 2 g/L and 10 g/L—Figure 17 and Figure 18) is the best material capable of discoloring MR from water. When the loading was higher, namely 20 g/L, the best materials for MR discoloration were the hybrid silica materials based on TEOS silica matrices and the pseudo-binary oxide (Zn3Nb2O8). As a general rule, when TEOS-based precursors are used, the materials perform better.
Figure 17. Overlaying UV-Vis spectra on the supernatant after 120 min of exposure to a 5 mL MR solution (c = 1 × 10⁻⁵ M) for a loading of adsorbent material of 2 g/L, based on (a) TEOS and (b) TEOS:APTMOS precursors.
Ijms 24 08920 g017
Table 6. Total mass of adsorbed dye per unit mass of adsorbent and removal efficiency for a loading of 10 g/L.
Methyl Red Concentration
1 × 10⁻⁴ M
Methyl Red Concentration
1 × 10⁻⁵M
Adsorbent
Material
qe [mg\g]R.E. [%]qe [mg\g]R.E. [%]
S-TE (control)1.62560.360.23888.54
S-TE-OX2.30885.690.24791.59
S-TE-porf1.62060.170.24189.58
S-TE-porf-OX2.46391.460.25092.87
S-TE-AP (control)1.00537.330.22884.79
S-TE-AP-OX1.25846.730.21378.91
S-TE-AP-porf1.03138.300.21579.79
S-TE-AP-porf-OX0.91834.090.21880.93
Figure 18. Superimposed UV-Vis spectra on the supernatant after 120 min of exposure to a 5 mL MR solution (c = 1 × 10⁻⁵ M) for a loading of adsorbent material of 10 g/L, based on (a) TEOS and (b) TEOS:APTMOS precursors.
Ijms 24 08920 g018
Table 7. Quantity of adsorbed dye per unit mass of adsorbent and removal efficiency for a loading of 20 g/L.
Methyl Red Concentration
1 × 10⁻⁴ M
Methyl Red Concentration
1 × 10⁻⁵ M
Adsorbent
Material
qe [mg\g]R.E. [%]qe [mg\g]R.E. [%]
S-TE (control)0.90066.870.11182.76
S-TE-OX1.16986.780.12894.82
S-TE-porf0.92368.560.12290.44
S-TE-porf-OX1.22490.910.12290.76
S-TE-AP (control)0.99874.140.12290.57
S-TE-AP-OX1.00674.680.12089.02
S-TE-AP-porf0.76756.980.10174.73
S-TE-AP-porf-OX0.74955.620.11081.97
Figure 19. Superimposed UV-Vis spectra on the supernatant after 120 min of exposure to a 5 mL MR solution (c = 1 × 10⁻⁵ M) for a loading of adsorbent material of 20 g/L, based on (a) TEOS and (b) TEOS:APTMOS precursors.
Ijms 24 08920 g019

2.5.1. Comparative Atomic Force Microscopy (AFM) Characterization of the Hybrid Silica Materials before and after MR Adsorption

Figure 20 shows 2D AFM images (color map, 3D, and topography) recorded using a non-contact mode cantilever before and after methyl red (MR) absorption.
From the AFM investigations (Table 8), it can be seen that after absorption of MR, the hybrid silica particles underwent changes in their morphology as follows: the size of the aggregates decreased, displaying a novel rearrangement of the aggregates from triangular, well-defined shapes to elongated triangles or ovoids.
The smallest particle size is noticed in the case of the hybrid silica nanomaterials containing Zn3Nb2O8 doped with Eu3+ both before (12 and 28 nm) and after (3 and 7 nm) MR absorption.
Using the software Nanosurf Report v4 upgraded 2018 and calculations based on the equations reported in [91], the particle dimensions, the nanorugosity-Sa (average roughness), and Sq (square root roughness) were given for each sample (Table 8). The decrease in Sa (average roughness) and Sq (square root roughness) after MR adsorption is revealed, meaning that the porosity of all adsorbents is diminished and the materials are covered with a smoother, thinner layer of MR.
Table 8. The nanoroughness and particle dimensions of the hybrid silica nanomaterials containing Zn3Nb2O8 doped with Eu3+ and/or amino substituted porphyrin before and after methyl red (MR) absorption.
Before Adsorption of MRAfter Adsorption of MR
SampleAverage
Roughness (Sa) [nm]
Square Root Roughness (Sq) [nm]Particle
Dimensions [nm]
Average
Roughness (Sa) [nm]
Square Root Roughness (Sq) [nm]Particle
Dimensions [nm]
S-TE29.04635.5828321.76822.29565
S-TE-AP30.68338.4159828.03631.47571
S-TE-OX5.1148.171121.0161.9853
S-TE-AP-OX9.12512.149282.6973.4857
S-TE-porf25.21429.9067514.99215.33753
S-TE-AP-porf26.45532.1018013.469114.48958
S-TE-porf-OX20.64025.1835610.32510.51939
S-TE-AP-porf-OX22.34127.0216210.91111.23644

2.5.2. BET Analysis

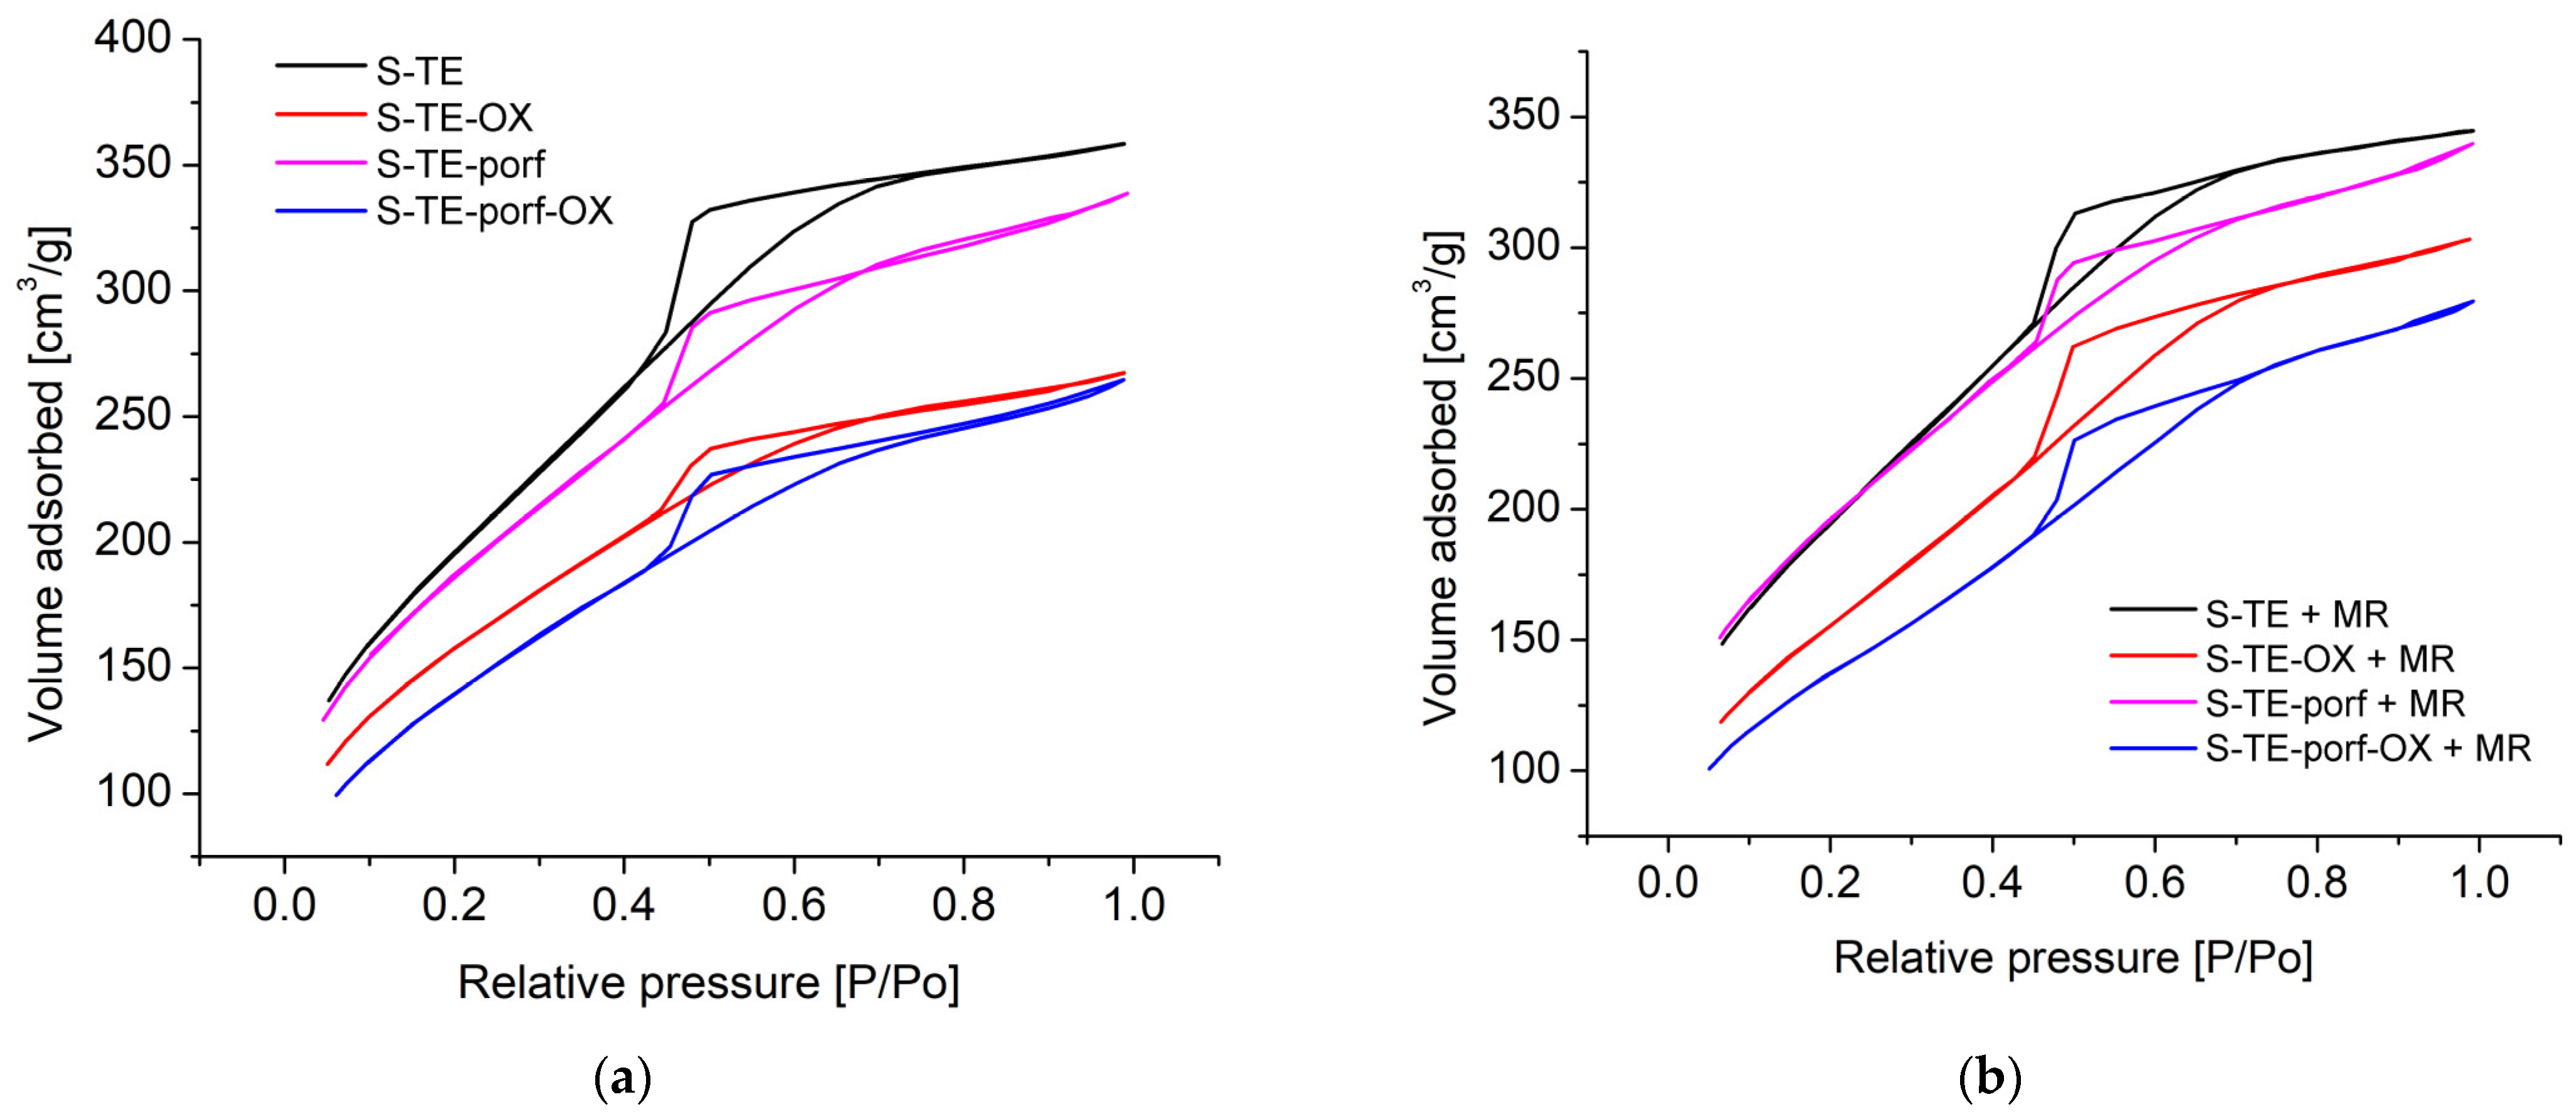
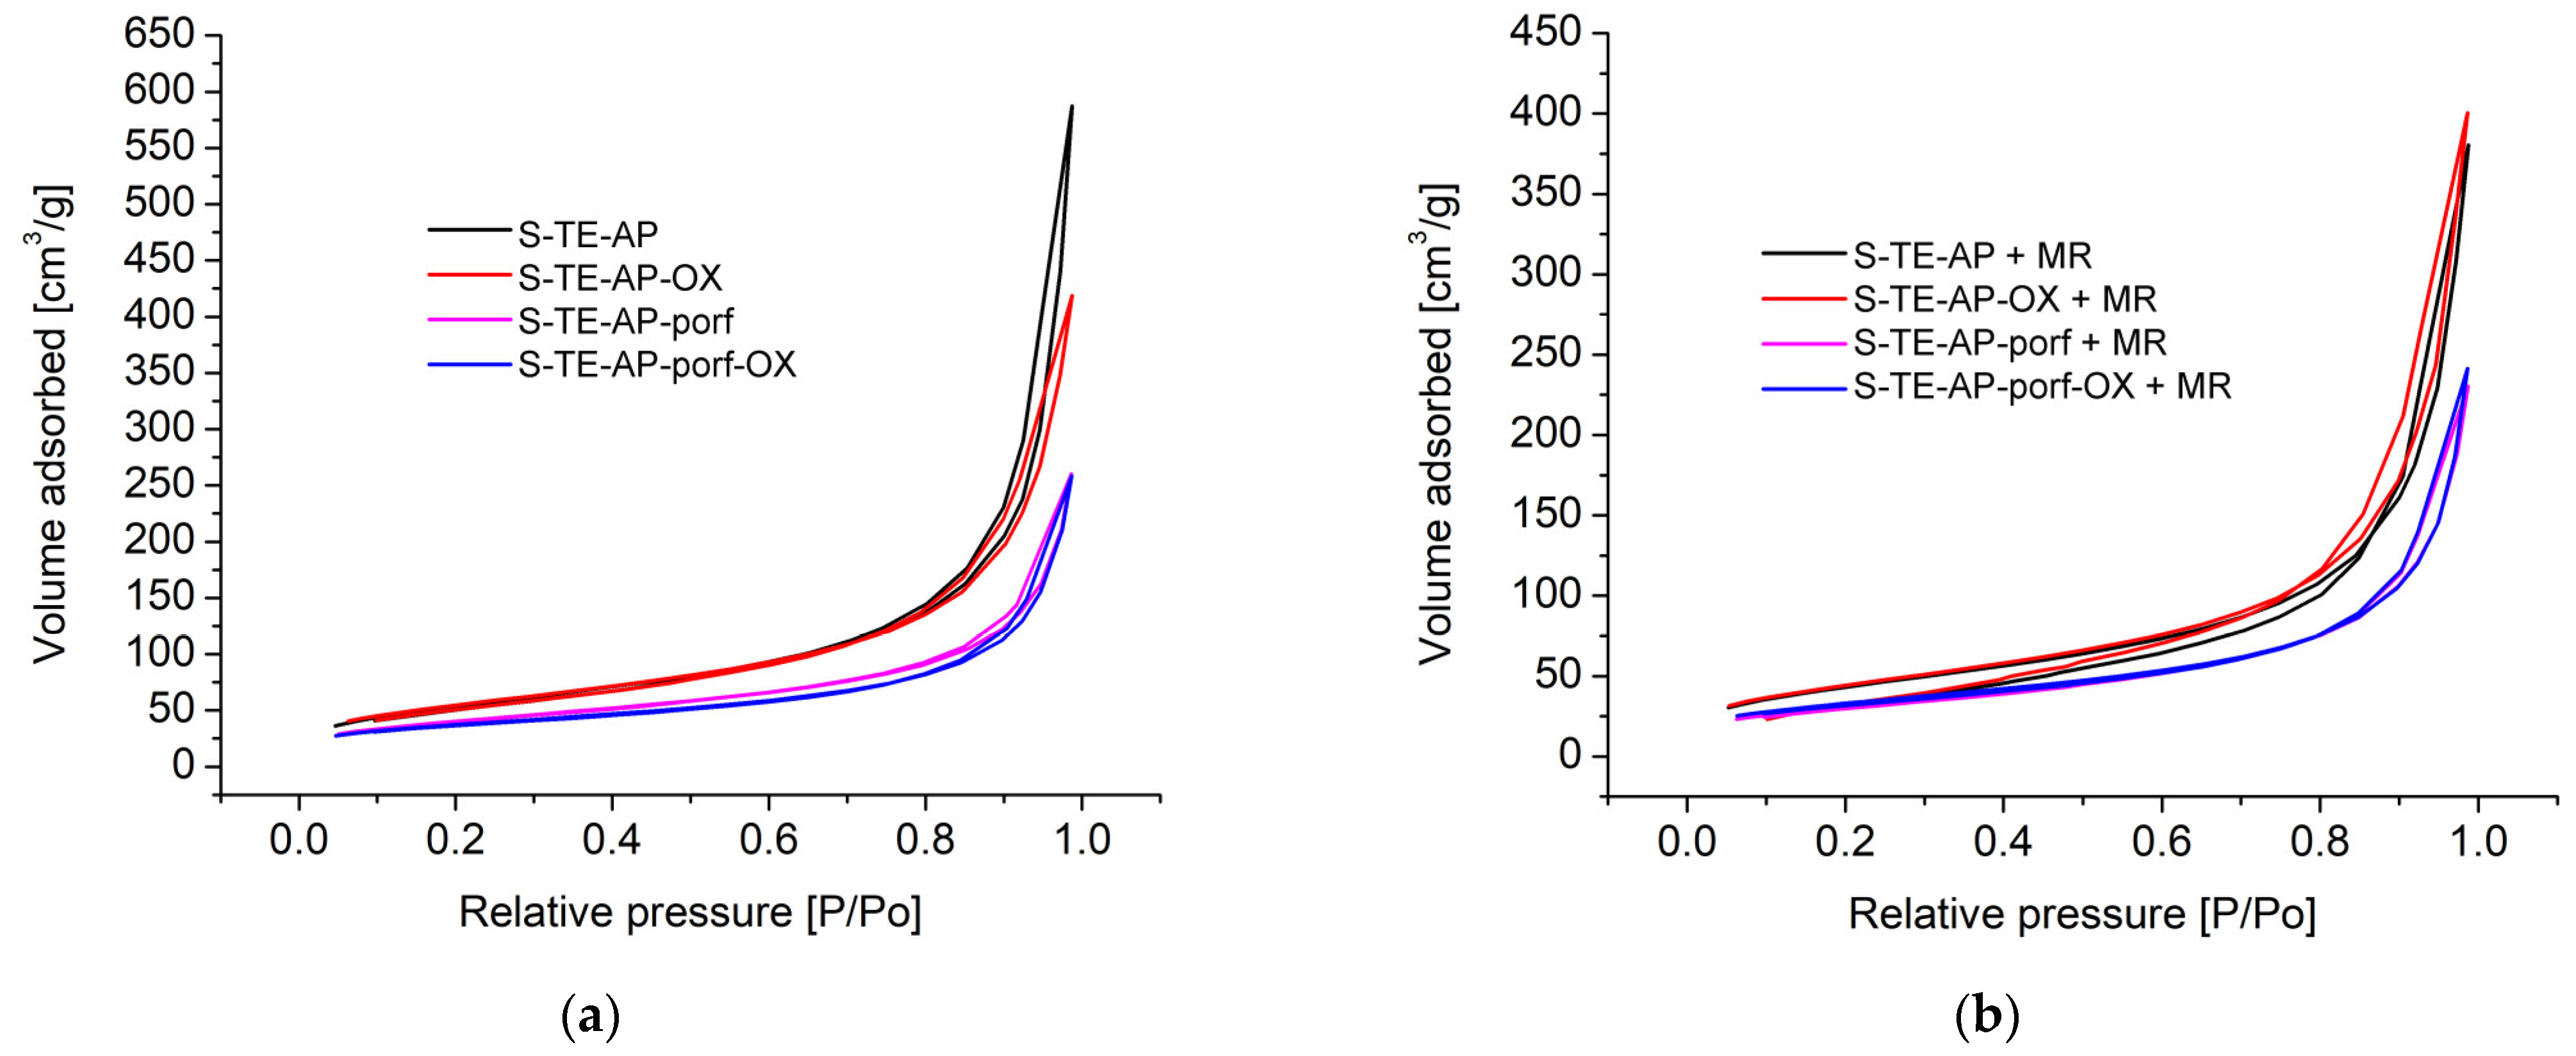
Figure 21a,b show the nitrogen adsorption-desorption isotherms of samples based on TEOS before and after adsorption of MR.
Type IVa isotherms with H2a hysteresis, which are representative for samples with inkbottle-shaped pores, resulted both before and after adsorption of MR, based on nitrogen adsorption-desorption isotherms and comparison with IUPAC data [92]. Since the samples present narrow-pore necks, they accommodate the dye well [92].
Figure 21. Nitrogen adsorption-desorption isotherms of samples based on TEOS (a) before and (b) after adsorption of MR.
Ijms 24 08920 g021
The textural parameters for samples based on TEOS are presented in Table 9 before exposure to MB and in Table 10 after MB adsorption.
Each of the hybrid materials provides a highly specific surface area. The highest surface area was obtained for the control sample (S-TE), with a value of 726 m2/g and a total pore volume of 0.556 cm3/g. The smallest surface area and total pore volume among these studied materials were obtained for sample S-TE-porf-OX. Despite this fact, the specific surface area of S-TE-porf-OX is still high enough to achieve the best adsorption performance, a fact explained by the presence of porphyrin and its binding properties. In all samples, the pore size is around 3 nm, and the entry dimensions are similar, as was also observed in AFM measurements.
Correlating these data with the adsorption performances of MR on the samples based on TEOS, we observed that when the fractal dimension is increased, meaning that the rugosity is increased, the adsorption results are lower, as was also noticed from AFM data.
By comparison with the samples before adding MR, we observed that the tendency is to decrease the surface area. Thus, we can conclude that in this case, the MR is mainly adsorbed on the surface of the absorbent samples because the rugosity values decreased and the pore size distribution was almost the same.
Further, Figure 22a,b indicate the nitrogen adsorption-desorption isotherms for samples based on TEOS:APTMOS.
In the case of mixed silica precursors, nitrogen adsorption and desorption isotherms are type IVa with a H3 hysteresis. The hysteresis of specific type H3 is usually revealed by plate-like particles with a grooved-pore network consisting of macropores that are not completely filled with adsorbate [93]. The capillary condensation in these samples takes place near 0.8 P/Po, which confirms that the samples present macroporosity.
Table 11 shows the textural parameters of samples based on TEOS:APTMOS before exposure to MB and Table 12 after MB adsorption, respectively.
Analyzing the samples based on TEOS:APTMOS, we can conclude that the same situation as in the previous series occurs. The highest surface area was obtained for samples S-TE-AP and S-TE-AP-OX at around 198 m2/g. Even in this case, the samples with the smallest rugosity present the highest efficiency of adsorption. The main difference compared with the TEOS-based series of hybrid materials is that the surface area decreases almost four times and the pore size diameter increases considerably. Regarding the type of hysteresis, it might be concluded that in this case, the adsorption is due to MR entering the pores due to their open shape.

3. Materials and Methods

3.1. Materials and Reagents

The solid-state method [29,31,94] was selected due to its advantages, such as high purity, short reaction time, homogeneity, and low price, to obtain the Zn3Nb2O8 pseudo-binary oxide nanomaterials, both non-doped and doped with Eu3+ ions. Doping with Eu3+ ions improved the specific optical properties of the Zn3Nb2O8-based nanomaterials. The used precursors in the solid-state synthesis were: niobium pentoxide–Nb2O5 (99.9 %, Sigma-Aldrich, St. Louis, MO, USA); zinc oxide–ZnO (99.99 %, Merck KGaA, Darmstadt, Germany) in the molar ratio 3:1; and adding 0.5 % europium (III) oxide–Eu2O3 (99.9%, Sigma-Aldrich, St. Louis, MO, USA) as a doping ion to the Nb2O5 quantity. The synthesis was conducted in the calcination furnace SNOL (Telecomed SRL, Iasi, Romania) at a temperature of 1100 °C for 4 h at a rate of 5 °C/min for heating/cooling.
Tetraethyl orthosilicate (TEOS) and 3-aminopropyltrimethoxysilane (APTMOS) were provided by Fluka (Seelze, Germany); ethanol absolute (EtOH) was obtained from Chimreactivul SRL (Bucuresti, Romania); tetrahydrofuran (THF), hydrochloric acid (HCl), and ammonia (NH3) were purchased from Merck (Darmstadt, Germany); and all were purrum analyticum grade. The 5,10,15,20-tetra-aminophenylporphyrin (TAPP) was obtained and completely characterized in a previously published paper [95]. Methyl red originated from P OCh SA PPH Polskie Odczynniki Chemiczne (Gliwice, Poland).

3.2. Method for Obtaining Hybrid Silica Nanomaterials Containing Zn3Nb2O8 Doped with Eu3+ and/or Amino-Substituted Porphyrin

The Zn3Nb2O8 doped with 0.5% Eu3+ and/or the amino substituted porphyrin (TAPP) were immobilized in silica gels obtained by performing a two-step sol-gel process conducted in acid-base catalysis, starting from either solely tetraethoxysilane (TEOS) or two silica precursors: 3-aminopropyltrimethoxysilane (APTMOS) and TEOS, involved in 1/9 molar ratio.
In order to obtain the materials incorporating the oxide, the first step was to obtain the sol, which was conducted by acid catalysis using hydrochloric acid (HCl). The molar ratios between the silica precursor/precursors’ mixture/alcohol/water and HCl were chosen as 1:2:6:0.02, with the purpose of achieving low porosity and, as a consequence, high specific surface areas [32,96].
The second step, conducted in base catalysis, involves the previous sols by adding, under vigorous stirring, the finely ground to final fineness of ~20 μm of Zn3Nb2O8 doped with 0.5% Eu3+ (1% weight of the silica precursors) and the required amount of NH3 catalyst till the gelation occurs. After gelation, the gels were left to age for 24 h and then dried for 12 h at 125 °C.
The sol-gel samples containing tetrakis-(4-amino-phenyl)-porphyrin (TAPP), were similarly obtained using a 1/10,000 molar ratio between the silica precursors and the porphyrin, no matter if only porphyrin or both porphyrin and the pseudo-binary oxide were added in mixtures.
Due to the known fact that porphyrin-based silica nanoparticles can suffer leakage when being dispersed in various organic solvents, TAPP porphyrin leakage was verified in water, ethanol, and tetrahydrofuran (THF), but no such phenomenon occurred.
In this way, eight samples were obtained. The named samples, combinations, and synthesis data are introduced in Table 13. As can easily be seen, the precursor type and the ratio between the two mixed silica precursors affect the time of gelation. The two control samples were obtained without immobilization of pseudo-binary oxide or porphyrin and were denoted as S-TE and S-TE-AP.

3.3. Apparatus

The crystallization phases of the pseudo-binary oxides Zn3Nb2O8 and Zn3Nb2O8 doped with Eu3+ nanomaterials were investigated by X-ray diffraction (model PW 3040/60 X’Pert PRO Powder Diffractometer (Malvern, UK)) with incident monochromatic Cu Kα (λ  =  1.5418 Å) radiation.
The field emission-scanning electron microscopy (SEM) model INSPECT S (Hillsboro, OH, USA) was performed at low vacuum, magnification = 1600 ×, weight distance = 11 mm, and high voltage = 25.00 kV. The morphology of the materials was analyzed by atomic force microscopy (AFM) using the NanoSurf ®EasyScan 2 Advanced Research (Liestal, Switzerland), scanned in noncontact mode with a scan size of 2 µm × 2 µm, time/line = 1 s, and points/line = 1024, and using the soft NanoSurf ®EasyScan 2 Advanced Research, the particle size and the nanoroughness (Sa-the values of average roughness and Sq-the mean square root roughness) before and after the adsorption of methyl red (MR) for each sample.
The band gap for Zn3Nb2O8 and Zn3Nb2O8 doped with Eu3+ nanomaterials was calculated using the diffuse reflectance spectra recorded at room temperature on the UV-VIS-NIR spectrometer Lambda 950 (Markham, ON, Canada).
The UV-Vis spectra were performed on a V-650-JASCO spectrophotometer (Pfungstadt, Germany). The liquid samples were recorded in a 10 mm wide quartz cuvette.
FT-IR spectra were carried out on a JASCO 430 FT-IR spectrometer (Hachioji, Japan), as potassium bromide pellets.
The mixer mill used for grinding silica samples is manufactured by Retsch GmbH, model MM 200 (Haan, Germany).
BET analysis investigated on a QuantachromeNova 1200 apparatus at 77 K provided nitrogen isotherms, from which the total pore volume (Vp), average pore diameter (Dp), and specific surface area (SBET) were calculated. The surface roughness was calculated by the Frenkel-Halsey-Hill (FHH) equations [97]. Before analysis, the samples were degassed at 55 °C in a vacuum for 8 h. The BET (Brunauer-Emmett-Teller) method was used to calculate the specific surface area [98], and the BJH (Barrett, Joyner, and Halenda) method provided the results for pore size distribution [33,97].

4. Conclusions

Because azo dyes are water pollutants known to cause, aside from allergies, major neurochemical damage to humans, a three-partnership was set up between two types of silica matrices (based on TEOS and TEOS/APTMOS), incorporating Eu3+-doped Zn3Nb2O8 oxide and a symmetrical amino-substituted porphyrin, presuming a synergistic effect towards methyl red removal and discoloration from wastewater.
To achieve this goal, the monoclinic phase of Zn3Nb2O8 belonging to the C2/c space group was obtained, and the emission spectra proved that this is an intrinsic blue light emitter. Doping the pseudo-binary oxide Zn3Nb2O8 with 0.5% Eu3+ generated an intense emission in the red region due to the 5D07F1,2 hypersensitive transition. Using the DFT method, the ionic configuration of the O2−, Nb5+, and Zn2+, the band gap, and the prediction of the position of Eu3+ doped in the crystal lattice were established.
A comparison between the non-doped pseudo-binary oxide Zn3Nb2O8 and its doped crystal with Eu3+ ions was performed by X-ray powder diffraction, Mulliken electron population analysis, scanning electron microscopy, infrared, luminescence, UV-Vis, fluorescence spectroscopy, atomic force microscopy, and the Brunauer-Emmett-Teller (BET) method.
An overview of the BET data indicates that TEOS-based silica materials are offering optimized conditions as adsorbents with very high specific surface areas (between 518 and 726 m2/g). In comparison, silica materials also containing APTMOS have four times lower specific surface areas (between 131 and 199 m2/g), which might be the reason for their decreased adsorption performance. Although the specific surface area of S-TE-porf-OX is only 518 m2/g, it is still high enough to achieve the best adsorption performance due to the significant contribution of the amino-substituted porphyrin that furnishes supplementary amino binding sites for MR. A great technical advantage is that the natural pH of the MR solution (pH = 5.5) leads to its best adsorption, avoiding any additional reagents or fixing operations.
Two different types of MR adsorption mechanisms can be reported: one implying surface absorbance in the case of TEOS-based materials and a second one involving the entry of the dye into the pores due to their open groove shape network in the case of silica materials also containing APTMOS.

Supplementary Materials

The supporting information can be downloaded at: https://www.mdpi.com/article/10.3390/ijms24108920/s1.

Author Contributions

Conceptualization, M.B. and E.F.-C.; methodology, M.B., E.F.-C. and L.M.; software, I.F., M.B. and C.E.; validation, M.B., I.F., L.M. and E.F.-C.; formal analysis, A.L., C.E., I.F., L.M. and M.B.; investigation, A.L., C.I., C.E., I.F. and M.B.; resources, M.B. and E.F.-C.; data curation, A.L., I.F., C.E. and L.M.; writing—original draft preparation, M.B., I.F., L.M., C.I. and E.F.-C.; writing—review and editing, M.B., I.F. and E.F.-C.; visualization, A.L., I.F., C.E., C.I. and E.F.-C.; supervision, M.B. and E.F.-C.; project administration, M.B. and E.F.-C.; funding acquisition, E.F.-C. All authors have read and agreed to the published version of the manuscript.

Funding

This research was funded by the Romanian Academy, through Program 3/2023 from the Institute of Chemistry “Coriolan Dragulescu”, Timisoara, and partially by the National Institute of Research and Development for Electrochemistry, project code PN 23 27 01 02 INOMAT, 23-27 29N/2023.

Institutional Review Board Statement

Not applicable.

Informed Consent Statement

Not applicable.

Data Availability Statement

The data presented in this study are available on request from the first author or the corresponding authors.

Conflicts of Interest

All authors declare that the research was conducted in the absence of any commercial or financial relationships that could be construed as a potential conflict of interest.

References

  1. Zahir, M.H.; Rahman, M.M.; Basamad, S.K.S.; Mohaisen, K.O.; Irshad, K.; Rahman, M.M.; Aziz, M.A.; Ali, A.; Hossain, M.M. Preparation of a Sustainable Shape-Stabilized Phase Change Material for Thermal Energy Storage Based on Mg2+-Doped CaCO3/PEG Composites. Nanomaterials 2021, 11, 1639. [Google Scholar] [CrossRef] [PubMed]
  2. Xue, J.; Noh, H.M.; Choi, B.C.; Park, S.H.; Kim, J.H.; Jeong, J.H.; Du, P. Dual-functional of non-contact thermometry and field emission displays via efficient Bi3+ → Eu3+ energy transfer in emitting-color tunable GdNbO4 phosphors. Chem. Eng. J. 2020, 382, 122861. [Google Scholar] [CrossRef]
  3. Liang, J.; Devakumar, B.; Sun, L.; Wang, S.; Sun, Q.; Huang, X. Full-visible-spectrum lighting enabled by an excellent cyan-emitting garnet phosphor. J. Mater. Chem. C 2020, 8, 4934–4943. [Google Scholar] [CrossRef]
  4. Liu, X.; Wu, W.; Cui, D.; Chen, X.; Li, W. Functional Micro-/Nanomaterials for Multiplexed Biodetection. Adv. Mater. 2021, 33, 2004734. [Google Scholar] [CrossRef] [PubMed]
  5. Narayanan, K.B.; Han, S.S. Helical plant viral nanoparticles—Bioinspired synthesis of nanomaterials and nanostructures. Bioinspir. Biomim. 2017, 12, 031001. [Google Scholar] [CrossRef] [PubMed]
  6. Kukkar, D.; Vellingiri, K.; Kim, K.-H.; Deep, A. Recent Progress in Biological and Chemical Sensing by Luminescent Metal-Organic Frameworks. Sens. Actuators B Chem. 2018, 273, 1346–1370. [Google Scholar] [CrossRef]
  7. Hussain, I.; Muhammad, N.; Subhani, Q.; Shou, D.; Jin, M.; Yu, L.; Lu, G.; Wen, X.; Intisar, A.; Yan, Z. A review on structural aspects and applications of PAMAM dendrimers in analytical chemistry: Frontiers from separation sciences to chemical sensor technologies. TrAC Trends Anal. Chem. 2022, 157, 116810. [Google Scholar] [CrossRef]
  8. Liu, X.; Liu, Y.; Feng, S.; Lu, L. Two luminescent Zn(II) coordination complexes as fluorescence-responsive sensors for efficient detection of Cu2+ ions. J. Mol. Struct. 2023, 1274, 134570. [Google Scholar] [CrossRef]
  9. Imran, M.; Alam, M.M.; Hussain, S.; Ali, M.A.; Shkir, M.; Mohammad, A.; Ahamad, T.; Kaushik, A.; Irshad, K. Highly photocatalytic active r-GO/Fe3O4 nanocomposites development for enhanced photocatalysis application: A facile low-cost preparation and characterization. Ceram. Int. 2021, 47, 31973–31982. [Google Scholar] [CrossRef]
  10. Das, L.; Habib, K.; Irshad, K.; Saidur, R.; Algarni, S.; Alqahtani, T. Thermo-Optical Characterization of Therminol55 Based MXene-Al2O3 Hybridized Nanofluid and New Correlations for Thermal Properties. Nanomaterials 2022, 12, 1862. [Google Scholar] [CrossRef]
  11. Yuan, F.; He, P.; Xi, Z.; Li, X.; Li, Y.; Zhong, H.; Fan, L.; Yang, S. Highly efficient and stable white LEDs based on pure red narrow bandwidth emission triangular carbon quantum dots for wide-color gamut backlight displays. Nano Res. 2019, 12, 1669–1674. [Google Scholar] [CrossRef]
  12. Dang, P.; Liu, D.; Li, G.; Al Kheraif, A.A.; Lin, J. Recent Advances in Bismuth Ion-Doped Phosphor Materials: Structure Design, Tunable Photoluminescence Properties, and Application in White LEDs. Adv. Opt. Mater. 2020, 8, 1901993. [Google Scholar] [CrossRef]
  13. Yao, F.; Wang, L.; Lv, Y.; Zhuang, Y.; Zhou, T.-L.; Xie, R.-J. Composition-dependent thermal degradation of red-emitting (Ca1−xSrx)AlSiN3:Eu2+ phosphors for high color rendering white LEDs. J. Mater. Chem. C 2018, 6, 890–898. [Google Scholar] [CrossRef]
  14. Zhang, Y.; Zhang, Z.; Liu, X.; Shao, G.; Shen, L.; Liu, J.; Xiang, W.; Liang, X. A high quantum efficiency CaAlSiN3:Eu2+ phosphor-in-glass with excellent optical performance for white light-emitting diodes and blue laser diodes. Chem. Eng. J. 2020, 401, 125983. [Google Scholar] [CrossRef]
  15. Birdeanu, M.; Vaida, M.; Fagadar-Cosma, E. The optical properties of crystalline Zn3Nb2O8 nanomaterials obtained by hydrothermal method. J. Chem. 2015, 2015, 752089. [Google Scholar] [CrossRef]
  16. Mineiro, S.L.; Gonçalo, D.A.C.; Okamoto, S.; Tenório, P.I.G. Microstructural Analysis of Zinc Niobate Ceramics Processed by Microwave Thermal Treatment. Mater. Sci. Forum 2020, 1012, 185–189. [Google Scholar] [CrossRef]
  17. Gribchenkova, N.A.; Smirnov, A.S.; Smorchkov, K.G.; Belova, E.V.; Alikhanyan, A.S. Thermodynamic Characteristics of Zinc Niobates Zn3Nb2O8, ZnNb2O6, and Zn2Nb34O87. p–x Diagram of the ZnO–Nb2O5 System. Russ. J. Inorg. Chem. 2021, 66, 1873–1879. [Google Scholar] [CrossRef]
  18. Bîrdeanu, M.; Bîrdeanu, A.-V.; Gruia, A.S.; Fagadar-Cosma, E.; Avram, C.N. Synthesis and characterization of Zn3Ta2O8 nanomaterials by hydrothermal method. J. Alloy. Compd. 2013, 573, 53–57. [Google Scholar] [CrossRef]
  19. Bai, P.; Wu, N.; Wang, Y.; Yang, T.; Li, H.; Zhang, J.; Chai, Z.; Wang, X. pH-Controllable regeneration and visible-light photocatalytic redox of carbon and nitrogen co-doped Zn3Nb2O8 towards degradation of multiple contaminants. Catal. Sci. Technol. 2020, 10, 2810–2820. [Google Scholar] [CrossRef]
  20. Sudhakar, P.; Siva Sesha Reddy, A.; Zhydachevskyy, Y.; Suchocki, A.; Brik, M.G.; Ravi Kumar, V.; Piasecki, M.; Veeraiah, N. Luminescence characteristics of Er3+ ions in ZnO-Ta2O5/Nb2O5/ZrO2-B2O3 glass system- A case study of energy transfer from ZnO to Er3+ ions. Opt. Mater. 2018, 86, 87–94. [Google Scholar] [CrossRef]
  21. Deepthi Jayan, K.; Sebastian, V. Ab initio DFT determination of structural, mechanical, optoelectronic, thermoelectric and thermodynamic properties of RbGeI3 inorganic perovskite for different exchange-correlation functionals. Mater. Today Commun. 2021, 28, 102650. [Google Scholar] [CrossRef]
  22. Kheralla, A.; Chetty, N. A review of experimental and computational attempts to remedy stability issues of perovskite solar cells. Heliyon 2021, 7, e06211. [Google Scholar] [CrossRef] [PubMed]
  23. Idrissi, S.; Labrim, H.; Bahmad, L.; Benyoussef, A. DFT and TDDFT studies of the new inorganic perovskite CsPbI3 for solar cell applications. Chem. Phys. Lett. 2021, 766, 138347. [Google Scholar] [CrossRef]
  24. Guo, W.; Yang, Z.; Dang, J.; Wang, M. Progress and perspective in Dion-Jacobson phase 2D layered perovskite optoelectronic applications. Nano Energy 2021, 86, 106129. [Google Scholar] [CrossRef]
  25. Guo, J.; Zhou, H.; Fan, T.; Zhao, B.; Shang, X.; Zhou, T.; He, Y. Improving electrical properties and toughening of PZT-based piezoelectric ceramics for high-power applications via doping rare-earth oxides. J. Mater. Res. Technol. 2020, 9, 14254–14266. [Google Scholar] [CrossRef]
  26. Ammar, H.Y.; Eid, K.M.; Badran, H.M. TM-doped Mg12O12 nano-cages for hydrogen storage applications: Theoretical study. Results Phys. 2022, 35, 105349. [Google Scholar] [CrossRef]
  27. Oh, J.A.S.; He, L.; Chua, B.; Zeng, K.; Lu, L. Inorganic Sodium Solid-State Electrolyte and Interface with Sodium Metal for Room-Temperature Metal Solid-State Batteries. Energy Storage Mater. 2020, 34, 28–44. [Google Scholar] [CrossRef]
  28. Guo, S.-T.; Liu, J.; Qian, W.; Zhu, W.-H.; Zhang, C.-Y. A review of quantum chemical methods for treating energetic molecules. Energetic Mater. Front. 2021, 2, 292–305. [Google Scholar] [CrossRef]
  29. Birdeanu, M.; Epuran, C.; Fratilescu, I.; Fagadar-Cosma, E. Structured Thin Films Based on Synergistic Effects of MnTa2O6 Oxide and bis-Carboxy-phenyl-substituted Porphyrins, Capable to Inhibit Steel Corrosion. Processes 2021, 9, 1890. [Google Scholar] [CrossRef]
  30. Birdeanu, M.; Vaida, M.; Bîrdeanu, A.-V.; Fagadar-Cosma, E. Pulsed Laser Deposition deposited layers of pseudo-binary zinc oxides and zinc-porphyrin for steel corrosion inhibition. Corrosion 2020, 76, 734–741. [Google Scholar] [CrossRef]
  31. Birdeanu, M.; Fagadar-Cosma, G.; Sebarchievici, I.; Bîrdeanu, A.-V.; Taranu, B.; Taranu, I.; Fagadar-Cosma, E. Zn(Ta1–xNbx)2O6 nanomaterials. Synthesis, characterization and corrosion behaviour. J. Serb. Chem. Soc. 2016, 81, 163–175. [Google Scholar] [CrossRef]
  32. Fagadar-Cosma, E.; Dudás, Z.; Birdeanu, M.; Almásy, L. Hybrid organic—Silica nanomaterials based on novel A3B mixed substituted porphyrin. Mater. Chem. Phys. 2014, 148, 143–152. [Google Scholar] [CrossRef]
  33. Anghel, D.; Lascu, A.; Epuran, C.; Fratilescu, I.; Ianasi, C.; Birdeanu, M.; Fagadar-Cosma, E. Hybrid Materials Based on Silica Matrices Impregnated with Pt-Porphyrin or PtNPs Destined for CO2 Gas Detection or for Wastewaters Color Removal. Int. J. Mol. Sci. 2020, 21, 4262. [Google Scholar] [CrossRef]
  34. Fratilescu, I.; Dudás, Z.; Birdeanu, M.; Epuran, C.; Anghel, D.; Fringu, I.; Lascu, A.; Len, A.; Fagadar-Cosma, E. Hybrid Silica Materials Applied for Fuchsine B Color Removal from Wastewaters. Nanomaterials. 2021, 11, 863. [Google Scholar] [CrossRef] [PubMed]
  35. Fratilescu, I.; Fagadar-Cosma, E. Recovery of Waste Industrial Waters Containing Red Congo by Multifunctionalized Mesoporous Silica Nanomaterials. Chem. Proc. 2022, 7, 19. [Google Scholar] [CrossRef]
  36. Takkar, S.; Tyagi, B.; Kumar, N.; Kumari, T.; Iqbal, K.; Varma, A.; Thakur, I.S.; Mishra, A. Biodegradation of methyl red dye by a novel actinobacterium Zhihengliuella sp. ISTPL4: Kinetic studies, isotherm and biodegradation pathway. Environ. Technol. Innov. 2022, 26, 102348. [Google Scholar] [CrossRef]
  37. Patil, N.P.; Bholay, A.D.; Kapadnis, B.P.; Gaikwad, V.B. Biodegradation of model azo dye methyl red and other textile dyes by isolate Bacillus circulans npp1. J. Pure Appl. Microbiol. 2016, 10, 2793–2800. [Google Scholar] [CrossRef]
  38. Chairunisa, W.; Imawan, C. The effect of pH on the characteristics of the methyl red solution as a gamma-ray dosimeter. J. Phys. Conf. Ser. 2019, 1321, 022015. [Google Scholar] [CrossRef]
  39. Wu, P.-C.; Hou, C.-T.; Hsiao, Y.-C.; Lee, W. Influence of methyl red as a dopant on the electrical properties and device performance of liquid crystals. Opt. Express 2014, 22, 31347–31355. [Google Scholar] [CrossRef]
  40. Irfan, M.H.; Bahrizal, S.H.; Aini, S. Degradation of Methyl Red Using a Mixture of Iron Oxide In Silica Mesoporous. Int. J. Sci. Res. Eng. Dev. 2019, 2, 597–600. [Google Scholar]
  41. Mnif, I.; Fendri, R.; Ghribi, D. Decolorization of methyl red using Bacillus thuringiensis RI16 strain: Enhanced bacterial treatment by SPB1 biosurfactant addition. Water Pract. Technol. 2022, 17, 2570–2580. [Google Scholar] [CrossRef]
  42. Ikram, M.; Naeem, M.; Zahoor, M.; Rahim, A.; Hanafiah, M.M.; Oyekanmi, A.A.; Shah, A.B.; Mahnashi, M.H.; Al Ali, A.; Jalal, N.A.; et al. Biodegradation of Azo Dye Methyl Red by Pseudomonas aeruginosa: Optimization of Process Conditions. Int. J. Environ. Res. Public Health 2022, 19, 9962. [Google Scholar] [CrossRef] [PubMed]
  43. Gul, S.; Kanwal, M.; Qazi, R.A.; Gul, H.; Khattak, R.; Khan, M.S.; Khitab, F.; Krauklis, A.E. Efficient Removal of Methyl Red Dye by Using Bark of Hopbush. Water 2022, 14, 2831. [Google Scholar] [CrossRef]
  44. Adusei, J.K.; Agorku, E.S.; Voegborlo, R.B.; Ampong, F.K.; Danu, B.Y.; Amarh, F.A. Removal of Methyl red in aqueous systems using synthesized NaAlg-g-CHIT/nZVI adsorbent. Sci. Afr. 2022, 17, e01273. [Google Scholar] [CrossRef]
  45. Kim, H.; Purev, O.; Myung, E.; Choi, N.; Cho, K. Removal of Methyl Red from Aqueous Solution Using Polyethyleneimine Crosslinked Alginate Beads with Waste Foundry Dust as a Magnetic Material. Int. J. Environ. Res. Public Health 2022, 19, 9030. [Google Scholar] [CrossRef]
  46. Tay, W.Y.; Ng, L.Y.; Ng, C.Y.; Sim, L.C. Removal of Methyl Red using Adsorbent Produced from Empty Fruit Bunches by Taguchi Approach. IOP Conf. Ser. Earth Environ. Sci. 2021, 945, 012014. [Google Scholar] [CrossRef]
  47. Dey, A.K.; Dey, A.; Goswami, R. Adsorption characteristics of methyl red dye by Na2CO3-treated jute fibre using multi-criteria decision making approach. Appl. Water Sci. 2022, 12, 179. [Google Scholar] [CrossRef]
  48. Dawadi, K.B.; Bhattarai, M.; Homagai, P.L. Adsorptive Removal of Methyl Red from Aqueous Solution using Charred and Xanthated Sal (Shorea robusta) Sawdust. Amrit Res. J. 2020, 1, 37–44. [Google Scholar] [CrossRef]
  49. Zaman, S.; Mehrab, N.; Islam, S.; Ghosh, G.C.; Chakraborty, T.K. Hen feather: A bio-waste material for adsorptive removal of methyl red dye from aqueous solutions. H2Open J. 2021, 4, 291–301. [Google Scholar] [CrossRef]
  50. Zhao, Y.; Zhang, P. Influence of Ta substitution for Nb in Zn3Nb2O8 and the impact on the crystal structure and microwave dielectric properties. Dalton Trans. 2016, 45, 11807–11816. [Google Scholar] [CrossRef]
  51. Ali Hakami, N.; Hosni Mahmoud, H.A. Deep Learning Classification of Crystal Structures Utilizing Wyckoff Positions. Crystals 2022, 12, 1460. [Google Scholar] [CrossRef]
  52. Li, Y.; Xu, S. The contribution of Eu3+ doping concentration on the modulation of morphology and luminescence properties of InVO4:Eu3+. RSC Adv. 2018, 8, 31905–31910. [Google Scholar] [CrossRef] [PubMed]
  53. Tang, Q.; Yang, T.; Guo, B.; Peng, B.; Huang, H.; Ao, J. Synthesis and photoluminescence properties of Eu3+ doped Sr5Nb4O15 red-emitting phosphors for white LEDs. Optik 2020, 224, 165770. [Google Scholar] [CrossRef]
  54. Cossard, A.; Desmarais, J.K.; Casassa, S.; Gatti, C.; Erba, A. Charge Density Analysis of Actinide Compounds from the Quantum Theory of Atoms in Molecules and Crystals. J. Phys. Chem. Lett. 2021, 12, 1862–1868. [Google Scholar] [CrossRef]
  55. Desmarais, J.K.; Flament, J.-P.; Erba, A. Adiabatic connection in spin-current density functional theory. Phys. Rev. B 2020, 102, 235118. [Google Scholar] [CrossRef]
  56. Desmarais, J.K.; Erba, A.; Dovesi, R. Generalization of the periodic LCAO approach in the CRYSTAL code to g-type orbitals. Theor. Chem. Acc. 2018, 137, 28. [Google Scholar] [CrossRef]
  57. Elgengehi, S.M.; El-Taher, S.; Ibrahim, M.A.A.; Desmarais, J.K.; El-Kelany, K.E. Graphene and graphene oxide as adsorbents for cadmium and lead heavy metals: A theoretical investigation. Appl. Surf. Sci. 2020, 507, 145038. [Google Scholar] [CrossRef]
  58. Dovesi, R.; Orlando, R.; Erba, A.; Zicovich-Wilson, C.M.; Civalleri, B.; Casassa, S.; Maschio, L.; Ferrabone, M.; De La Pierre, M.; D’Arco, P.; et al. CRYSTAL14: A program for the ab initio investigation of crystalline solids. Int. J. Quantum Chem. 2014, 114, 1287–1317. [Google Scholar] [CrossRef]
  59. Segall, M.D.; Shah, R.; Pickard, C.J.; Payne, M.C. Population analysis of plane-wave electronic structure calculations of bulk materials. Phys. Rev. B 1996, 54, 16317. [Google Scholar] [CrossRef]
  60. Shou, H.-W.; Xie, R.-Y.; Peng, M.-J.; Duan, Y.-H.; Sun, Y. Stability and electronic structures of the Ti-Zn intermetallic compounds: A DFT calculation. Phys. B Condens. Matter 2019, 560, 41–45. [Google Scholar] [CrossRef]
  61. Levine, I.N. Chapter 15: Ab Initio and Density-Functional Treatments of Molecules. In Quantum Chemistry, 5th ed.; Prentice Hall: Hoboken, NJ, USA, 2009; pp. 480–592. [Google Scholar]
  62. Dovesi, R.; Civalleri, B.; Roetti, C.; Saunders, V.R.; Orlando, R. Chapter 1: Ab Initio Quantum Simulation in Solid State Chemistry. In Reviews in Computational Chemistry; Lipkowitz, K.B., Larter, R., Cundari, T.R., Eds.; Wiley: Hoboken, NJ, USA, 2005; Volume 21. [Google Scholar] [CrossRef]
  63. Evarestov, R.A. Quantum Chemistry of Solids The LCAO First Principles Treatment of Crystals; Cardona, M., Fulde, P., von Klitzing, K., Queisser, H.-J., Merlin, R., Stormer, H., Eds.; Springer: Berlin/Heidelberg, Germany, 2007; pp. 105–140. [Google Scholar]
  64. Luo, W.; Li, L.; Zhang, B.; Qiao, J. The mechanism of microwave response in layer-cofired Zn3Nb2O8–TiO2–Zn3Nb2O8 ceramic architecture. J. Alloy. Compd. 2020, 824, 153978. [Google Scholar] [CrossRef]
  65. Jayarambabu, N.; Siva Kumari, B.; Venkateswara Rao, K.; Prabhu, Y.T. Germination and Growth Characteristics of Mungbean Seeds (Vigna radiata L.) affected by Synthesized Zinc Oxide Nanoparticles. Int. J. Curr. Eng. Technol. 2014, 4, 3411–3416. [Google Scholar]
  66. Patel, M.; Mishra, S.; Verma, R.; Shikha, D. Synthesis of ZnO and CuO nanoparticles via Sol gel method and its characterization by using various technique. Discov. Mater. 2022, 2, 1. [Google Scholar] [CrossRef]
  67. Birdeanu, M.; Sebarchievici, I.; Bîrdeanu, A.-V.; Ţăranu, B.; Peter, F.; Fagadar-Cosma, E. Synthesis, characterization and potential application of Zn3(Ta1-xNbx)2O8 oxides. Dig. J. Nanomater. Biostructures 2015, 10, 543–555. [Google Scholar]
  68. Ristić, M.; Popović, S.; Musić, S. Sol–gel synthesis and characterization of Nb2O5 powders. Mater. Lett. 2004, 58, 2658–2663. [Google Scholar] [CrossRef]
  69. Nagaraju, P.; Vasudevan, R.; Alsalme, A.; Alghamdi, A.; Arivanandhan, M.; Jayavel, R. Surfactant-Free Synthesis of Nb2O5 Nanoparticles Anchored Graphene Nanocomposites with Enhanced Electrochemical Performance for Supercapacitor Electrodes. Nanomaterials 2020, 10, 160. [Google Scholar] [CrossRef]
  70. Lima Valerio, T.; Rodrigues Maia, G.A.; Gonçalves, L.F.; Viomar, A.; do Prado Banczek, E.; Pinto Rodrigues, P.R. Study of the Nb2O5 Insertion in ZnO to Dye-sensitized Solar Cells. Mater. Res. 2019, 22 (Suppl. 1), e20180864. [Google Scholar] [CrossRef]
  71. Binnemans, K. Interpretation of europium(III) spectra. Coord. Chem. Rev. 2015, 295, 1–45. [Google Scholar] [CrossRef]
  72. Ribeiro de Mesquita, B.; Couto dos Santos, M.A. Spectroscopic study of the Eu3+ local symmetry in EuF3 crystal. J. Fluor. Chem. 2021, 243, 109730. [Google Scholar] [CrossRef]
  73. Samanta, S.; Soni Reddy, P.; Mandal, K. Field Asymmetry Ratio: A new quantitative parameter to select microstrip antenna geometries for low cross-polarization application. AEU Int. J. Electron. Commun. 2021, 128, 153519. [Google Scholar] [CrossRef]
  74. Porcher, P.; Caro, P. Influence of J-mixing on the phenomenological interpretation of the Eu3+ ion spectroscopic properties. J. Lumin. 1980, 21, 207–216. [Google Scholar] [CrossRef]
  75. Gedam, S.C.; Dhoble, S.J.; Pode, R.B. 5D0→7F1 and 5D0→7F2 transition in europium doped halosulphates for mercury-free lamps. J. Lumin. 2012, 132, 2693–2696. [Google Scholar] [CrossRef]
  76. Albani, J.R. Chapter 3: Fluorophores: Descriptions and Properties. In Structure and Dynamics of Macromolecules: Absorption and Fluorescence Studies, 1st ed.; Elsevier: Amsterdam, The Netherlands, 2004; pp. 99–140. [Google Scholar] [CrossRef]
  77. Kumar, A.; Manam, J. Thermally stable Na2ZrO3: Eu3+ phosphors for UV excited tricolor white LEDs. Mater. Today Proc. 2020, 46, 6107–6112. [Google Scholar] [CrossRef]
  78. Zhao, W.; Wen, H.; Fan, B.; Li, H. Novel multicolor-tunable phosphor Ba3B6Si2O16: Tb3+, Eu3+—Luminescent properties and energy transfer for near-UV white LEDs. J. Solid State Chem. 2020, 288, 121403. [Google Scholar] [CrossRef]
  79. Noh, T.H.; Cho, I.-S.; Lee, S.; Kim, D.W.; Park, S.; Seo, S.W.; Lee, C.W.; Hong, K.S. Photophysical and Photocatalytic Properties of Zn3M2O8 (M=Nb,Ta). J. Am. Ceram. Soc. 2011, 95, 227–231. [Google Scholar] [CrossRef]
  80. Carbonaro, C.M.; Corpino, R.; Ricci, P.C.; Chiriu, D. On the Origin of Blue and UV Emission Bands in Mesoporous Silica. AIP Conf. Proc. 2014, 15, 15–22. [Google Scholar] [CrossRef]
  81. Anedda, A.; Carbonaro, C.M.; Clemente, F.; Corpino, R.; Ricci, P.C. Low temperature investigation of the blue emission in mesoporous silica. Mater. Sci. Eng. C 2005, 25, 631–634. [Google Scholar] [CrossRef]
  82. Rabouw, F.T.; Cogan, N.M.B.; Berends, A.C.; van der Stam, W.; Vanmaekelbergh, D.; Koenderink, A.F.; Krauss, T.D.; de Mello Donega, C. Non-blinking single-photon emitters in silica. Sci. Rep. 2016, 6, 21187. [Google Scholar] [CrossRef]
  83. Făgădar-Cosma, E.; Făgădar-Cosma, G.; Vasile, M.; Enache, C. Synthesis, spectroscopic and self-assembling characterization of novel photoactive mixed aryl-substituted porphyrin. Curr. Org. Chem. 2012, 16, 931–941. [Google Scholar] [CrossRef]
  84. Mak, C.A.; Pericas, M.A.; Fagadar-Cosma, E. Functionalization of A3B-type porphyrin with Fe3O4 MNPs. Supramolecular assemblies, gas sensor and catalytic applications. Catal. Today 2018, 306, 268–275. [Google Scholar] [CrossRef]
  85. Iwaki, M.; Takahashi, H.; Uematsu, K.; Toda, K.; Sato, M. Emission color shift from green yellow to reddish orange in Eu2+-activated Ca6BaP4O17 by doping high amount of activator ion. J. Lumin. 2022, 246, 118810. [Google Scholar] [CrossRef]
  86. Quiroz-Segoviano, R.I.Y.; Serratos, I.N.; Rojas-González, F.; Tello-Solís, S.R.; Sosa-Fonseca, R.; Medina-Juárez, O.; Menchaca-Campos, C.; García-Sánchez, M.A. On Tuning the Fluorescence Emission of Porphyrin Free Bases Bonded to the Pore Walls of Organo-Modified Silica. Molecules 2014, 19, 2261–2285. [Google Scholar] [CrossRef] [PubMed]
  87. Venkatramaiah, N.; Ramakrishna, B.; Kumar, A.R.; Veeraiah, N.; Venkatesan, R. Enhanced stokes shift of S2→S0 emission and structural investigations of Sn(IV)Porphyrins doped hybrid borate glasses. J. Alloy. Compd. 2012, 513, 318–323. [Google Scholar] [CrossRef]
  88. Kelm, A.; Ostapko, J.; Gajewska, A.; Sánchez-Iglesias, A.; Waluk, J. Spectral and photophysical modifications of porphyrins attached to core–shell nanoparticles. Theory and experiment. Methods Appl. Fluoresc. 2021, 9, 045003. [Google Scholar] [CrossRef]
  89. Ishihara, S.; Labuta, J.; Van Rossom, W.; Ishikawa, D.; Minami, K.; Hill, J.P.; Ariga, K. Porphyrin-based sensor nanoarchitectonics in diverse physical detection modes. Phys. Chem. Chem. Phys. 2014, 16, 9713–9746. [Google Scholar] [CrossRef]
  90. Albani, J.R. Chapter 2: Fluorescence: Principles and Observables. In Structure and Dynamics of Macromolecules: Absorption and Fluorescence Studies, 1st ed.; Elsevier: Amsterdam, The Netherlands, 2004; pp. 55–98. [Google Scholar] [CrossRef]
  91. Kapaklis, V.; Poulopoulos, P.; Karoutsos, V.; Manouras, T.; Politis, C. Growth of thin Ag films produced by radio frequency magnetron sputtering. Thin Solid Films 2006, 510, 138–142. [Google Scholar] [CrossRef]
  92. Thommes, M.; Kaneko, K.; Neimark, A.V.; Olivier, J.P.; Rodriguez-Reinoso, F.; Rouquerol, J.; Sing, K.S.W. Physisorption of gases, with special reference to the evaluation of surface area and pore size distribution (IUPAC Technical Report). Pure Appl. Chem. 2015, 87, 1051–1069. [Google Scholar] [CrossRef]
  93. Chen, K.; Zhang, T.; Chen, X.; He, Y.; Liang, X. Model construction of micro-pores in shale: A case study of Silurian Longmaxi Formation shale in Dianqianbei area, SW China. Pet. Explor. Dev. 2018, 45, 412–421. [Google Scholar] [CrossRef]
  94. Birdeanu, M.; Epuran, C.; Fratilescu, I.; Fagadar-Cosma, E. Structured composites between MnTa2O6 and porphyrins: Influence of the number of carboxylic groups grafted on porphyrins on the capacity to inhibit corrosion of steel. Indian J. Chem. Technol. 2022, 29, 354–366. [Google Scholar] [CrossRef]
  95. Lőrinczi, A.; Fagadar-Cosma, E.; Socol, G.; Mihăilescu, A.; Matei, E.; Sava, F.; Ştefan, M. SnSe2-Zn-Porphyrin Nanocomposite Thin Films for Threshold Methane Concentration Detection at Room Temperature. Chemosensors 2020, 8, 134. [Google Scholar] [CrossRef]
  96. Fagadar-Cosma, E.; Enache, C.; Armeanu, I.; Dascalu, D.; Fagadar-Cosma, G.; Vasile, M.; Grozescu, I. The influence of pH over topography and spectroscopic properties of silica hybrid materials embedding meso-tetratolylporphyrin. Mater. Res. Bull. 2009, 44, 426–431. [Google Scholar] [CrossRef]
  97. Pomonis, P.J.; Tsaousi, E.T. Frenkel−Halsey−Hill Equation, Dimensionality of Adsorption, and Pore Anisotropy. Langmuir 2009, 25, 9986–9994. [Google Scholar] [CrossRef] [PubMed]
  98. Dudas, Z.; Enache, C.; Fagadar-Cosma, G.; Armeanu, I.; Fagadar-Cosma, E. Hybrid silica-porphyrin materials with tailored pore sizes. Mater. Res. Bull. 2010, 45, 1150–1156. [Google Scholar] [CrossRef]
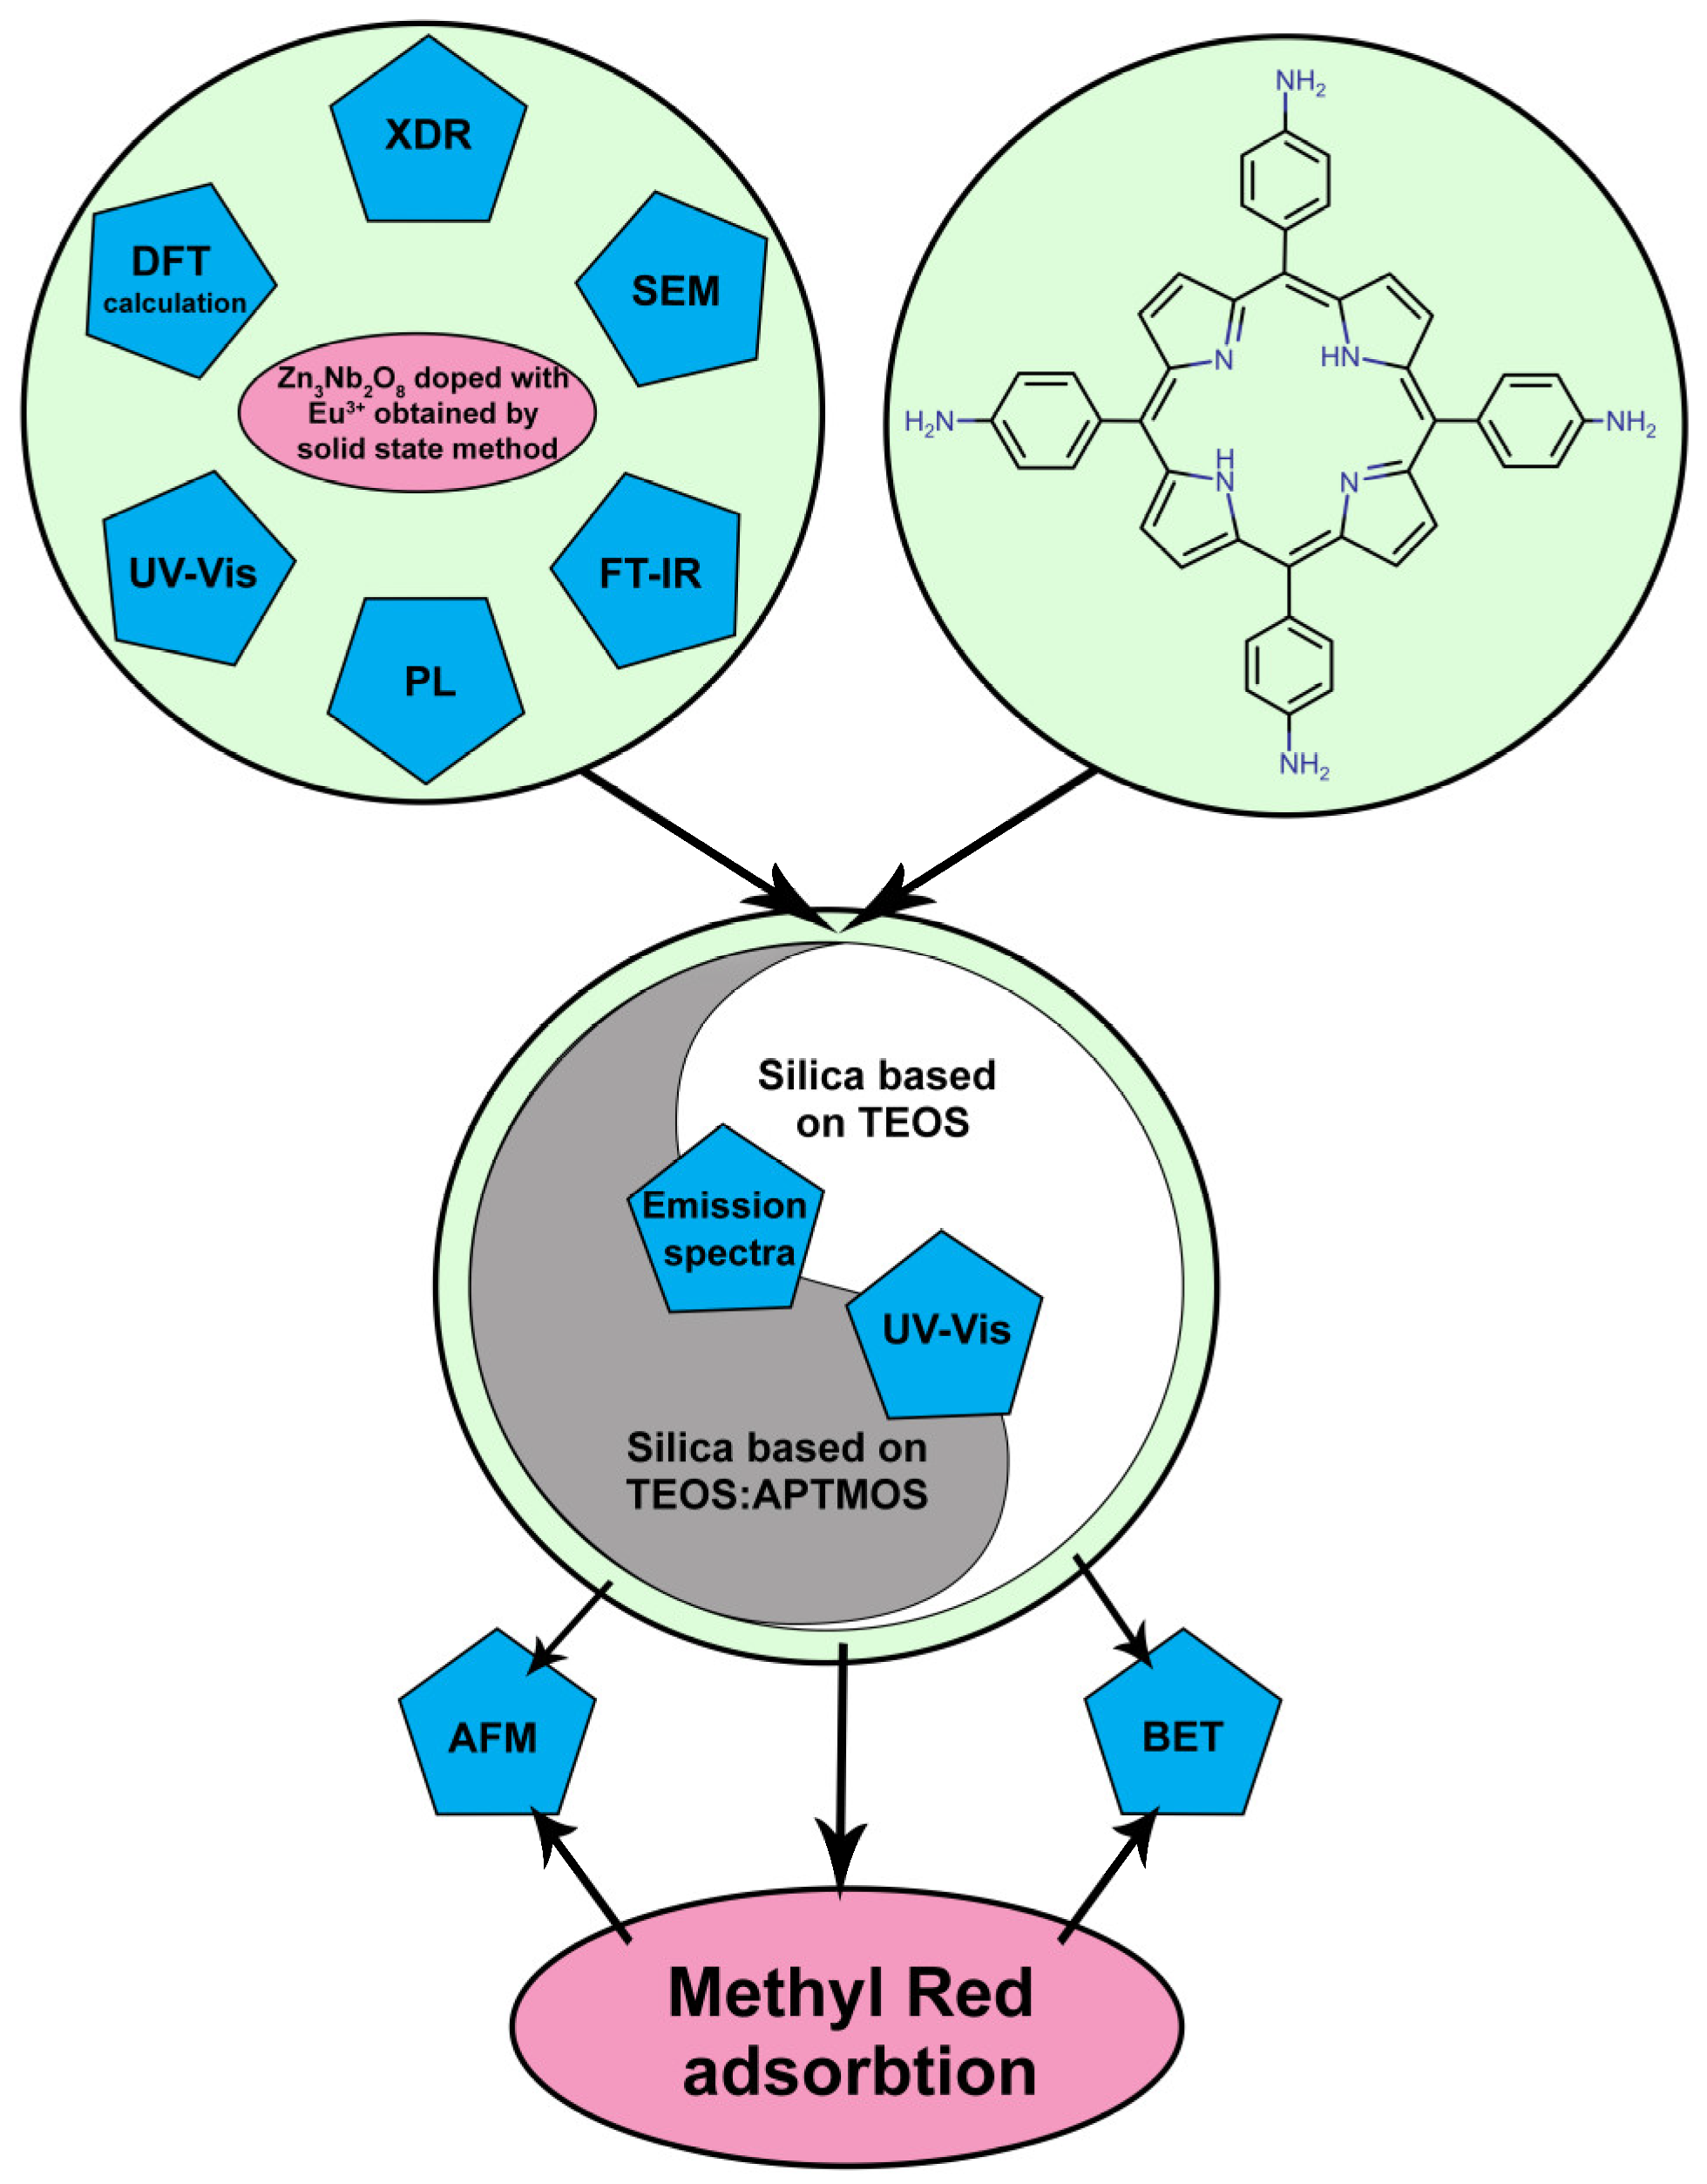
Scheme 1. The workflow of the main research steps.
Ijms 24 08920 sch001
Figure 1. Chemical structure of methyl red.
Ijms 24 08920 g001
Figure 2. XRD patterns of: (a) 1—Zn3Nb2O8 and 2—Zn3Nb2O8: 0.5% Eu3+. A magnified zone of the X-ray diffraction spectrum containing the most important peaks is inserted. (b) Primitive cell of Zn3Nb2O8 determined with the CRYSTAL14 software.
Ijms 24 08920 g002
Figure 3. SEM images for (a) Zn3Nb2O8 and (b) Zn3Nb2O8: Eu3+.
Ijms 24 08920 g003
Figure 4. FT-IR spectra of the obtained pseudo-binary oxides: Zn3Nb2O8 and Zn3Nb2O8: 0.5% Eu3+ in KBr pellets.
Ijms 24 08920 g004
Figure 5. Photoluminescence (PL) spectra at room temperature (a) excitation; (b) emission of the synthesized nanomaterials of Zn3Nb2O8 and Zn3Nb2O8: 0.5% Eu3+; and (c) photos taken under UV irradiation at the wavelength λ = 254 nm: A—Zn3Nb2O8 and B—Zn3Nb2O8: 0.5% Eu3+.
Ijms 24 08920 g005
Figure 6. Overlapped UV-Vis absorption spectra for solid registration of Zn3Nb2O8, Zn3Nb2O8: 0.5% Eu3+, and for tetrakis-(4-amino-phenyl)-porphyrin (TAPP) in DMSO.
Ijms 24 08920 g006
Figure 8. The gap between valence and conduction bands in Zn3Nb2O8.
Ijms 24 08920 g008
Figure 9. The projection of the density of electronic states (PDOS) as a function of the type of ions in the crystalline lattice. (a) Total density of electronic states in the valence band and conduction band of Zn3Nb2O8; (b) density of electronic states for the Nb ion; (c) density of electronic states on the O ion; (d) density of electronic states on the Zn ion.
Ijms 24 08920 g009aIjms 24 08920 g009b
Figure 11. Eu3+ in the (a) interstitial or (b) substitutional Zn(1) position.
Ijms 24 08920 g011
Figure 14. Overlapped emission spectra for solid silica samples based on TEOS: λex = 400 nm, excitation slit = 15 nm, emission slit = 5 nm, 100 nm/min.
Ijms 24 08920 g014
Figure 15. Overlapped emission spectra for solid silica samples containing the TEOS and APTMOS precursors in a 9:1 molar ratio: λex = 400 nm, excitation slit = 15 nm, emission slit = 5 nm, 100 nm/min.
Ijms 24 08920 g015
Figure 16. Color emission of the silica materials (under UV light) in comparison with the pseudo-binary oxide doped with Eu3+ ions.
Ijms 24 08920 g016
Figure 20. AFM characterization of the hybrid silica nanomaterials containing Zn3Nb2O8 doped with Eu3+ and amino-substituted porphyrin before and after methyl red (MR) absorption. The best adsorbent materials are highlighted in frames.
Ijms 24 08920 g020
Figure 22. Nitrogen adsorption-desorption isotherms of samples based on TEOS:APTMOS (a) before and (b) after adsorption of MR.
Ijms 24 08920 g022
Table 1. The removal performance of MR from contaminated waters using various adsorbent materials.
Adsorbent MaterialRemoval Percentage Adsorption Capacity
[mg/g]
ConditionsAdvantagesDisadvantagesRef.
Bark of the Dodonaea viscosa (Hopbush) plant7336.64 pH = 1
75 min
contact time
InexpensiveSelective distribution of this plant in regions of Africa, the Americas, southern Asia, and Australasia
Highly acidic pH
[43]
Nano-zero-valent iron dispersed in chitosan and sodium alginate68.03.38pH = 2
60 min exposure
--[44]
Beads of waste foundry dust, sodium alginate, and polyethylene imine89.1672.7 pH = 9
3 h
exposure
  • Easy to recover;
  • Magnetic material;
Local industry foundry[45]
Activated carbon obtained from the carbonization and activation of empty raw palm oil fruit bunches86.722.15pH = 2
180 min
contact time
  • Reducing waste from the palm oil industry
  • Palm-oil production is perturbing the rainforest;
  • Energy-consuming method for obtaining the adsorbent
[46]
Jute fibers treated with sodium carbonate-32.11pH  =  7.08
120 min
contact time
Inexpensive Local Indian plants[47]
Charred Shorea robusta Saw-Dust modified with
concentrated sulfuric acid or
NaOH and CS2
70;
130
pH = 4
3–4 h contact time
-Tedious preparation of adsorbent material[48]
Hen feather926.02pH = 4
90 min exposure time
  • Effective;
  • Low cost
-[49]
TEOS-based silica material functionalized with tetra-aminophenyl porphyrin and Zn3Nb2O8 doped with Eu3+88.0411.85pH = 5.5
120 min exposure time
No pH adjustments are necessary-This work
Table 2. Net electronic load.
NbZn1Zn2O1O2O3O4
Nr. electrons/ion 10.83118.81818.8379.0379.0758.9438.868
Table 3. Overlapping coefficients of atomic orbitals in the lattice.
O1O2O3O4
Nb0.0760.1060.1120.065
Zn10.0450.0100.0320.048
Zn20.0130.0380.0660.021
Table 4. The distance between Eu3+ and the closest neighbors for the interstitial and substitutional positions.
R [Å] R [Å]
Eu3+ interstitial1.5302O21O23Eu3+
substitutional
2.0998O25O26
2.4208Zn5Zn62.1028O19O20
2.5392O26 O282.1792O23O24
2.6690O22 O243.4614O21O22
2.7072Nb2Nb43.5366Nb2Nb4
Table 5. Amount of adsorbed dye per unit mass of adsorbent and removal efficiency for a loading of 2 g/L.
Methyl Red Concentration
1 × 10⁻⁴ M
Methyl Red Concentration
1 × 10⁻⁵ M
Adsorbent
Material
qe [mg\g]R.E. [%]qe [mg\g]R.E. [%]
S-TE (control)5.97044.341.15485.74
S-TE-OX11.55085.781.19188.42
S-TE-porf8.40762.431.14885.29
S-TE-porf-OX11.85488.041.24592.48
S-TE-AP (control)4.13130.680.90066.81
S-TE-AP-OX1.52911.360.81460.45
S-TE-AP-porf0.3972.950.76756.98
S-TE-AP-porf-OX0.4153.080.69451.51
Table 9. Textural parameters of samples based on TEOS before exposure to MR.
Sample NameSpecific
Surface Area [m2/g]
BJH Ads, Pore Size
Distribution [nm]
BJH Des, Pore Size
Distribution [nm]
Average Pore Size [nm]Total Pore
Volume [cm3/g]
FHH Desorption Branch
S-TE7263.0683.7323.0640.556 for pores smaller than 171.5 nm2.4779
S-TE-OX5693.4773.7012.9120.415 for pores smaller than 169.9 nm2.5452
S-TE-porf6743.4653.7213.1140.525 for pores smaller than 259.5 nm2.5112
S-TE-porf-OX5183.4613.7523.1670.410 for pores smaller than 158.1 nm2.4525
Table 10. Textural parameters of samples based on TEOS after exposure to MR.
Sample NameSpecific
Surface Area [m2/g]
BJH Ads, Pore Size
Distribution [nm]
BJH Des, Pore Size
Distribution [nm]
Average Pore Size [nm]Total Pore
Volume [cm3/g]
FHH Desorption Branch
S-TE + MR7063.4493.7313.0290.535 for pores smaller than 243.0 nm2.5337
S-TE-OX + MR5633.4593.7403.3410.470 for pores smaller than 157.3 nm2.4410
S-TE-porf + MR6963.4253.7513.0250.527 for pores smaller than 232.4 nm2.5580
S-TE-porf-OX + MR4893.4173.7343.5470.434 for pores smaller than 237.7 nm2.4318
Table 11. Textural parameters of samples based on TEOS:APTMOS before exposure to MR.
Sample NameSurface
Area, [m2/g]
BJH Ads, Pore Size
Distribution [nm]
BJH Des, Pore Size Distribution [nm]Average Pore Size [nm]Total Pore
Volume [cm3/g]
FHH Desorption Branch
S-TE-AP1973.4183.92218.4900.910 for pores smaller than 152.3 nm1.4817
S-TE-AP-OX1993.4523.37813.0330.649 for pores smaller than 151.7 nm1.6392
S-TEAP-porf1453.4323.93011.1500.403 for pores smaller than 141.6 nm1.7750
S-TE-AP-porf-OX1313.4533.22712.2190.401 for pores smaller than 147.8 nm1.7584
Table 12. Textural parameters of samples based on TEOS:APTMOS after exposure to MR.
Sample NameSurface
Area, [m2/g]
BJH Ads, Pore Size
Distribution [nm]
BJH Des, Pore Size Distribution [nm]Average Pore Size [nm]Total Pore
Volume [cm3/g]
FHH
Desorption Branch
S-TE-AP + MR1573.4353.24615.0130.590 for pores smaller than 154.1 nm1.5697
S-TE-AP-OX + MR1614.3163.24115.4270.621 for pores smaller than 141.9 nm1.5219
S-TE-AP-porf + MR1133.4363.94312.6380.357 for pores smaller than 146.0 nm1.6753
S-TE-AP-porf-OX + MR1183.8383.94012.7010.374 for pores smaller than 143.0 nm1.7132
Table 13. Sample abbreviations, silica precursors, catalysts, and incorporated materials.
No.Silica Samples
Abbreviation
Alcoxide Precursors (Molar Ratios)HCl 37% (Moles)TAPP
Porphyrin
(Moles)
Zn3Nb2O8 Doped with 0.5% Eu3+
(1% Reported to
Alcoxide)
NH3 2.5% (mol) Used Till
Gelation
1S-TE (control)TEOS (1:1)-0.05 mole0.001--0.00164
2S-TE-OX -0.104 g0.00203
3S-TE-porf5 × 10−6-0.00174
4S-TE-porf-OX5 × 10−60.104 g0.00247
5S-TE-AP (control)TEOS/APTMOS (9:1)-0.045:0.005 mole0.001---
6S-TE-AP-OX-0.104 g-
7S-TE-AP-porf5 × 10−6-0.0025
8S-TE-AP-porf-OX5 × 10−60.104 g0.0025
Disclaimer/Publisher’s Note: The statements, opinions and data contained in all publications are solely those of the individual author(s) and contributor(s) and not of MDPI and/or the editor(s). MDPI and/or the editor(s) disclaim responsibility for any injury to people or property resulting from any ideas, methods, instructions or products referred to in the content.