
Single-Cell Transcriptomics Unveils the Dedifferentiation Mechanism of Lung Adenocarcinoma Stem Cells

 , and
, and 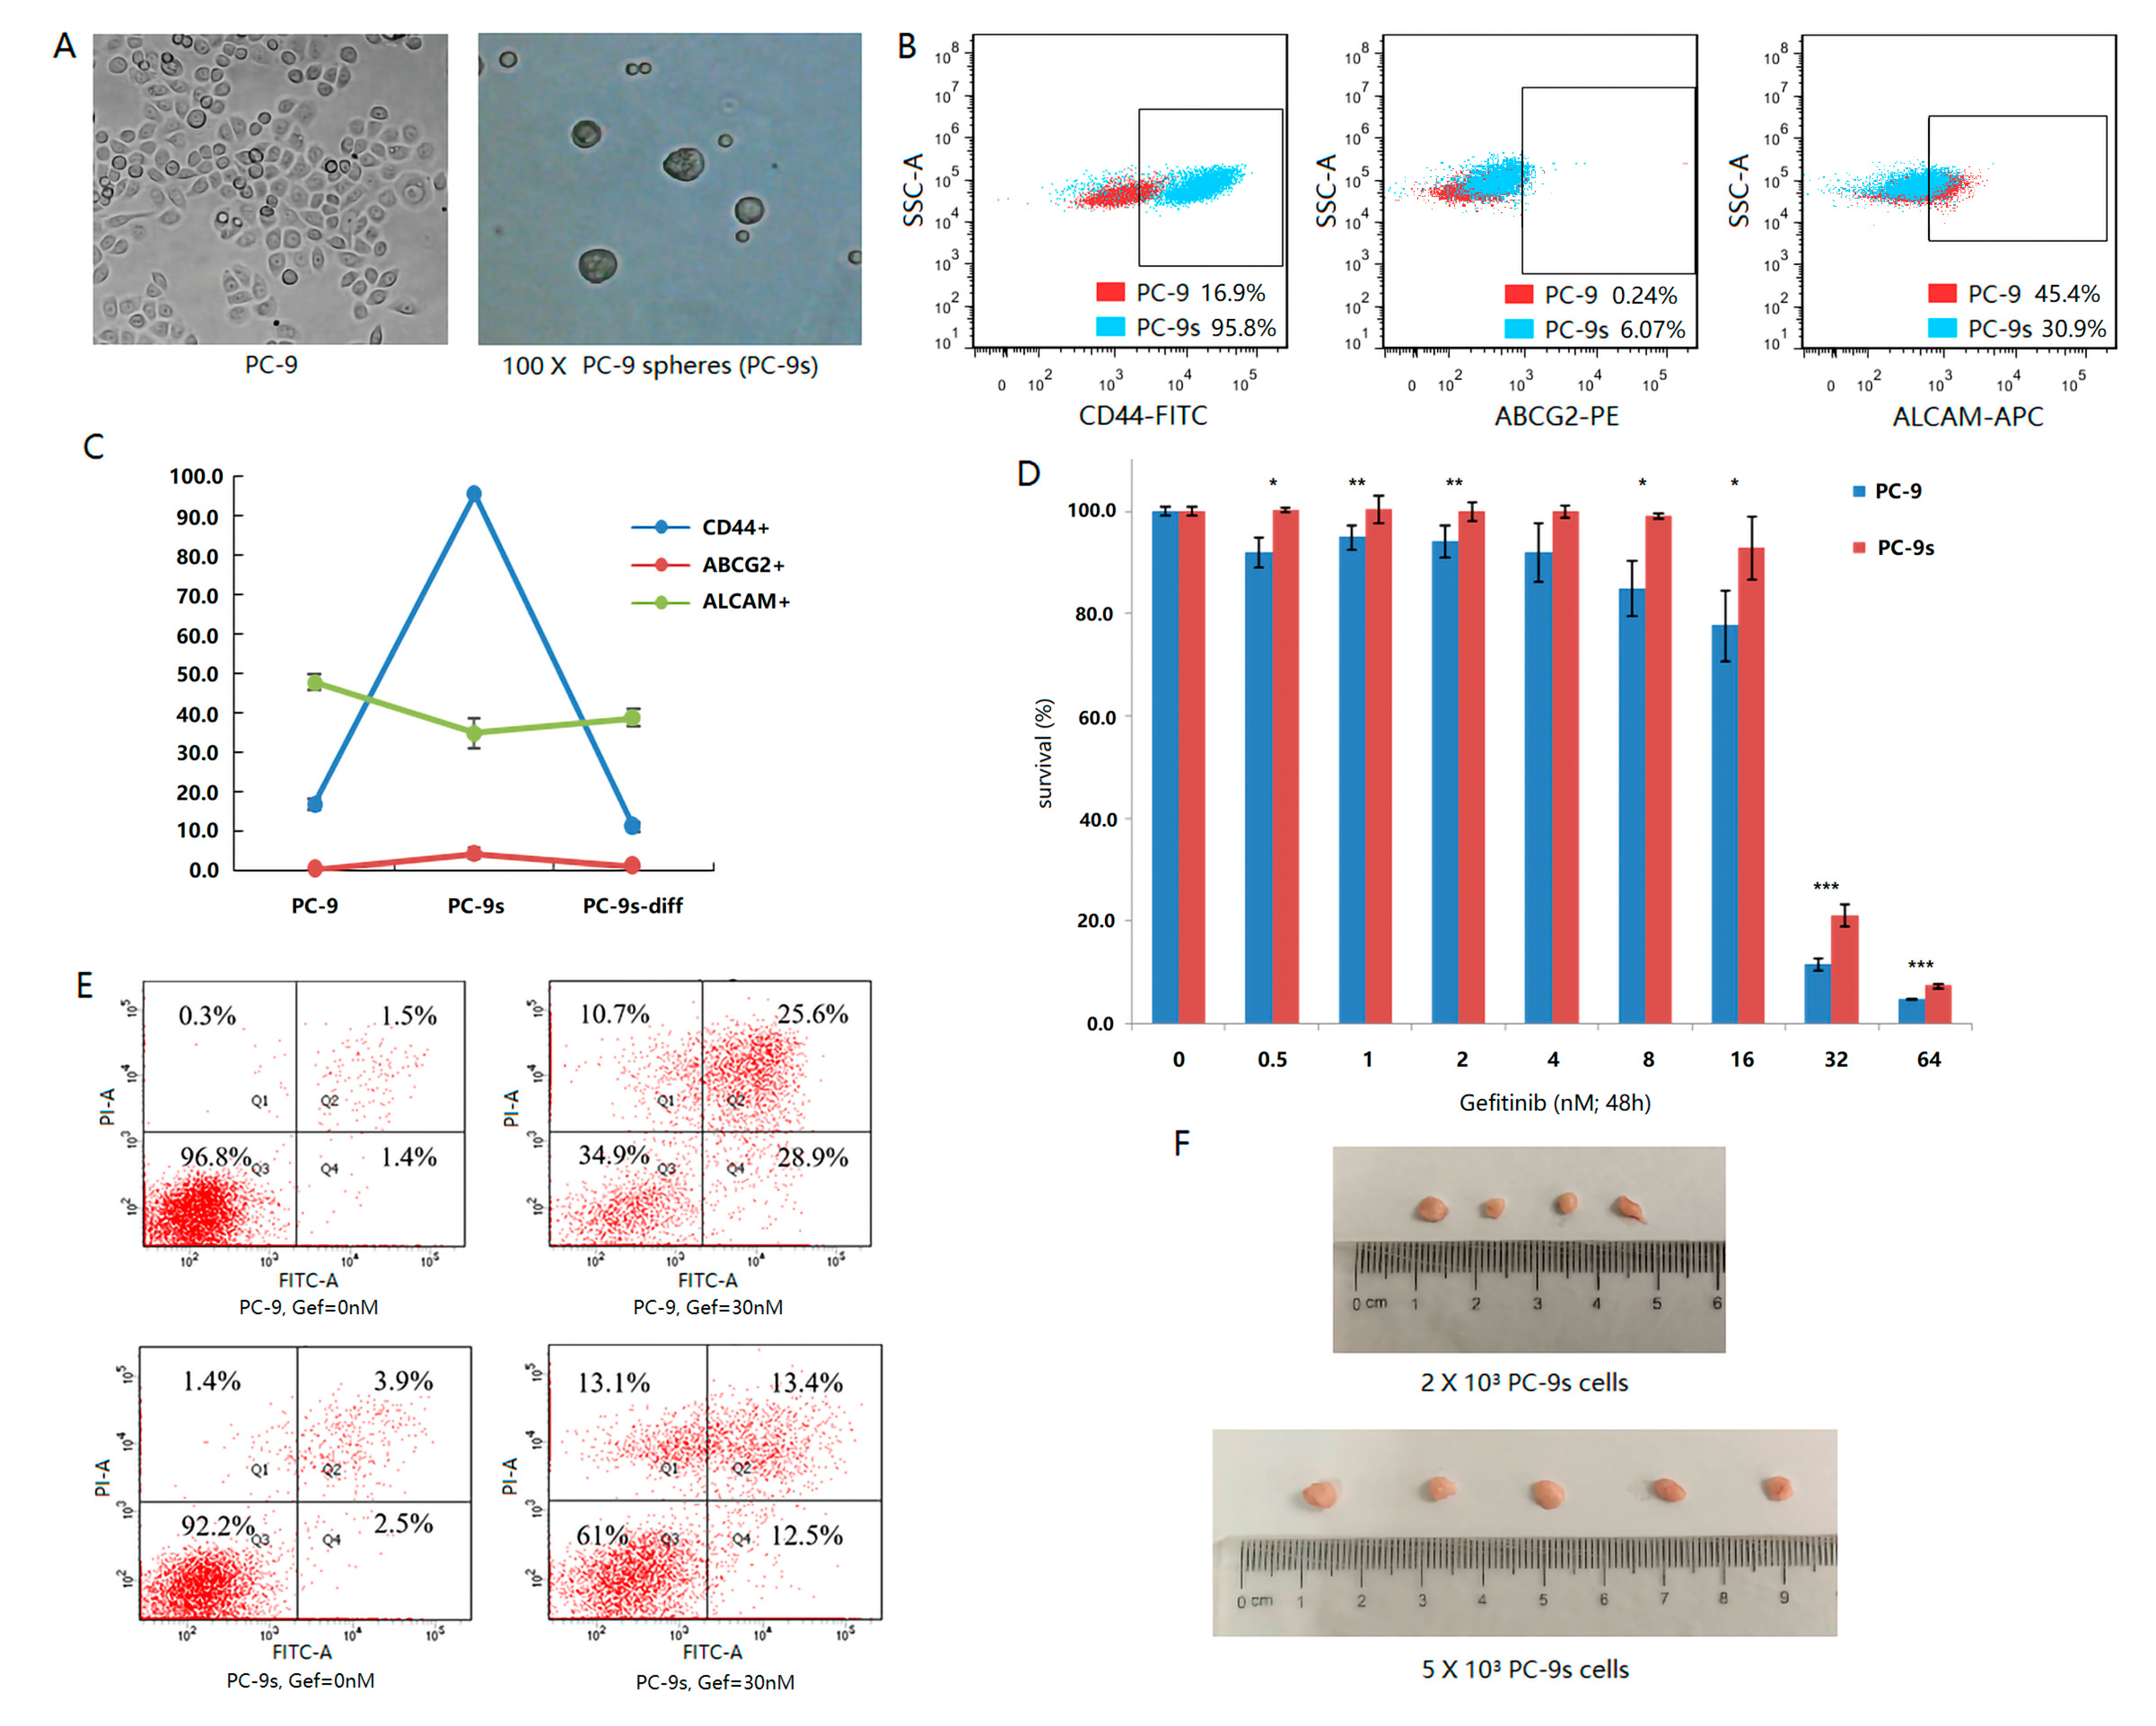
Abstract
1. Introduction
2. Results
2.1. Sphere-Forming Culture Enriching Stem Cells of PC-9 Cell Line
2.2. Single-Cell Transcriptomics Reveals Heterogeneity of Stem Subclones within PC-9s
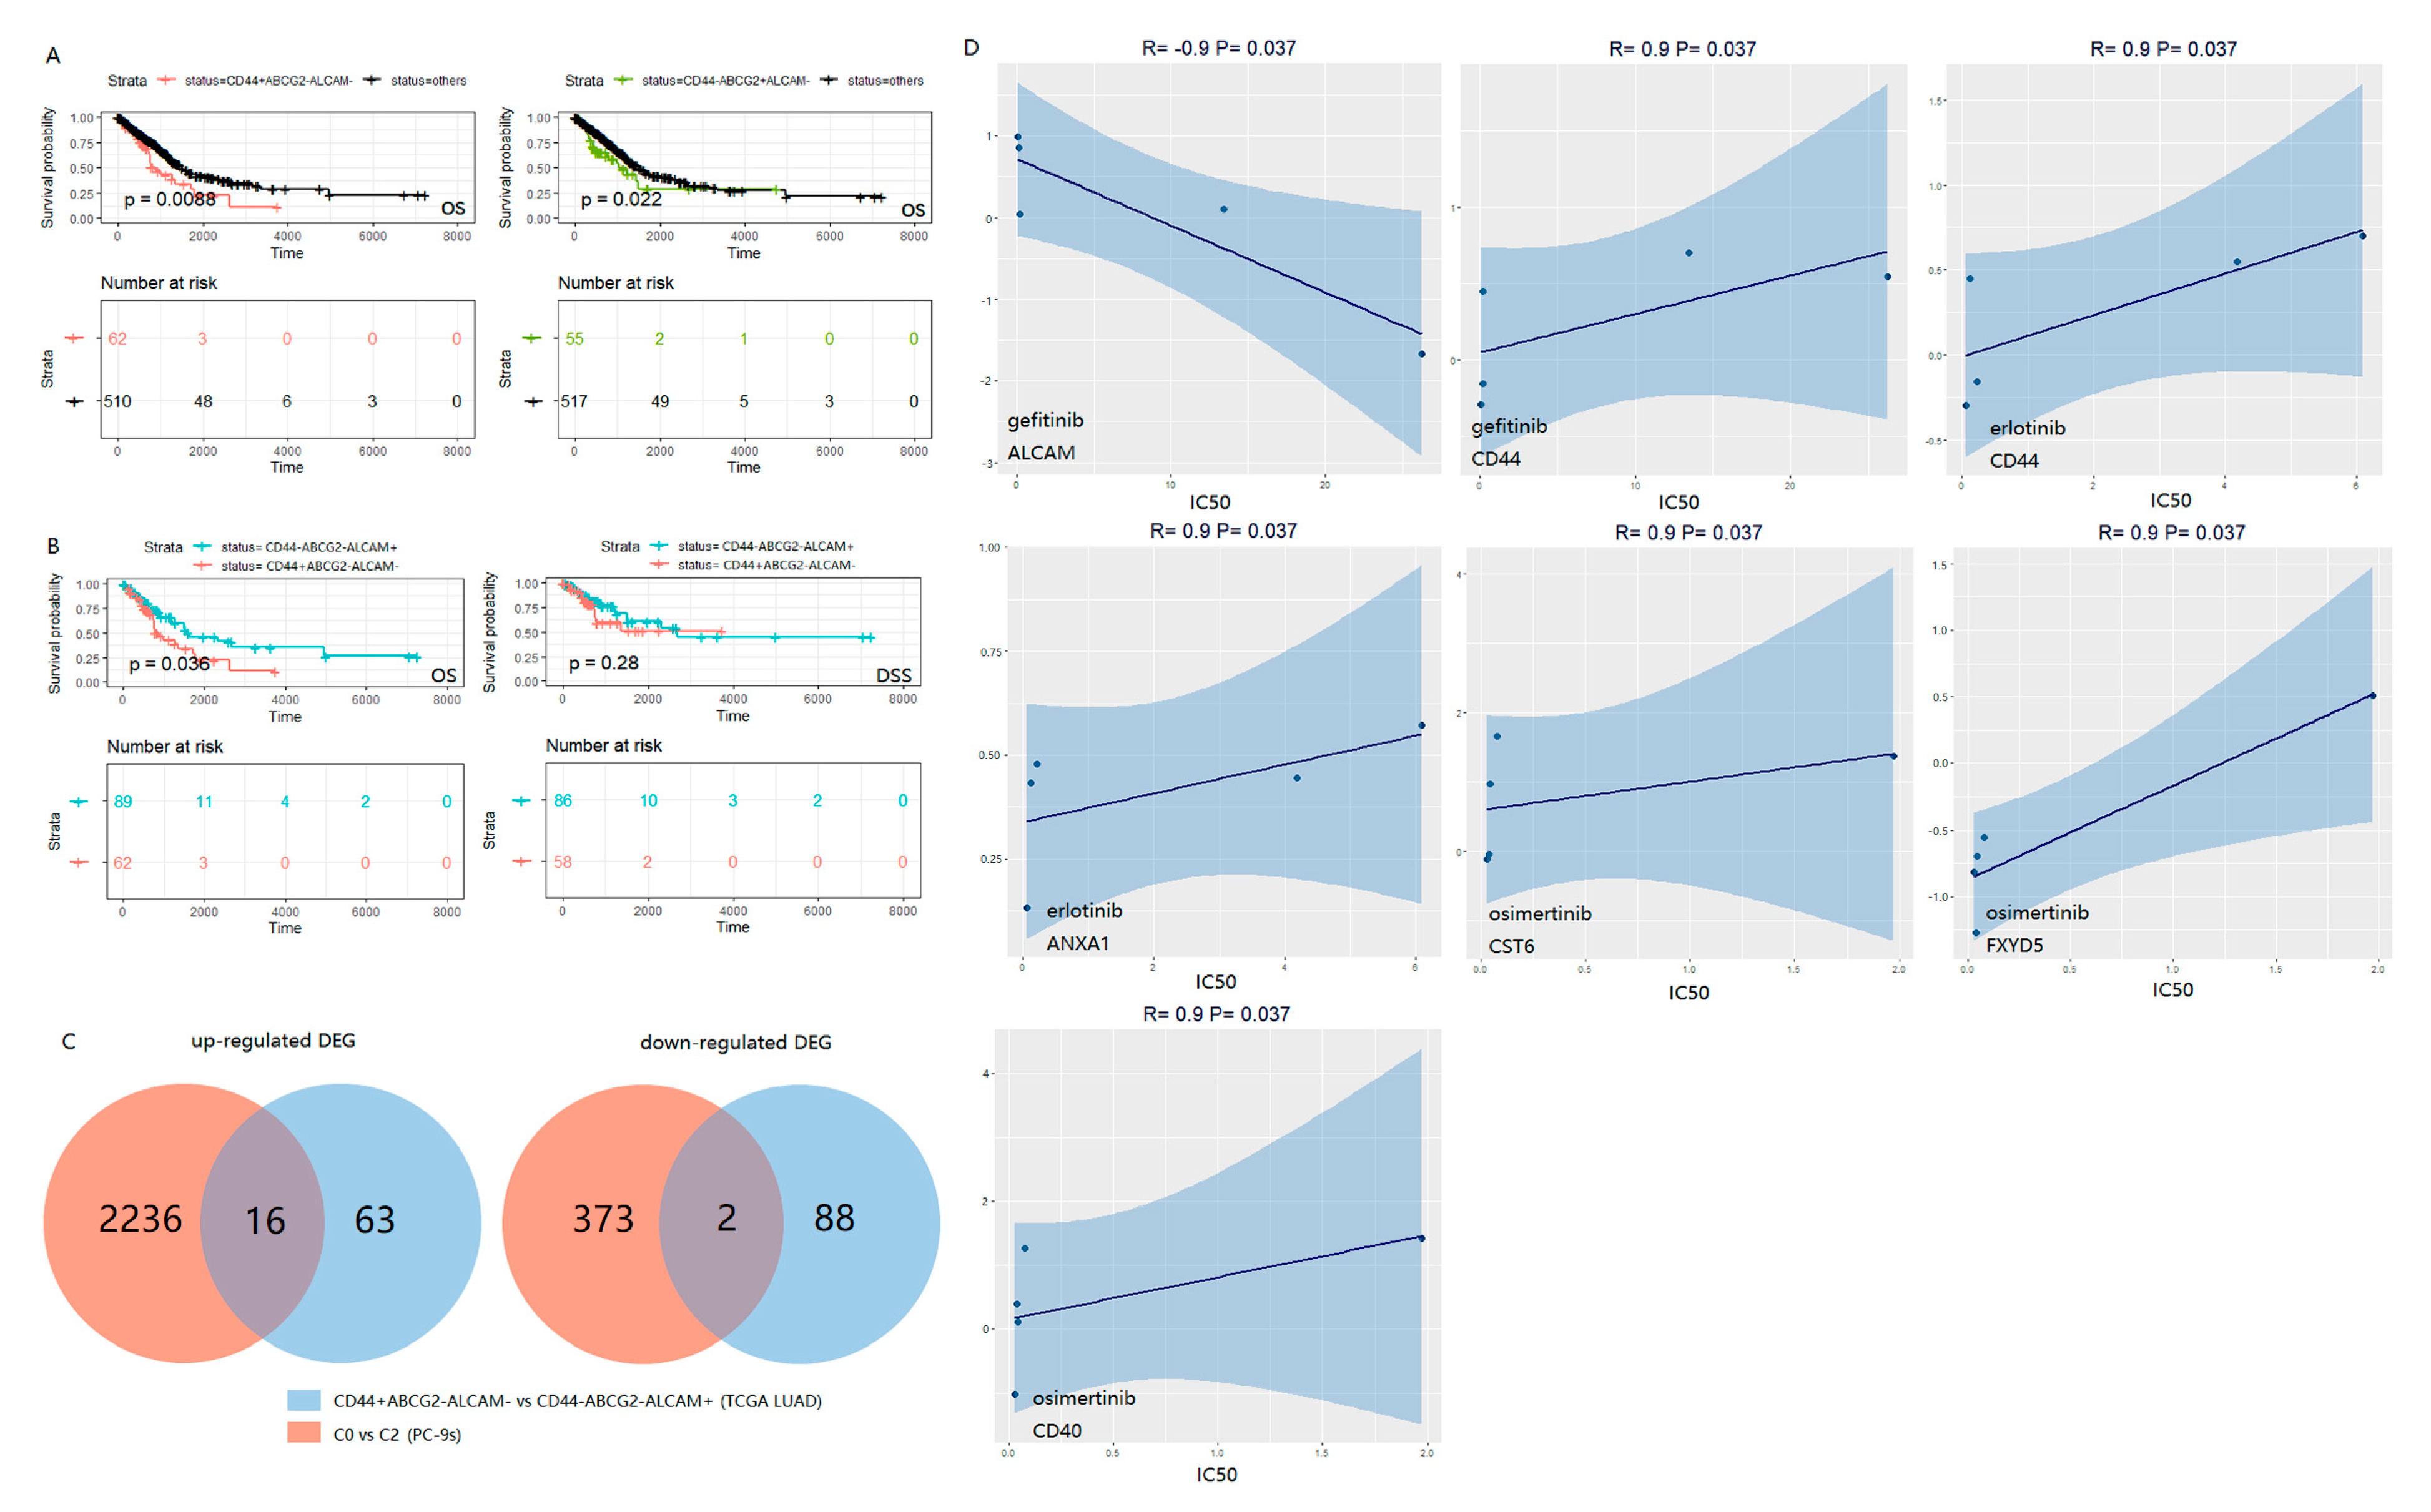
2.3. The Combination of CD44, ABCG2 and ALCAM Is Confirmed in the Clinical Prognosis of LUAD Patients
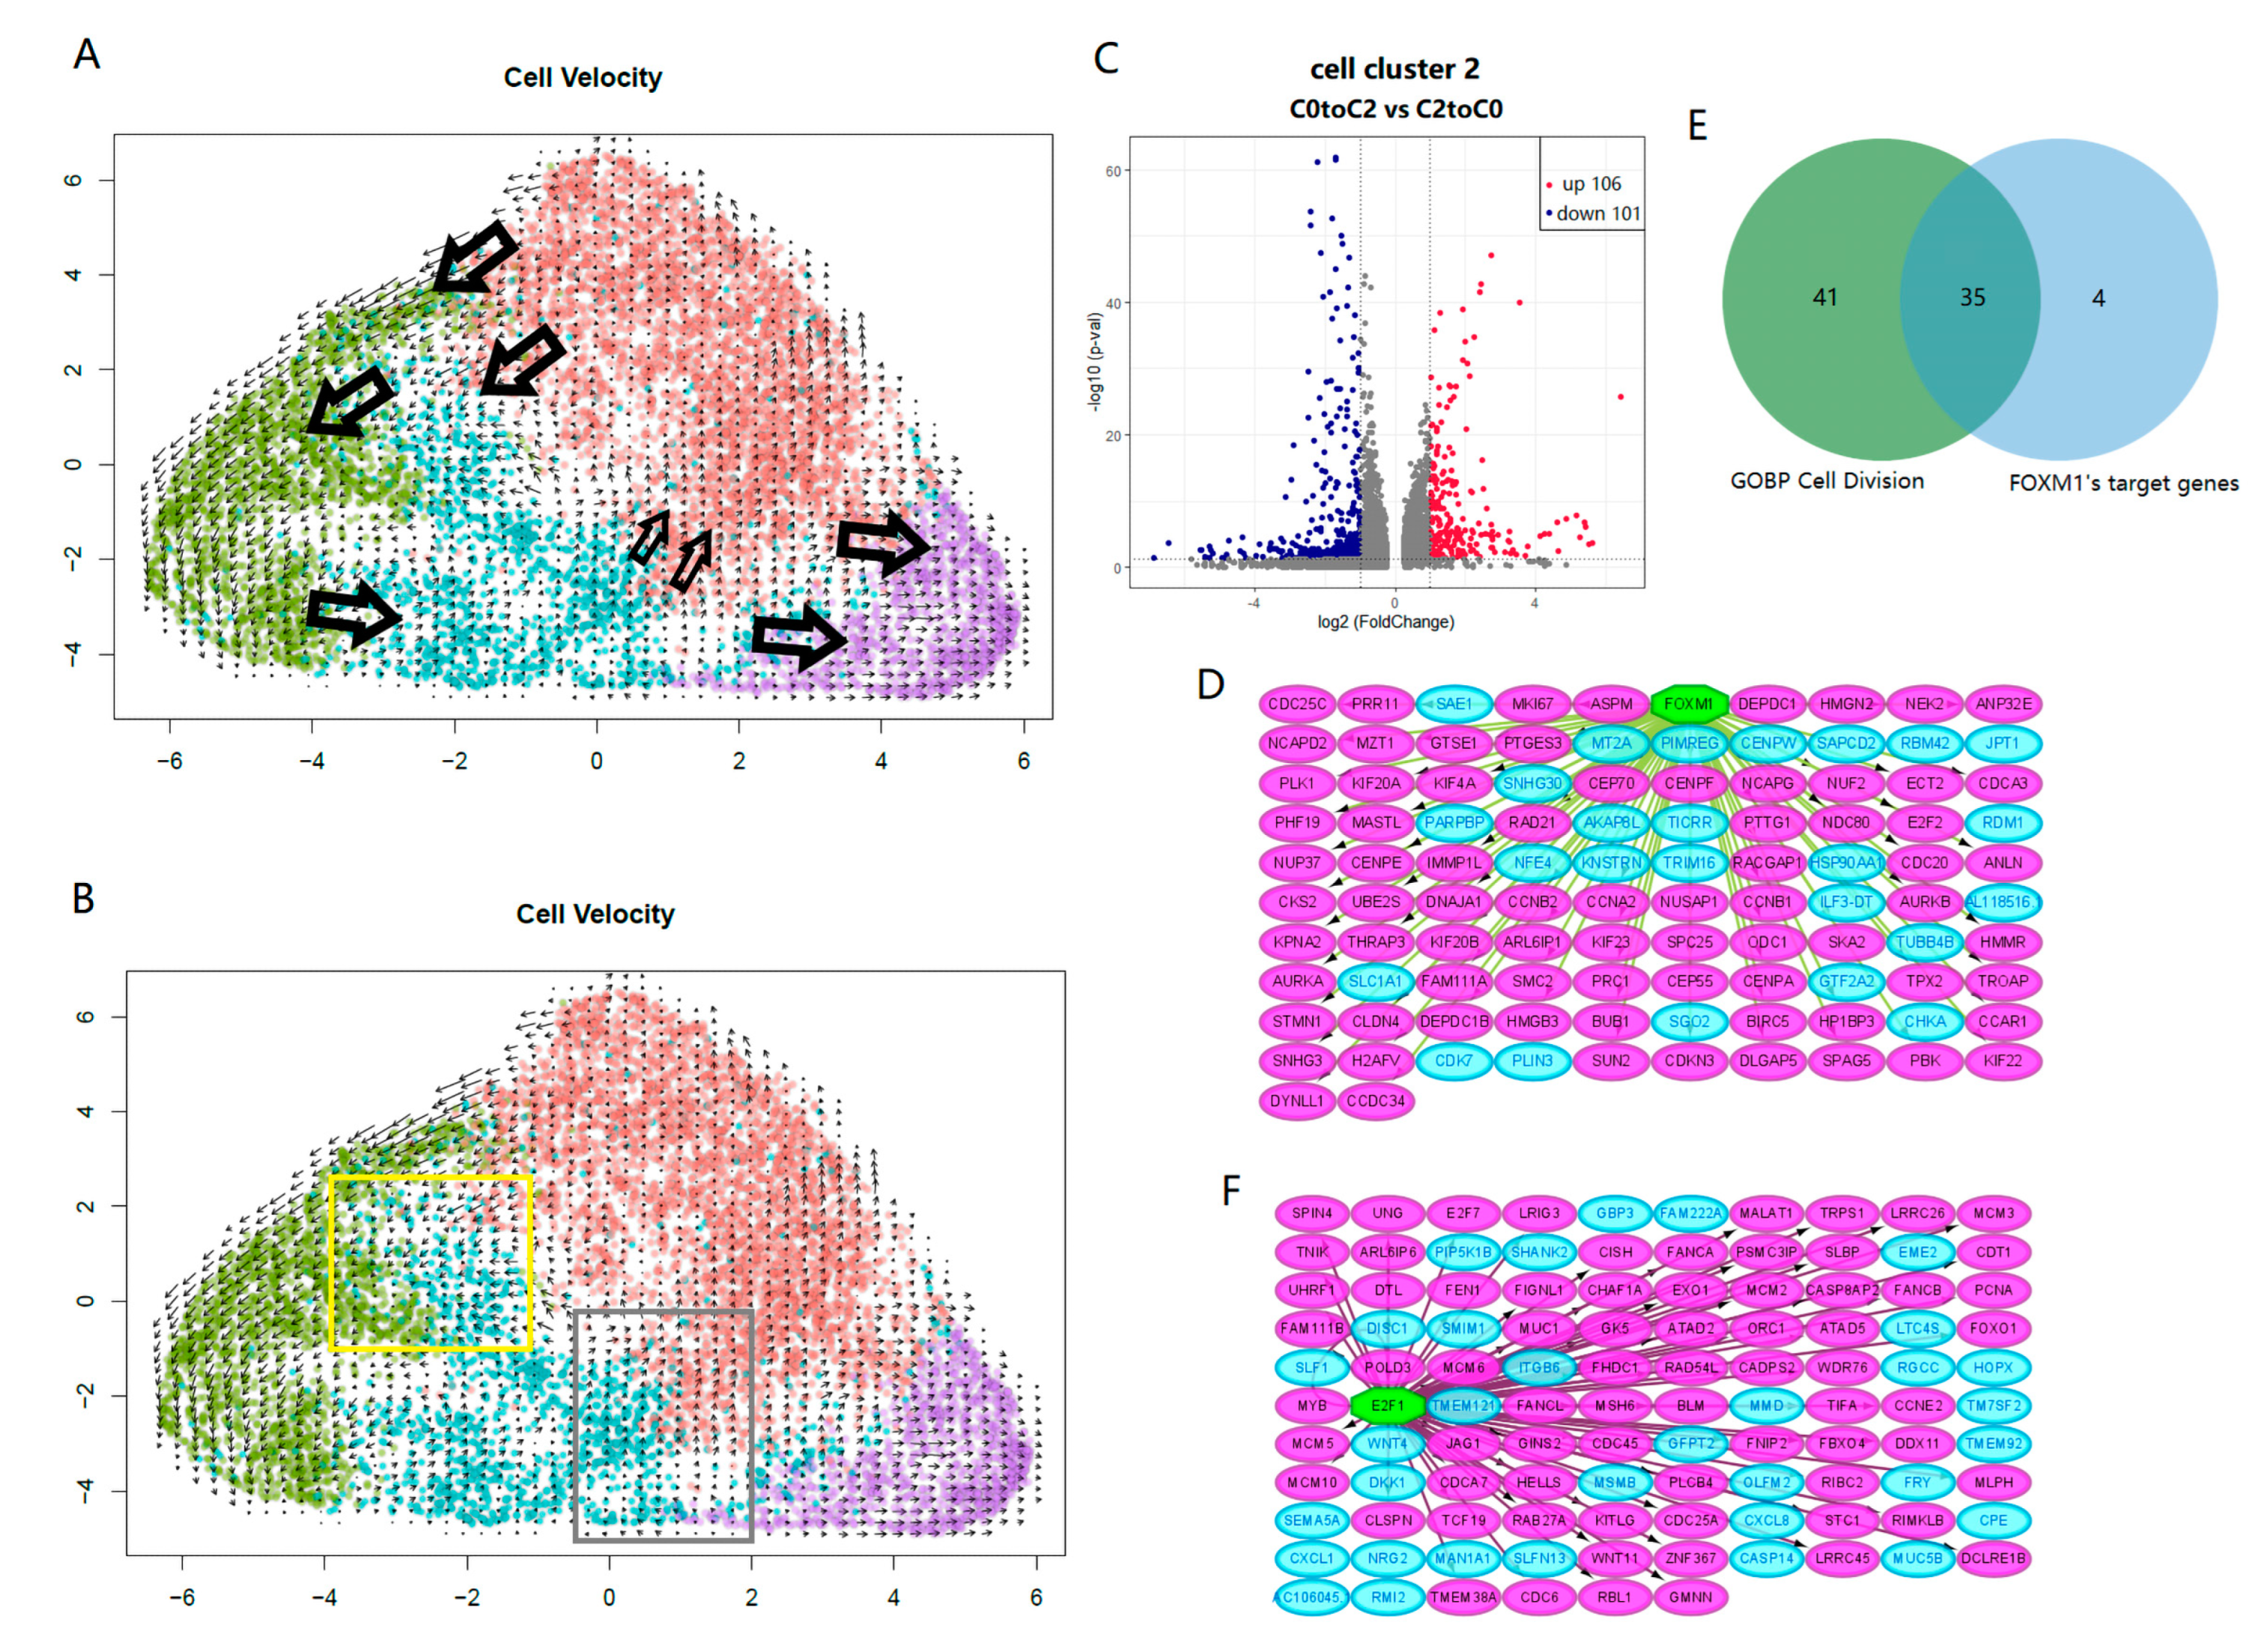
2.4. Key Switches Affecting the Differentiation and Dedifferentiation of Cancer Stem Cells
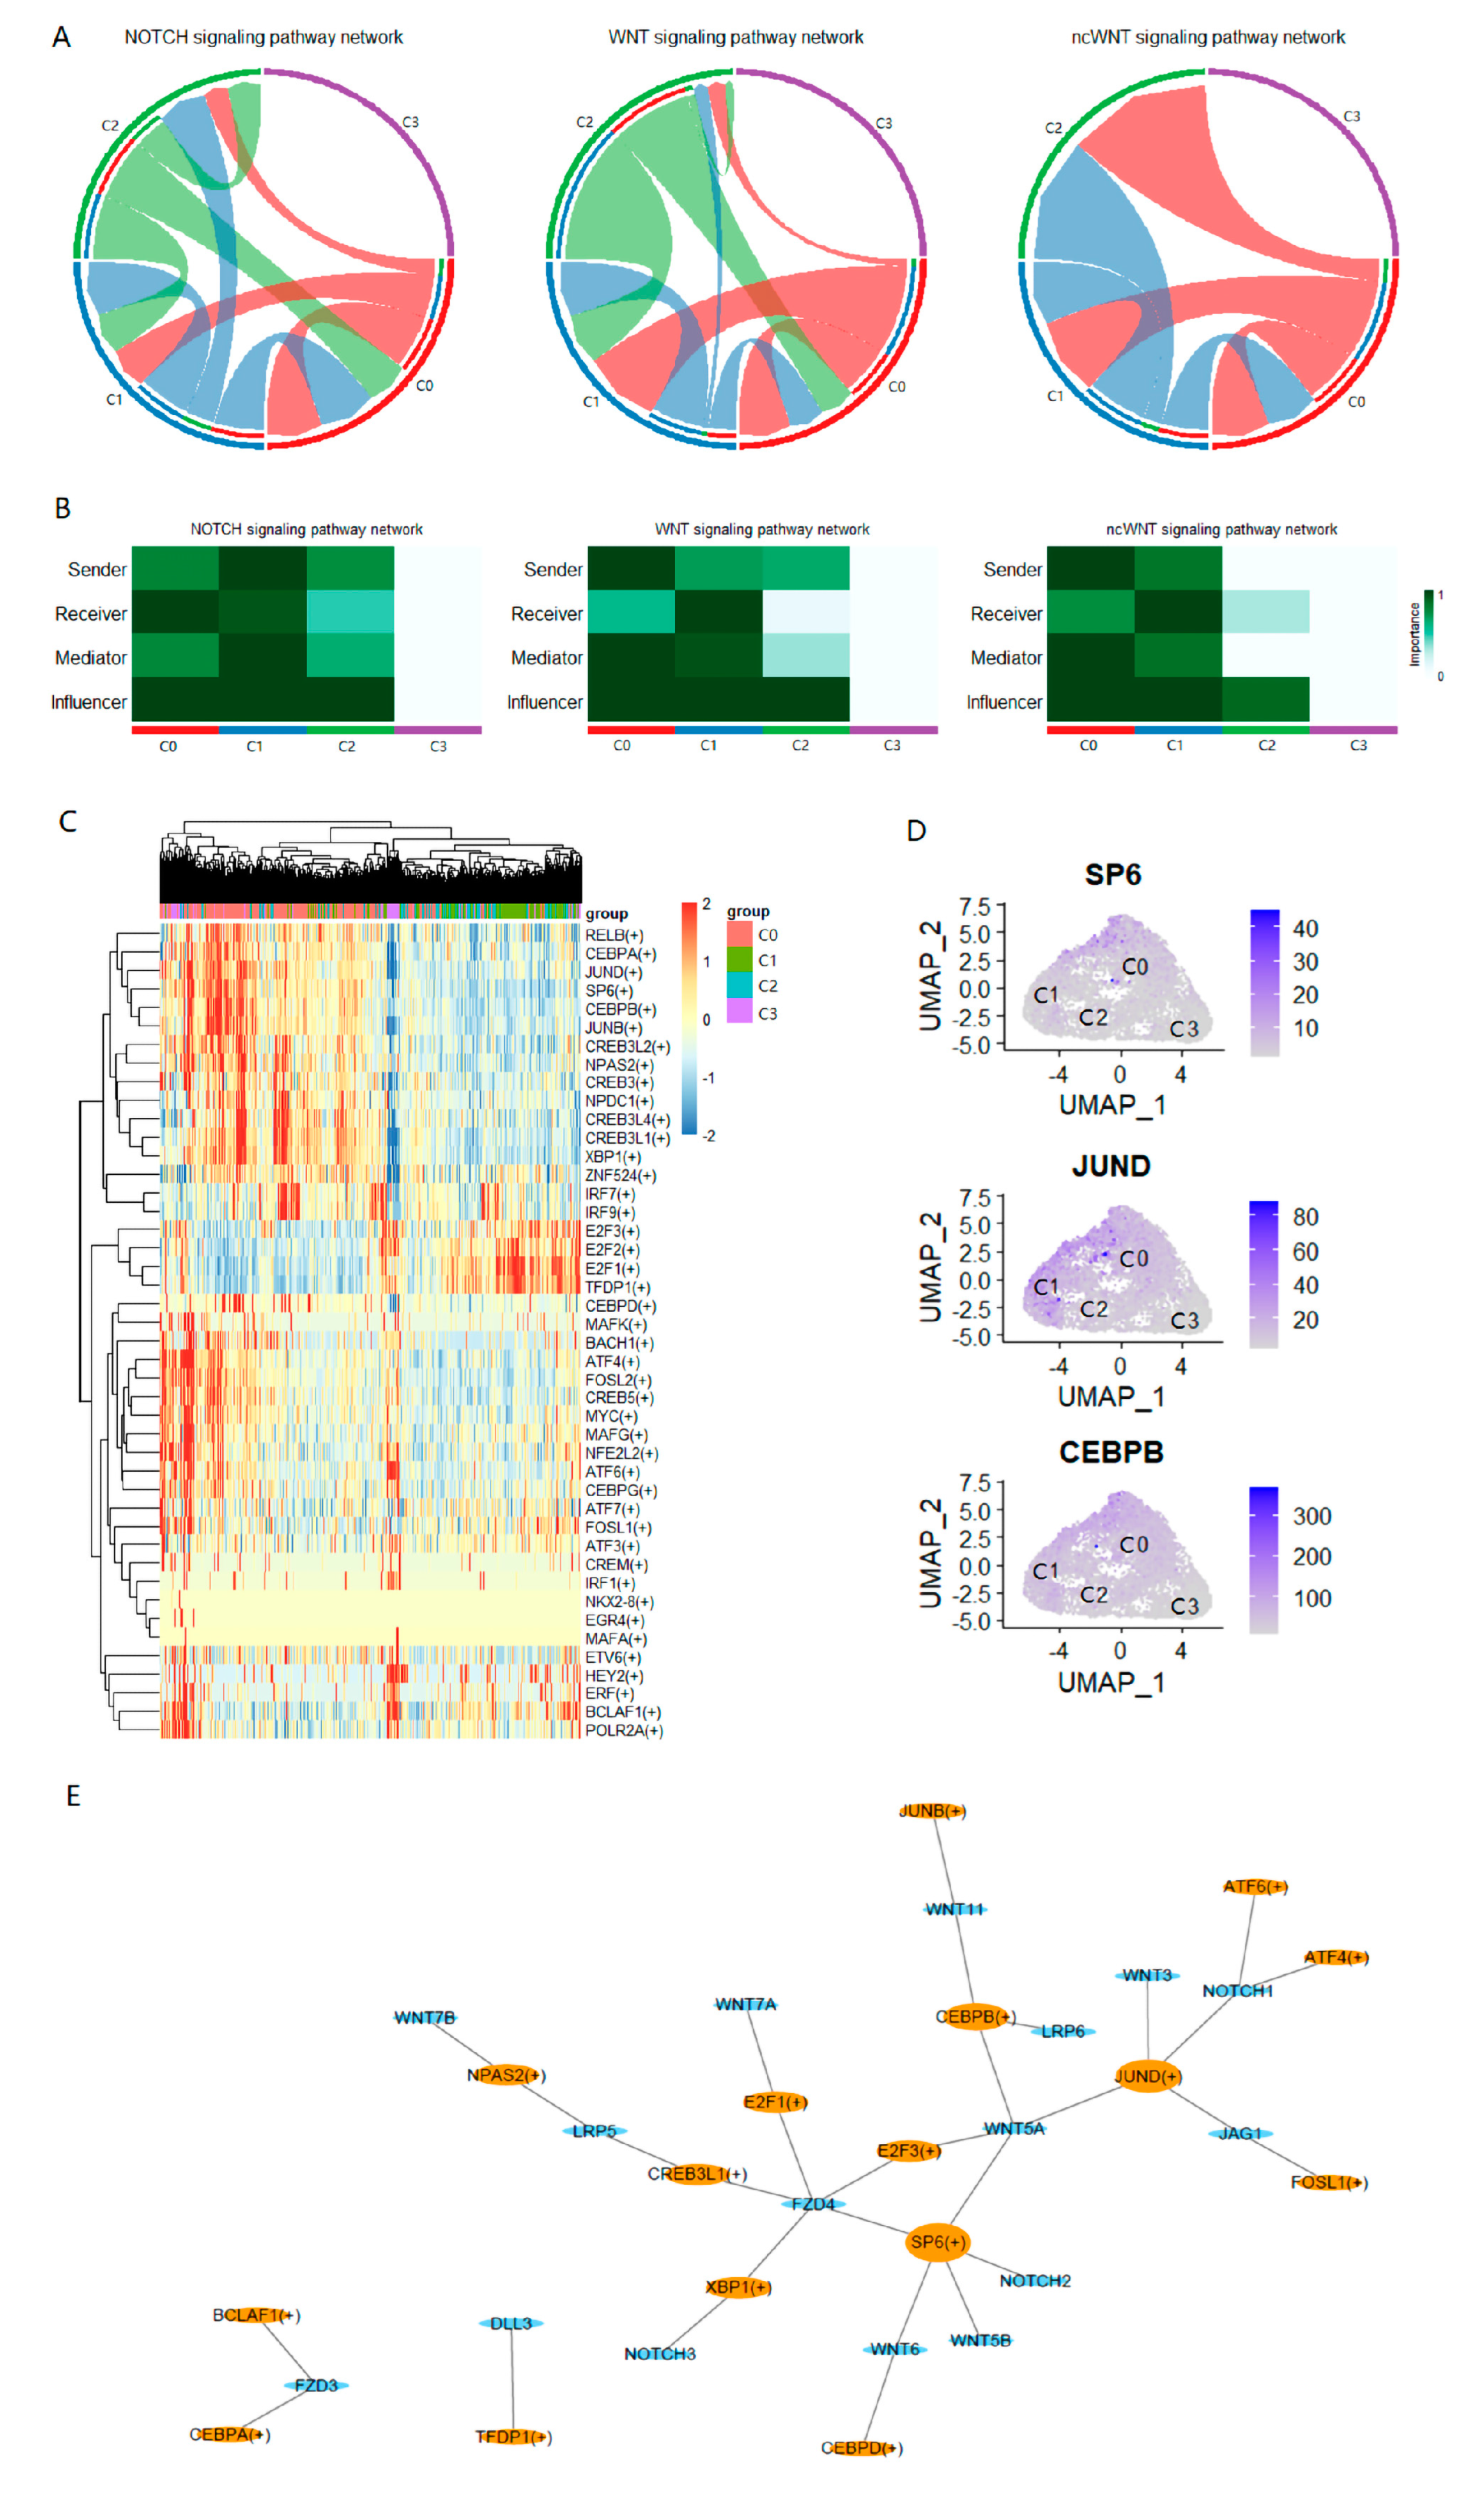
2.5. Intercellular Communication Analysis Reveals the Sociality within PC-9s Cells
3. Discussion
4. Materials and Methods
4.1. Serum-Free Cell Culture and Induced Differentiation of LUAD PC-9 Cells
4.2. Flow Cytometry and CCK8 Cytotoxicity Experiments
4.3. Animal Experiments and Tumor Specimens Collection
4.4. Bulk RNA Sequencing of PC-9 Cells and PC-9s Cells
4.5. Single-Cell RNA Sequencing of PC-9s Cells and Data Processing
4.6. Bulk RNA Sequencing Data of Lung Adenocarcinoma (LUAD) Patients
4.7. EGFR Mutant LUAD Cell Lines and Analyses of the Intersected DEGs of TCGA LUAD and PC-9s
4.8. Survival Analysis
4.9. Measuring the Stemness of PC-9 and PC-9s Cells by mRNAsi Scores
4.10. RNA Velocity
4.11. Transcription Factor Enrichment through iRegulon
4.12. Cell–Cell Communication
4.13. Identification of Key Transcription Factors in LCSCs
4.14. Gene Set Enrichment Analysis (GSEA)
4.15. Gene Set Variation Analysis (GSVA)
4.16. Statistical Analyses
5. Conclusions
Supplementary Materials
Author Contributions
Funding
Institutional Review Board Statement
Informed Consent Statement
Data Availability Statement
Acknowledgments
Conflicts of Interest
References
- Sung, H.; Ferlay, J.; Siegel, R.L.; Laversanne, M.; Soerjomataram, I.; Jemal, A.; Bray, F. Global Cancer Statistics 2020: GLOBOCAN Estimates of Incidence and Mortality Worldwide for 36 Cancers in 185 Countries. CA Cancer J. Clin. 2021, 71, 209–249. [Google Scholar] [CrossRef] [PubMed]
- Siegel, R.; Ma, J.; Zou, Z.; Jemal, A. Cancer statistics, 2014. CA Cancer J. Clin. 2014, 64, 9–29. [Google Scholar] [CrossRef] [PubMed]
- Barta, J.A.; Powell, C.A.; Wisnivesky, J.P. Global Epidemiology of Lung Cancer. Ann. Glob. Health 2019, 85, 8. [Google Scholar] [CrossRef] [PubMed]
- Hsia, T.C.; Liang, J.A.; Li, C.C.; Chien, C.R. Comparative effectiveness of concurrent chemoradiotherapy versus EGFR-tyrosine kinase inhibitors for the treatment of clinical stage IIIb lung adenocarcinoma patients with mutant EGFR. Thorac. Cancer 2018, 9, 1398–1405. [Google Scholar] [CrossRef]
- Yang, S.; Yu, X.; Fan, Y.; Shi, X.; Jin, Y. Clinicopathologic characteristics and survival outcome in patients with advanced lung adenocarcinoma and KRAS mutation. J. Cancer 2018, 9, 2930–2937. [Google Scholar] [CrossRef]
- Jao, K.; Tomasini, P.; Kamel-Reid, S.; Korpanty, G.J.; Mascaux, C.; Sakashita, S.; Labbe, C.; Leighl, N.B.; Liu, G.; Feld, R.; et al. The prognostic effect of single and multiple cancer-related somatic mutations in resected non-small-cell lung cancer. Lung Cancer 2018, 123, 22–29. [Google Scholar] [CrossRef]
- Woodard, G.A.; Jones, K.D.; Jablons, D.M. Lung Cancer Staging and Prognosis. Cancer Treat. Res. 2016, 170, 47–75. [Google Scholar] [CrossRef]
- Sosa Iglesias, V.; Giuranno, L.; Dubois, L.J.; Theys, J.; Vooijs, M. Drug Resistance in Non-Small Cell Lung Cancer: A Potential for NOTCH Targeting? Front. Oncol. 2018, 8, 267. [Google Scholar] [CrossRef]
- Popper, H.H. Progression and metastasis of lung cancer. Cancer Metastasis Rev. 2016, 35, 75–91. [Google Scholar] [CrossRef]
- Norouzi, S.; Gorgi Valokala, M.; Mosaffa, F.; Zirak, M.R.; Zamani, P.; Behravan, J. Crosstalk in cancer resistance and metastasis. Crit. Rev. Oncol. Hematol. 2018, 132, 145–153. [Google Scholar] [CrossRef]
- MacDonagh, L.; Gray, S.G.; Breen, E.; Cuffe, S.; Finn, S.P.; O’Byrne, K.J.; Barr, M.P. Lung cancer stem cells: The root of resistance. Cancer Lett. 2016, 372, 147–156. [Google Scholar] [CrossRef]
- Meacham, C.E.; Morrison, S.J. Tumour heterogeneity and cancer cell plasticity. Nature 2013, 501, 328–337. [Google Scholar] [CrossRef]
- Chen, W.J.; Ho, C.C.; Chang, Y.L.; Chen, H.Y.; Lin, C.A.; Ling, T.Y.; Yu, S.L.; Yuan, S.S.; Chen, Y.J.; Lin, C.Y.; et al. Cancer-associated fibroblasts regulate the plasticity of lung cancer stemness via paracrine signalling. Nat. Commun. 2014, 5, 3472. [Google Scholar] [CrossRef]
- Leung, E.L.; Fiscus, R.R.; Tung, J.W.; Tin, V.P.; Cheng, L.C.; Sihoe, A.D.; Fink, L.M.; Ma, Y.; Wong, M.P. Non-small cell lung cancer cells expressing CD44 are enriched for stem cell-like properties. PLoS ONE 2010, 5, e14062. [Google Scholar] [CrossRef]
- Salcido, C.D.; Larochelle, A.; Taylor, B.J.; Dunbar, C.E.; Varticovski, L. Molecular characterisation of side population cells with cancer stem cell-like characteristics in small-cell lung cancer. Br. J. Cancer 2010, 102, 1636–1644. [Google Scholar] [CrossRef]
- El-Ashmawy, N.E.; Salem, M.L.; Abd El-Fattah, E.E.; Khedr, E.G. Targeting CD166(+) lung cancer stem cells: Molecular study using murine dendritic cell vaccine. Toxicol. Appl. Pharmacol. 2021, 429, 115699. [Google Scholar] [CrossRef]
- Yang, L.; Shi, P.; Zhao, G.; Xu, J.; Peng, W.; Zhang, J.; Zhang, G.; Wang, X.; Dong, Z.; Chen, F.; et al. Targeting cancer stem cell pathways for cancer therapy. Signal Transduct. Target. Ther. 2020, 5, 8. [Google Scholar] [CrossRef]
- Choi, B.R.; Cave, C.; Na, C.H.; Sockanathan, S. GDE2-Dependent Activation of Canonical Wnt Signaling in Neurons Regulates Oligodendrocyte Maturation. Cell Rep. 2020, 31, 107540. [Google Scholar] [CrossRef]
- Soleas, J.P.; D’Arcangelo, E.; Huang, L.; Karoubi, G.; Nostro, M.C.; McGuigan, A.P.; Waddell, T.K. Assembly of lung progenitors into developmentally-inspired geometry drives differentiation via cellular tension. Biomaterials 2020, 254, 120128. [Google Scholar] [CrossRef]
- Zheng, H.; Ying, H.; Yan, H.; Kimmelman, A.C.; Hiller, D.J.; Chen, A.J.; Perry, S.R.; Tonon, G.; Chu, G.C.; Ding, Z.; et al. p53 and Pten control neural and glioma stem/progenitor cell renewal and differentiation. Nature 2008, 455, 1129–1133. [Google Scholar] [CrossRef]
- Peacock, C.D.; Wang, Q.; Gesell, G.S.; Corcoran-Schwartz, I.M.; Jones, E.; Kim, J.; Devereux, W.L.; Rhodes, J.T.; Huff, C.A.; Beachy, P.A.; et al. Hedgehog signaling maintains a tumor stem cell compartment in multiple myeloma. Proc. Natl. Acad. Sci. USA 2007, 104, 4048–4053. [Google Scholar] [CrossRef] [PubMed]
- Testa, U.; Castelli, G.; Pelosi, E. Lung Cancers: Molecular Characterization, Clonal Heterogeneity and Evolution, and Cancer Stem Cells. Cancers 2018, 10, 248. [Google Scholar] [CrossRef] [PubMed]
- Liu, N.; Yang, R.; Shi, Y.; Chen, L.; Liu, Y.; Wang, Z.; Liu, S.; Ouyang, L.; Wang, H.; Lai, W.; et al. The cross-talk between methylation and phosphorylation in lymphoid-specific helicase drives cancer stem-like properties. Signal Transduct. Target. Ther. 2020, 5, 197. [Google Scholar] [CrossRef] [PubMed]
- Yang, W.; Soares, J.; Greninger, P.; Edelman, E.J.; Lightfoot, H.; Forbes, S.; Bindal, N.; Beare, D.; Smith, J.A.; Thompson, I.R.; et al. Genomics of Drug Sensitivity in Cancer (GDSC): A resource for therapeutic biomarker discovery in cancer cells. Nucleic Acids Res. 2013, 41, D955–D961. [Google Scholar] [CrossRef]
- Gemenetzidis, E.; Elena-Costea, D.; Parkinson, E.K.; Waseem, A.; Wan, H.; Teh, M.T. Induction of human epithelial stem/progenitor expansion by FOXM1. Cancer Res. 2010, 70, 9515–9526. [Google Scholar] [CrossRef]
- Bao, B.; Wang, Z.; Ali, S.; Kong, D.; Banerjee, S.; Ahmad, A.; Li, Y.; Azmi, A.S.; Miele, L.; Sarkar, F.H. Over-expression of FoxM1 leads to epithelial-mesenchymal transition and cancer stem cell phenotype in pancreatic cancer cells. J. Cell Biochem. 2011, 112, 2296–2306. [Google Scholar] [CrossRef]
- Nilsson, M.B.; Sun, H.; Robichaux, J.; Pfeifer, M.; McDermott, U.; Travers, J.; Diao, L.; Xi, Y.; Tong, P.; Shen, L.; et al. A YAP/FOXM1 axis mediates EMT-associated EGFR inhibitor resistance and increased expression of spindle assembly checkpoint components. Sci. Transl. Med. 2020, 12, eaaz4589. [Google Scholar] [CrossRef]
- Takebe, N.; Harris, P.J.; Warren, R.Q.; Ivy, S.P. Targeting cancer stem cells by inhibiting Wnt, Notch, and Hedgehog pathways. Nat. Rev. Clin. Oncol. 2011, 8, 97–106. [Google Scholar] [CrossRef]
- Nakamura, T.; de Vega, S.; Fukumoto, S.; Jimenez, L.; Unda, F.; Yamada, Y. Transcription factor epiprofin is essential for tooth morphogenesis by regulating epithelial cell fate and tooth number. J. Biol. Chem. 2008, 283, 4825–4833. [Google Scholar] [CrossRef]
- Short, J.D.; Pfarr, C.M. Translational regulation of the JunD messenger RNA. J. Biol. Chem. 2002, 277, 32697–32705. [Google Scholar] [CrossRef]
- Liu, D.; Xue, P. Existence of independent C/EBPbeta 3′-UTR RNA in human tissues. Acta Biochim. Biophys. Sin. 2014, 46, 76–77. [Google Scholar] [CrossRef] [PubMed][Green Version]
- Bonzheim, I.; Irmler, M.; Klier-Richter, M.; Steinhilber, J.; Anastasov, N.; Schafer, S.; Adam, P.; Beckers, J.; Raffeld, M.; Fend, F.; et al. Identification of C/EBPbeta target genes in ALK+ anaplastic large cell lymphoma (ALCL) by gene expression profiling and chromatin immunoprecipitation. PLoS ONE 2013, 8, e64544. [Google Scholar] [CrossRef] [PubMed]
- Okazaki, K.; Anzawa, H.; Katsuoka, F.; Kinoshita, K.; Sekine, H.; Motohashi, H. CEBPB is required for NRF2-mediated drug resistance in NRF2-activated non-small cell lung cancer cells. J. Biochem. 2022, 171, 567–578. [Google Scholar] [CrossRef] [PubMed]
- Alizadeh, A.A.; Aranda, V.; Bardelli, A.; Blanpain, C.; Bock, C.; Borowski, C.; Caldas, C.; Califano, A.; Doherty, M.; Elsner, M.; et al. Toward understanding and exploiting tumor heterogeneity. Nat. Med. 2015, 21, 846–853. [Google Scholar] [CrossRef]
- Wang, C.Y.; Huang, C.S.; Yang, Y.P.; Liu, C.Y.; Liu, Y.Y.; Wu, W.W.; Lu, K.H.; Chen, K.H.; Chang, Y.L.; Lee, S.D.; et al. The subpopulation of CD44-positive cells promoted tumorigenicity and metastatic ability in lung adenocarcinoma. J. Chin. Med. Assoc. 2019, 82, 196–201. [Google Scholar] [CrossRef]
- Hassn Mesrati, M.; Syafruddin, S.E.; Mohtar, M.A.; Syahir, A. CD44: A Multifunctional Mediator of Cancer Progression. Biomolecules 2021, 11, 1850. [Google Scholar] [CrossRef] [PubMed]
- Wei, H.; Liang, F.; Cheng, W.; Zhou, R.; Wu, X.; Feng, Y.; Wang, Y. The mechanisms for lung cancer risk of PM2.5: Induction of epithelial-mesenchymal transition and cancer stem cell properties in human non-small cell lung cancer cells. Environ. Toxicol. 2017, 32, 2341–2351. [Google Scholar] [CrossRef]
- Xu, H.; Niu, M.; Yuan, X.; Wu, K.; Liu, A. CD44 as a tumor biomarker and therapeutic target. Exp. Hematol. Oncol. 2020, 9, 36. [Google Scholar] [CrossRef]
- Chen, L.S.; Wang, A.X.; Dong, B.; Pu, K.F.; Yuan, L.H.; Zhu, Y.M. A new prospect in cancer therapy: Targeting cancer stem cells to eradicate cancer. Chin. J. Cancer 2012, 31, 564–572. [Google Scholar] [CrossRef]
- Dean, M.; Fojo, T.; Bates, S. Tumour stem cells and drug resistance. Nat. Rev. Cancer 2005, 5, 275–284. [Google Scholar] [CrossRef]
- Zhang, W.C.; Shyh-Chang, N.; Yang, H.; Rai, A.; Umashankar, S.; Ma, S.; Soh, B.S.; Sun, L.L.; Tai, B.C.; Nga, M.E.; et al. Glycine decarboxylase activity drives non-small cell lung cancer tumor-initiating cells and tumorigenesis. Cell 2012, 148, 259–272. [Google Scholar] [CrossRef]
- Ishiguro, F.; Murakami, H.; Mizuno, T.; Fujii, M.; Kondo, Y.; Usami, N.; Taniguchi, T.; Yokoi, K.; Osada, H.; Sekido, Y. Membranous expression of activated leukocyte cell adhesion molecule contributes to poor prognosis and malignant phenotypes of non-small-cell lung cancer. J. Surg. Res. 2013, 179, 24–32. [Google Scholar] [CrossRef]
- Tachezy, M.; Zander, H.; Wolters-Eisfeld, G.; Muller, J.; Wicklein, D.; Gebauer, F.; Izbicki, J.R.; Bockhorn, M. Activated leukocyte cell adhesion molecule (CD166): An “inert” cancer stem cell marker for non-small cell lung cancer? Stem Cells 2014, 32, 1429–1436. [Google Scholar] [CrossRef] [PubMed]
- Alimperti, S.; Lei, P.; Wen, Y.; Tian, J.; Campbell, A.M.; Andreadis, S.T. Serum-free spheroid suspension culture maintains mesenchymal stem cell proliferation and differentiation potential. Biotechnol. Prog. 2014, 30, 974–983. [Google Scholar] [CrossRef] [PubMed]
- Hao, Y.; Hao, S.; Andersen-Nissen, E.; Mauck, W.M., 3rd; Zheng, S.; Butler, A.; Lee, M.J.; Wilk, A.J.; Darby, C.; Zager, M.; et al. Integrated analysis of multimodal single-cell data. Cell 2021, 184, 3573–3587.e3529. [Google Scholar] [CrossRef] [PubMed]
- Hardoon, D.R.; Szedmak, S.; Shawe-Taylor, J. Canonical correlation analysis: An overview with application to learning methods. Neural Comput. 2004, 16, 2639–2664. [Google Scholar] [CrossRef]
- Goldman, M.J.; Craft, B.; Hastie, M.; Repecka, K.; McDade, F.; Kamath, A.; Banerjee, A.; Luo, Y.; Rogers, D.; Brooks, A.N.; et al. Visualizing and interpreting cancer genomics data via the Xena platform. Nat. Biotechnol. 2020, 38, 675–678. [Google Scholar] [CrossRef]
- Tang, Z.; Li, C.; Kang, B.; Gao, G.; Li, C.; Zhang, Z. GEPIA: A web server for cancer and normal gene expression profiling and interactive analyses. Nucleic Acids Res. 2017, 45, W98–W102. [Google Scholar] [CrossRef]
- Malta, T.M.; Sokolov, A.; Gentles, A.J.; Burzykowski, T.; Poisson, L.; Weinstein, J.N.; Kaminska, B.; Huelsken, J.; Omberg, L.; Gevaert, O.; et al. Machine Learning Identifies Stemness Features Associated with Oncogenic Dedifferentiation. Cell 2018, 173, 338–354.e315. [Google Scholar] [CrossRef]
- La Manno, G.; Soldatov, R.; Zeisel, A.; Braun, E.; Hochgerner, H.; Petukhov, V.; Lidschreiber, K.; Kastriti, M.E.; Lonnerberg, P.; Furlan, A.; et al. RNA velocity of single cells. Nature 2018, 560, 494–498. [Google Scholar] [CrossRef]
- Jin, S.; Guerrero-Juarez, C.F.; Zhang, L.; Chang, I.; Ramos, R.; Kuan, C.H.; Myung, P.; Plikus, M.V.; Nie, Q. Inference and analysis of cell-cell communication using CellChat. Nat. Commun. 2021, 12, 1088. [Google Scholar] [CrossRef]
- Aibar, S.; Gonzalez-Blas, C.B.; Moerman, T.; Huynh-Thu, V.A.; Imrichova, H.; Hulselmans, G.; Rambow, F.; Marine, J.C.; Geurts, P.; Aerts, J.; et al. SCENIC: Single-cell regulatory network inference and clustering. Nat. Methods 2017, 14, 1083–1086. [Google Scholar] [CrossRef]
- Lin, W.W.; Xu, L.T.; Chen, Y.S.; Go, K.; Sun, C.; Zhu, Y.J. Single-Cell Transcriptomics-Based Study of Transcriptional Regulatory Features in the Mouse Brain Vasculature. Biomed. Res. Int. 2021, 2021, 7643209. [Google Scholar] [CrossRef]
- Subramanian, A.; Tamayo, P.; Mootha, V.K.; Mukherjee, S.; Ebert, B.L.; Gillette, M.A.; Paulovich, A.; Pomeroy, S.L.; Golub, T.R.; Lander, E.S.; et al. Gene set enrichment analysis: A knowledge-based approach for interpreting genome-wide expression profiles. Proc. Natl. Acad. Sci. USA 2005, 102, 15545–15550. [Google Scholar] [CrossRef]
- Hanzelmann, S.; Castelo, R.; Guinney, J. GSVA: Gene set variation analysis for microarray and RNA-seq data. BMC Bioinform. 2013, 14, 7. [Google Scholar] [CrossRef]


Disclaimer/Publisher’s Note: The statements, opinions and data contained in all publications are solely those of the individual author(s) and contributor(s) and not of MDPI and/or the editor(s). MDPI and/or the editor(s) disclaim responsibility for any injury to people or property resulting from any ideas, methods, instructions or products referred to in the content. |
© 2022 by the authors. Licensee MDPI, Basel, Switzerland. This article is an open access article distributed under the terms and conditions of the Creative Commons Attribution (CC BY) license (https://creativecommons.org/licenses/by/4.0/).
Share and Cite
Pan, Z.; Zhang, M.; Zhang, F.; Pan, H.; Li, Y.; Shao, Y.; Yuan, X.; Wang, J.; Chen, J. Single-Cell Transcriptomics Unveils the Dedifferentiation Mechanism of Lung Adenocarcinoma Stem Cells. Int. J. Mol. Sci. 2023, 24, 482. https://doi.org/10.3390/ijms24010482
Pan Z, Zhang M, Zhang F, Pan H, Li Y, Shao Y, Yuan X, Wang J, Chen J. Single-Cell Transcriptomics Unveils the Dedifferentiation Mechanism of Lung Adenocarcinoma Stem Cells. International Journal of Molecular Sciences. 2023; 24(1):482. https://doi.org/10.3390/ijms24010482
Chicago/Turabian StylePan, Zhenhua, Meidi Zhang, Fengyu Zhang, Hongli Pan, Yongwen Li, Yi Shao, Xin Yuan, Ju Wang, and Jun Chen. 2023. "Single-Cell Transcriptomics Unveils the Dedifferentiation Mechanism of Lung Adenocarcinoma Stem Cells" International Journal of Molecular Sciences 24, no. 1: 482. https://doi.org/10.3390/ijms24010482
APA StylePan, Z., Zhang, M., Zhang, F., Pan, H., Li, Y., Shao, Y., Yuan, X., Wang, J., & Chen, J. (2023). Single-Cell Transcriptomics Unveils the Dedifferentiation Mechanism of Lung Adenocarcinoma Stem Cells. International Journal of Molecular Sciences, 24(1), 482. https://doi.org/10.3390/ijms24010482