
Inactivation of PTEN and ZFHX3 in Mammary Epithelial Cells Alters Patterns of Collective Cell Migration
 , , , ,
  , and
, and 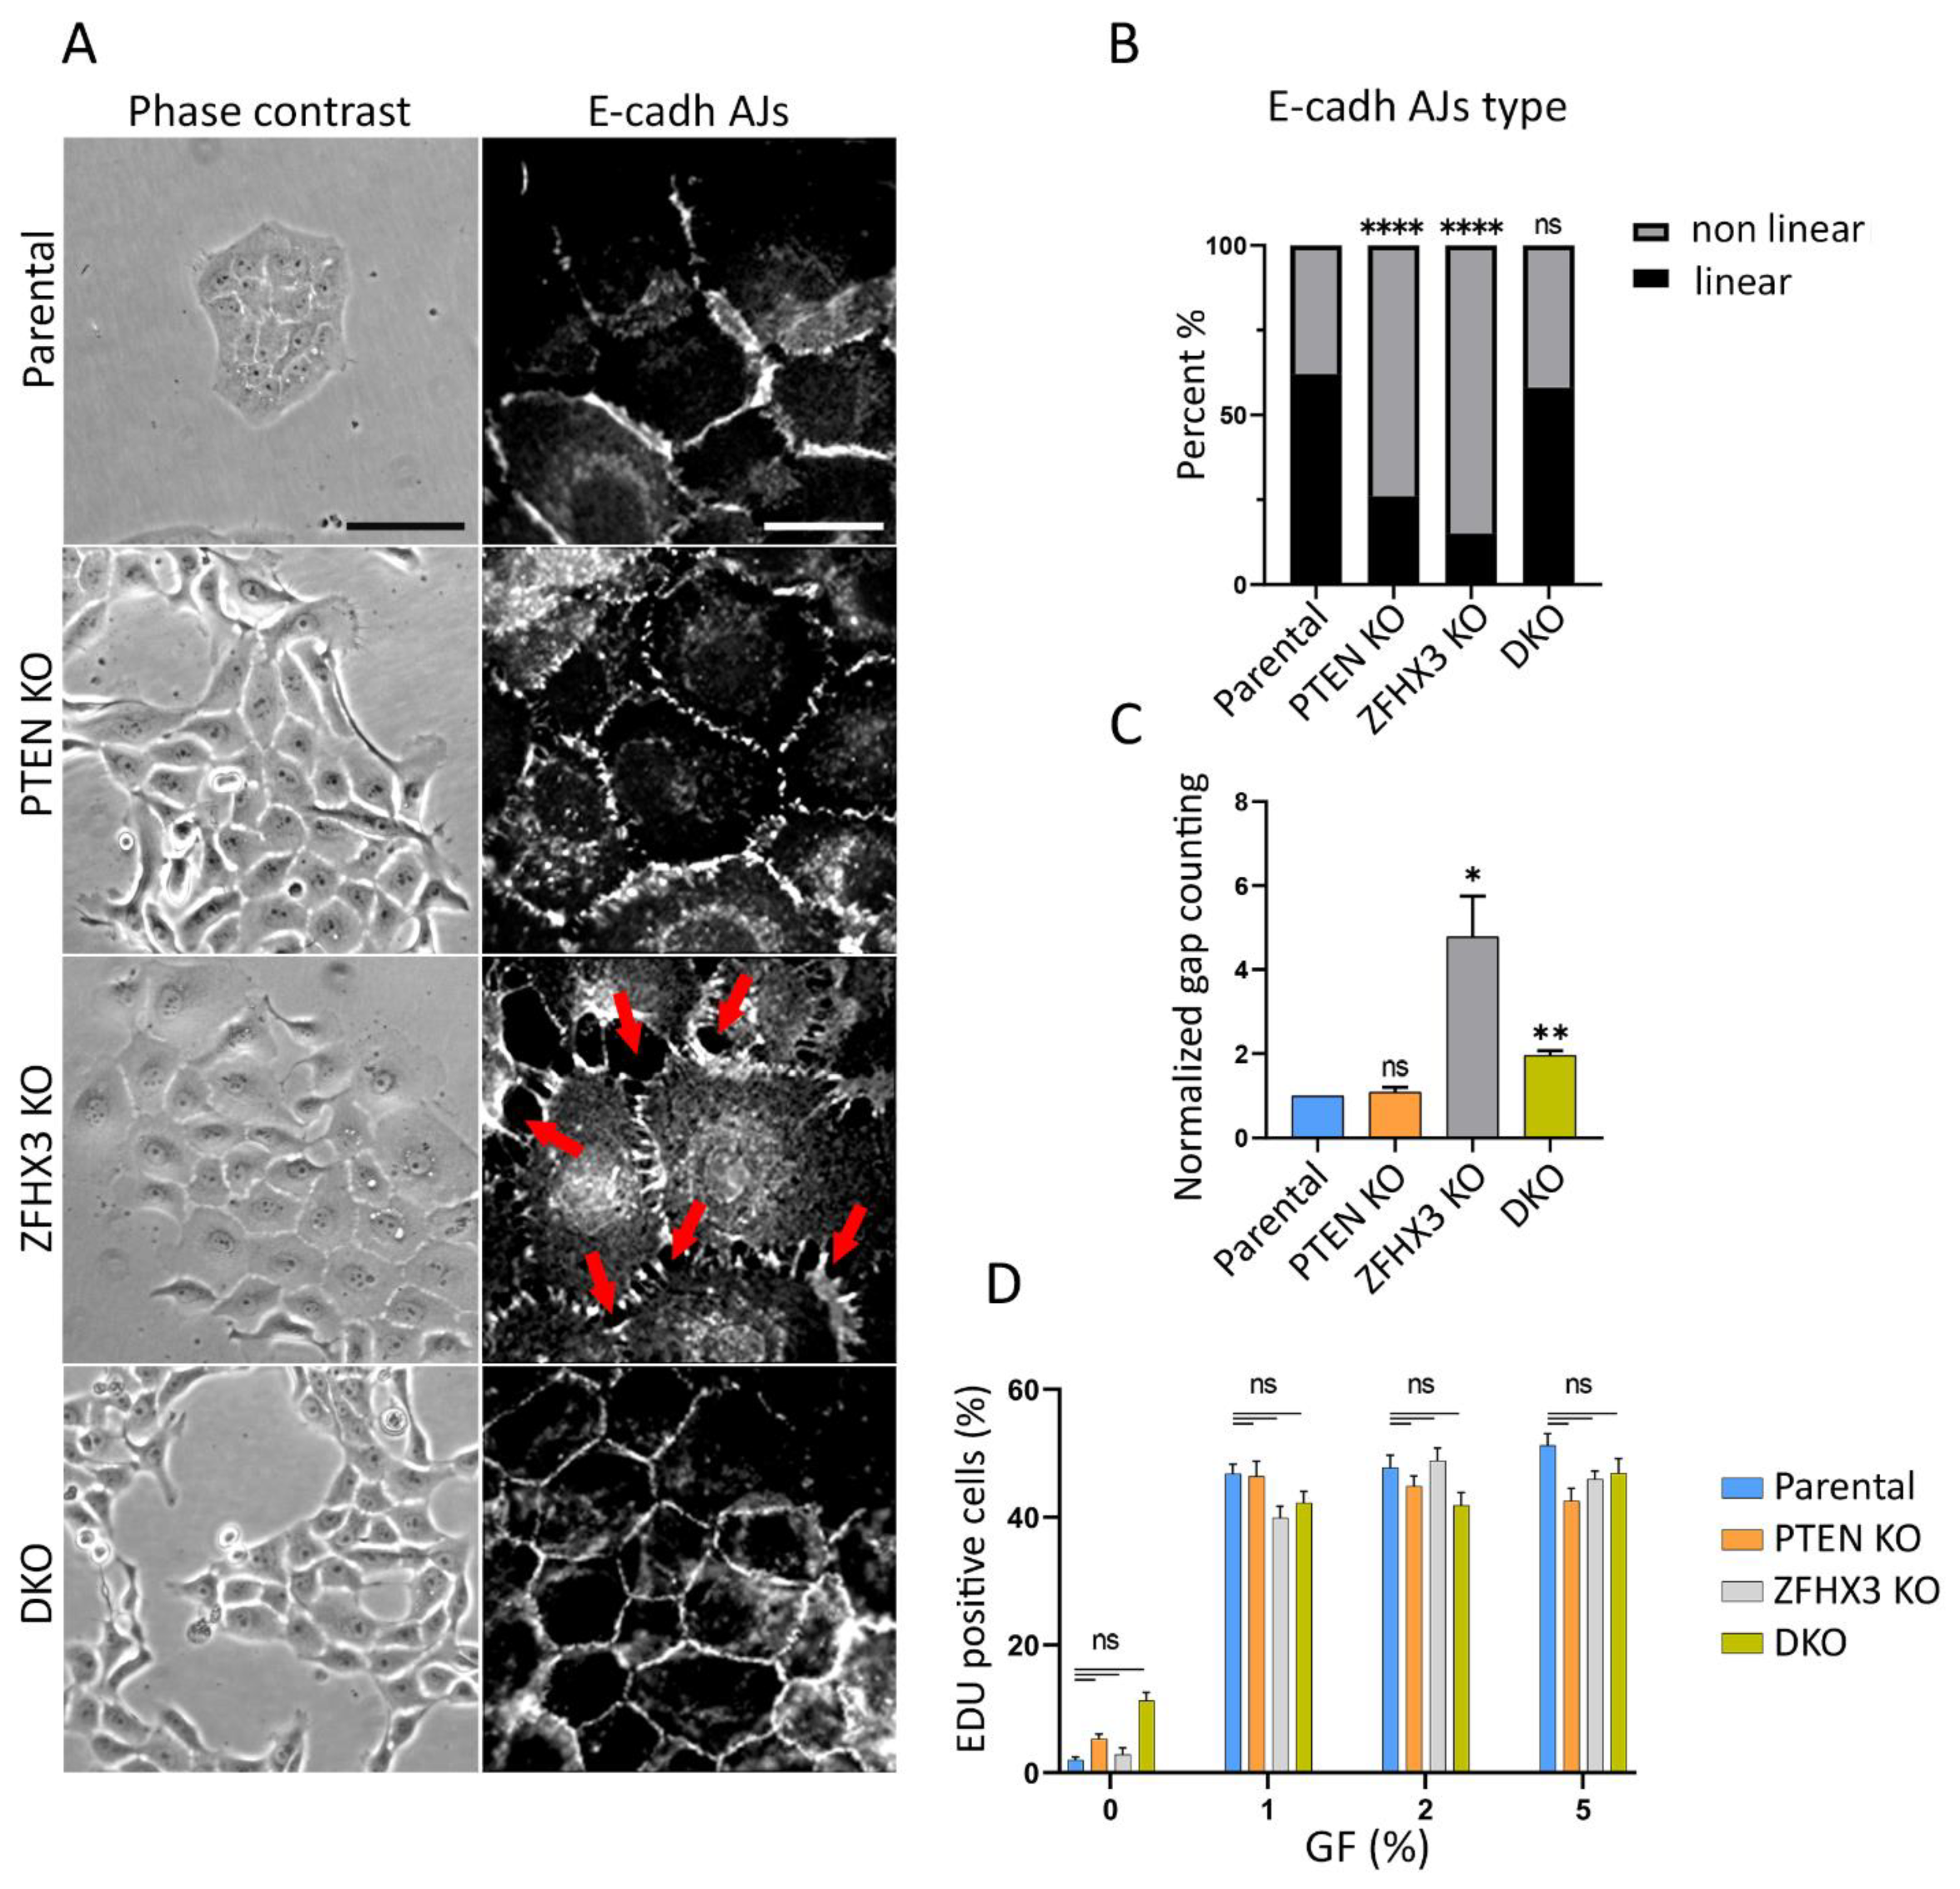
Abstract
1. Introduction
2. Results
2.1. Single and Combined KOs of Genes Found Altered in Mammary Carcinomas
2.2. Morphology Alterations Caused by PTEN and ZFHX3 KOs
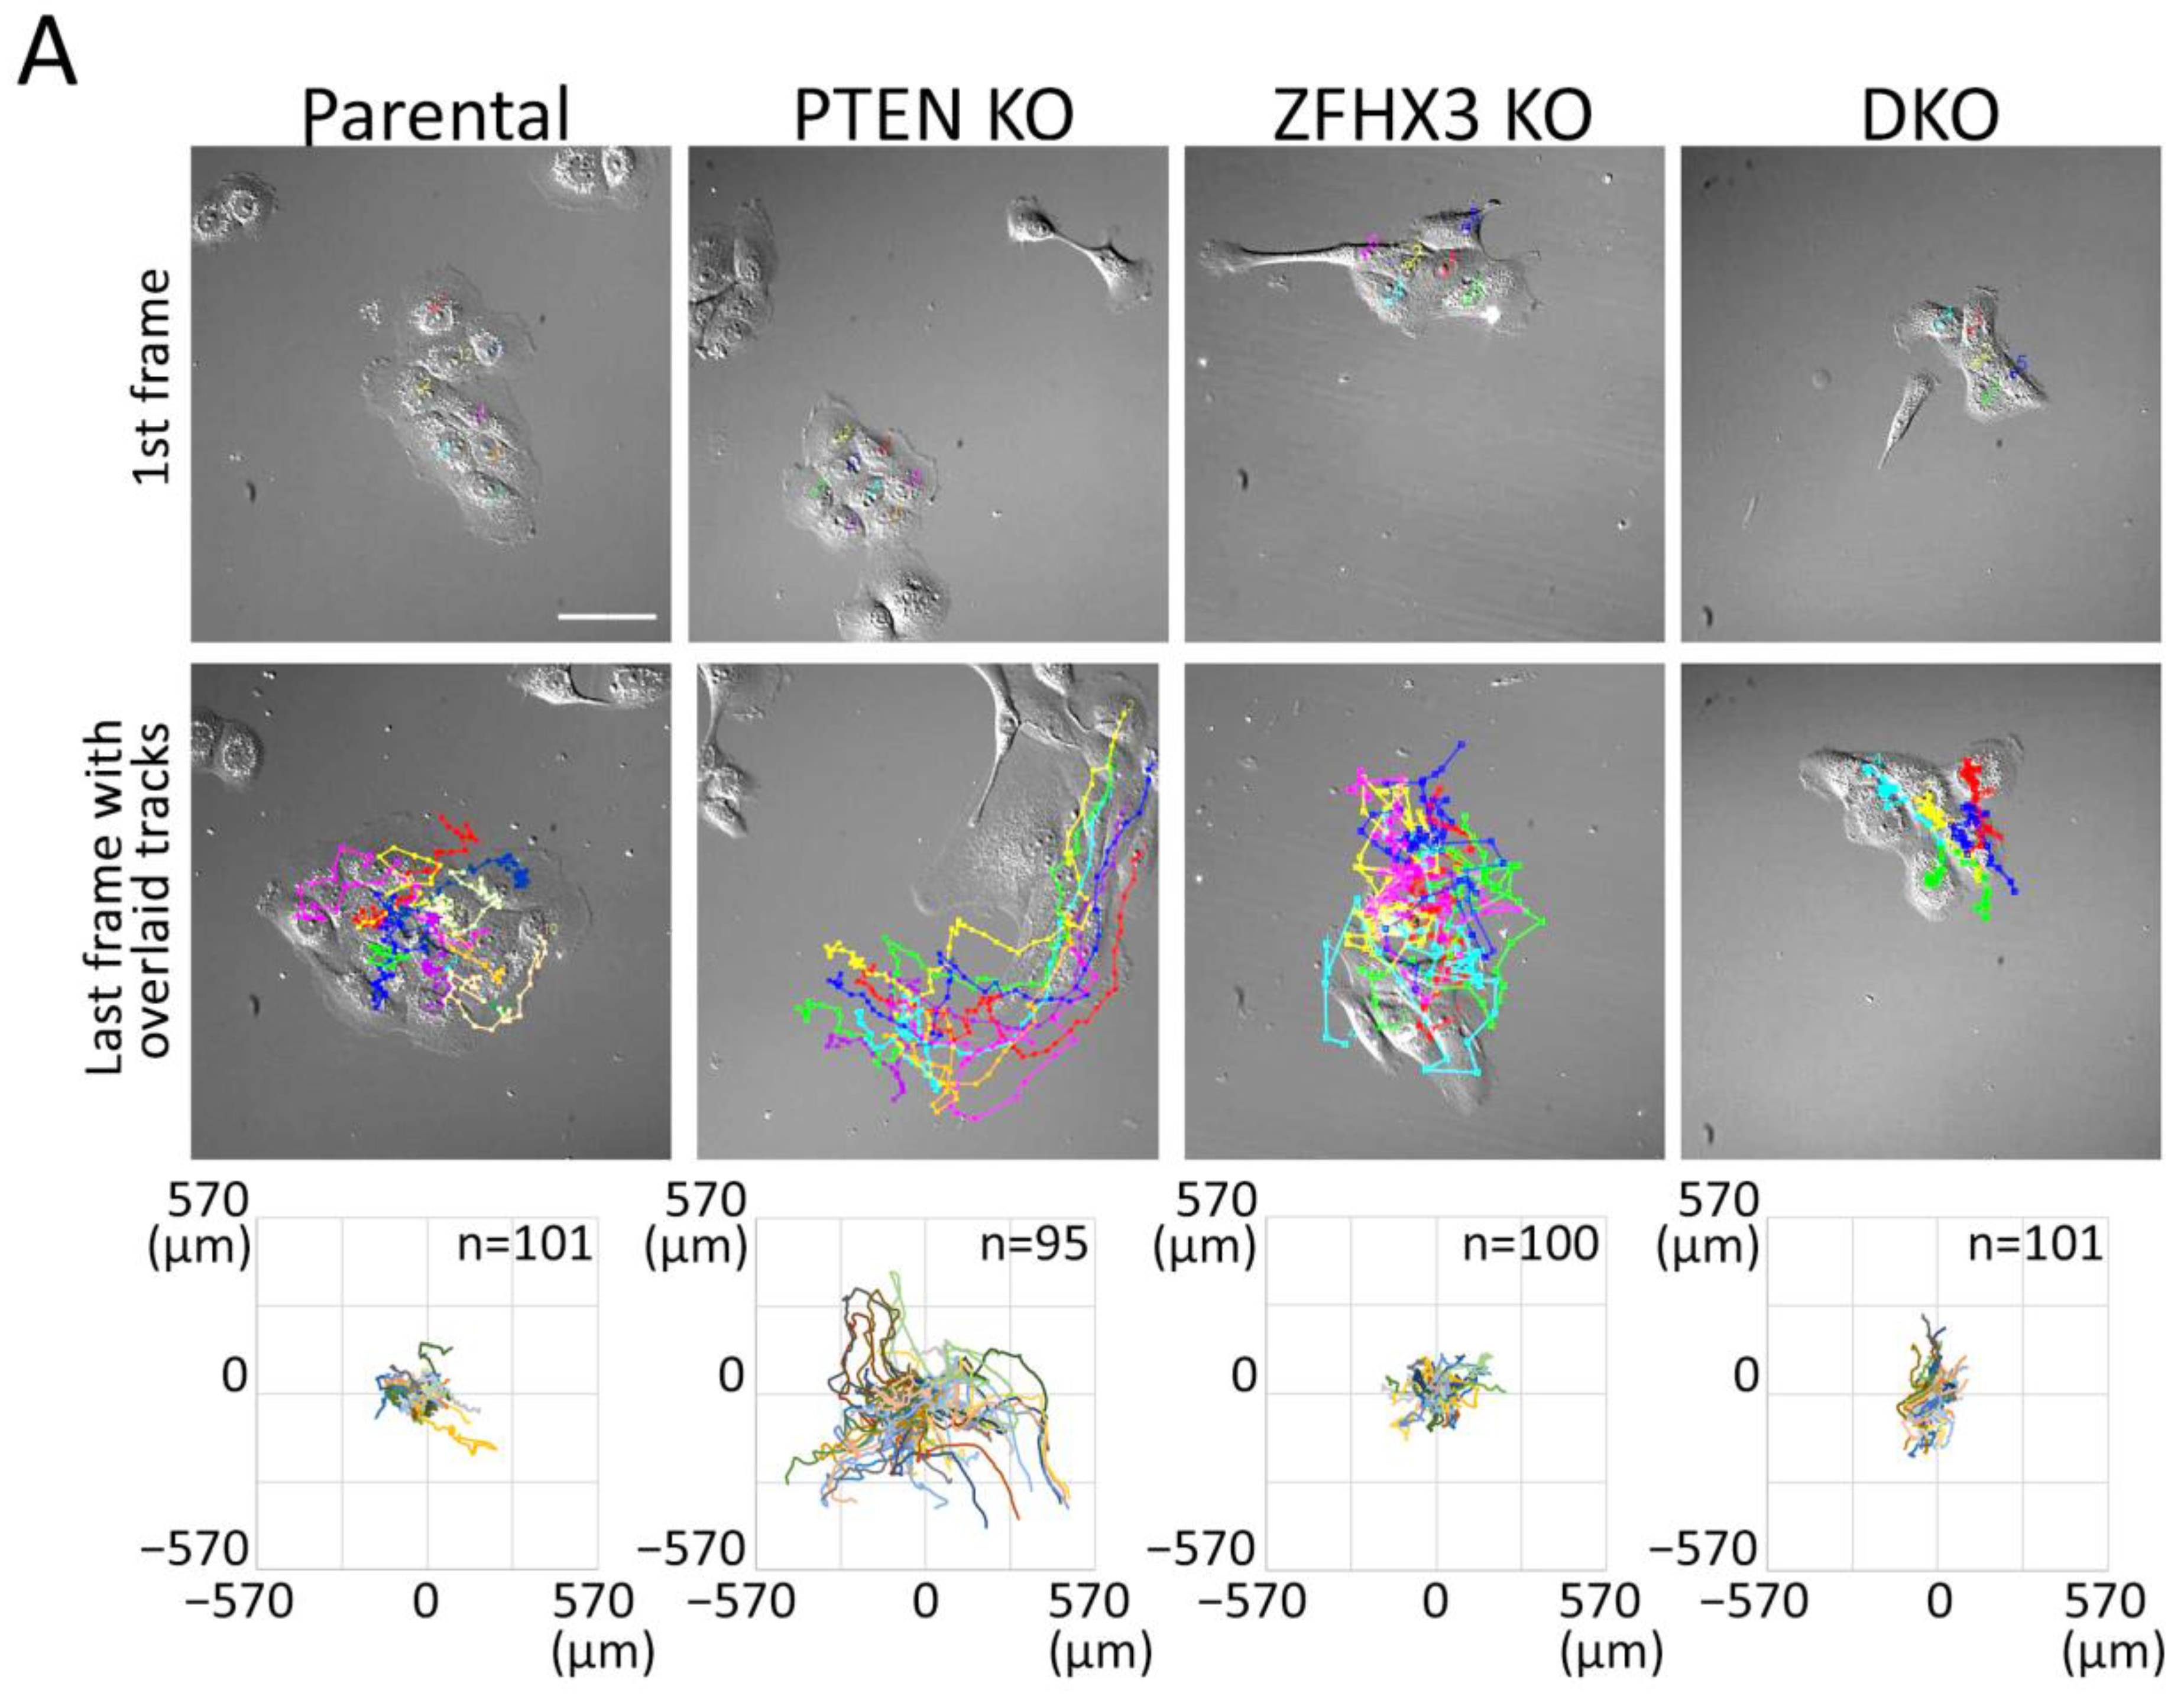
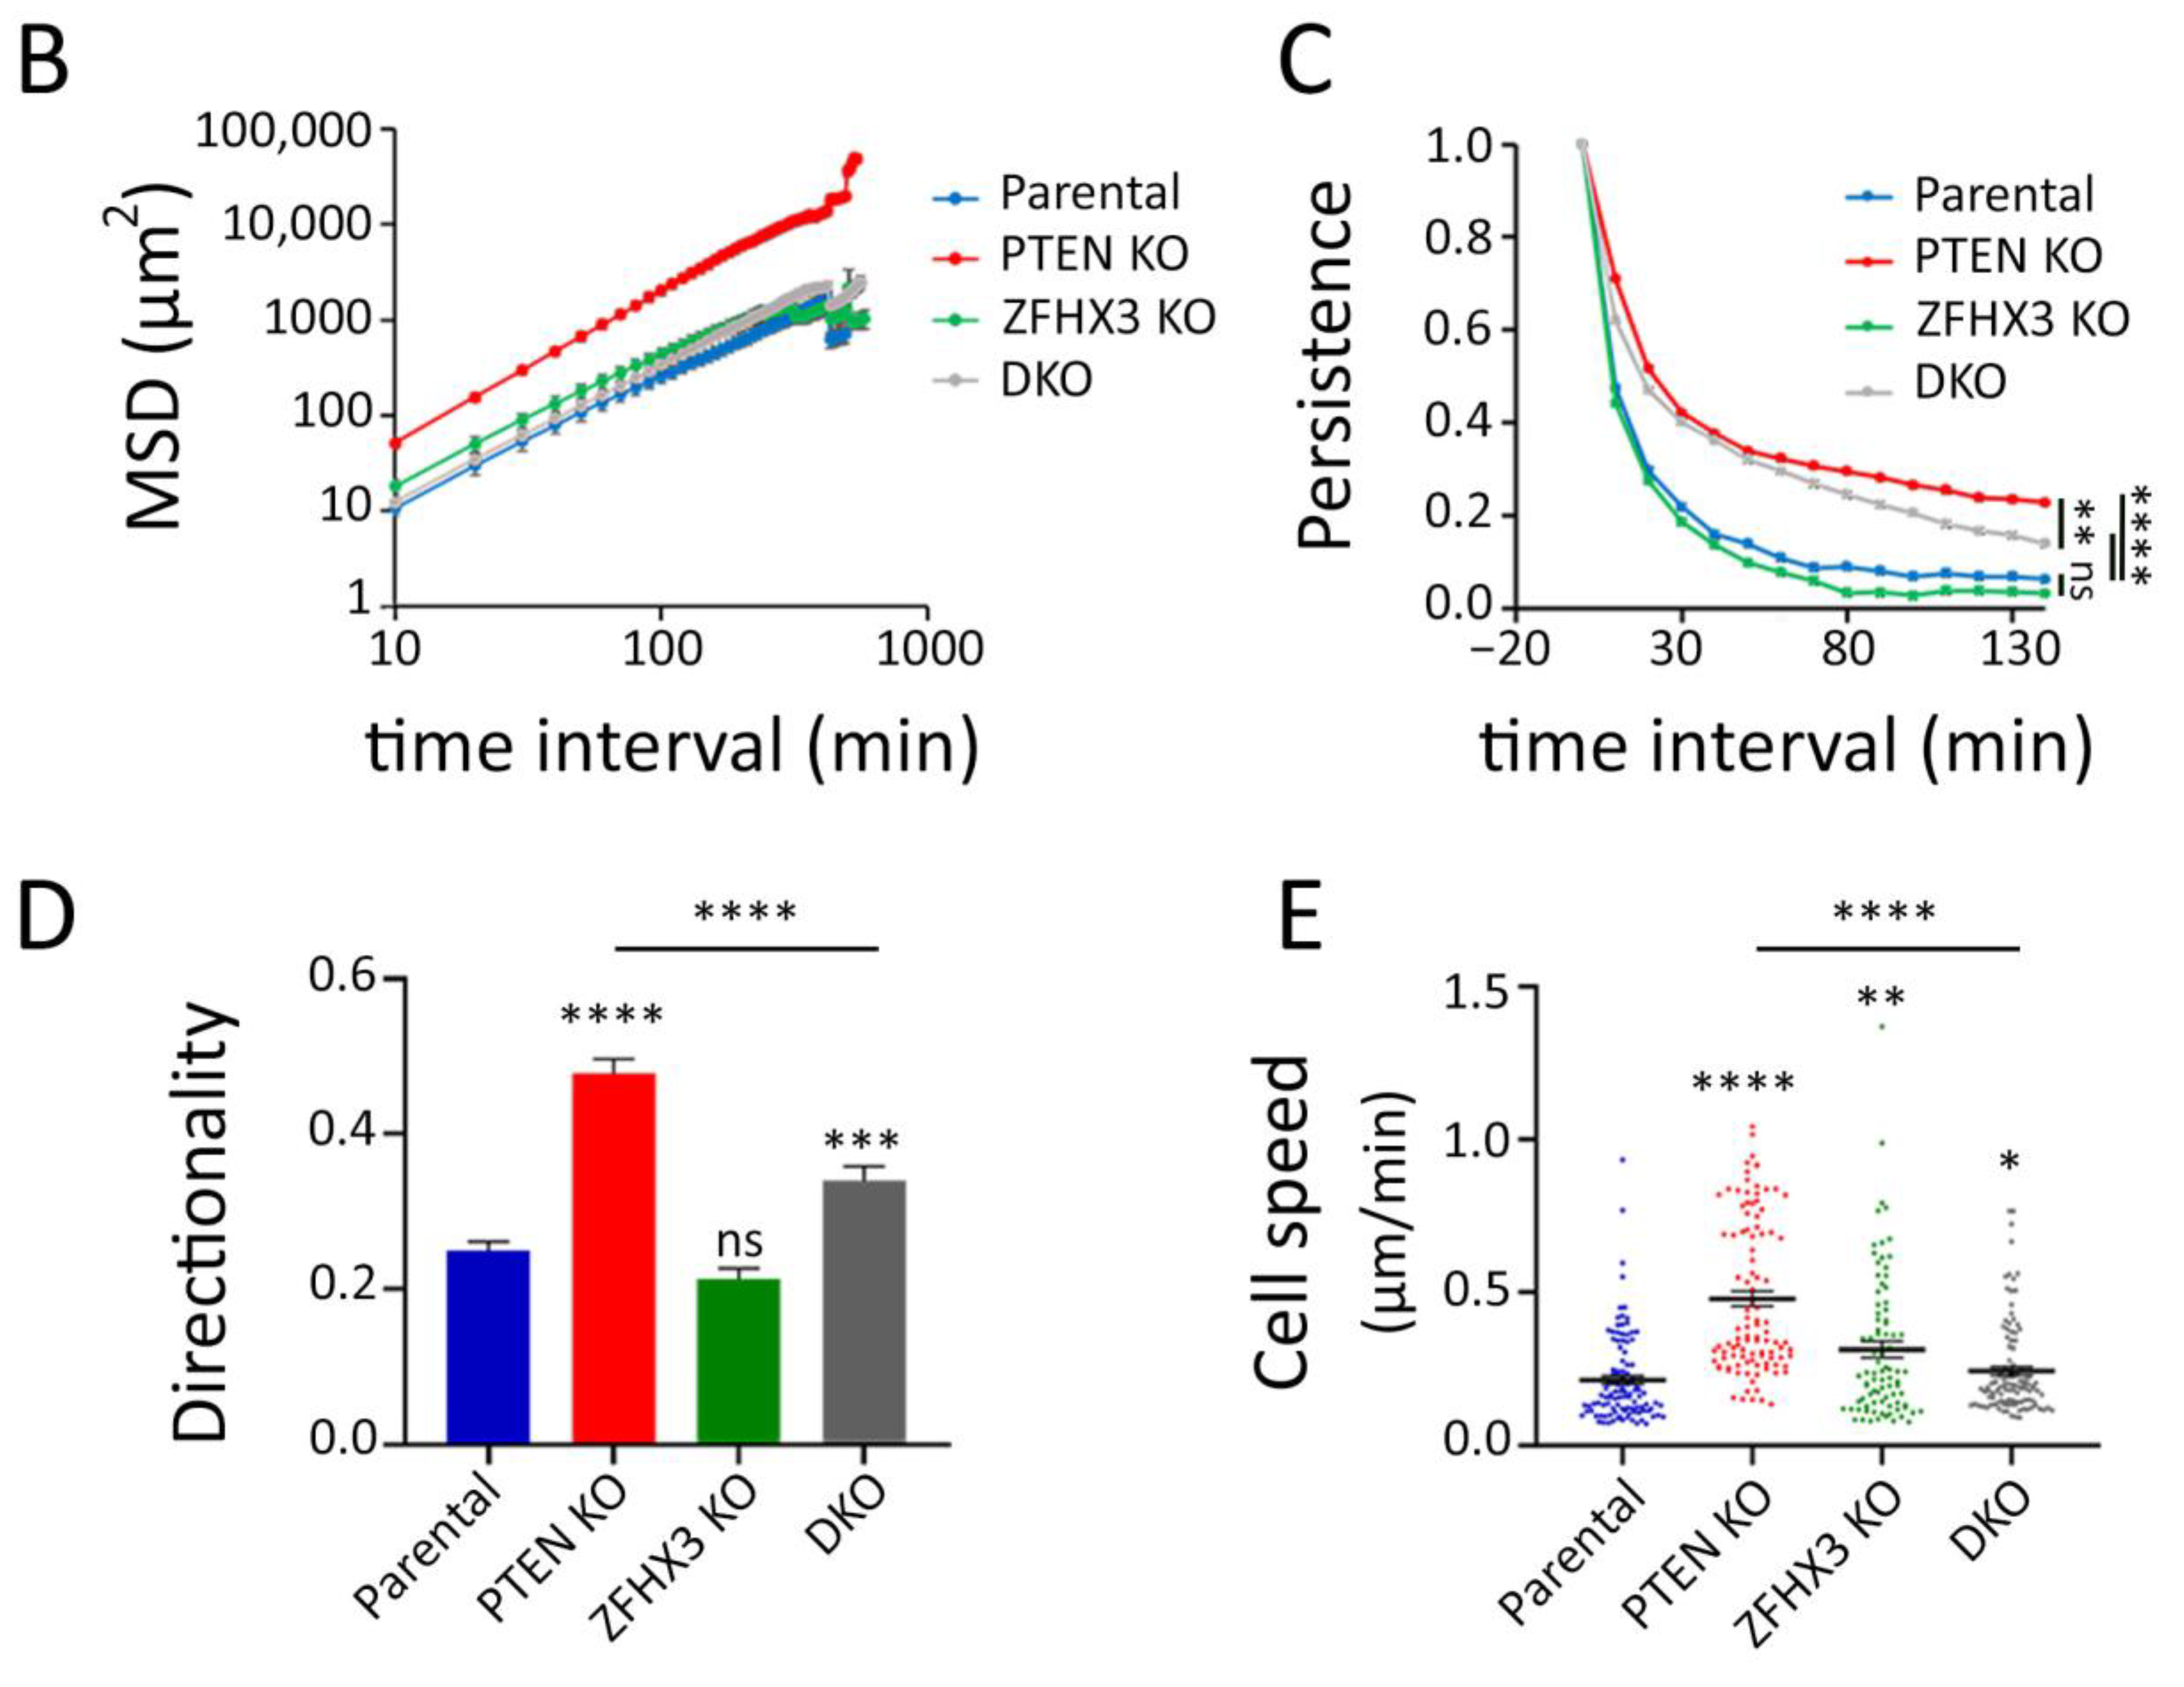
2.3. Migration of Epithelial Islets
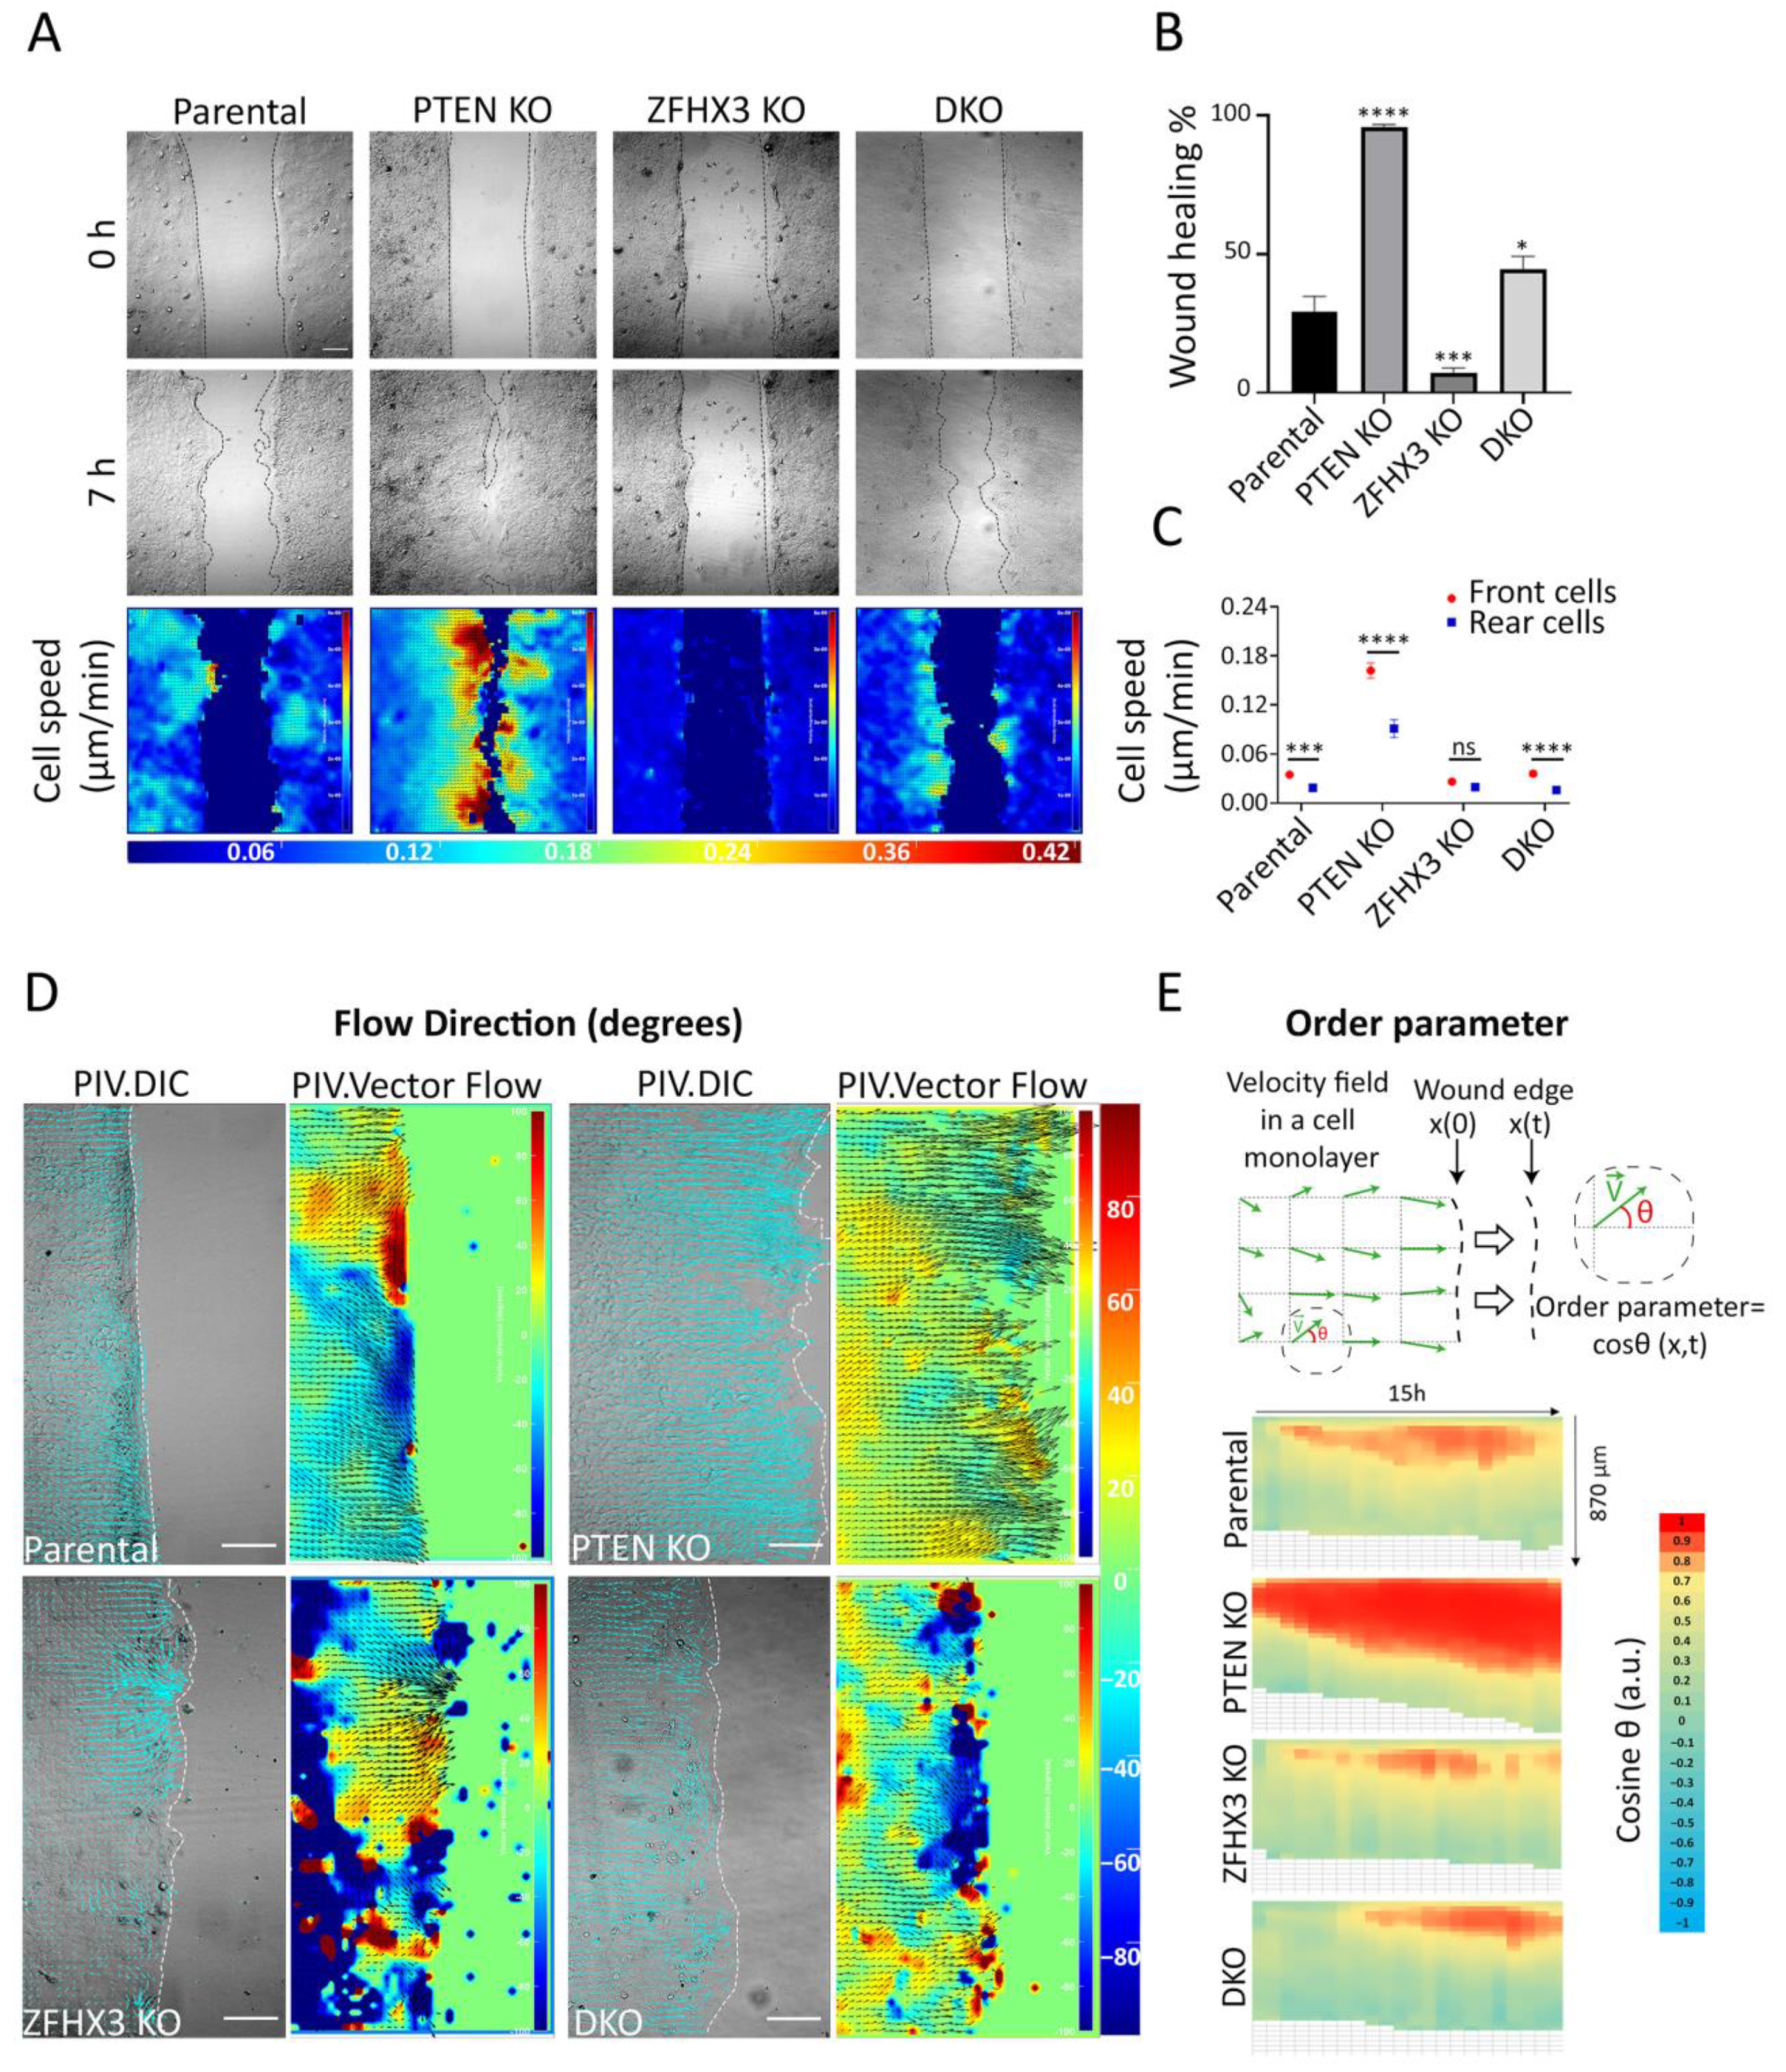
2.4. Influence of PTEN and ZFHX3 KOs on Cell Motility inside a Monolayer
2.5. Differences in Structure of Acini Formed by Parental and Gene-Edited Breast MCF10A Cells
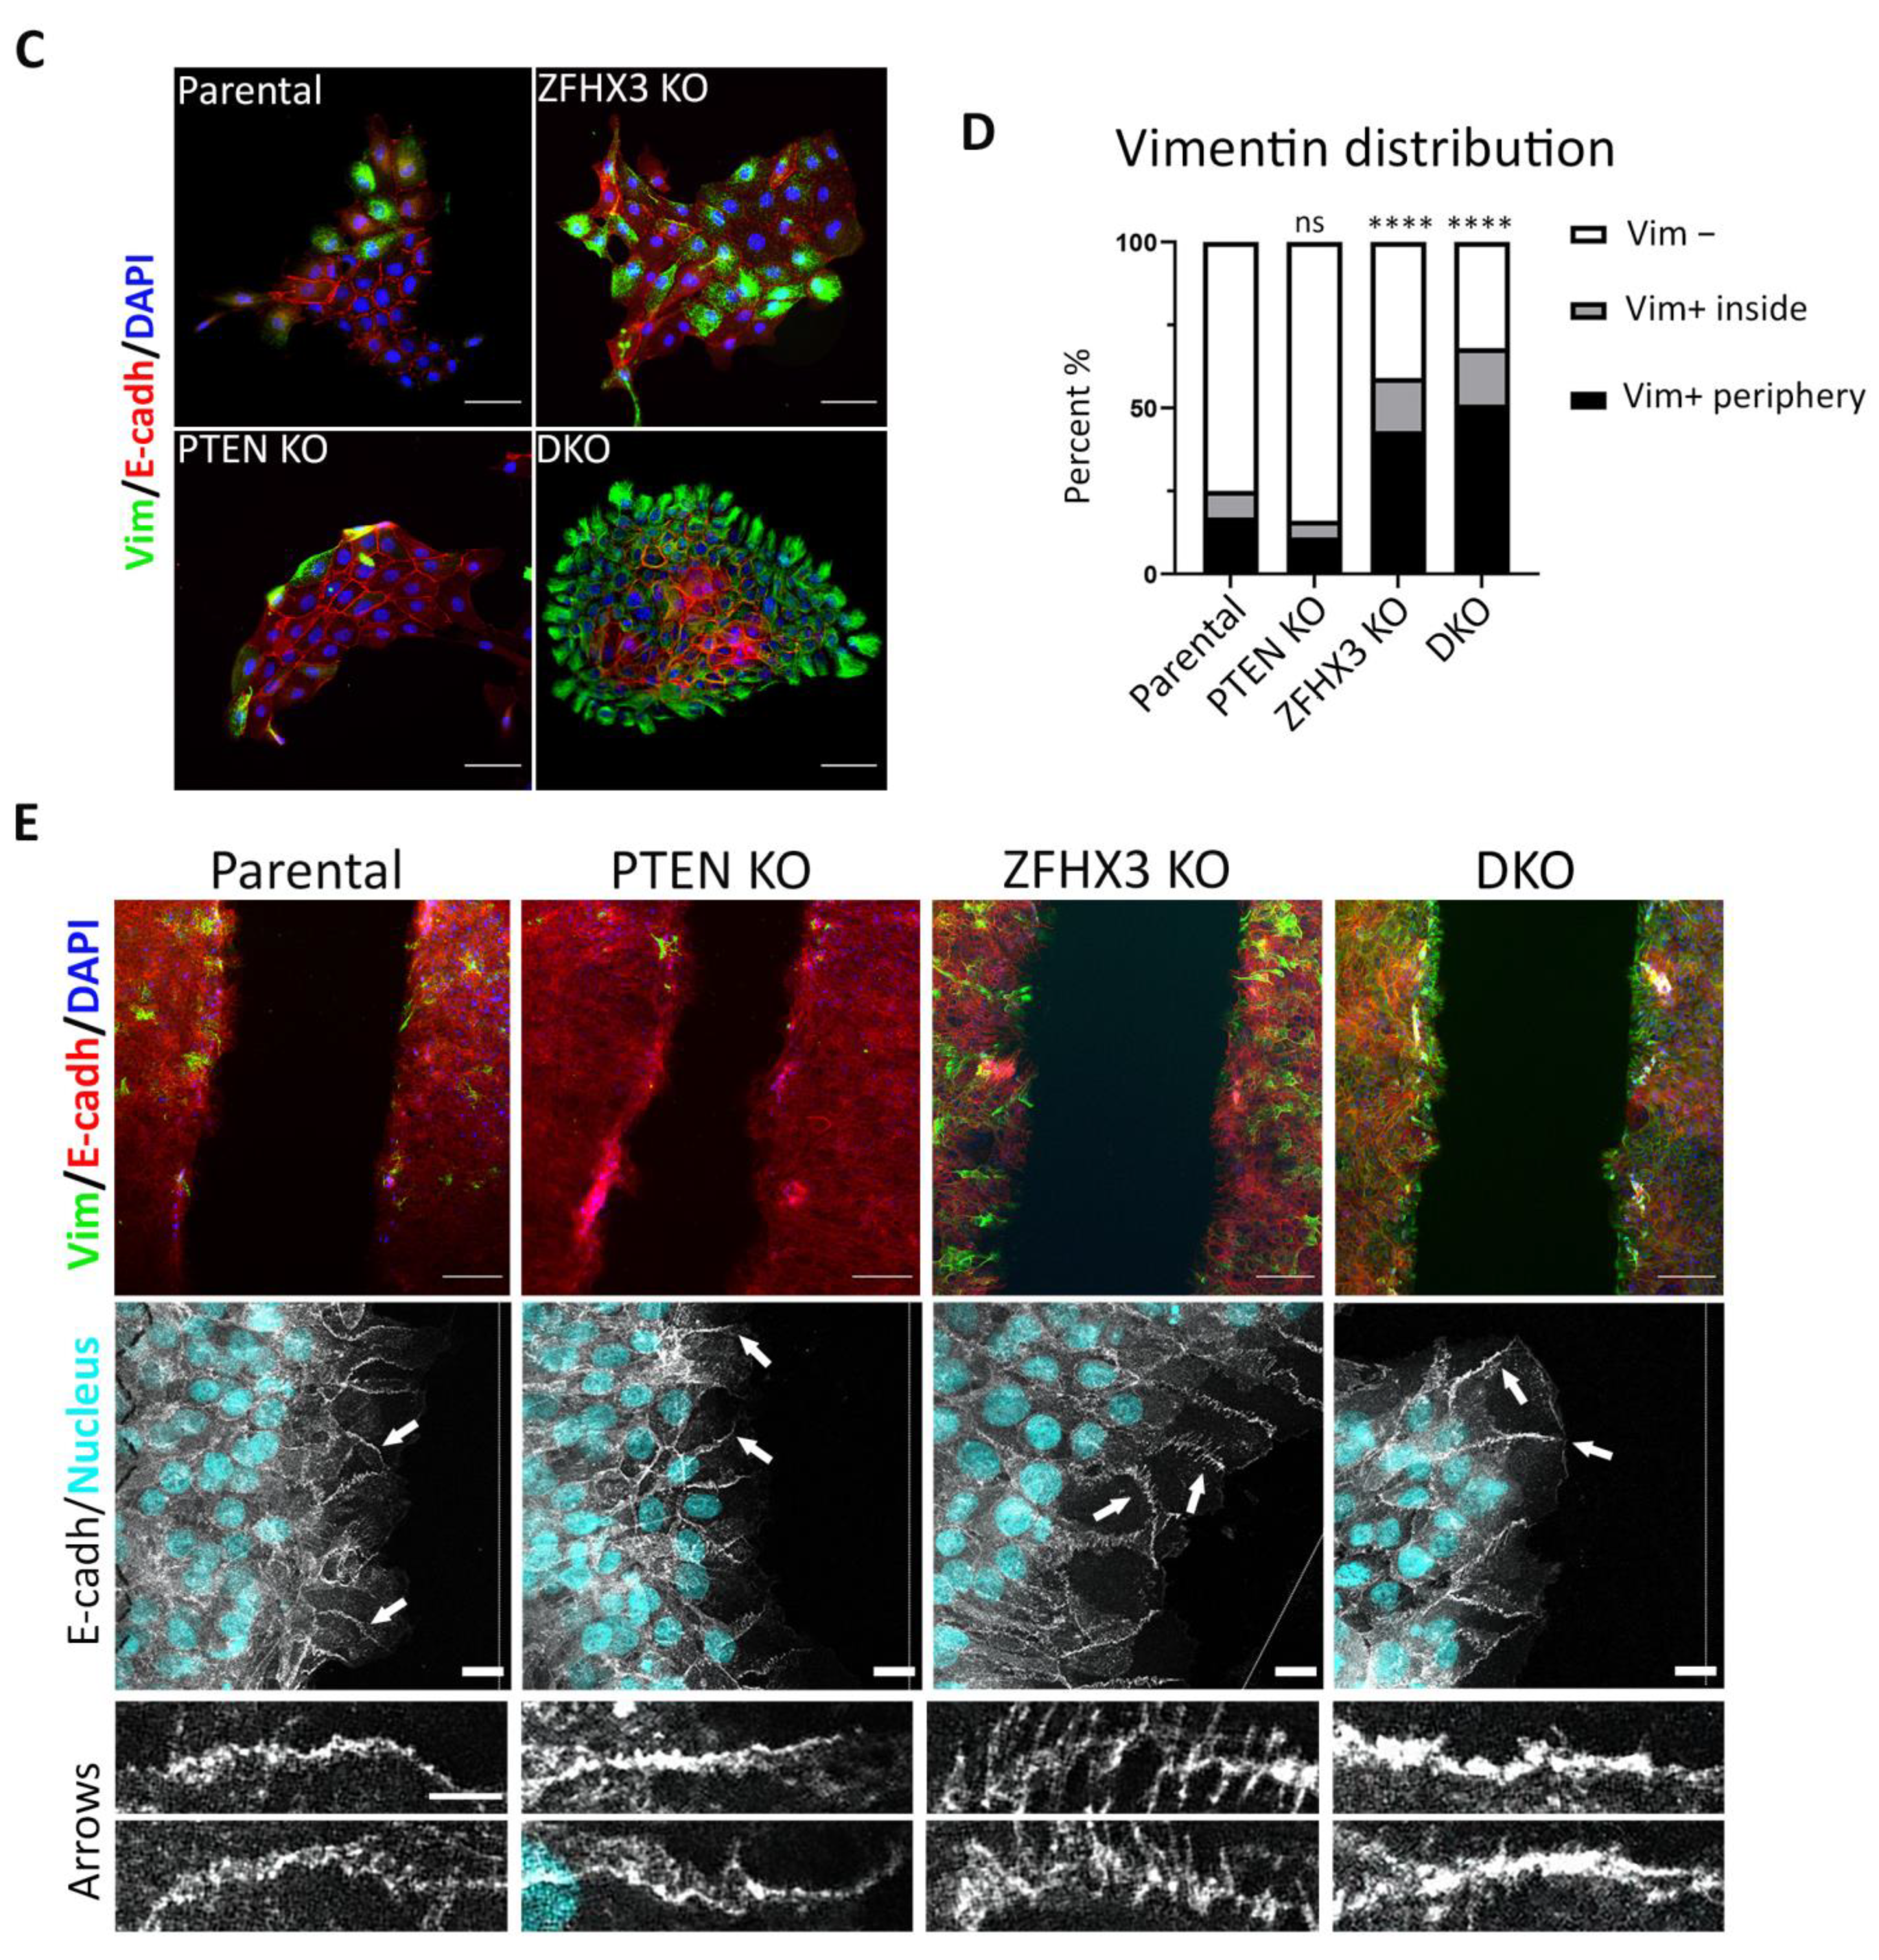
2.6. Aquisition of EMT Caused by Knockouts of PTEN and ZFHX3 in Breast Cells
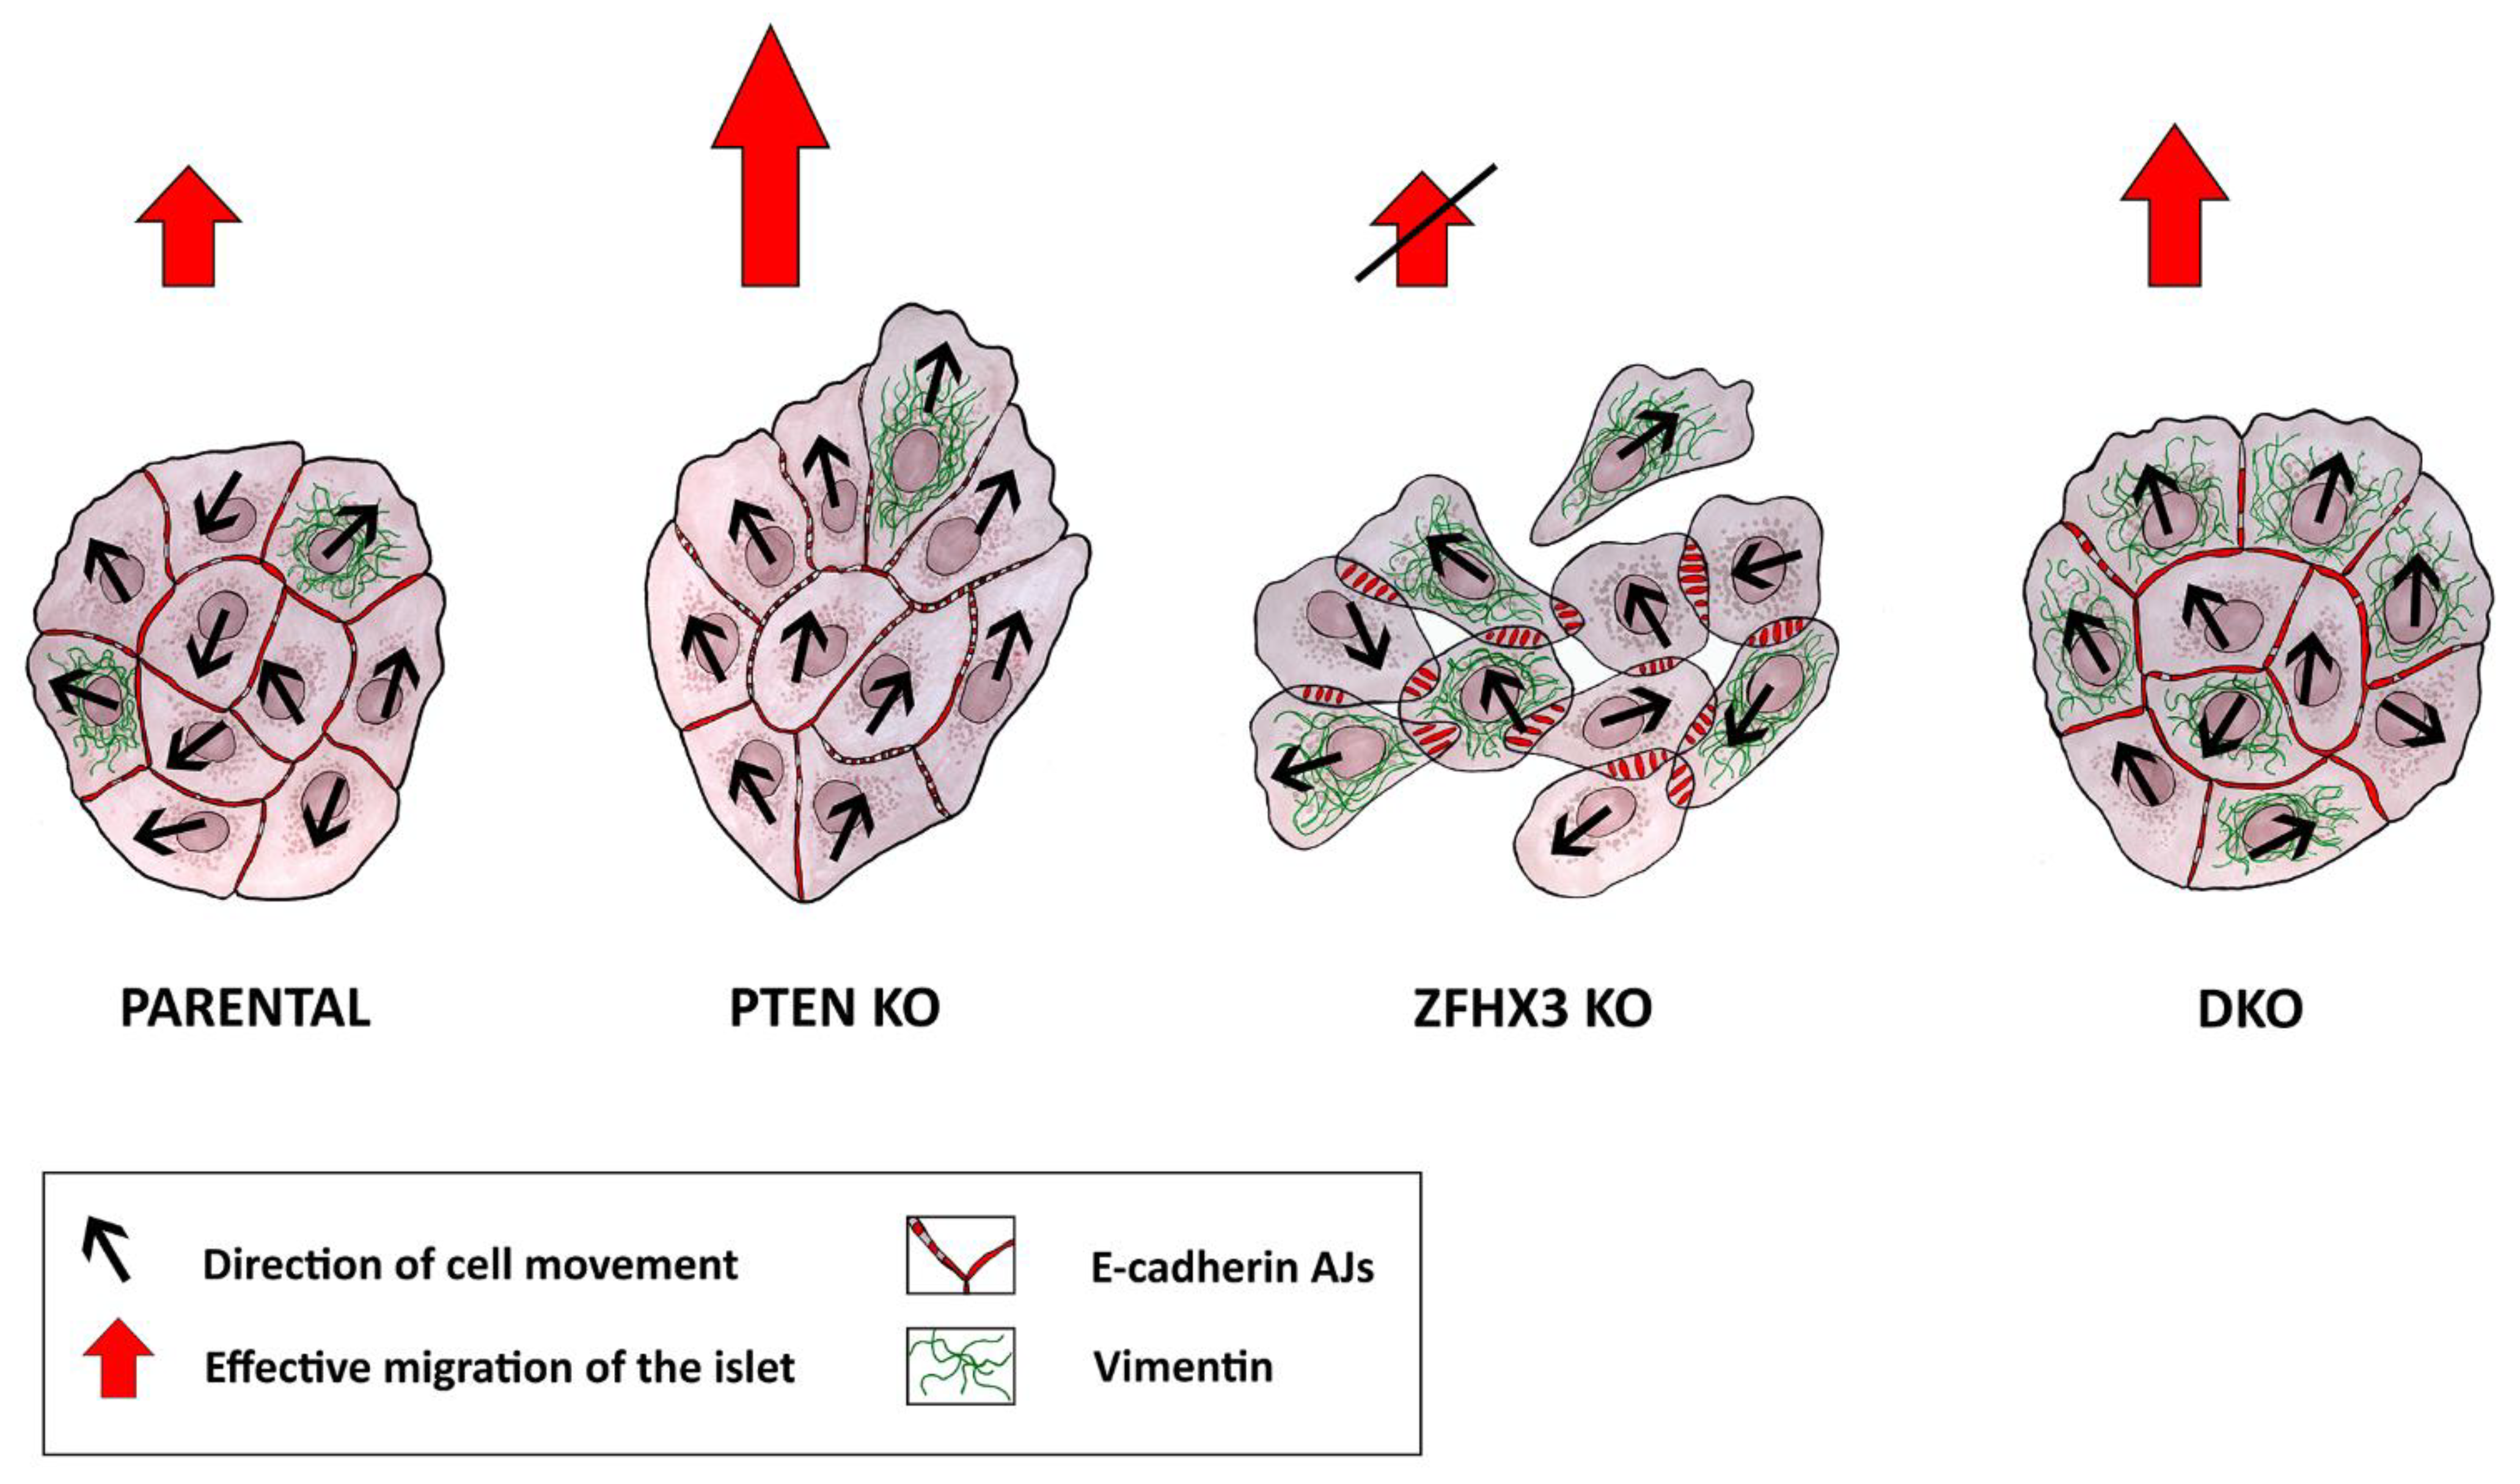
3. Discussion
4. Materials and Methods
4.1. Sequencing of Invasive Mammary Carcinomas and Putative Driver Mutations
4.2. Cell Culture
4.3. Generation of KO Cell Lines
4.4. Cell Proliferation Analysis
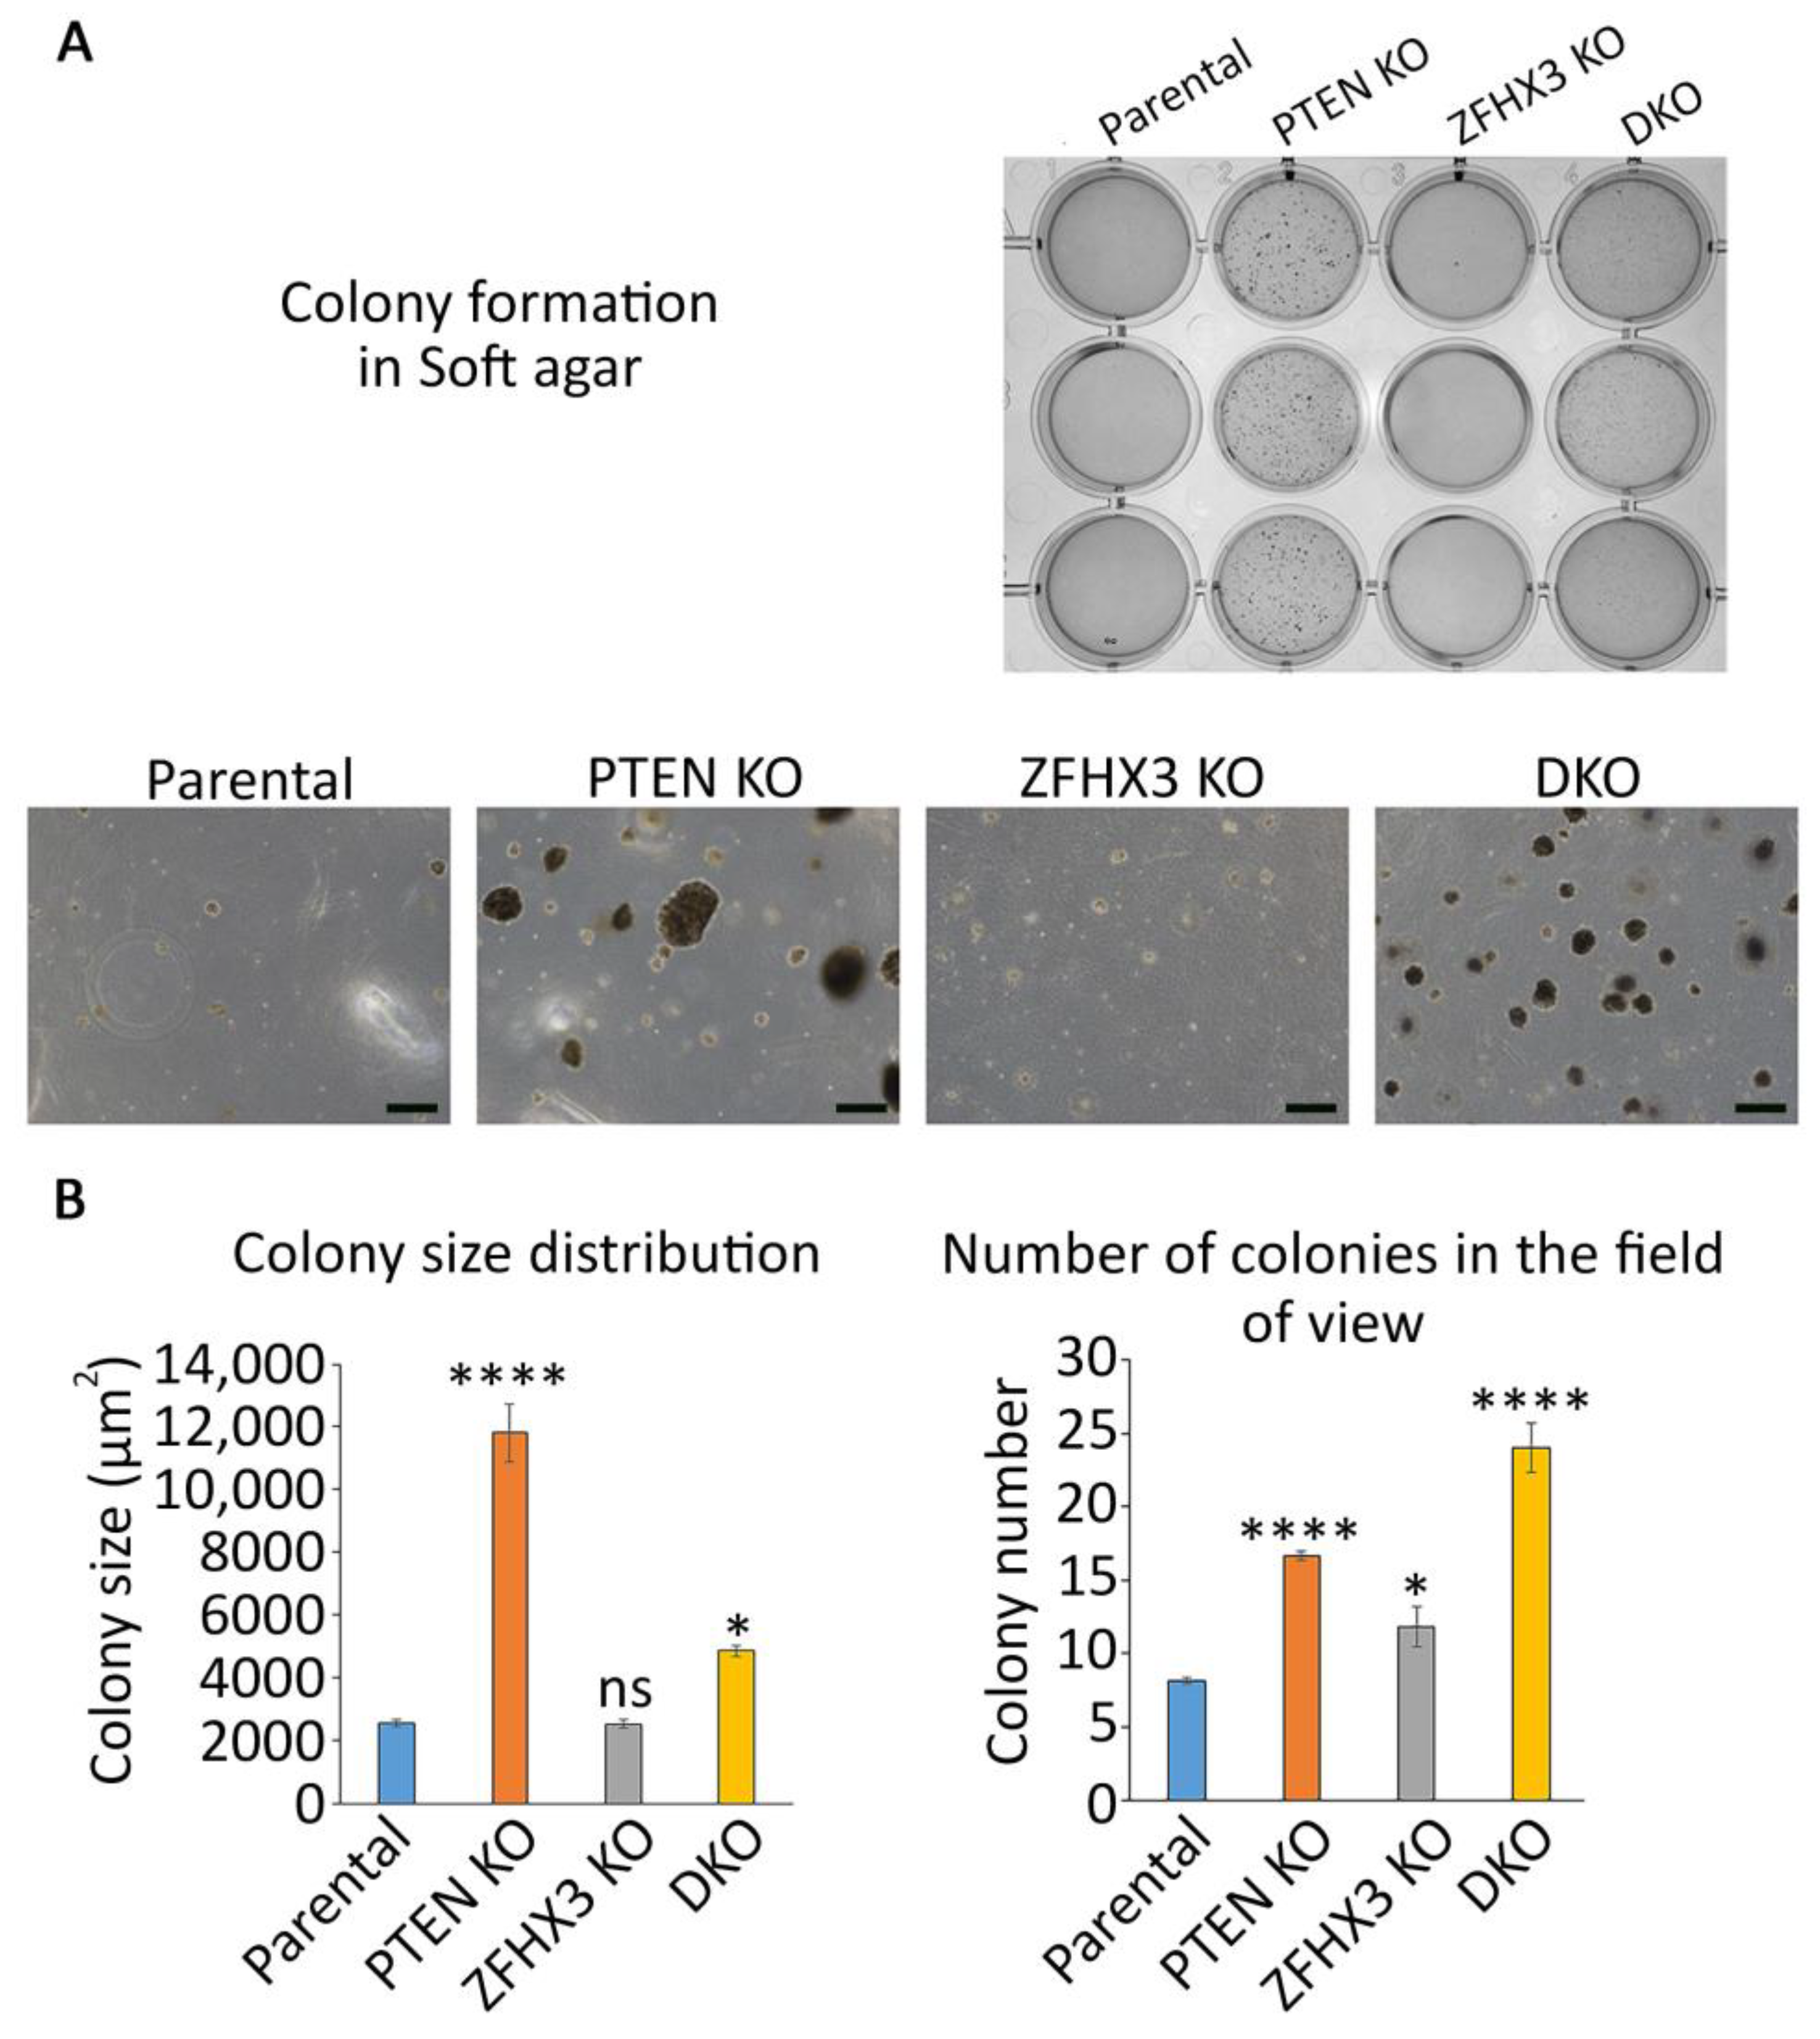
4.5. Anchorage-Independent Cell Growth in Soft Agar
4.6. Acini Assay Method
4.7. Antibodies
4.8. Immunofluorescence
4.9. Western Blot
4.10. Cell Migration
4.10.1. Migration of Islets
4.10.2. Wound Healing
4.11. Analysis of Collective Cell Migration Using PIV
Supplementary Materials
Author Contributions
Funding
Institutional Review Board Statement
Informed Consent Statement
Data Availability Statement
Acknowledgments
Conflicts of Interest
Abbreviations
| AJ | Adherens Junction |
| EGF | Epidermal Growth Factor |
| EMT | Epithelial-to-Mesenchymal Transition |
| HS | Horse Serum |
| KO | Knock-Out |
| LOH | Loss of Heterozygosity |
| MSD | Mean Square Displacement |
| NGS | Next Generation Sequencing |
| PI3K | PhosphatidylInositol 3-Kinase |
| PIV | Particle Image Velocimetry |
| SEM | Standard Error of Mean |
| TSG | Tumor Suppressor Gene |
| WES | Whole Exome Sequencing |
| WRC | WAVE regulatory complex |
References
- Vogelstein, B.; Papadopoulos, N.; Velculescu, V.E.; Zhou, S.; Diaz, L.A., Jr.; Kinzler, K.W. Cancer genome landscapes. Science 2013, 339, 1546–1558. [Google Scholar] [CrossRef] [PubMed]
- Molinie, N.; Rubtsova, S.N.; Fokin, A.; Visweshwaran, S.P.; Rocques, N.; Polesskaya, A.; Schnitzler, A.; Vacher, S.; Denisov, E.V.; Tashireva, L.A.; et al. Cortical branched actin determines cell cycle progression. Cell Res. 2019, 29, 432–445. [Google Scholar] [CrossRef]
- Thiery, J.P. Epithelial-mesenchymal transitions in development and pathologies. Curr. Opin. Cell Biol. 2003, 15, 740–746. [Google Scholar] [CrossRef] [PubMed]
- Rubtsova, S.N.; Zhitnyak, I.Y.; Gloushankova, N.A. A Novel Role of E-Cadherin-Based Adherens Junctions in Neoplastic Cell Dissemination. PLoS ONE 2015, 10, e0133578. [Google Scholar] [CrossRef] [PubMed]
- Rubtsova, S.N.; Zhitnyak, I.Y.; Gloushankova, N.A. Phenotypic Plasticity of Cancer Cells Based on Remodeling of the Actin Cytoskeleton and Adhesive Structures. Int. J. Mol. Sci. 2021, 22, 1812. [Google Scholar] [CrossRef]
- Zhitnyak, I.Y.; Rubtsova, S.N.; Litovka, N.I.; Gloushankova, N.A. Early Events in Actin Cytoskeleton Dynamics and E-Cadherin-Mediated Cell-Cell Adhesion during Epithelial-Mesenchymal Transition. Cells 2020, 9, 578. [Google Scholar] [CrossRef]
- Zhitniak, I.; Glushankova, N.A. Morphology, cell-cell interactions, and migratory activity of IAR-2 epithelial cells transformed with the RAS oncogene: Contribution of cell adhesion protein E-cadherin. Ontogenez 2011, 42, 453–464. [Google Scholar] [CrossRef]
- Ayollo, D.V.; Zhitnyak, I.Y.; Vasiliev, J.M.; Gloushankova, N.A. Rearrangements of the actin cytoskeleton and E-cadherin-based adherens junctions caused by neoplasic transformation change cell-cell interactions. PLoS ONE 2009, 4, e8027. [Google Scholar] [CrossRef]
- Pastushenko, I.; Brisebarre, A.; Sifrim, A.; Fioramonti, M.; Revenco, T.; Boumahdi, S.; Van Keymeulen, A.; Brown, D.; Moers, V.; Lemaire, S.; et al. Identification of the tumour transition states occurring during EMT. Nature 2018, 556, 463–468. [Google Scholar] [CrossRef]
- Bornes, L.; Belthier, G.; van Rheenen, J. Epithelial-to-Mesenchymal Transition in the Light of Plasticity and Hybrid E/M States. J. Clin. Med. 2021, 10, 2403. [Google Scholar] [CrossRef]
- Friedl, P.; Gilmour, D. Collective cell migration in morphogenesis, regeneration and cancer. Nat. Rev. Mol. Cell Biol. 2009, 10, 445–457. [Google Scholar] [CrossRef] [PubMed]
- Lee, J.M.; Dedhar, S.; Kalluri, R.; Thompson, E.W. The epithelial-mesenchymal transition: New insights in signaling, development, and disease. J. Cell Biol. 2006, 172, 973–981. [Google Scholar] [CrossRef] [PubMed]
- di Bari, M.G.; Ginsburg, E.; Plant, J.; Strizzi, L.; Salomon, D.S.; Vonderhaar, B.K. Msx2 induces epithelial-mesenchymal transition in mouse mammary epithelial cells through upregulation of Cripto-1. J. Cell. Physiol. 2009, 219, 659–666. [Google Scholar] [CrossRef] [PubMed]
- Kroger, C.; Afeyan, A.; Mraz, J.; Eaton, E.N.; Reinhardt, F.; Khodor, Y.L.; Thiru, P.; Bierie, B.; Ye, X.; Burge, C.B.; et al. Acquisition of a hybrid E/M state is essential for tumorigenicity of basal breast cancer cells. Proc. Natl. Acad. Sci. USA 2019, 116, 7353–7362. [Google Scholar] [CrossRef] [PubMed]
- Jolly, M.K.; Somarelli, J.A.; Sheth, M.; Biddle, A.; Tripathi, S.C.; Armstrong, A.J.; Hanash, S.M.; Bapat, S.A.; Rangarajan, A.; Levine, H. Hybrid epithelial/mesenchymal phenotypes promote metastasis and therapy resistance across carcinomas. Pharmacol. Ther. 2019, 194, 161–184. [Google Scholar] [CrossRef]
- Novikov, N.M.; Zolotaryova, S.Y.; Gautreau, A.M.; Denisov, E.V. Mutational drivers of cancer cell migration and invasion. Br. J. Cancer 2021, 124, 102–114. [Google Scholar] [CrossRef]
- Alvarez-Garcia, V.; Tawil, Y.; Wise, H.M.; Leslie, N.R. Mechanisms of PTEN loss in cancer: It’s all about diversity. Semin Cancer Biol. 2019, 59, 66–79. [Google Scholar] [CrossRef]
- Bonneau, D.; Longy, M. Mutations of the human PTEN gene. Hum. Mutat. 2000, 16, 109–122. [Google Scholar] [CrossRef]
- Leslie, N.R.; Downes, C.P. PTEN function: How normal cells control it and tumour cells lose it. Biochem. J. 2004, 382, 1–11. [Google Scholar] [CrossRef]
- Garcia, J.M.; Silva, J.; Pena, C.; Garcia, V.; Rodriguez, R.; Cruz, M.A.; Cantos, B.; Provencio, M.; Espana, P.; Bonilla, F. Promoter methylation of the PTEN gene is a common molecular change in breast cancer. Genes Chromosom. Cancer 2004, 41, 117–124. [Google Scholar] [CrossRef]
- Lu, Y.M.; Cheng, F.; Teng, L.S. The association between phosphatase and tensin homolog hypermethylation and patients with breast cancer, a meta-analysis and literature review. Sci. Rep. 2016, 6, 32723. [Google Scholar] [CrossRef] [PubMed]
- Zhang, H.Y.; Liang, F.; Jia, Z.L.; Song, S.T.; Jiang, Z.F. PTEN mutation, methylation and expression in breast cancer patients. Oncol. Lett. 2013, 6, 161–168. [Google Scholar] [CrossRef]
- Bowen, K.A.; Doan, H.Q.; Zhou, B.P.; Wang, Q.; Zhou, Y.; Rychahou, P.G.; Evers, B.M. PTEN loss induces epithelial--mesenchymal transition in human colon cancer cells. Anticancer Res. 2009, 29, 4439–4449. [Google Scholar] [PubMed]
- Mulholland, D.J.; Kobayashi, N.; Ruscetti, M.; Zhi, A.; Tran, L.M.; Huang, J.; Gleave, M.; Wu, H. Pten loss and RAS/MAPK activation cooperate to promote EMT and metastasis initiated from prostate cancer stem/progenitor cells. Cancer Res. 2012, 72, 1878–1889. [Google Scholar] [CrossRef] [PubMed]
- Qi, Y.; Liu, J.; Chao, J.; Scheuerman, M.P.; Rahimi, S.A.; Lee, L.Y.; Li, S. PTEN suppresses epithelial-mesenchymal transition and cancer stem cell activity by downregulating Abi1. Sci. Rep. 2020, 10, 12685. [Google Scholar] [CrossRef] [PubMed]
- Chiang, K.C.; Hsu, S.Y.; Lin, S.J.; Yeh, C.N.; Pang, J.H.; Wang, S.Y.; Hsu, J.T.; Yeh, T.S.; Chen, L.W.; Kuo, S.F.; et al. PTEN Insufficiency Increases Breast Cancer Cell Metastasis In Vitro and In Vivo in a Xenograft Zebrafish Model. Anticancer Res. 2016, 36, 3997–4005. [Google Scholar] [PubMed]
- Peglion, F.; Capuana, L.; Perfettini, I.; Boucontet, L.; Braithwaite, B.; Colucci-Guyon, E.; Quissac, E.; Forsberg-Nilsson, K.; Llense, F.; Etienne-Manneville, S. PTEN inhibits AMPK to control collective migration. Nat. Commun. 2022, 13, 4528. [Google Scholar] [CrossRef]
- Cao, L.; Graue-Hernandez, E.O.; Tran, V.; Reid, B.; Pu, J.; Mannis, M.J.; Zhao, M. Downregulation of PTEN at corneal wound sites accelerates wound healing through increased cell migration. Investig. Ophthalmol. Vis. Sci. 2011, 52, 2272–2278. [Google Scholar] [CrossRef]
- Jung, C.G.; Kim, H.J.; Kawaguchi, M.; Khanna, K.K.; Hida, H.; Asai, K.; Nishino, H.; Miura, Y. Homeotic factor ATBF1 induces the cell cycle arrest associated with neuronal differentiation. Development 2005, 132, 5137–5145. [Google Scholar] [CrossRef]
- Sun, X.; Fu, X.; Li, J.; Xing, C.; Martin, D.W.; Zhang, H.H.; Chen, Z.; Dong, J.T. Heterozygous deletion of Atbf1 by the Cre-loxP system in mice causes preweaning mortality. Genesis 2012, 50, 819–827. [Google Scholar] [CrossRef]
- Zhao, D.; Han, X.; Huang, L.; Wang, J.; Zhang, X.; Jeon, J.H.; Zhao, Q.; Dong, J.T. Transcription factor ZFHX3 regulates calcium influx in mammary epithelial cells in part via the TRPV6 calcium channel. Biochem. Biophys. Res. Commun. 2019, 519, 366–371. [Google Scholar] [CrossRef] [PubMed]
- Li, M.; Zhang, A.; Zheng, Y.; Li, J.; Zhao, J. ATBF1 Participates in Dual Functions of TGF-beta via Regulation of Gene Expression and Protein Translocalization. Biomolecules 2020, 10, 807. [Google Scholar] [CrossRef] [PubMed]
- Sun, X.; Zhou, Y.; Otto, K.B.; Wang, M.; Chen, C.; Zhou, W.; Subramanian, K.; Vertino, P.M.; Dong, J.T. Infrequent mutation of ATBF1 in human breast cancer. J. Cancer Res. Clin. Oncol. 2007, 133, 103–105. [Google Scholar] [CrossRef] [PubMed]
- Zhang, Z.; Yamashita, H.; Toyama, T.; Sugiura, H.; Ando, Y.; Mita, K.; Hamaguchi, M.; Kawaguchi, M.; Miura, Y.; Iwase, H. ATBF1-a messenger RNA expression is correlated with better prognosis in breast cancer. Clin. Cancer Res. 2005, 11, 193–198. [Google Scholar] [CrossRef]
- Tan, P.H.; Ellis, I.; Allison, K.; Brogi, E.; Fox, S.B.; Lakhani, S.; Lazar, A.J.; Morris, E.A.; Sahin, A.; Salgado, R.; et al. The 2019 World Health Organization classification of tumours of the breast. Histopathology 2020, 77, 181–185. [Google Scholar] [CrossRef]
- Consortium, A.P.G. AACR Project GENIE: Powering Precision Medicine through an International Consortium. Cancer Discov. 2017, 7, 818–831. [Google Scholar] [CrossRef]
- Dawson, P.J.; Wolman, S.R.; Tait, L.; Heppner, G.H.; Miller, F.R. MCF10AT: A model for the evolution of cancer from proliferative breast disease. Am. J. Pathol. 1996, 148, 313–319. [Google Scholar]
- McKeen Polizzotti, L.; Oztan, B.; Bjornsson, C.S.; Shubert, K.R.; Yener, B.; Plopper, G.E. Novel image analysis approach quantifies morphological characteristics of 3D breast culture acini with varying metastatic potentials. J. Biomed. Biotechnol. 2012, 2012, 102036. [Google Scholar] [CrossRef]
- Ribeiro, A.S.; Paredes, J. P-Cadherin Linking Breast Cancer Stem Cells and Invasion: A Promising Marker to Identify an “Intermediate/Metastable” EMT State. Front. Oncol. 2014, 4, 371. [Google Scholar] [CrossRef]
- Bachman, K.E.; Argani, P.; Samuels, Y.; Silliman, N.; Ptak, J.; Szabo, S.; Konishi, H.; Karakas, B.; Blair, B.G.; Lin, C.; et al. The PIK3CA gene is mutated with high frequency in human breast cancers. Cancer Biol. 2004, 3, 772–775. [Google Scholar] [CrossRef]
- Samuels, Y.; Wang, Z.; Bardelli, A.; Silliman, N.; Ptak, J.; Szabo, S.; Yan, H.; Gazdar, A.; Powell, S.M.; Riggins, G.J.; et al. High frequency of mutations of the PIK3CA gene in human cancers. Science 2004, 304, 554. [Google Scholar] [CrossRef] [PubMed]
- Stemke-Hale, K.; Gonzalez-Angulo, A.M.; Lluch, A.; Neve, R.M.; Kuo, W.L.; Davies, M.; Carey, M.; Hu, Z.; Guan, Y.; Sahin, A.; et al. An integrative genomic and proteomic analysis of PIK3CA, PTEN, and AKT mutations in breast cancer. Cancer Res. 2008, 68, 6084–6091. [Google Scholar] [CrossRef] [PubMed]
- Li, M.; Fu, X.; Ma, G.; Sun, X.; Dong, X.; Nagy, T.; Xing, C.; Li, J.; Dong, J.T. Atbf1 regulates pubertal mammary gland development likely by inhibiting the pro-proliferative function of estrogen-ER signaling. PLoS ONE 2012, 7, e51283. [Google Scholar] [CrossRef]
- Sun, X.; Xing, C.; Fu, X.; Li, J.; Zhang, B.; Frierson, H.F., Jr.; Dong, J.T. Additive Effect of Zfhx3/Atbf1 and Pten Deletion on Mouse Prostatic Tumorigenesis. J. Genet Genom. 2015, 42, 373–382. [Google Scholar] [CrossRef] [PubMed]
- Qi, Y.; Liu, J.; Chao, J.; Greer, P.A.; Li, S. PTEN dephosphorylates Abi1 to promote epithelial morphogenesis. J. Cell Biol. 2020, 219. [Google Scholar] [CrossRef]
- Molinie, N.; Gautreau, A. The Arp2/3 Regulatory System and Its Deregulation in Cancer. Physiol. Rev. 2018, 98, 215–238. [Google Scholar] [CrossRef]
- Bhalla, A.; Manjari, M.; Kahlon, S.K.; Kumar, P.; Kalra, N. Cytokeratin 5/6 expression in benign and malignant breast lesions. Indian J. Pathol. Microbiol. 2010, 53, 676–680. [Google Scholar] [CrossRef]
- Sarrio, D.; Rodriguez-Pinilla, S.M.; Hardisson, D.; Cano, A.; Moreno-Bueno, G.; Palacios, J. Epithelial-mesenchymal transition in breast cancer relates to the basal-like phenotype. Cancer Res. 2008, 68, 989–997. [Google Scholar] [CrossRef]
- Chen, B.J.; Wu, J.S.; Tang, Y.J.; Tang, Y.L.; Liang, X.H. What makes leader cells arise: Intrinsic properties and support from neighboring cells. J. Cell. Physiol. 2020, 235, 8983–8995. [Google Scholar] [CrossRef]
- Vilchez Mercedes, S.A.; Bocci, F.; Levine, H.; Onuchic, J.N.; Jolly, M.K.; Wong, P.K. Decoding leader cells in collective cancer invasion. Nat. Rev. Cancer 2021, 21, 592–604. [Google Scholar] [CrossRef]
- Usman, S.; Waseem, N.H.; Nguyen, T.K.N.; Mohsin, S.; Jamal, A.; Teh, M.T.; Waseem, A. Vimentin Is at the Heart of Epithelial Mesenchymal Transition (EMT) Mediated Metastasis. Cancers 2021, 13, 4985. [Google Scholar] [CrossRef]
- Lee, R.M.; Vitolo, M.I.; Losert, W.; Martin, S.S. Distinct roles of tumor associated mutations in collective cell migration. Sci. Rep. 2021, 11, 10291. [Google Scholar] [CrossRef] [PubMed]
- Thompson, K.N.; Whipple, R.A.; Yoon, J.R.; Lipsky, M.; Charpentier, M.S.; Boggs, A.E.; Chakrabarti, K.R.; Bhandary, L.; Hessler, L.K.; Martin, S.S.; et al. The combinatorial activation of the PI3K and Ras/MAPK pathways is sufficient for aggressive tumor formation, while individual pathway activation supports cell persistence. Oncotarget 2015, 6, 35231–35246. [Google Scholar] [CrossRef] [PubMed]
- Yankaskas, C.L.; Thompson, K.N.; Paul, C.D.; Vitolo, M.I.; Mistriotis, P.; Mahendra, A.; Bajpai, V.K.; Shea, D.J.; Manto, K.M.; Chai, A.C.; et al. A microfluidic assay for the quantification of the metastatic propensity of breast cancer specimens. Nat. Biomed. Eng. 2019, 3, 452–465. [Google Scholar] [CrossRef] [PubMed]
- Van der Auwera, G.A.; Carneiro, M.O.; Hartl, C.; Poplin, R.; Del Angel, G.; Levy-Moonshine, A.; Jordan, T.; Shakir, K.; Roazen, D.; Thibault, J.; et al. From FastQ data to high confidence variant calls: The Genome Analysis Toolkit best practices pipeline. Curr. Protoc. Bioinform. 2013, 43, 11.10.1–11.10.3. [Google Scholar] [CrossRef]
- Wang, K.; Li, M.; Hakonarson, H. ANNOVAR: Functional annotation of genetic variants from high-throughput sequencing data. Nucleic Acids Res. 2010, 38, e164. [Google Scholar] [CrossRef]
- Du, F.; Zhao, X.; Fan, D. Soft Agar Colony Formation Assay as a Hallmark of Carcinogenesis. BioProtocol 2017, 7, e2351. [Google Scholar] [CrossRef]
- Gorelik, R.; Gautreau, A. Quantitative and unbiased analysis of directional persistence in cell migration. Nat. Protoc. 2014, 9, 1931–1943. [Google Scholar] [CrossRef]
- Polesskaya, A.; Boutillon, A.; Wang, Y.; Lavielle, M.; Vacher, S.; Schnitzler, A.; Molinie, N.; Rocques, N.; Fokin, A.; Bièche, I. CYFIP2 containing WAVE complexes inhibit cell migration. bioRxiv 2020. [Google Scholar] [CrossRef]
- Thielicke, W.; Sonntag, R. Particle Image Velocimetry for MATLAB: Accuracy and Enhanced Algorithms in PIVlab. J. Open Res. Softw. 2021, 9, 12. [Google Scholar] [CrossRef]
- Thielicke, W.; Stamhuis, E.J. PIVlab—Towards User-friendly, Affordable and Accurate Digital Particle Image Velocimetry in MATLAB. J. Open Res. Softw. 2014, 2, e30. [Google Scholar] [CrossRef]
- Deforet, M.; Parrini, M.C.; Petitjean, L.; Biondini, M.; Buguin, A.; Camonis, J.; Silberzan, P.J.N.m. Automated velocity mapping of migrating cell populations (AVeMap). Nat. Methods 2012, 9, 1081–1083. [Google Scholar] [CrossRef] [PubMed]


Disclaimer/Publisher’s Note: The statements, opinions and data contained in all publications are solely those of the individual author(s) and contributor(s) and not of MDPI and/or the editor(s). MDPI and/or the editor(s) disclaim responsibility for any injury to people or property resulting from any ideas, methods, instructions or products referred to in the content. |
© 2022 by the authors. Licensee MDPI, Basel, Switzerland. This article is an open access article distributed under the terms and conditions of the Creative Commons Attribution (CC BY) license (https://creativecommons.org/licenses/by/4.0/).
Share and Cite
Dayoub, A.; Fokin, A.I.; Lomakina, M.E.; James, J.; Plays, M.; Jacquin, T.; Novikov, N.M.; Vorobyov, R.S.; Schegoleva, A.A.; Rysenkova, K.D.; et al. Inactivation of PTEN and ZFHX3 in Mammary Epithelial Cells Alters Patterns of Collective Cell Migration. Int. J. Mol. Sci. 2023, 24, 313. https://doi.org/10.3390/ijms24010313
Dayoub A, Fokin AI, Lomakina ME, James J, Plays M, Jacquin T, Novikov NM, Vorobyov RS, Schegoleva AA, Rysenkova KD, et al. Inactivation of PTEN and ZFHX3 in Mammary Epithelial Cells Alters Patterns of Collective Cell Migration. International Journal of Molecular Sciences. 2023; 24(1):313. https://doi.org/10.3390/ijms24010313
Chicago/Turabian StyleDayoub, Ali, Artem I. Fokin, Maria E. Lomakina, John James, Marina Plays, Tom Jacquin, Nikita M. Novikov, Rostislav S. Vorobyov, Anastasia A. Schegoleva, Karina D. Rysenkova, and et al. 2023. "Inactivation of PTEN and ZFHX3 in Mammary Epithelial Cells Alters Patterns of Collective Cell Migration" International Journal of Molecular Sciences 24, no. 1: 313. https://doi.org/10.3390/ijms24010313
APA StyleDayoub, A., Fokin, A. I., Lomakina, M. E., James, J., Plays, M., Jacquin, T., Novikov, N. M., Vorobyov, R. S., Schegoleva, A. A., Rysenkova, K. D., Gaboriaud, J., Leonov, S. V., Denisov, E. V., Gautreau, A. M., & Alexandrova, A. Y. (2023). Inactivation of PTEN and ZFHX3 in Mammary Epithelial Cells Alters Patterns of Collective Cell Migration. International Journal of Molecular Sciences, 24(1), 313. https://doi.org/10.3390/ijms24010313