
Elevated Expression of the Immune Checkpoint Ligand CD276 (B7-H3) in Urothelial Carcinoma Cell Lines Correlates Negatively with the Cell Proliferation

 ,
,  ,
,  ,
,  ,
,  and
and 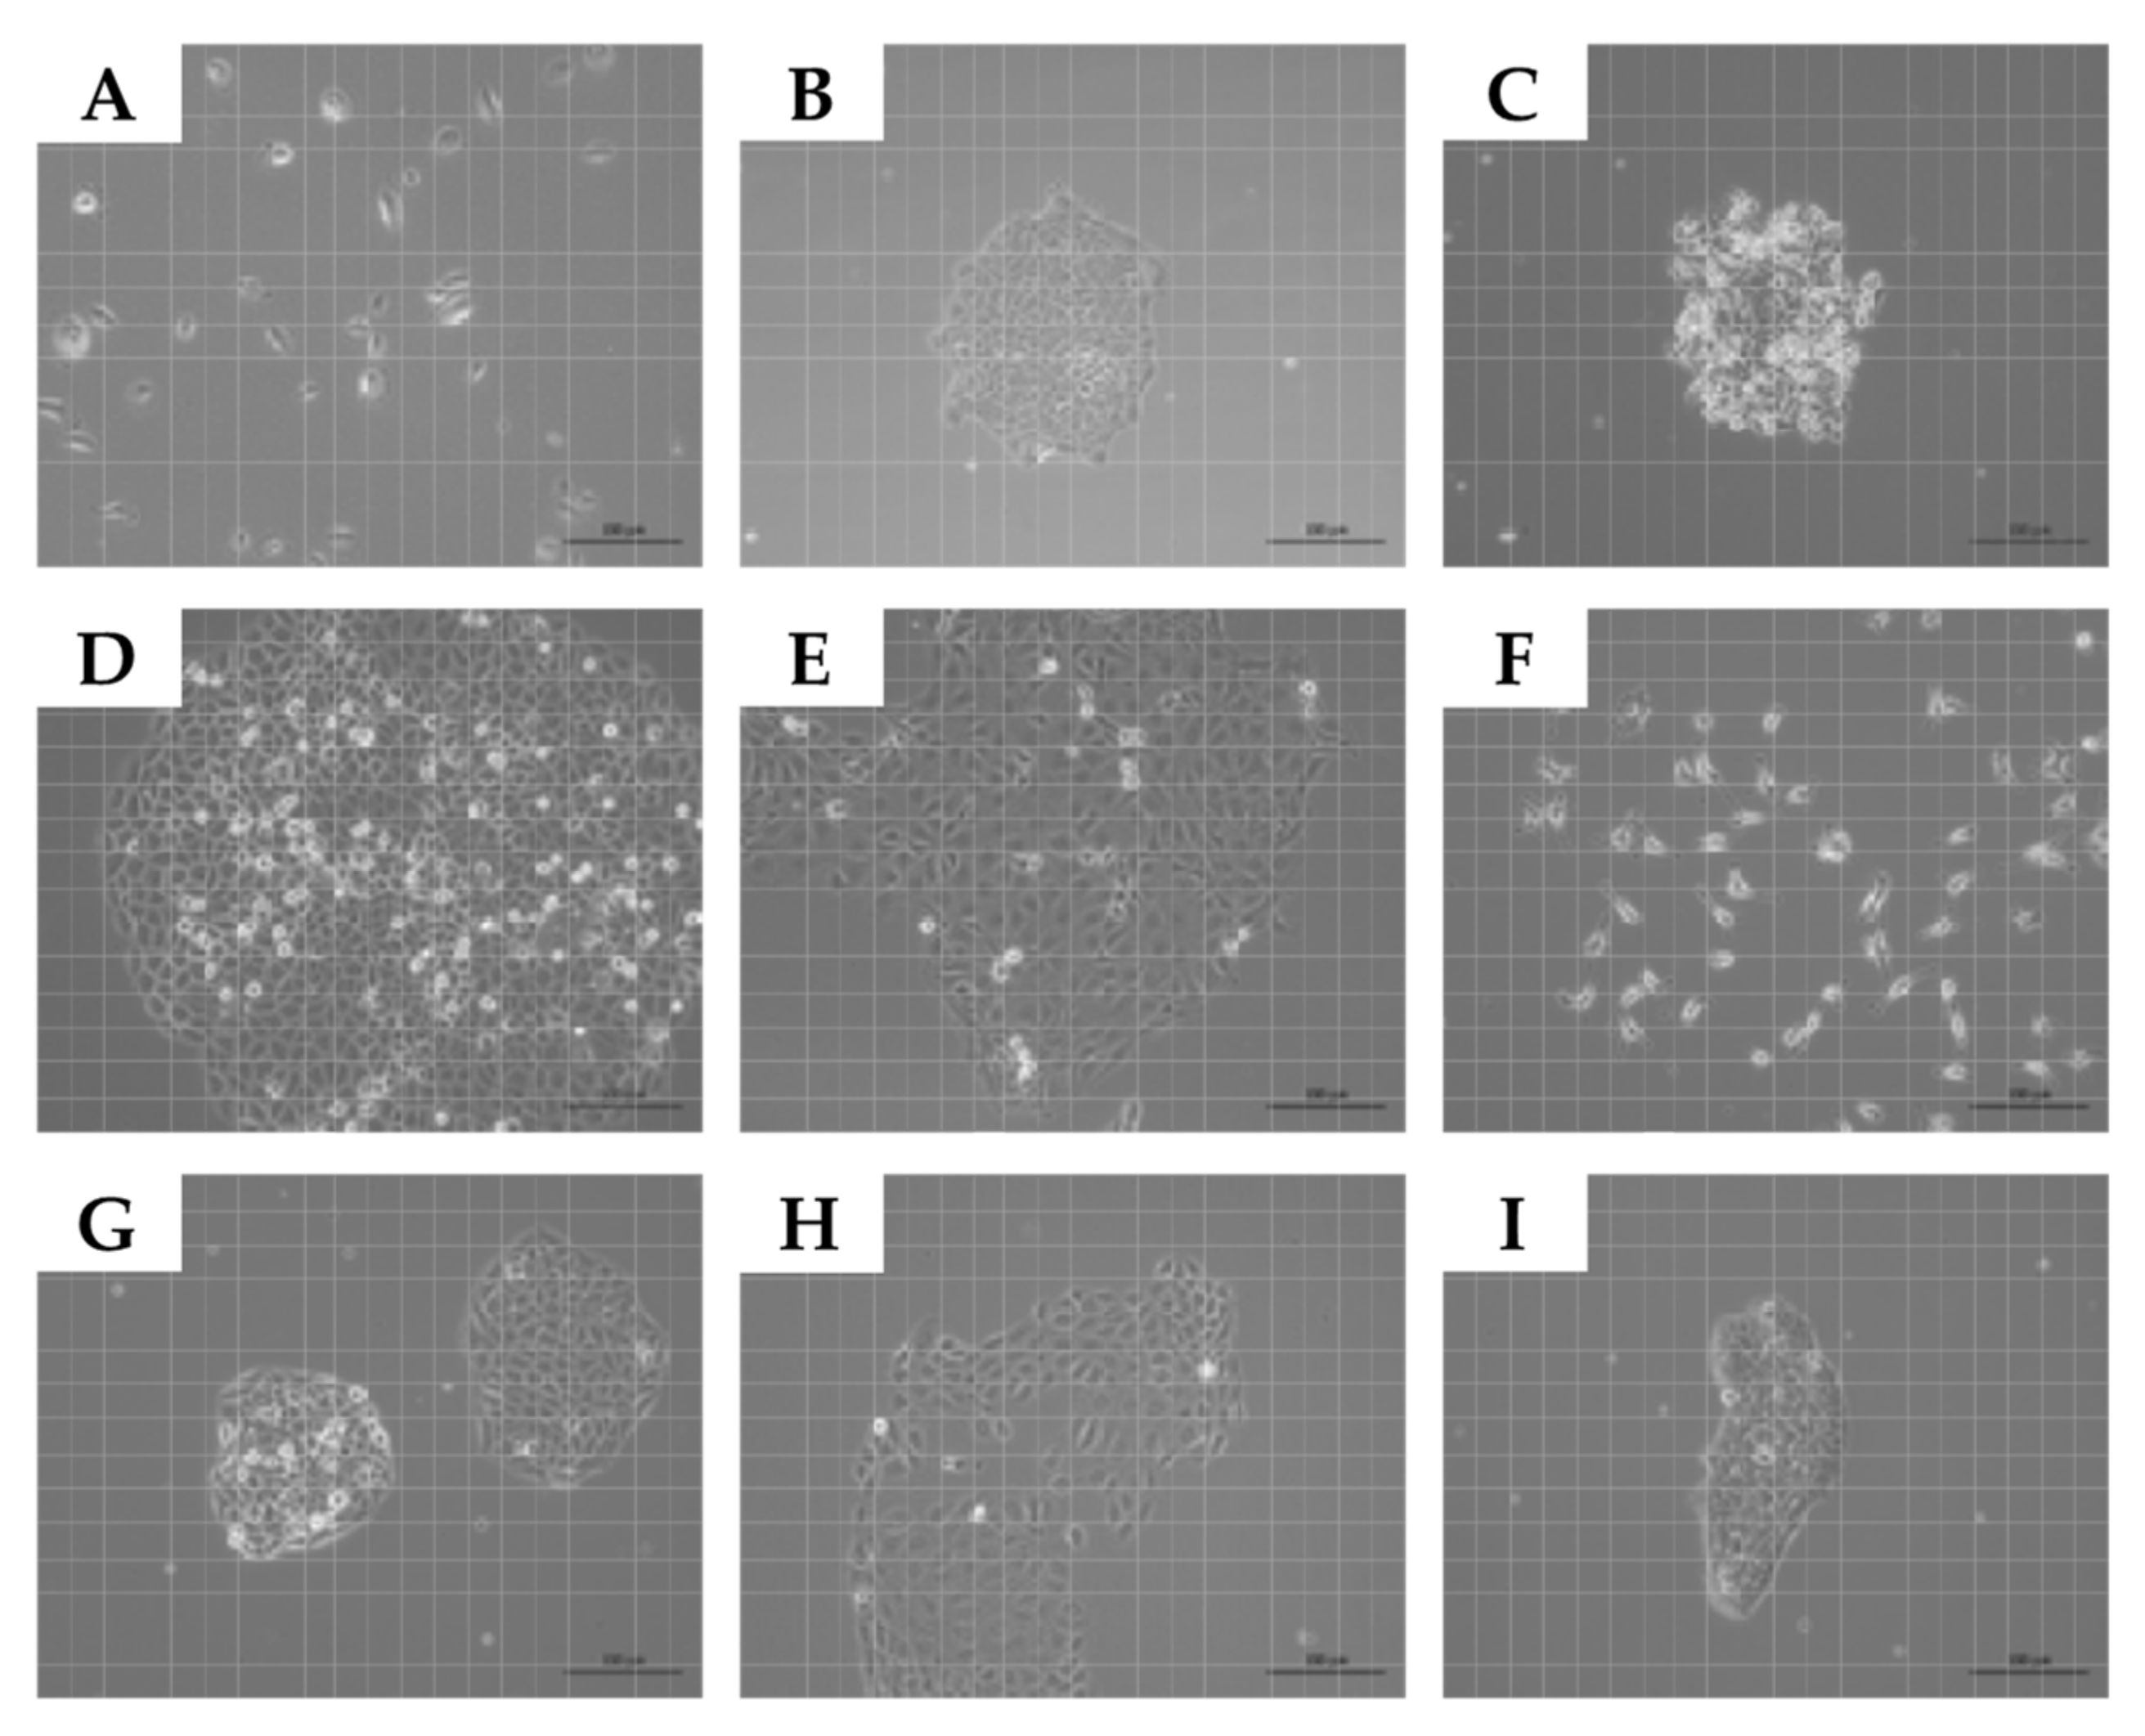
Abstract
:1. Introduction
2. Results
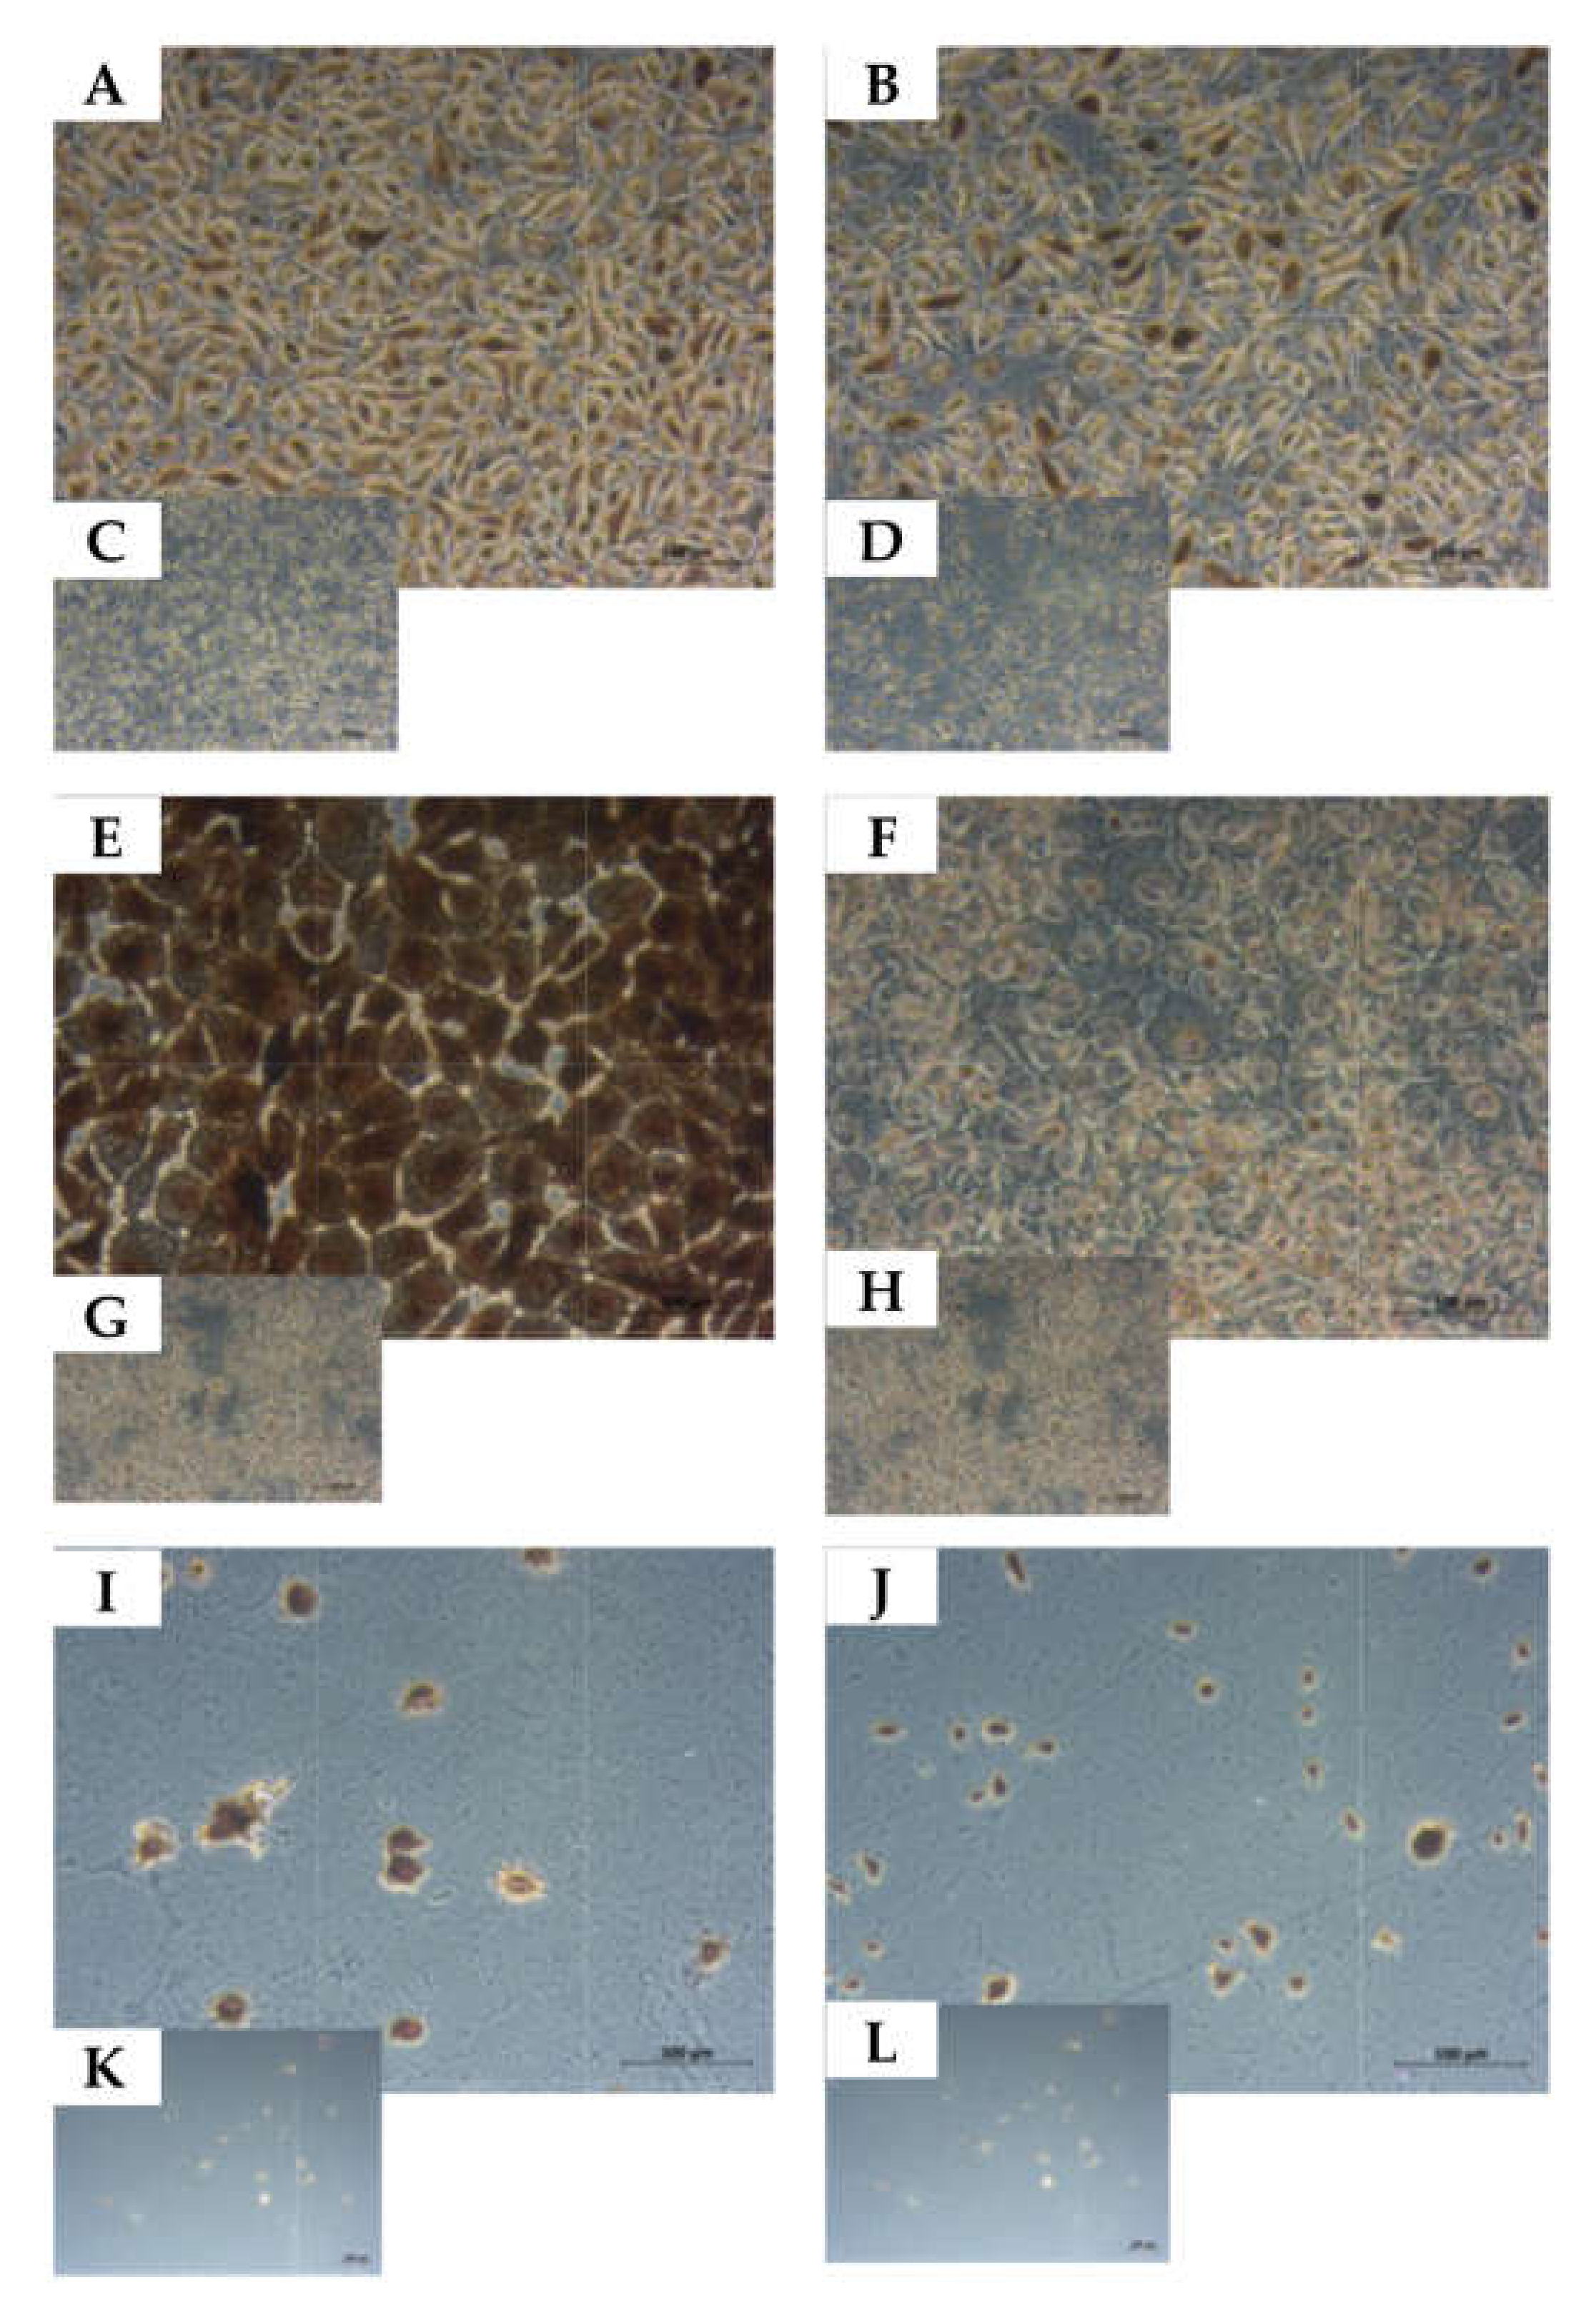
2.1. Expansion of Normal Urothelial Cells and Urothelial Cancer Cell Lines
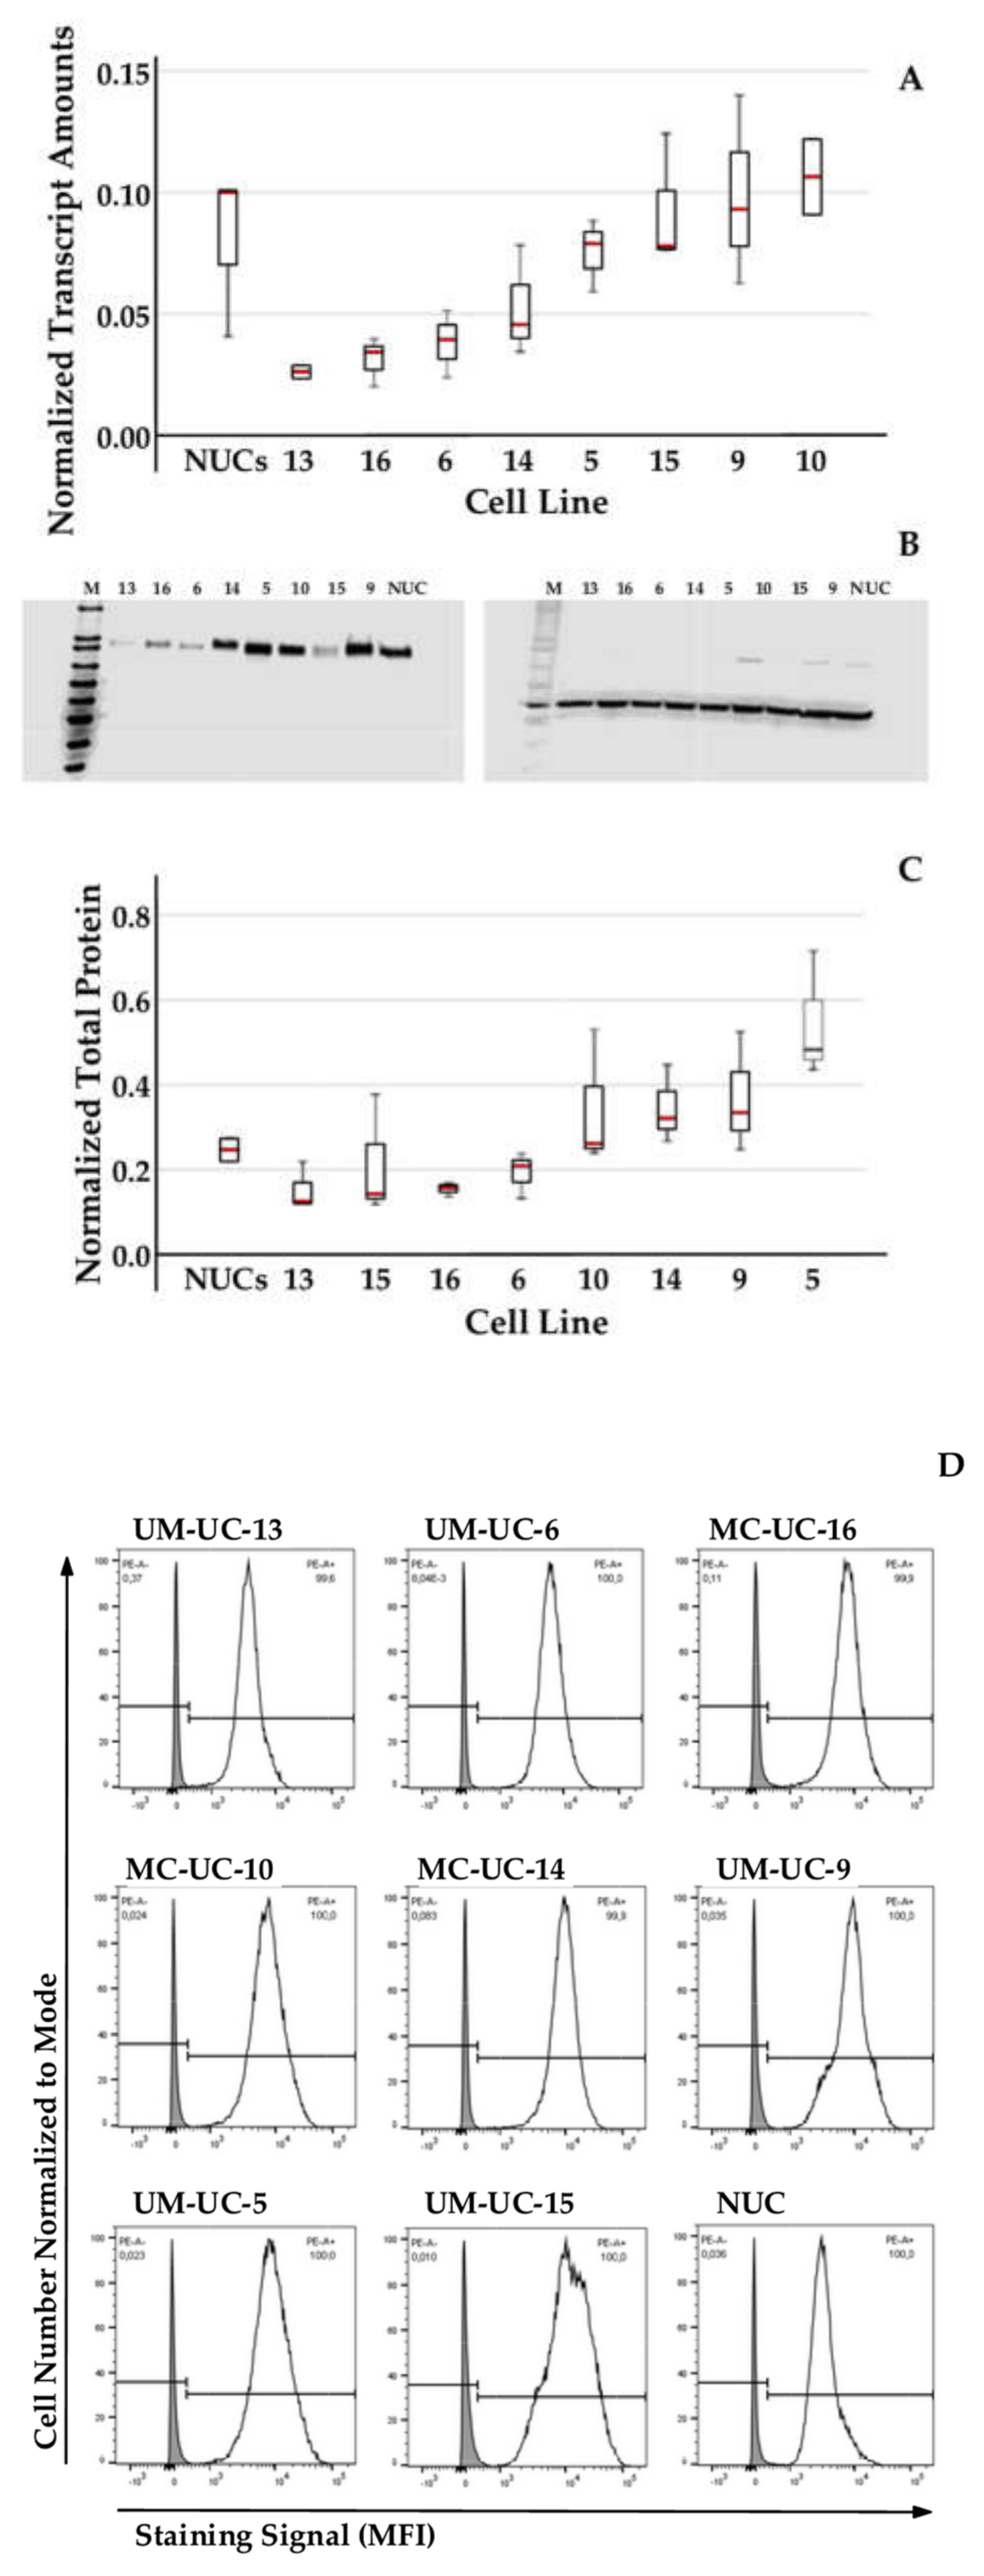
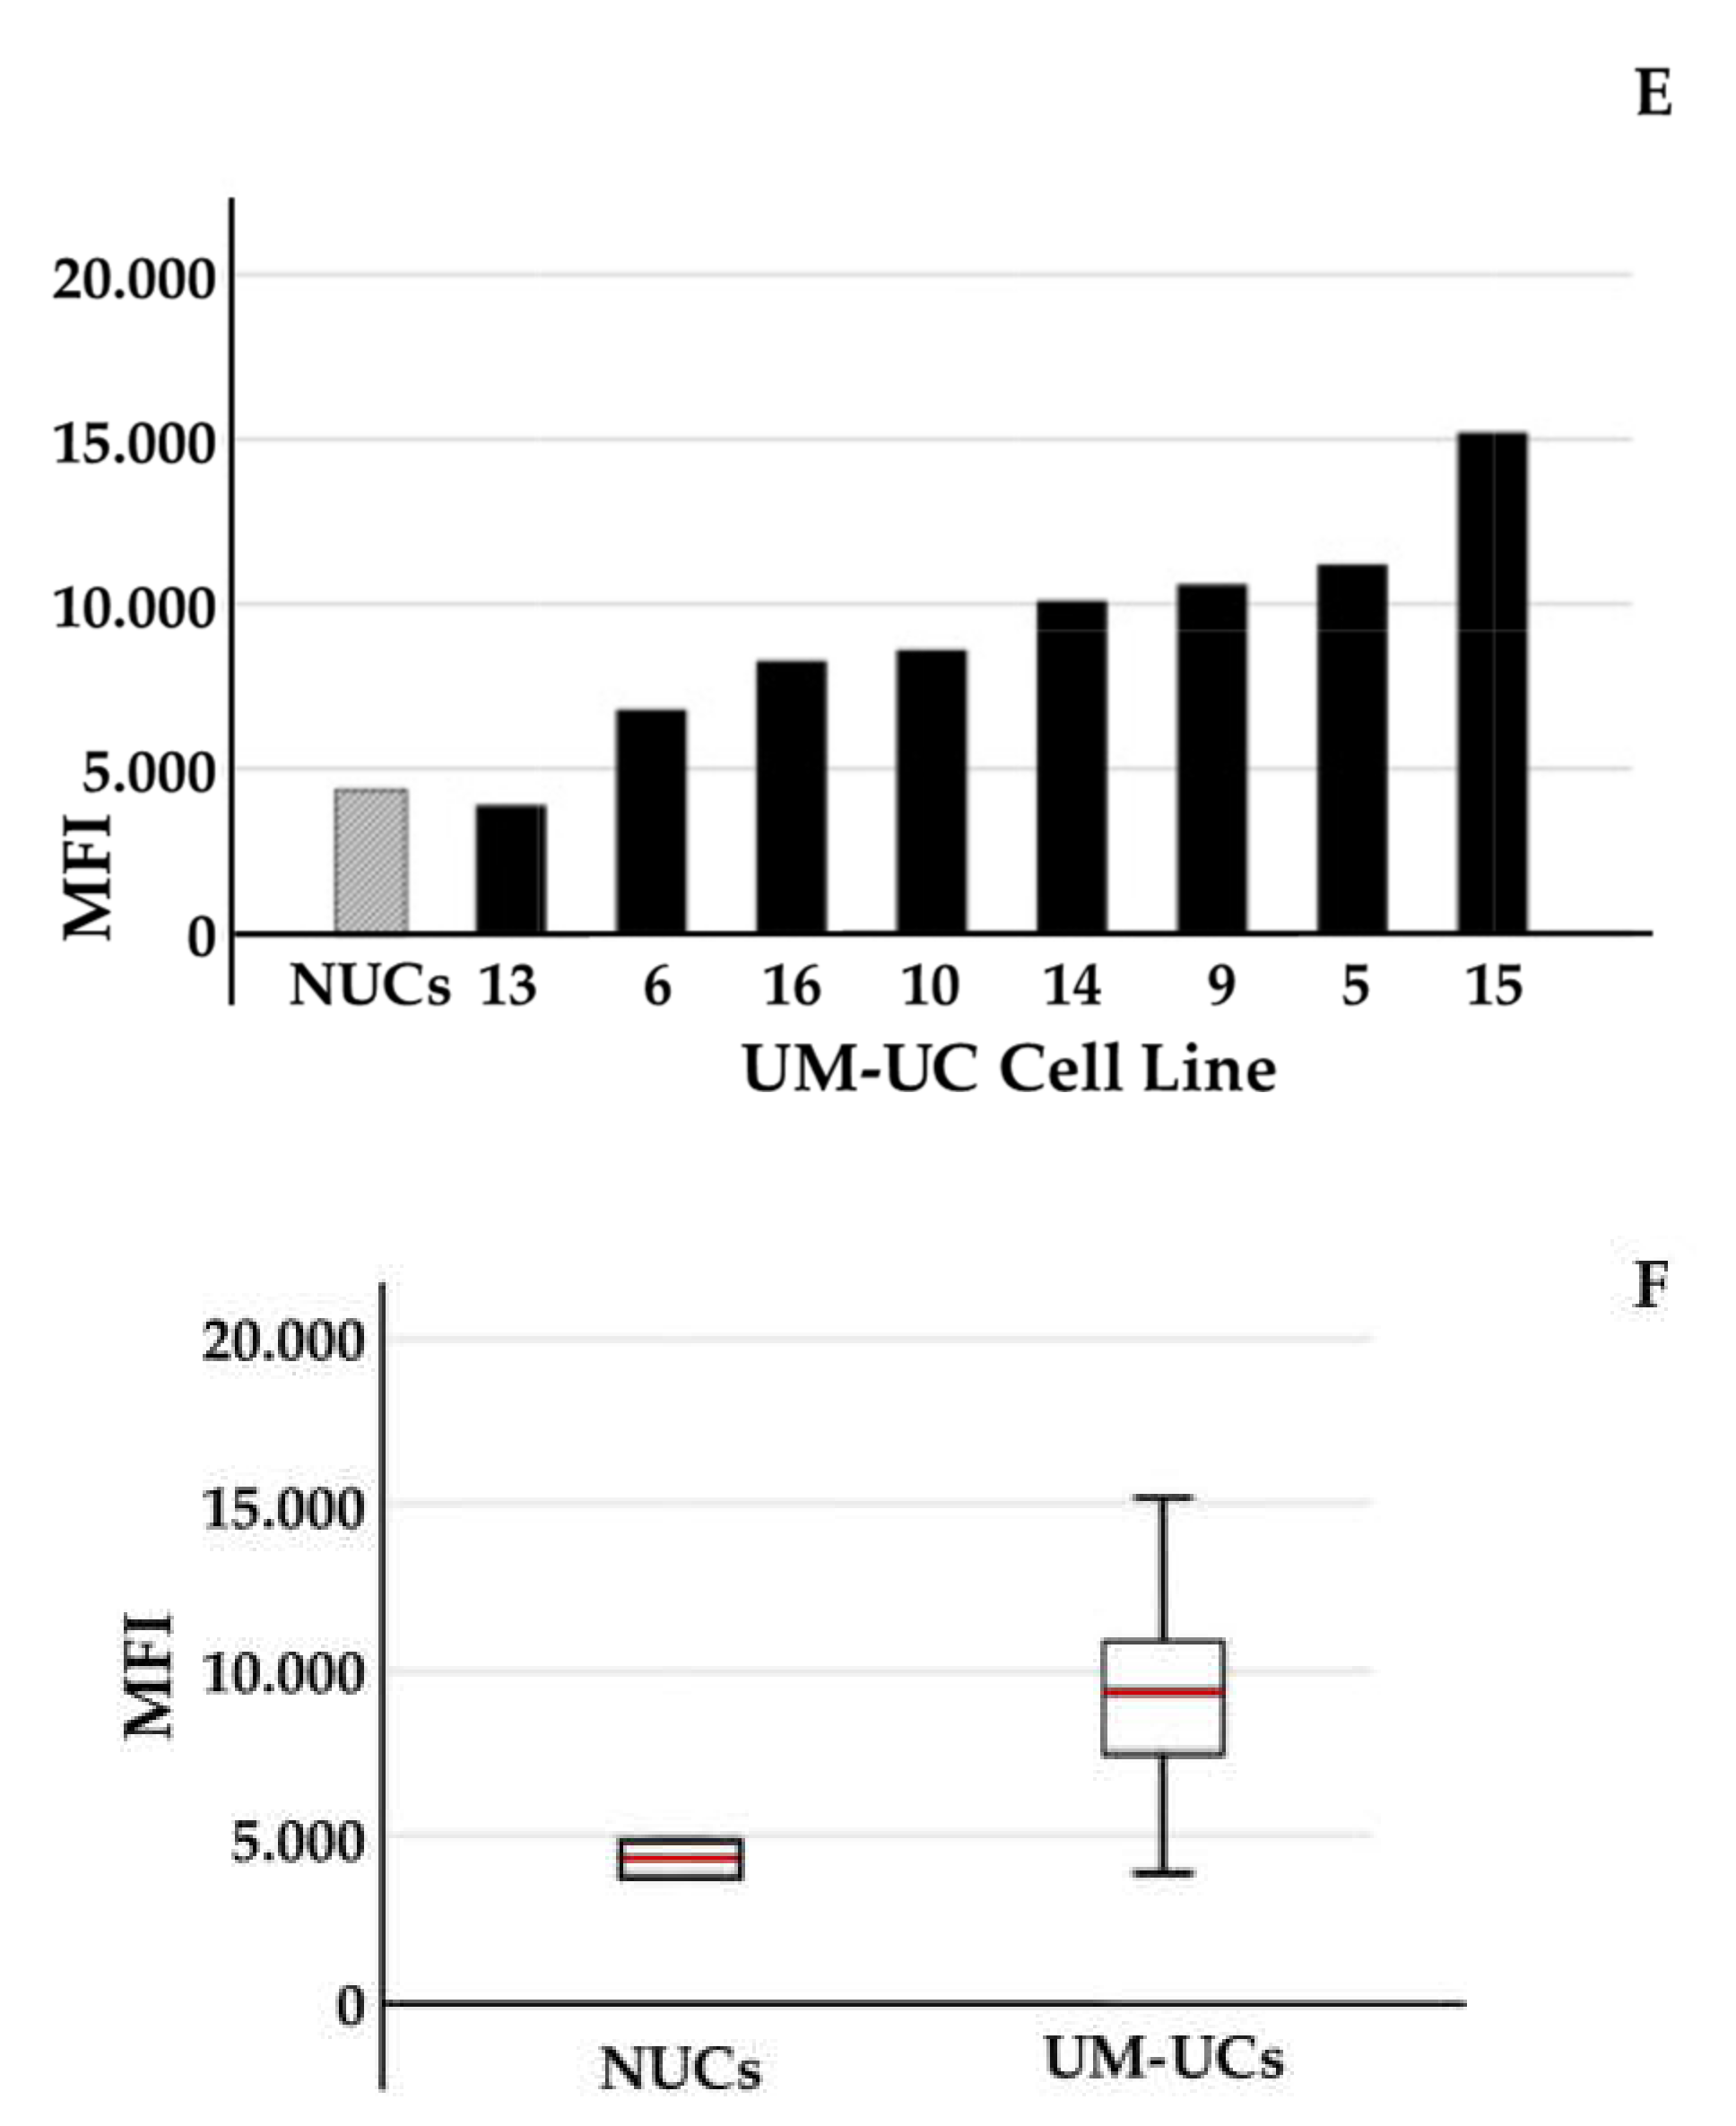
2.2. Expression of CD276 by Normal Urothelial Cells and Urothelial Cancer Cell Lines
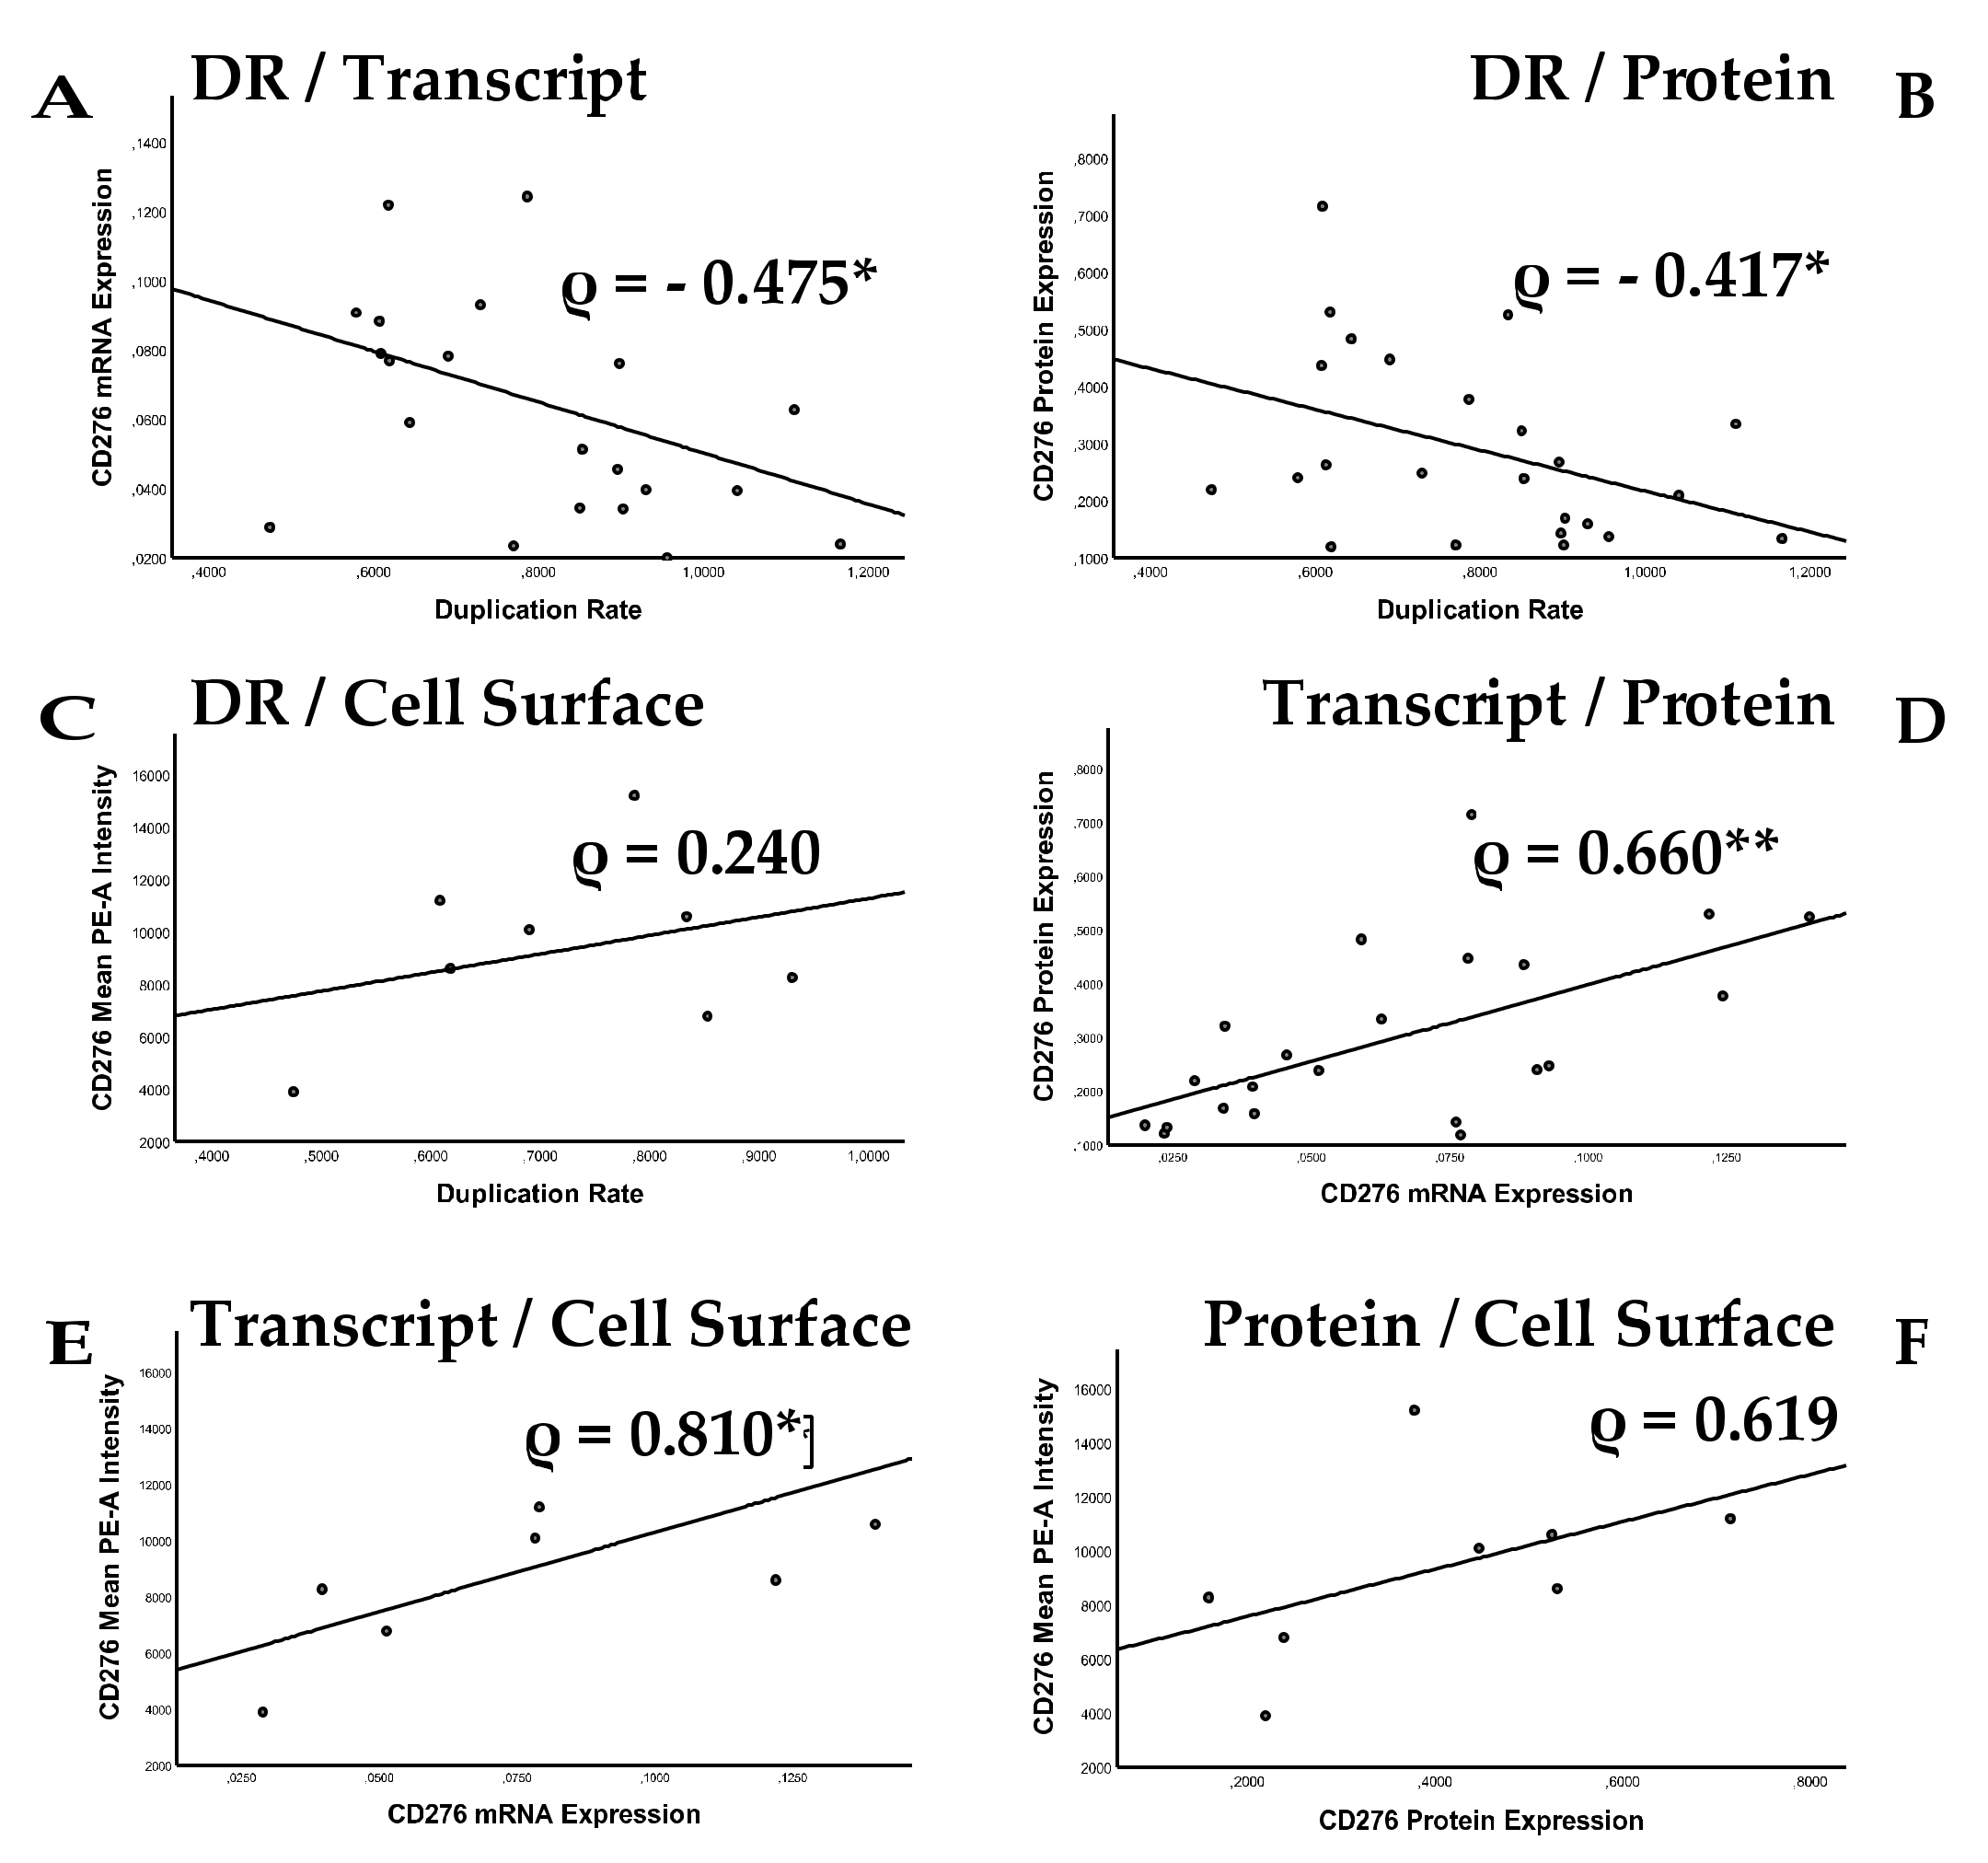
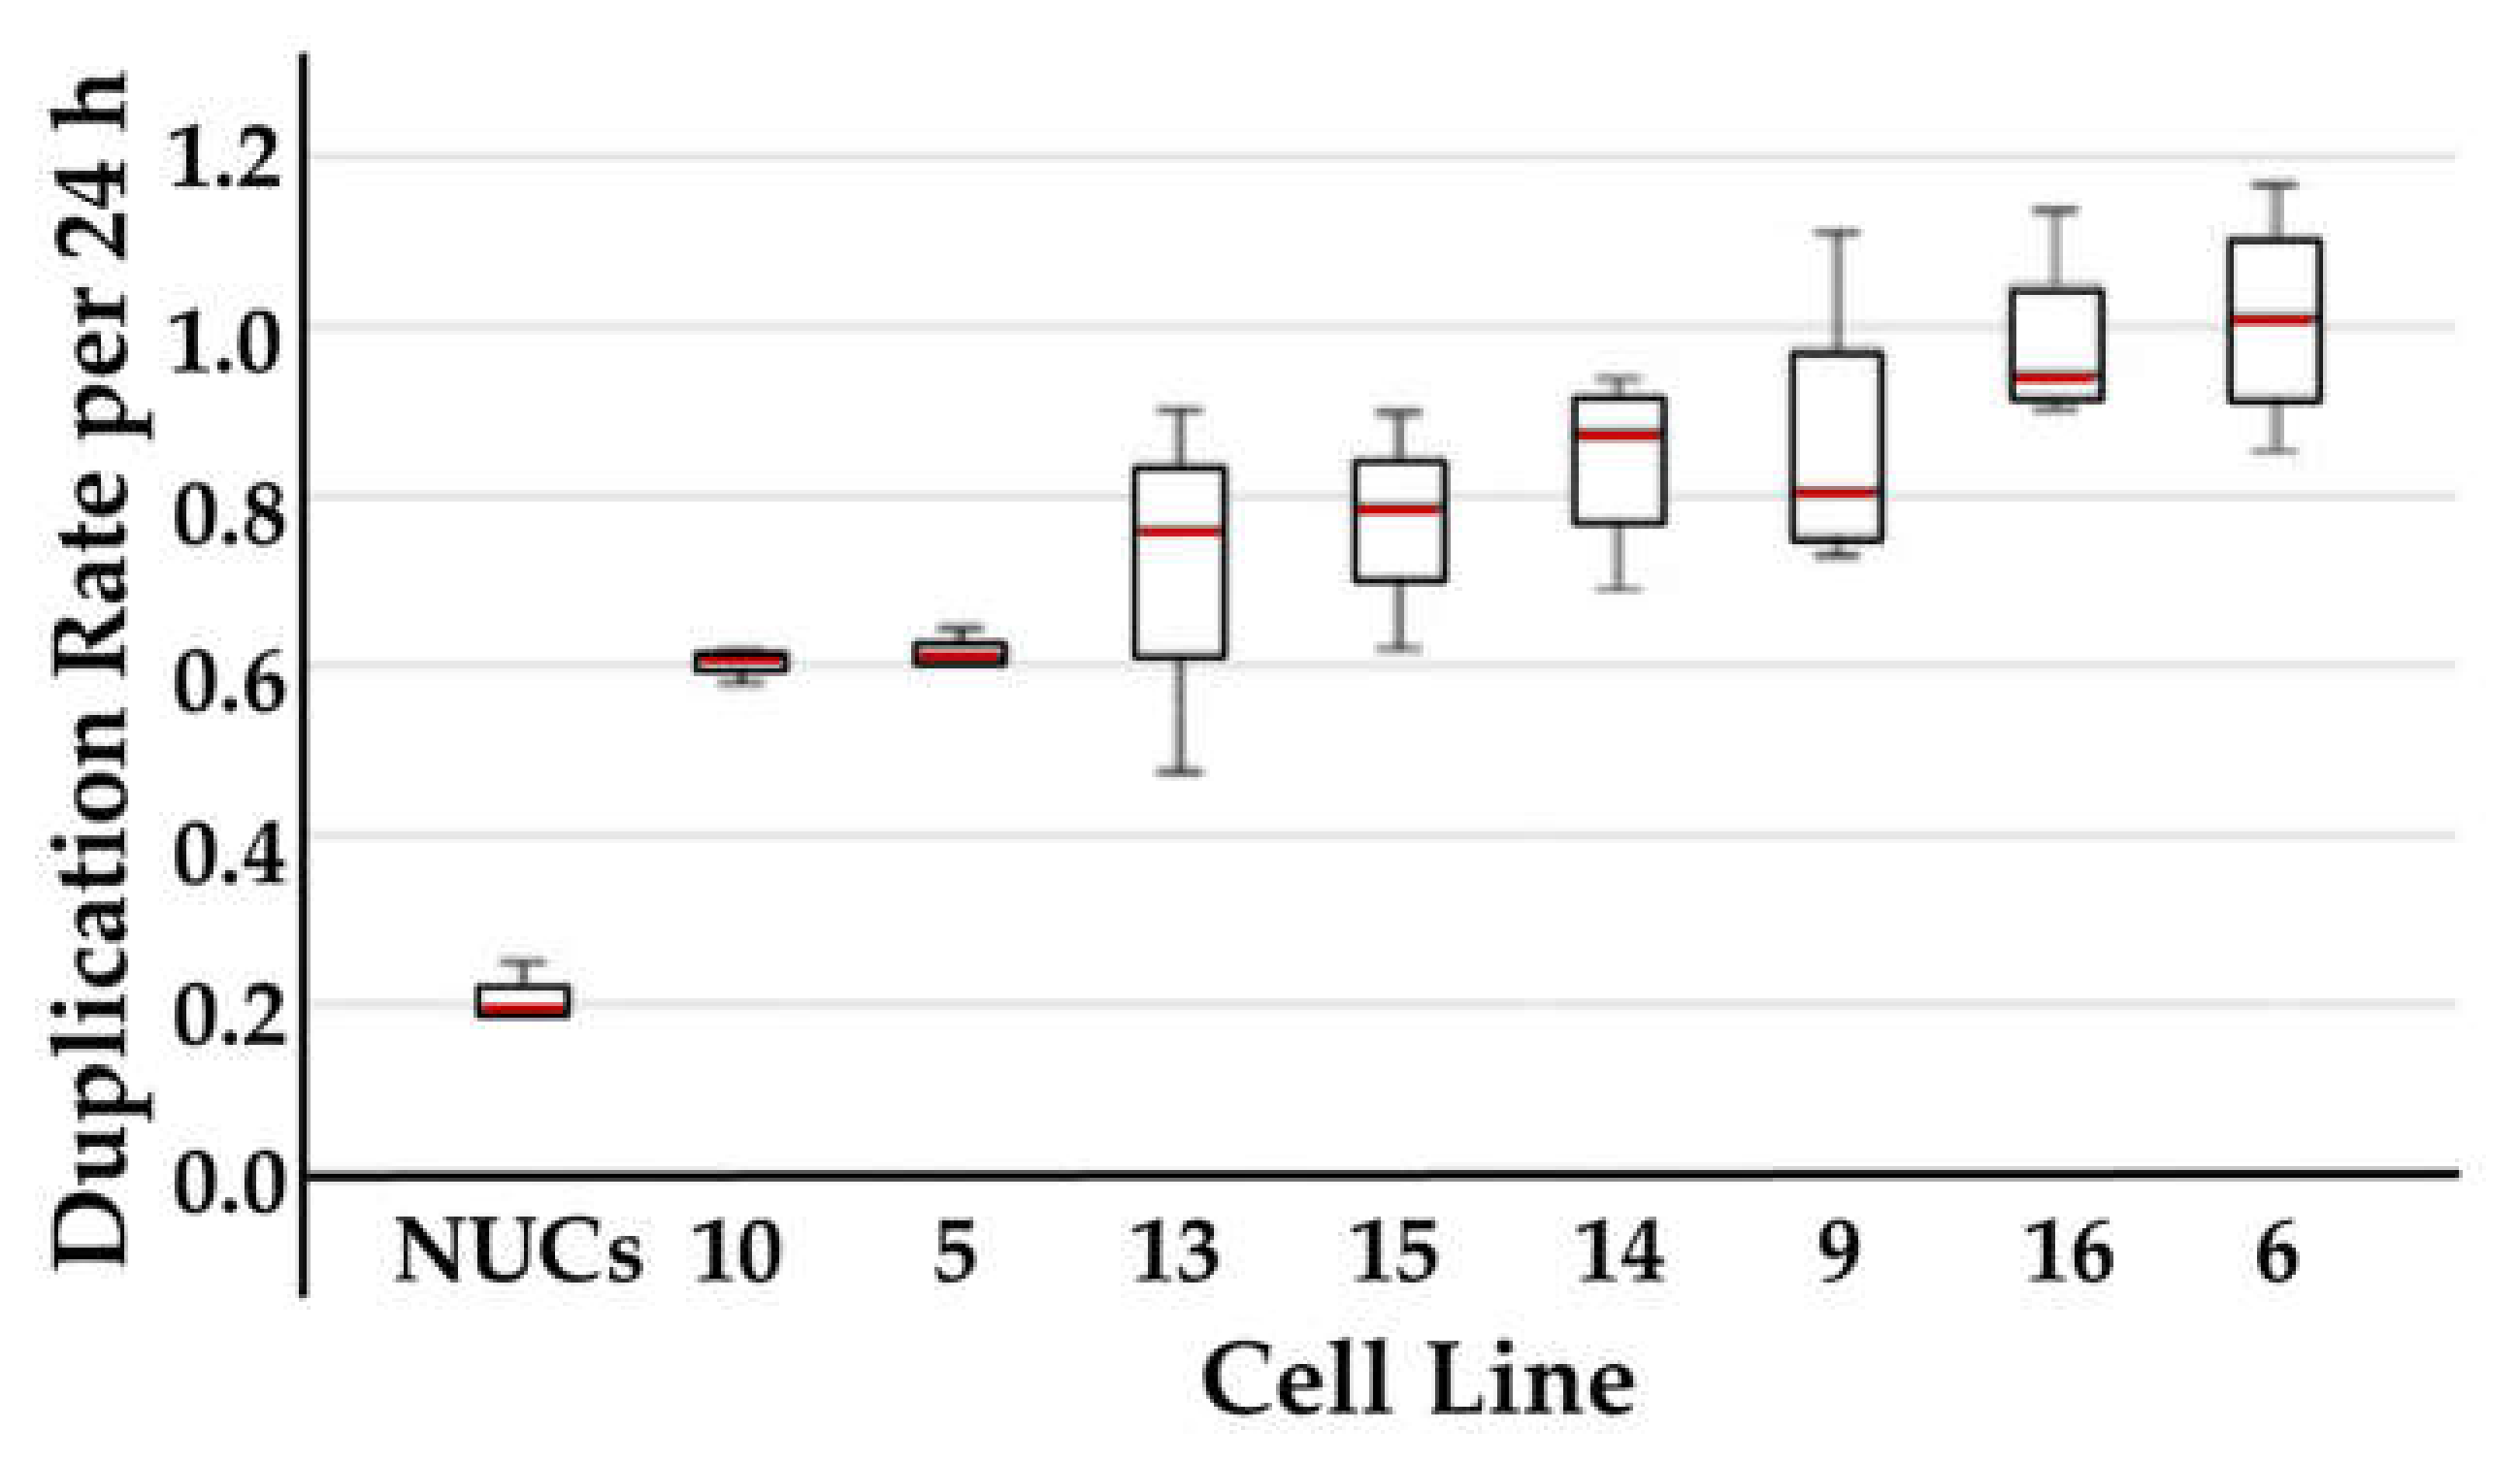
2.3. Analysis of Correlation between Cell Proliferation and CD276 Expression
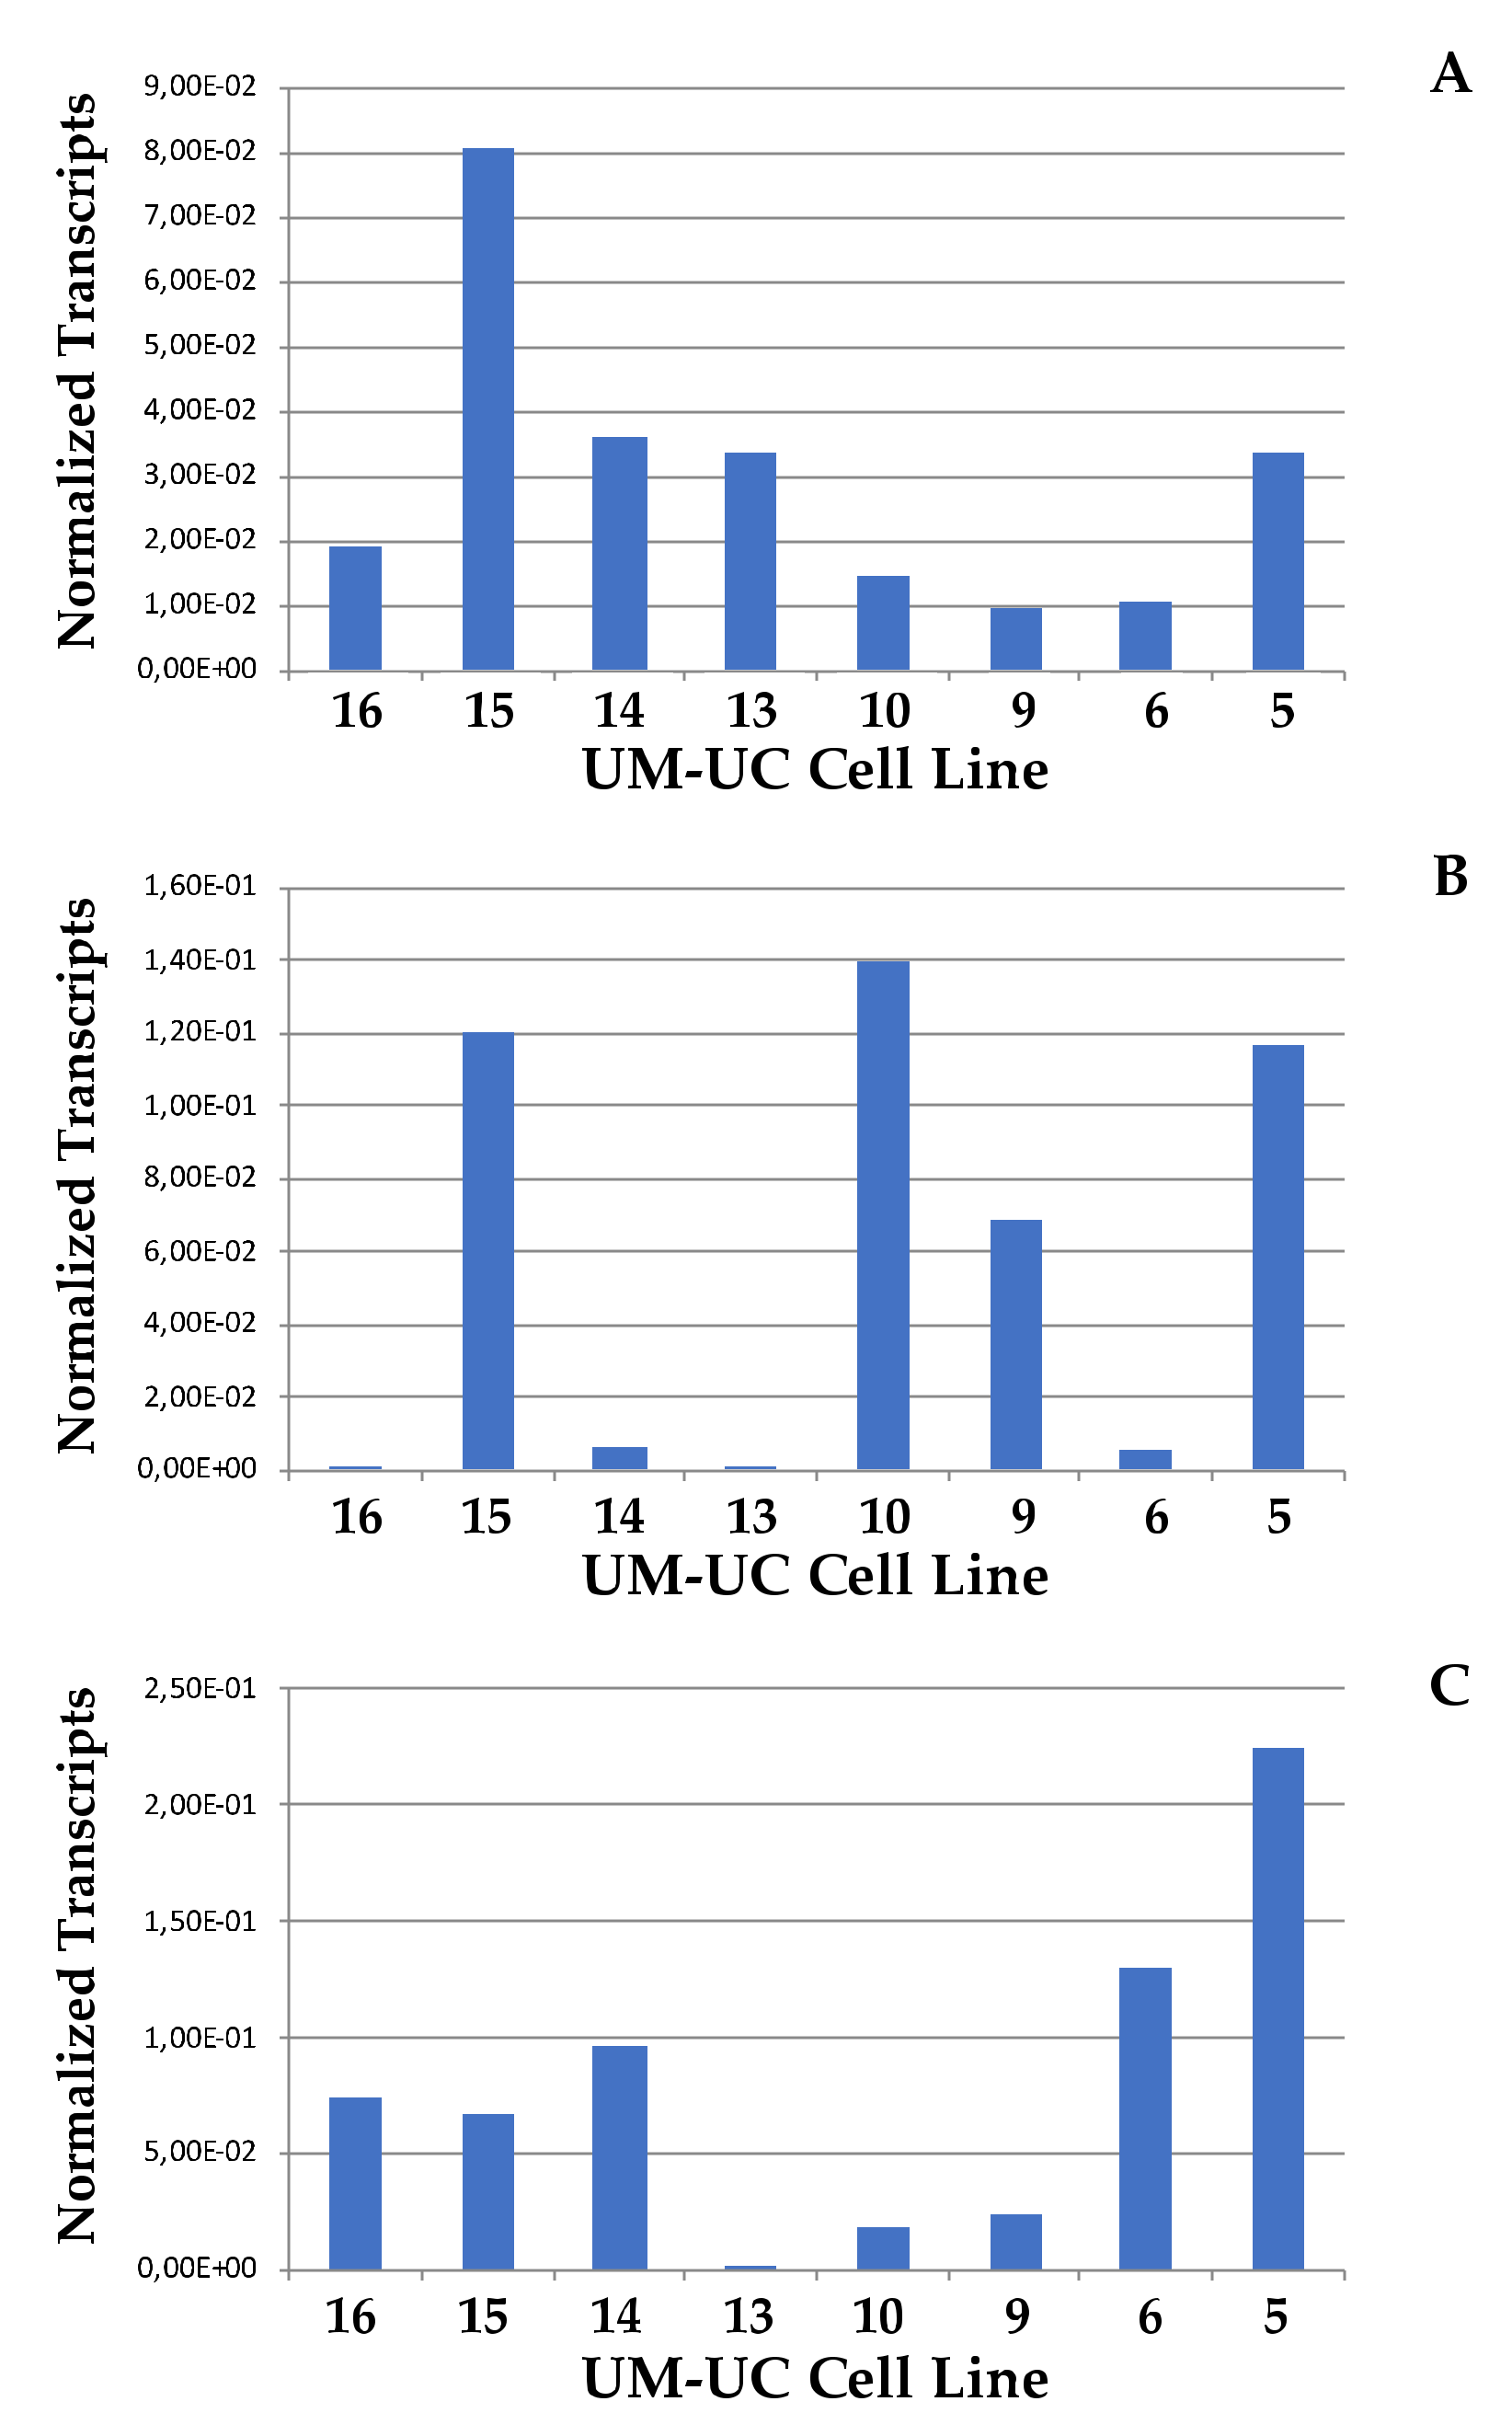
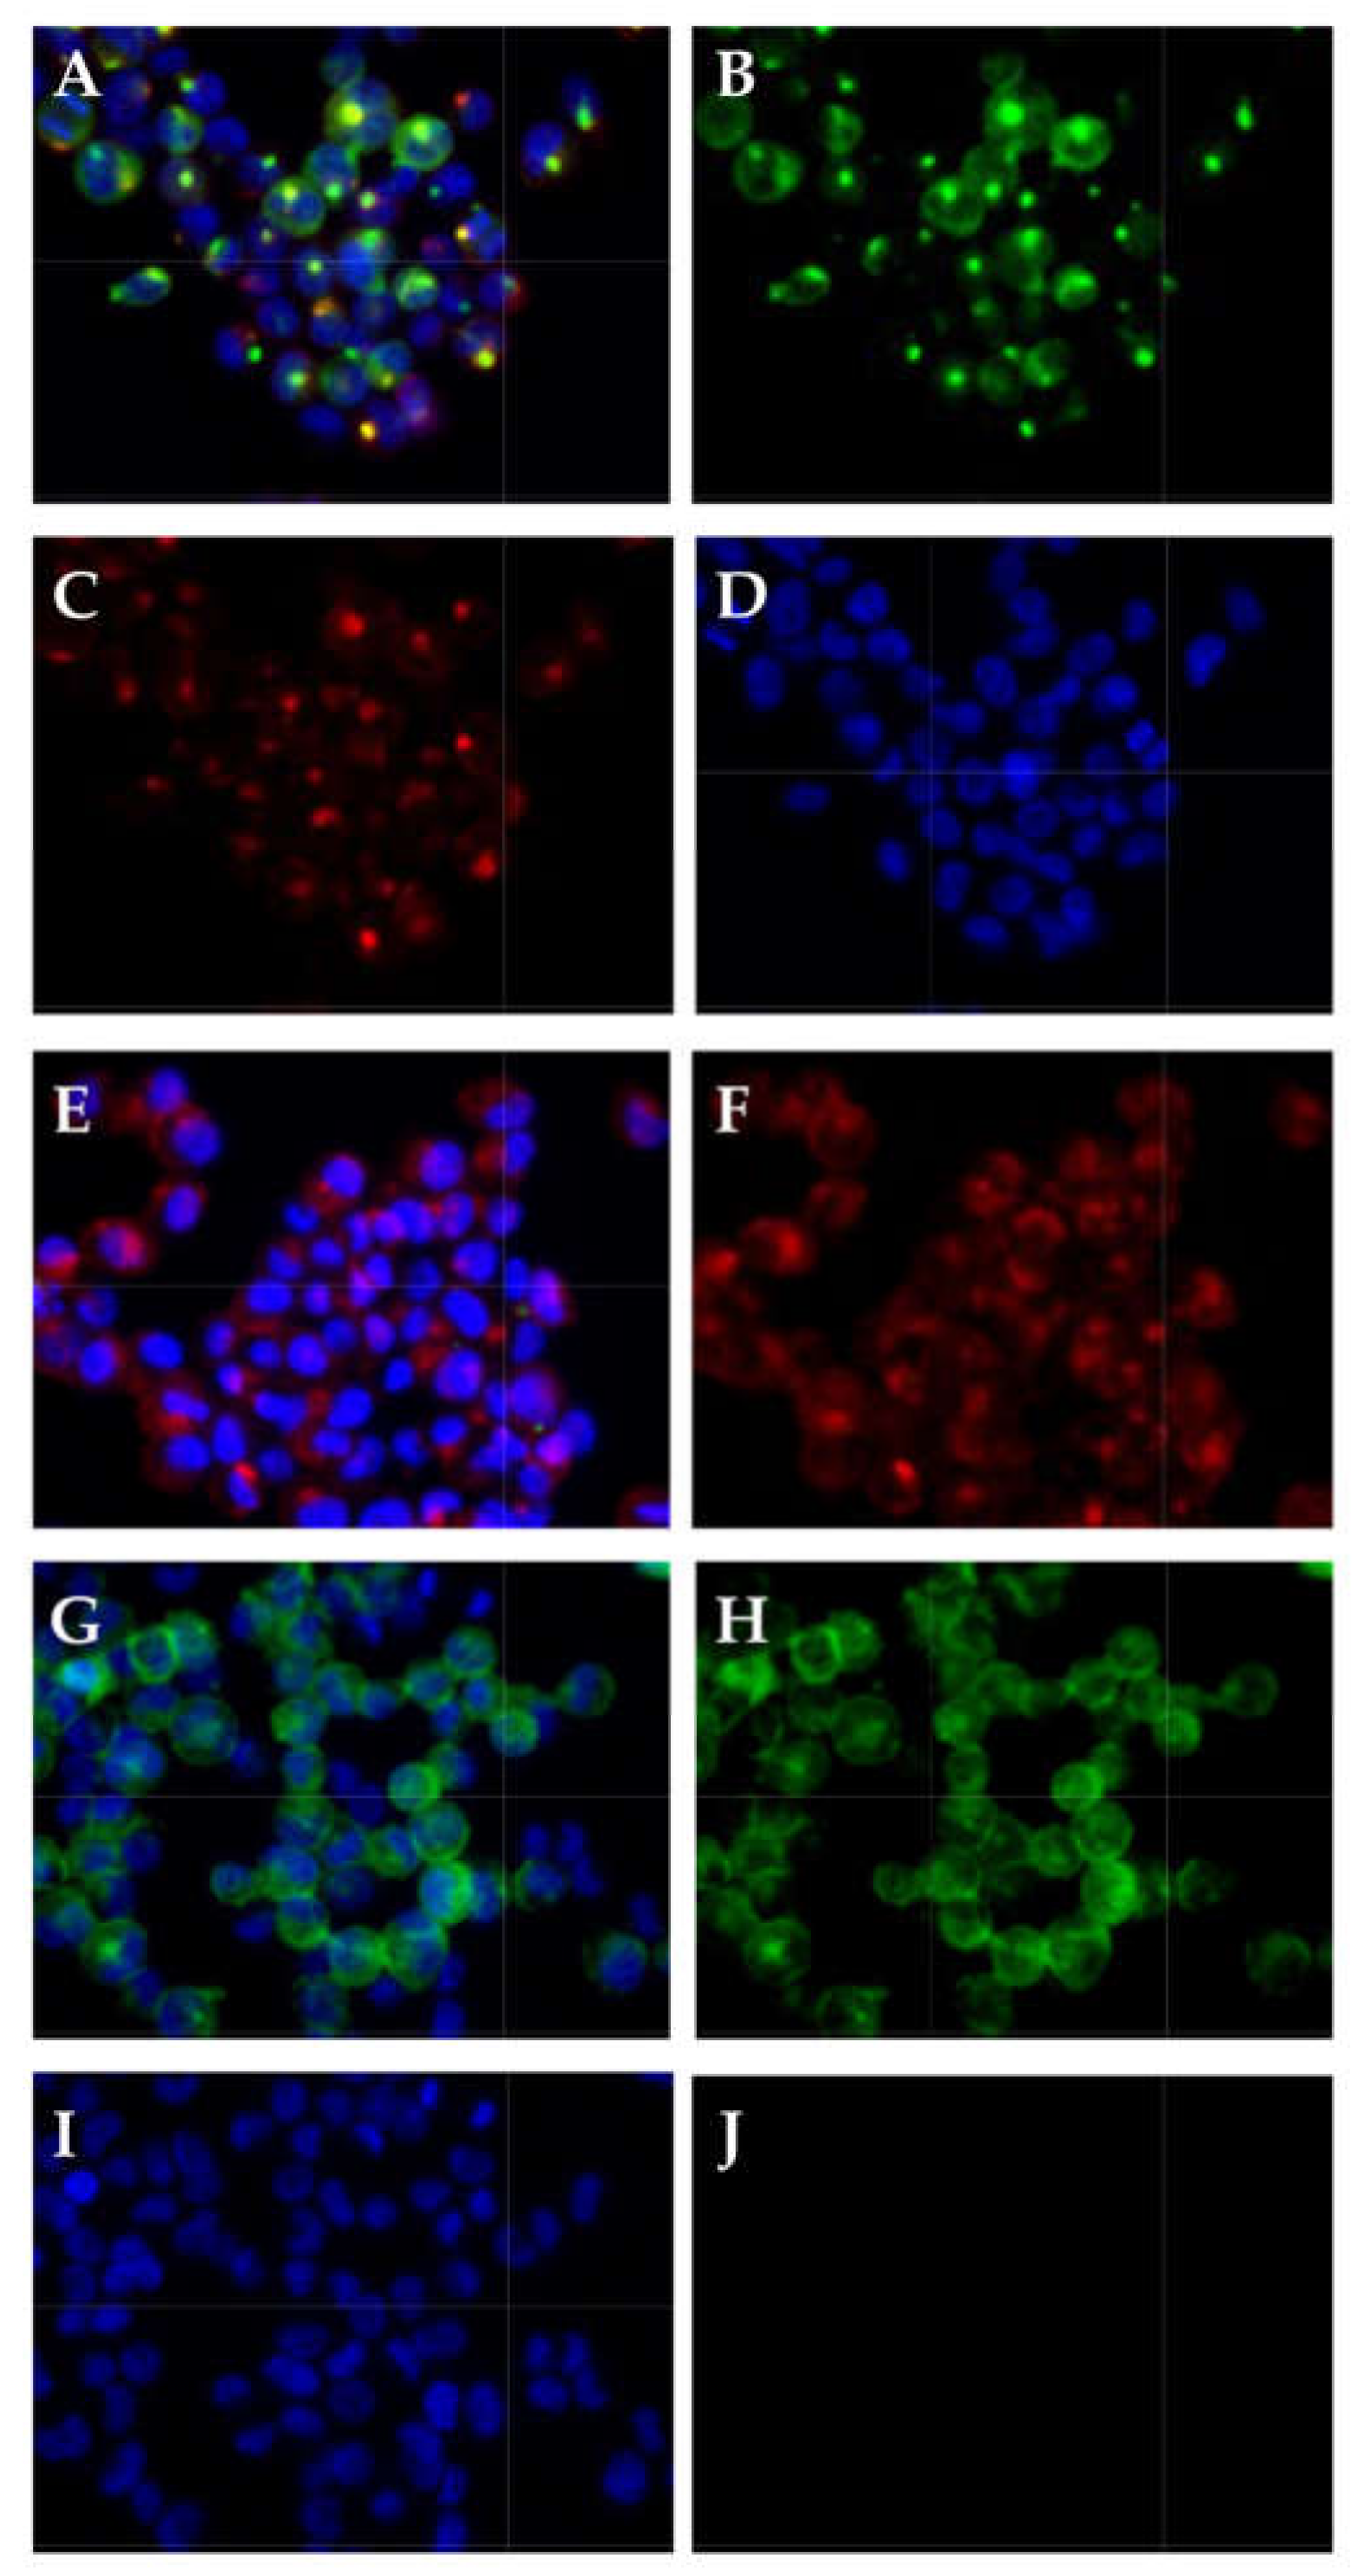
2.4. Expression of Tumor Stem Cells Markers
2.5. Determination of the Cell Lineage of UM-UC-13 Bladder Cancer Cells
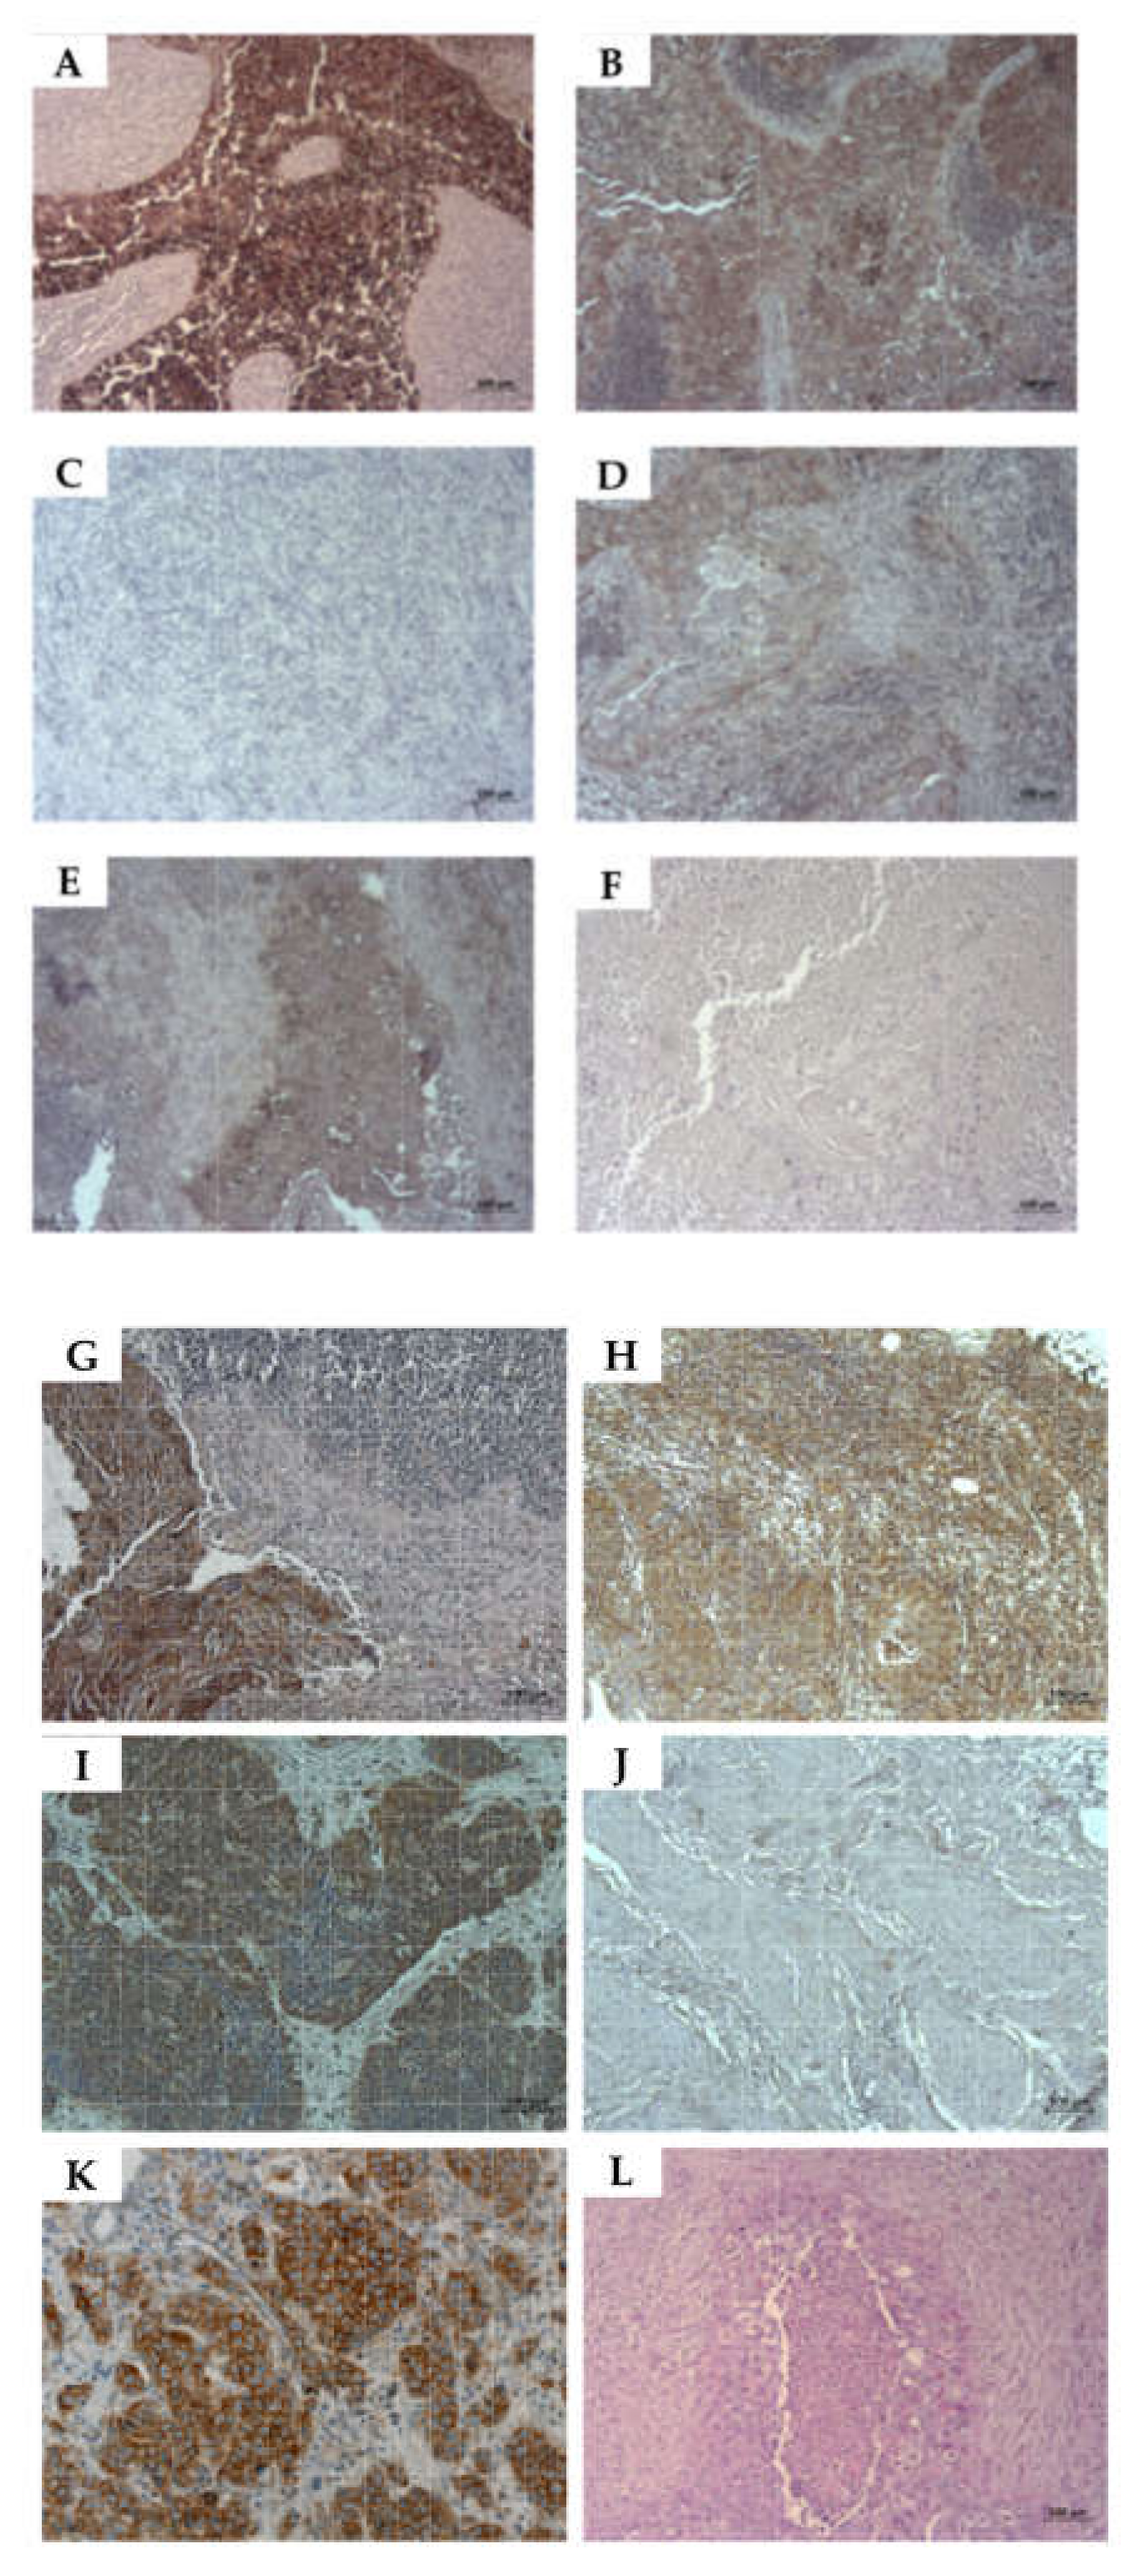
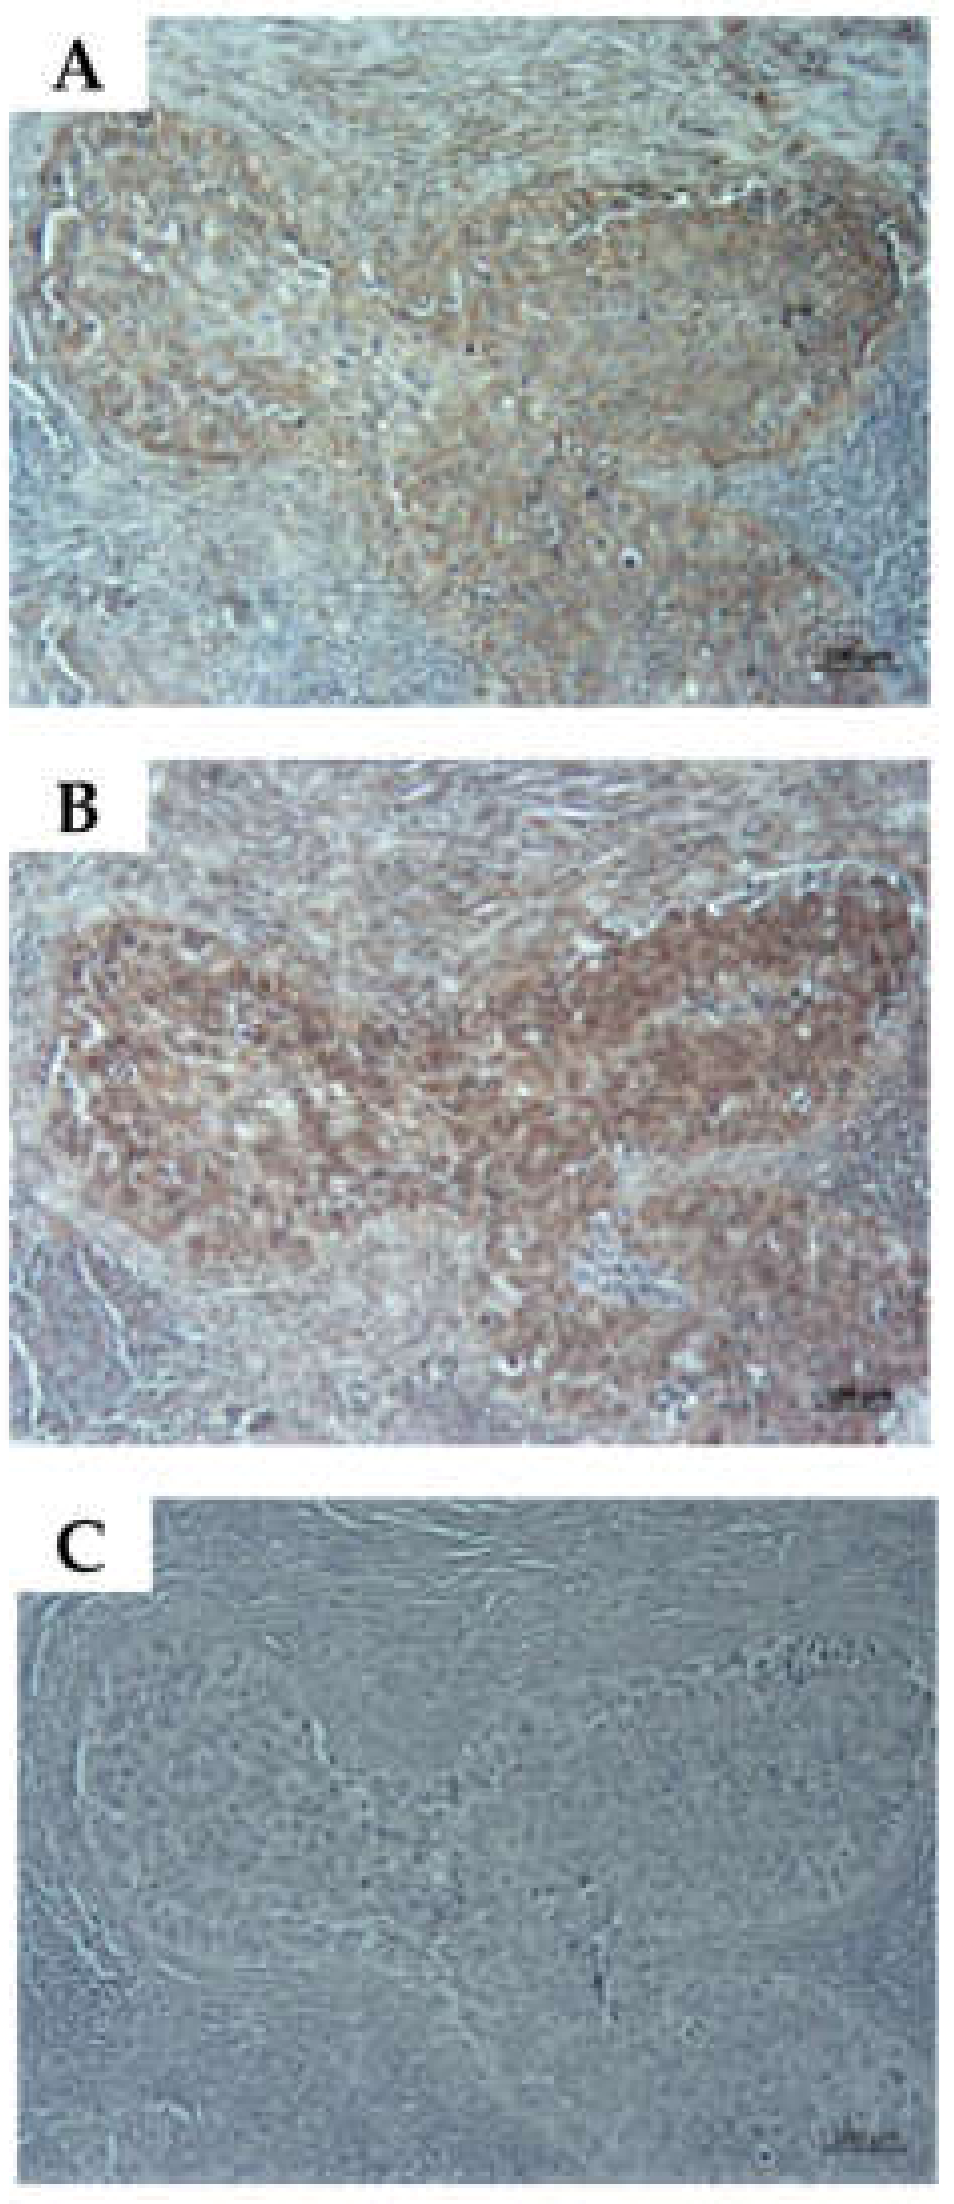
2.6. Detection of CD276 in Lymph Node Metastases of Bladder Cancer Patients
3. Discussion
4. Materials and Methods
4.1. Preparation and In Vitro Culture of Cells
4.2. Analysis of mRNA Transcripts
4.3. Analysis of CD276 Protein Expression
4.4. Analysis of CD276 Presentation on Cell Surfaces
4.5. Immunocytochemistry and Immunohistochemistry
4.6. Statistics
5. Conclusions
Author Contributions
Funding
Institutional Review Board Statement
Informed Consent Statement
Data Availability Statement
Acknowledgments
Conflicts of Interest
Abbreviations
| AE1/AE3 | Pan-anti-cytokeratin antibody, clone AE1/AE3 |
| AT | Ambient temperature |
| BC | Bladder cancer |
| DR | Duplication rate |
| ICC | Immunocytochemistry |
| Ki67 | Proliferation marker, reactive with monoclonal antibody Ki67 |
| MFI | Mean fluorescence intensity |
| NUCs | Normal (somatic) urothelial cells |
| UCC | Urothelial cell carcinoma |
| UM-UC | University of Michigan Urothelial Carcinoma |
References
- Siegel, R.L.; Miller, K.D.; Jemal, A. Cancer statistics, 2019. CA Cancer J. Clin. 2019, 69, 7–34. [Google Scholar] [CrossRef] [PubMed] [Green Version]
- Burger, M.; Catto, J.W.; Dalbagni, G.; Grossman, H.B.; Herr, H.; Karakiewicz, P.; Kassouf, W.; Kiemeney, L.A.; La Vecchia, C.; Shariat, S.; et al. Epidemiology and risk factors of urothelial bladder cancer. Eur. Urol. 2013, 63, 234–241. [Google Scholar] [CrossRef] [PubMed]
- Kim, H.S. Chapter 2—Etiology (Risk Factors for Bladder Cancer). In Bladder Cancer; Ku, J.H., Ed.; Academic Press: Cambridge, MA, USA, 2018; pp. 21–32. [Google Scholar] [CrossRef]
- Shin, J.H.; Lim, J.S.; Jeon, B.H. Chapter 3—Pathophysiology of Bladder Cancer. In Bladder Cancer; Ku, J.H., Ed.; Academic Press: Cambridge, MA, USA, 2018; pp. 33–41. [Google Scholar] [CrossRef]
- Witjes, J.A.; Babjuk, M.; Bellmunt, J.; Bruins, H.M.; De Reijke, T.M.; De Santis, M.; Gillessen, S.; James, N.; Maclennan, S.; Palou, J.; et al. EAU-ESMO Consensus Statements on the Management of Advanced and Variant Bladder Cancer—An International Collaborative Multistakeholder Effort(dagger): Under the Auspices of the EAU-ESMO Guidelines Committees. Eur. Urol. 2020, 77, 223–250. [Google Scholar] [CrossRef] [PubMed] [Green Version]
- Berdik, C. Unlocking bladder cancer. Nature 2017, 551, S34–S35. [Google Scholar] [CrossRef]
- Song, D.; Powles, T.; Shi, L.; Zhang, L.; Ingersoll, M.A.; Lu, Y.J. Bladder cancer, a unique model to understand cancer immunity and develop immunotherapy approaches. J. Pathol. 2019, 249, 151–165. [Google Scholar] [CrossRef] [Green Version]
- van Hooren, L.; Sandin, L.C.; Moskalev, I.; Ellmark, P.; Dimberg, A.; Black, P.; Totterman, T.H.; Mangsbo, S.M. Local checkpoint inhibition of CTLA-4 as a monotherapy or in combination with anti-PD1 prevents the growth of murine bladder cancer. Eur. J. Immunol. 2017, 47, 385–393. [Google Scholar] [CrossRef]
- Aicher, W.K.; Korn, M.; Reitnauer, L.; Maurer, F.B.; Hennenlotter, J.; Black, P.C.; Todenhofer, T.; Bedke, J.; Stenzl, A. Expression patterns of the immune checkpoint ligand CD276 in urothelial carcinoma. BMC Urol. 2021, 21, 60. [Google Scholar] [CrossRef]
- Liu, X.; Kwon, H.; Li, Z.; Fu, Y.X. Is CD47 an innate immune checkpoint for tumor evasion? J. Hematol. Oncol. 2017, 10, 12. [Google Scholar] [CrossRef] [Green Version]
- Iwai, Y.; Ishida, M.; Tanaka, Y.; Okazaki, T.; Honjo, T.; Minato, N. Involvement of PD-L1 on tumor cells in the escape from host immune system and tumor immunotherapy by PD-L1 blockade. Proc. Natl. Acad. Sci. USA 2002, 99, 12293–12297. [Google Scholar] [CrossRef] [Green Version]
- Ribas, A.; Wolchok, J.D. Cancer immunotherapy using checkpoint blockade. Science 2018, 359, 1350–1355. [Google Scholar] [CrossRef] [Green Version]
- Seaman, S.; Zhu, Z.; Saha, S.; Zhang, X.M.; Yang, M.Y.; Hilton, M.B.; Morris, K.; Szot, C.; Morris, H.; Swing, D.A.; et al. Eradication of Tumors through Simultaneous Ablation of CD276/B7-H3-Positive Tumor Cells and Tumor Vasculature. Cancer Cell 2017, 31, 501–515.e508. [Google Scholar] [CrossRef] [Green Version]
- Lopez-Beltran, A.; Cimadamore, A.; Blanca, A.; Massari, F.; Vau, N.; Scarpelli, M.; Cheng, L.; Montironi, R. Immune Checkpoint Inhibitors for the Treatment of Bladder Cancer. Cancers 2021, 13, 131. [Google Scholar] [CrossRef]
- Chen, Y.; Guan, S.-Y.; Deng, J.; Yang, H.; Xu, W.; Xu, S.; Shao, M.; Gao, X.; Xu, S.; Shuai, Z.; et al. B7-H3: A promising therapeutic target for autoimmune diseases. Cell. Immunol. 2020, 352, 104077. [Google Scholar] [CrossRef]
- Tang, T.; Huang, X.; Zhang, G.; Hong, Z.; Bai, X.; Liang, T. Advantages of targeting the tumor immune microenvironment over blocking immune checkpoint in cancer immunotherapy. Signal Transduct. Target. Ther. 2021, 6, 72. [Google Scholar] [CrossRef]
- Wang, C.; Li, Y.; Jia, L.; Kim, J.K.; Li, J.; Deng, P.; Zhang, W.; Krebsbach, P.H.; Wang, C.Y. CD276 expression enables squamous cell carcinoma stem cells to evade immune surveillance. Cell Stem Cell 2021, 28, 1597–1613.e7. [Google Scholar] [CrossRef]
- Liu, S.; Liang, J.; Liu, Z.; Zhang, C.; Wang, Y.; Watson, A.H.; Zhou, C.; Zhang, F.; Wu, K.; Zhang, F.; et al. The Role of CD276 in Cancers. Front. Oncol. 2021, 11, 847. [Google Scholar] [CrossRef]
- Dong, P.; Xiong, Y.; Yue, J.; Hanley, S.J.B.; Watari, H. B7H3 As a Promoter of Metastasis and Promising Therapeutic Target. Front. Oncol. 2018, 8, 264. [Google Scholar] [CrossRef] [Green Version]
- Li, Y.; Guo, G.; Song, J.; Cai, Z.; Yang, J.; Chen, Z.; Wang, Y.; Huang, Y.; Gao, Q. B7-H3 Promotes the Migration and Invasion of Human Bladder Cancer Cells via the PI3K/Akt/STAT3 Signaling Pathway. J. Cancer 2017, 8, 816–824. [Google Scholar] [CrossRef] [Green Version]
- Xu, Z.L.; Zhang, Y.; Wang, L.; Li, F.; Man, H.W.; Li, P.F.; Shan, B.E. B7-H3 promotes malignant progression of muscle-invasive bladder cancer. Oncol. Rep. 2018, 40, 2722–2733. [Google Scholar] [CrossRef]
- Xylinas, E.; Robinson, B.D.; Kluth, L.A.; Volkmer, B.G.; Hautmann, R.; Kufer, R.; Zerbib, M.; Kwon, E.; Thompson, R.H.; Boorjian, S.A.; et al. Association of T-cell co-regulatory protein expression with clinical outcomes following radical cystectomy for urothelial carcinoma of the bladder. Eur. J. Surg. Oncol. 2014, 40, 121–127. [Google Scholar] [CrossRef]
- Ye, Z.; Zheng, Z.; Li, X.; Zhu, Y.; Zhong, Z.; Peng, L.; Wu, Y. B7-H3 Overexpression Predicts Poor Survival of Cancer Patients: A Meta-Analysis. Cell Physiol. Biochem. 2016, 39, 1568–1580. [Google Scholar] [CrossRef]
- Najafi, M.; Farhood, B.; Mortezaee, K. Cancer stem cells (CSCs) in cancer progression and therapy. J. Cell Physiol. 2019, 234, 8381–8395. [Google Scholar] [CrossRef]
- Liu, Z.; Zhang, W.; Phillips, J.B.; Arora, R.; McClellan, S.; Li, J.; Kim, J.H.; Sobol, R.W.; Tan, M. Immunoregulatory protein B7-H3 regulates cancer stem cell enrichment and drug resistance through MVP-mediated MEK activation. Oncogene 2019, 38, 88–102. [Google Scholar] [CrossRef]
- Available online: https://umich.flintbox.com/technologies/354a1ede-4585-4ff6-927b-539cd638ac03 (accessed on 1 March 2022).
- Su, Y.; Qiu, Q.; Zhang, X.; Jiang, Z.; Leng, Q.; Liu, Z.; Stass, S.A.; Jiang, F. Aldehyde dehydrogenase 1 A1-positive cell population is enriched in tumor-initiating cells and associated with progression of bladder cancer. Cancer Epidemiol. Biomark. Prev. 2010, 19, 327–337. [Google Scholar] [CrossRef] [Green Version]
- Ooki, A.; VandenBussche, C.J.; Kates, M.; Hahn, N.M.; Matoso, A.; McConkey, D.J.; Bivalacqua, T.J.; Hoque, M.O. CD24 regulates cancer stem cell (CSC)-like traits and a panel of CSC-related molecules serves as a non-invasive urinary biomarker for the detection of bladder cancer. Br. J. Cancer 2018, 119, 961–970. [Google Scholar] [CrossRef]
- Li, Y.; Lin, K.; Yang, Z.; Han, N.; Quan, X.; Guo, X.; Li, C. Bladder cancer stem cells: Clonal origin and therapeutic perspectives. Oncotarget 2017, 8, 66668–66679. [Google Scholar] [CrossRef] [Green Version]
- Sabichi, A.; Keyhani, A.; Tanaka, N.; Delacerda, J.; Lee, I.L.; Zou, C.; Zhou, J.H.; Benedict, W.F.; Grossman, H.B. Characterization of a panel of cell lines derived from urothelial neoplasms: Genetic alterations, growth in vivo and the relationship of adenoviral mediated gene transfer to coxsackie adenovirus receptor expression. J. Urol. 2006, 175, 1133–1137. [Google Scholar] [CrossRef]
- Zhang, G.; Hou, J.; Shi, J.; Yu, G.; Lu, B.; Zhang, X. Soluble CD276 (B7-H3) is released from monocytes, dendritic cells and activated T cells and is detectable in normal human serum. Immunology 2008, 123, 538–546. [Google Scholar] [CrossRef] [PubMed]
- Saeednejad Zanjani, L.; Madjd, Z.; Axcrona, U.; Abolhasani, M.; Rasti, A.; Asgari, M.; Fodstad, Ã.Y.; Andersson, Y. Cytoplasmic expression of B7-H3 and membranous EpCAM expression are associated with higher grade and survival outcomes in patients with clear cell renal cell carcinoma. Ann. Diagn. Pathol. 2020, 46, 151483. [Google Scholar] [CrossRef] [PubMed]
- Cai, D.; Li, J.; Liu, D.; Hong, S.; Qiao, Q.; Sun, Q.; Li, P.; Lyu, N.; Sun, T.; Xie, S.; et al. Tumor-expressed B7-H3 mediates the inhibition of antitumor T-cell functions in ovarian cancer insensitive to PD-1 blockade therapy. Cell Mol. Immunol. 2020, 17, 227–236. [Google Scholar] [CrossRef] [PubMed]
- Roth, T.J.; Sheinin, Y.; Lohse, C.M.; Kuntz, S.M.; Frigola, X.; Inman, B.A.; Krambeck, A.E.; McKenney, M.E.; Karnes, R.J.; Blute, M.L.; et al. B7-H3 ligand expression by prostate cancer: A novel marker of prognosis and potential target for therapy. Cancer Res. 2007, 67, 7893–7900. [Google Scholar] [CrossRef] [Green Version]
- Boorjian, S.A.; Sheinin, Y.; Crispen, P.L.; Farmer, S.A.; Lohse, C.M.; Kuntz, S.M.; Leibovich, B.C.; Kwon, E.D.; Frank, I. T-cell coregulatory molecule expression in urothelial cell carcinoma: Clinicopathologic correlations and association with survival. Clin. Cancer Res. 2008, 14, 4800–4808. [Google Scholar] [CrossRef] [Green Version]
- Loos, M.; Hedderich, D.M.; Friess, H.; Kleeff, J. B7-h3 and its role in antitumor immunity. Clin. Dev. Immunol. 2010, 2010, 683875. [Google Scholar] [CrossRef]
- Wang, J.; Yuan, R.; Song, W.; Sun, J.; Liu, D.; Li, Z. PD-1, PD-L1 (B7-H1) and Tumor-Site Immune Modulation Therapy: The Historical Perspective. J. Hematol. Oncol. 2017, 10, 34. [Google Scholar] [CrossRef] [Green Version]
- Janakiram, M.; Shah, U.A.; Liu, W.; Zhao, A.; Schoenberg, M.P.; Zang, X. The third group of the B7-CD28 immune checkpoint family: HHLA2, TMIGD2, B7x, and B7-H3. Immunol. Rev. 2017, 276, 26–39. [Google Scholar] [CrossRef] [Green Version]
- Lee, Y.H.; Martin-Orozco, N.; Zheng, P.; Li, J.; Zhang, P.; Tan, H.; Park, H.J.; Jeong, M.; Chang, S.H.; Kim, B.S.; et al. Inhibition of the B7-H3 immune checkpoint limits tumor growth by enhancing cytotoxic lymphocyte function. Cell Res. 2017, 27, 1034–1045. [Google Scholar] [CrossRef]
- Ma, W.; Ma, J.; Ma, P.; Lei, T.; Zhao, M.; Zhang, M. Targeting immunotherapy for bladder cancer using anti-CD3x B7-H3 bispecific antibody. Cancer Med. 2018, 7, 5167–5177. [Google Scholar] [CrossRef]
- Durlanik, S.; Fundel-Clemens, K.; Viollet, C.; Huber, H.J.; Lenter, M.; Kitt, K.; Pflanz, S. CD276 is an important player in macrophage recruitment into the tumor and an upstream regulator for PAI-1. Sci. Rep. 2021, 11, 14849. [Google Scholar] [CrossRef]
- Li, F.; Chen, H.; Wang, D. Silencing of CD276 suppresses lung cancer progression by regulating integrin signaling. J. Thorac. Dis. 2020, 12, 2137–2145. [Google Scholar] [CrossRef]
- Picarda, E.; Ohaegbulam, K.C.; Zang, X. Molecular Pathways: Targeting B7-H3 (CD276) for Human Cancer Immunotherapy. Clin. Cancer Res. Off. J. Am. Assoc. Cancer Res. 2016, 22, 3425–3431. [Google Scholar] [CrossRef] [Green Version]
- Hashiguchi, M.; Kobori, H.; Ritprajak, P.; Kamimura, Y.; Kozono, H.; Azuma, M. Triggering receptor expressed on myeloid cell-like transcript 2 (TLT-2) is a counter-receptor for B7-H3 and enhances T cell responses. Proc. Natl. Acad. Sci. USA 2008, 105, 10495–10500. [Google Scholar] [CrossRef] [Green Version]
- Ma, Y.; Wang, R.; Lu, H.; Li, X.; Zhang, G.; Fu, F.; Cao, L.; Zhan, S.; Wang, Z.; Deng, Z.; et al. B7-H3 promotes the cell cycle-mediated chemoresistance of colorectal cancer cells by regulating CDC25A. J. Cancer 2020, 11, 2158–2170. [Google Scholar] [CrossRef]
- Yuan, H.; Wei, X.; Zhang, G.; Li, C.; Zhang, X.; Hou, J. B7-H3 over expression in prostate cancer promotes tumor cell progression. J. Urol. 2011, 186, 1093–1099. [Google Scholar] [CrossRef]
- Flem-Karlsen, K.; Fodstad, Y.; Nunes-Xavier, C.E. B7-H3 immune checkpoint protein in human cancer. Curr. Med. Chem. 2019, 27, 4062–4086. [Google Scholar] [CrossRef]
- Stalder, D.; Gershlick, D.C. Direct trafficking pathways from the Golgi apparatus to the plasma membrane. Semin. Cell Dev. Biol. 2020, 107, 112–125. [Google Scholar] [CrossRef]
- Nickel, W.; Seedorf, M. Unconventional mechanisms of protein transport to the cell surface of eukaryotic cells. Annu. Rev. Cell Dev. Biol. 2008, 24, 287–308. [Google Scholar] [CrossRef]
- Wu, D.; Zhang, Z.; Pan, H.; Fan, Y.; Qu, P.; Zhou, J. Upregulation of the B7/CD28 family member B7-H3 in bladder cancer. Oncol. Lett. 2015, 9, 1420–1424. [Google Scholar] [CrossRef]
- Shan, Y.; Zhang, L.; Bao, Y.; Li, B.; He, C.; Gao, M.; Feng, X.; Xu, W.; Zhang, X.; Wang, S. Epithelial-mesenchymal transition, a novel target of sulforaphane via COX-2/MMP2, 9/Snail, ZEB1 and miR-200c/ZEB1 pathways in human bladder cancer cells. J. Nutr. Biochem. 2013, 24, 1062–1069. [Google Scholar] [CrossRef]
- Monteiro-Reis, S.; Lobo, J.; Henrique, R.; Jeronimo, C. Epigenetic Mechanisms Influencing Epithelial to Mesenchymal Transition in Bladder Cancer. Int. J. Mol. Sci. 2019, 20, 297. [Google Scholar] [CrossRef] [Green Version]
- Nygren, M.K.; Tekle, C.; Ingebrigtsen, V.A.; Fodstad, O. B7-H3 and its relevance in cancer; immunological and non-immunological perspectives. Front. Biosci. (Elite Ed.) 2011, 3, 989–993. [Google Scholar] [CrossRef]
- Smith, S.C.; Oxford, G.; Wu, Z.; Nitz, M.D.; Conaway, M.; Frierson, H.F.; Hampton, G.; Theodorescu, D. The metastasis-associated gene CD24 is regulated by Ral GTPase and is a mediator of cell proliferation and survival in human cancer. Cancer Res. 2006, 66, 1917–1922. [Google Scholar] [CrossRef] [PubMed] [Green Version]
- Jothy, S. CD44 and its partners in metastasis. Clin. Exp. Metastasis 2003, 20, 195–201. [Google Scholar] [CrossRef] [PubMed]
- Son, Y.; Kwon, S.M.; Cho, J.Y. CD276 (B7-H3) Maintains Proliferation and Regulates Differentiation in Angiogenic Function in Late Endothelial Progenitor Cells. Stem Cells 2019, 37, 382–394. [Google Scholar] [CrossRef] [PubMed]
- Black, P.C.; Brown, G.A.; Inamoto, T.; Shrader, M.; Arora, A.; Siefker-Radtke, A.O.; Adam, L.; Theodorescu, D.; Wu, X.; Munsell, M.F.; et al. Sensitivity to epidermal growth factor receptor inhibitor requires E-cadherin expression in urothelial carcinoma cells. Clin. Cancer Res. 2008, 14, 1478–1486. [Google Scholar] [CrossRef] [Green Version]
- Rasmussen, R.; Morrison, T.; Herrmann, M.; Wittwer, C. Quantitative PCR by contiuous fluorescence monitoring of a double strand DNA specific binding dye. Biochimica 1998, 2, 8–11. [Google Scholar]
- Coligan, J.E.; Dunn, B.M.; Ploegh, H.L.; Speicher, D.W.; Wingfiedl, P.T. Current Protocols in Protein Science; Wiley Hobocken: Hoboken, NJ, USA, 1997. [Google Scholar]


Publisher’s Note: MDPI stays neutral with regard to jurisdictional claims in published maps and institutional affiliations. |
© 2022 by the authors. Licensee MDPI, Basel, Switzerland. This article is an open access article distributed under the terms and conditions of the Creative Commons Attribution (CC BY) license (https://creativecommons.org/licenses/by/4.0/).
Share and Cite
Harland, N.; Maurer, F.B.; Abruzzese, T.; Bock, C.; Montes-Mojarro, I.A.; Fend, F.; Aicher, W.K.; Stenzl, A.; Amend, B. Elevated Expression of the Immune Checkpoint Ligand CD276 (B7-H3) in Urothelial Carcinoma Cell Lines Correlates Negatively with the Cell Proliferation. Int. J. Mol. Sci. 2022, 23, 4969. https://doi.org/10.3390/ijms23094969
Harland N, Maurer FB, Abruzzese T, Bock C, Montes-Mojarro IA, Fend F, Aicher WK, Stenzl A, Amend B. Elevated Expression of the Immune Checkpoint Ligand CD276 (B7-H3) in Urothelial Carcinoma Cell Lines Correlates Negatively with the Cell Proliferation. International Journal of Molecular Sciences. 2022; 23(9):4969. https://doi.org/10.3390/ijms23094969
Chicago/Turabian StyleHarland, Niklas, Florian B. Maurer, Tanja Abruzzese, Cornelia Bock, Ivonne A. Montes-Mojarro, Falko Fend, Wilhelm K. Aicher, Arnulf Stenzl, and Bastian Amend. 2022. "Elevated Expression of the Immune Checkpoint Ligand CD276 (B7-H3) in Urothelial Carcinoma Cell Lines Correlates Negatively with the Cell Proliferation" International Journal of Molecular Sciences 23, no. 9: 4969. https://doi.org/10.3390/ijms23094969
APA StyleHarland, N., Maurer, F. B., Abruzzese, T., Bock, C., Montes-Mojarro, I. A., Fend, F., Aicher, W. K., Stenzl, A., & Amend, B. (2022). Elevated Expression of the Immune Checkpoint Ligand CD276 (B7-H3) in Urothelial Carcinoma Cell Lines Correlates Negatively with the Cell Proliferation. International Journal of Molecular Sciences, 23(9), 4969. https://doi.org/10.3390/ijms23094969