1. Introduction
Ethylene is the simplest olefin. It can be copolymerised into polyethylene [
1], ethylene-propylene rubber [
2], ethylene acrylic acid [
3], and other polymeric materials. These materials are widely used as the building blocks for essential consumer products such as plastics, cosmetics, and paints. It can also be used to produce organic synthetic raw materials like ethanol, acetaldehyde, ethylene chloride, and ethane bromide through organic synthesis or halogenation reactions. Additionally, it can be reacted with methane to catalyse the synthesis of C5–C10 gasoline-grade hydrocarbons [
4]. In 2019, world demand for ethylene production reached 170 million tons, and ethylene production rose to 190 million tons per year. Increasing demand and production of ethylene have brought economic growth, but environmental problems remain.
As one of the leading chemical products, ethylene is mainly obtained through petroleum fractionation and hydrocarbon cracking [
5]. However, the feedstock, crude oil, is non-renewable and ultimately unsustainable. Therefore, recent research mainly focuses on reducing pollution by improving the chemical production process [
6] or developing a cleaner method through biological processes [
7]. The biosynthetic approach is auspicious and results in no other pollutants being produced. Besides, it is easier to separate ethylene from the cell culture environment than other hydrocarbons because of its volatility and insolubility, making biosynthetic ethylene production even more appealing.
Up to now, three pathways of ethylene biosynthesis have been elucidated (
Figure 1). In higher plants, such as tomatoes, S-adenosyl-methionine (SAM) is converted to 1-aminocyclopropane-1-carboxylic acid (ACC) with the help of ACC synthase and then converted to ethylene by ACC oxidase [
8,
9]. In these plants, ethylene works as a plant hormone and as a defence response to biotic and abiotic stresses, like pathogen attacks [
10]. Based on that, some plant-associated microorganisms have shown ethylene-production ability [
11]. In microorganisms, there are two pathways for ethylene production. The first of these pathways is present in bacteria and fungus (
Filobasidiaceae). The biosynthetic cascade commences with NADH:Fe(III)EDTA oxidoreductase that converts into 2-keto-4-methylthiobutyric acid (KMBA), which is subsequently degraded to ethylene by light [
12,
13]. This process is affected by both carbon and nitrogen sources [
14]. In the second pathway, α-ketoglutarate (AKG) and L-arginine (ARG) are the primary substrates to produce ethylene [
15]. The ethylene-forming enzyme (Efe) catalyses the reaction in which the ratio of precursor and product was 1:1:2 [
7]. In
E. coli and some other industrial strains, the substrate for this reaction, AKG, is mainly produced by the microorganism’s tricarboxylic acid cycle (TCA cycle) [
16,
17] without an additional precursor requirement.
Efe is an important enzyme characteristic for the second microbial pathway mentioned above. It is a 2-oxoglutarate (2OG)-dependent nonheme iron(II) oxygenase (2OG is AKG), which catalyses the oxidation-decarboxylation of AKG to succinate and CO
2. In the process of ethylene synthesis by Efe [
18], the Cδ atom of ARG can be hydroxylated by Efe to form intermediate products, which are rapidly decomposed into guanidine and 1-pyrroline-5-carboxylate (P5C). Meanwhile, O
2 is activated at the same active site, converting AKG into ethylene and three molecules of CO
2 [
19,
20]. The 2-fold catalytic reaction of Efe demonstrates the remarkable flexibility of the active site of this enzyme, which provides the means to perform these two unique O
2 activation reactions. At the same time, the study showed [
21] that the addition of iron(II), arginine, and AKG improved the stability of the enzyme, and the combination of substrate and cofactor had a synergistic effect. Efe was first reported in
Pseudomonas solanacearum [
22]. The two best-described enzymes that catalyse this reaction are from
P. syringae pv. phaseolicola (Kudzu strain) and
P. syringae pv. glycinea [
11]. Now, the ethylene-forming enzyme gene (
efe gene) from
P. syringae has been successfully expressed in
E. coli [
23,
24],
Pseudomonas putida [
25],
Saccharomyces cerevisiae [
26],
Trichoderma reesei [
27], and in different strains of cyanobacteria [
28,
29,
30]. The activity of ethylene production is 0.093 μmol/gDCW/h in
Trichoderma viride [
31] to 2859.2 μmol/gDCW/h (gDCW is dry cellular weight) in
Pseudomonas putida [
32]. The production rate in
E. coli ranges from 10.9 μmol/gDCW/h in DH5α (RS101 ori) [
33] to 625 μmol/gDCW/h in DH5α (pUC18 ori) [
23].
In this work, five putative Efe sequences from different species of cyanobacteria and proteobacteria were selected using the structural and sequence information of a model Efe sequence from P. syringae pv. phaseolicola as a reference. The structures of these biocatalysts were predicted with a homology-based approach. On this base, we report the heterologous expression of the six Efes in E. coli using a low-copy, arabinose-inducible vector, pBAD_LIC_cloning vector (8A), analysed their activity in vitro under different temperatures, and calculated the productivity of ethylene in E. coli cells.
2. Results
2.1. Sequences Discovery and Phylogenetic Analysis
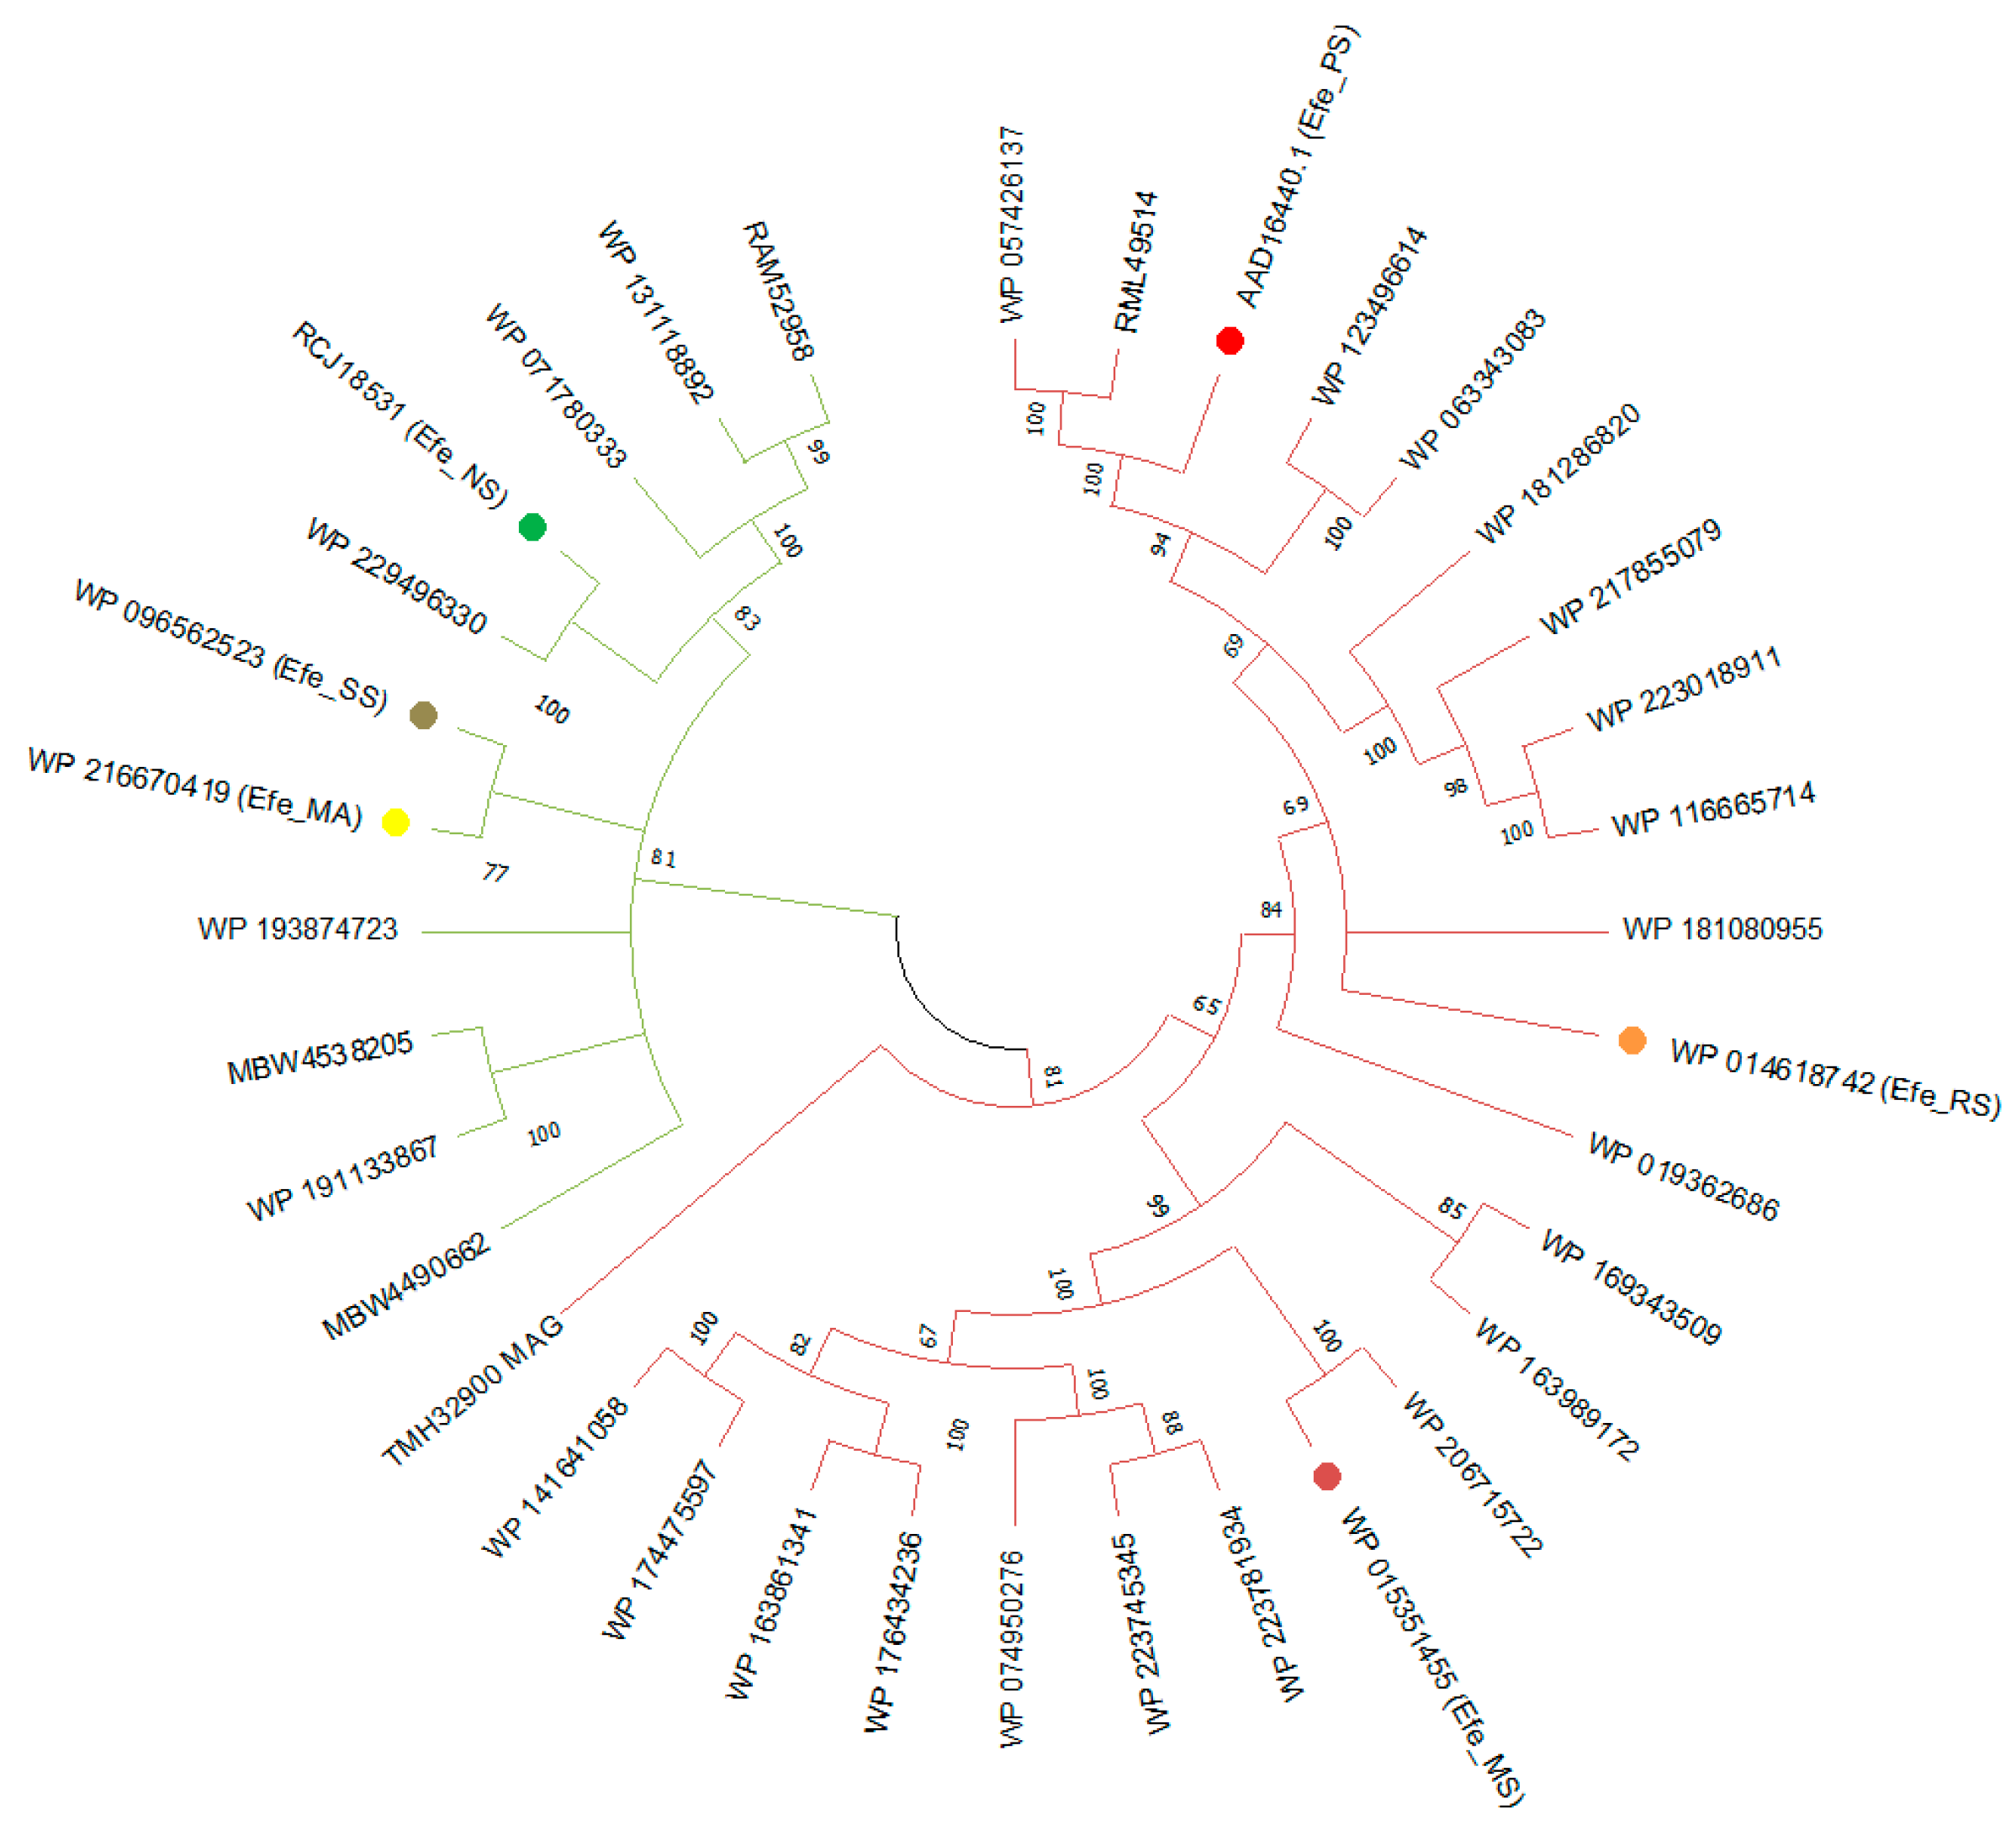
Thirty-four amino acid sequences belonging to cyanobacteria (green branches) and proteobacteria (rose red branches) with significant sequence similarities and fold recognition to the Efe sequence AAD16440.1 (marked with a red dot) were selected. The relationship between these strains was inferred using the phylogenetic tree (
Figure 2,
Table S1).
Most of them were initially described as isopenicilin N synthase family oxygenase by the automatic annotation systems, while the others were MFS transporter, 2OG-Fe (II) oxygenase, or some other uncertain proteins. As representatives of the branches and guided with fold recognition data, we selected five sequences from different strains (marked with points): Yellow point: Microcoleus asticus (GenBank: NQE34890, RefSeq: WP_216670419.1), Efe_MA; Rose red point: Myxococcus stipitatus DSM 14675 (RefSeq: WP_015351455.1, source: CP004025), Efe_MS; Orange point: Ralstonia solanacearum (RefSeq: WP_014618742.1, source: CP012944), Efe_RS; Sumdge point: Scytonema sp. NIES-4073 (RefSeq: WP_096562523.1), Efe_SS; Green point: Nostoc sp. ATCC 43529 (GenBank: RCJ18531, RefSeq: WP_019362686.1), Efe_NS, for further analysis to verify their ethylene-forming activity.
2.2. Structural Modelling and Analysis
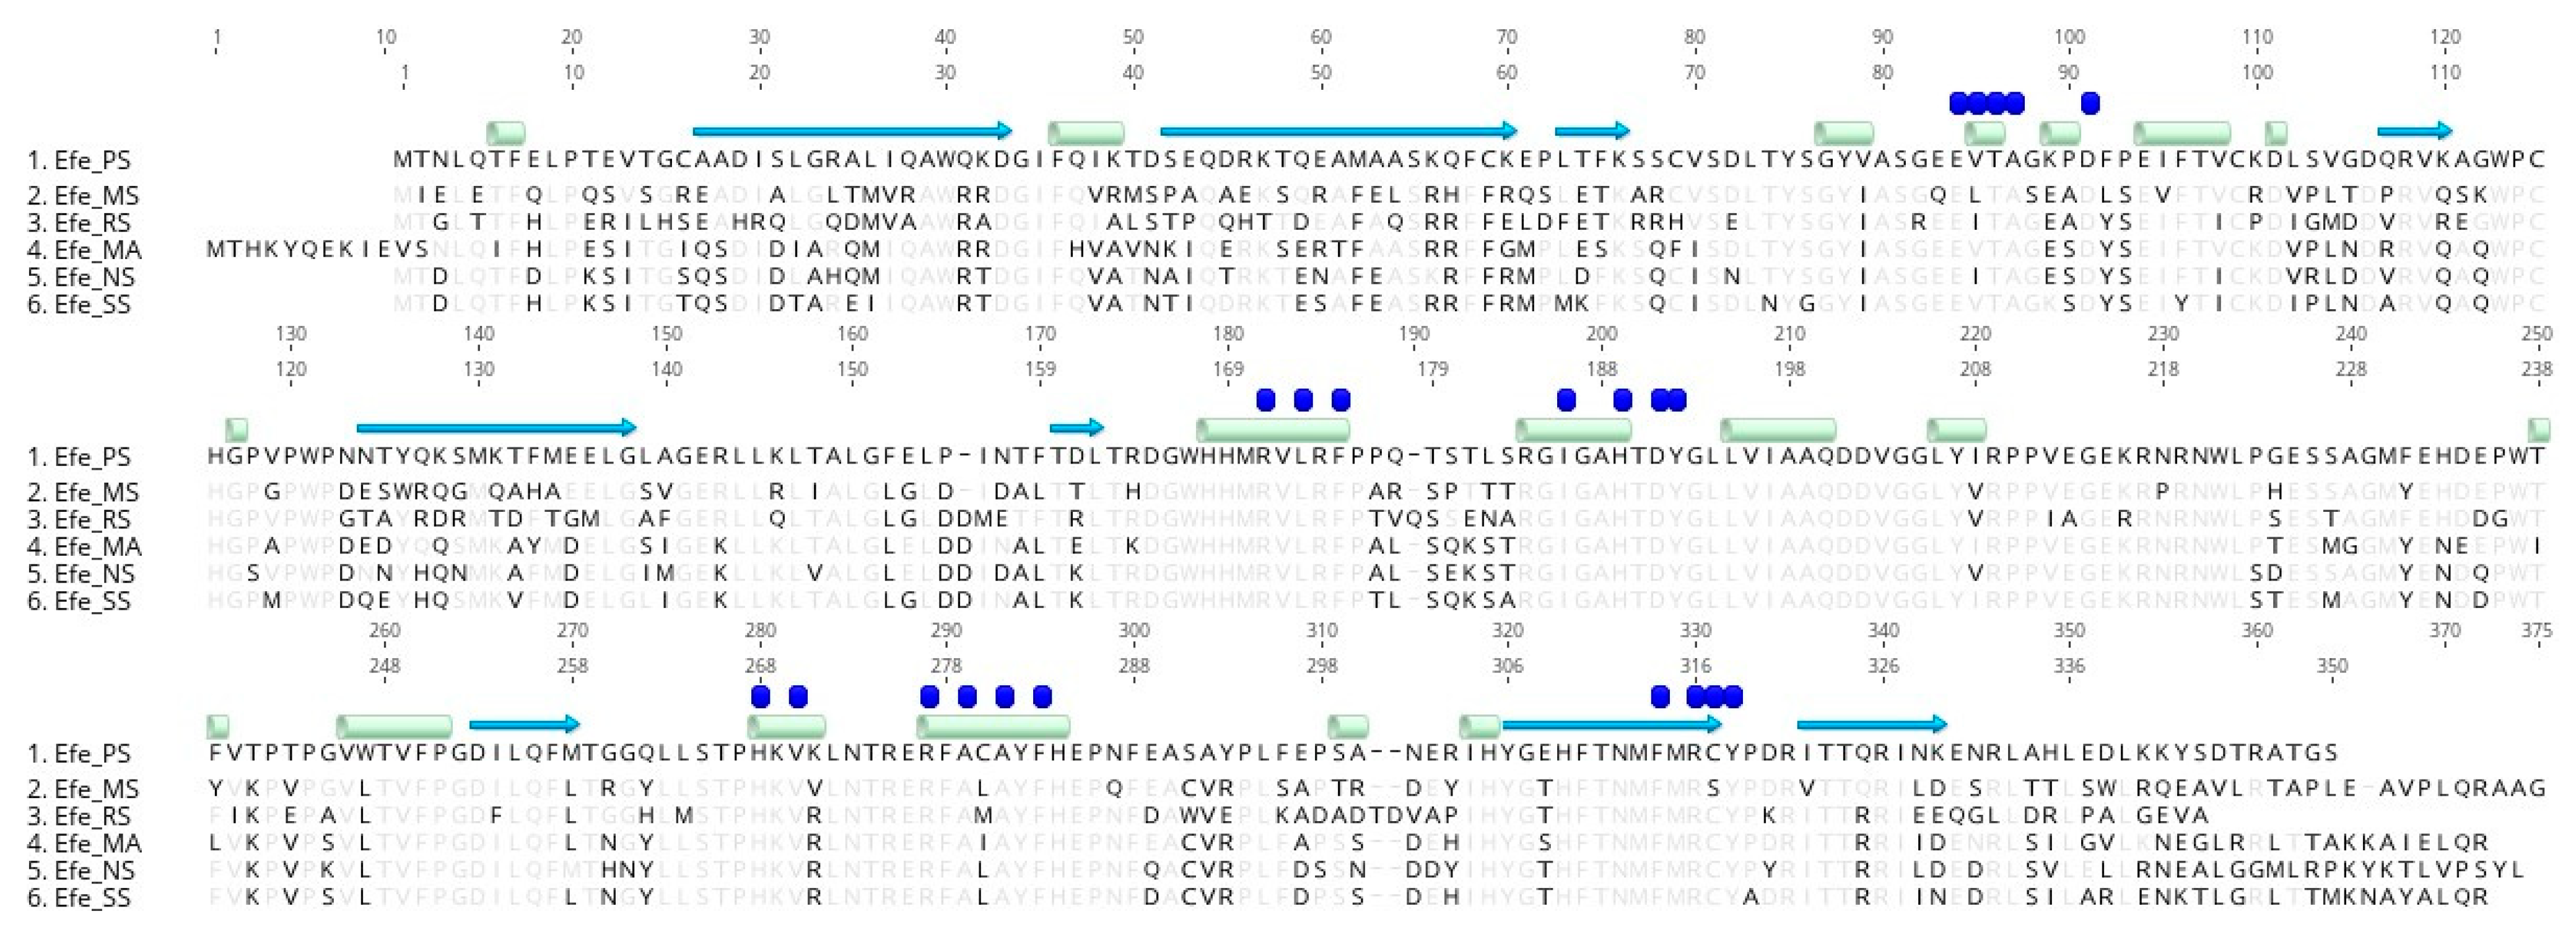
Sequence alignment and structural modelling were performed with AAD16440.1 (PDBID: 6vp4.1.A) (
Figure 3,
Figure S1). SWISS-MODEL shows that these models have a high matching degree. Their parameters like Seq Identity, GMQE, QMEANDisCo Globa, and QMEAN indicated model reliability (
Table S2).
The comparison between the five proteins and the reference structure showed 9 groups of α-helix structures and 18 groups of β-strand structures in the model. There were some differences in the sequences of α-helix structures and β-strands structures based on the sequence alignment (
Figure 3). Structural alignment using SWISS-MODEL (
Figure S1a) predicted that Efe_MS does not change in α-helical or β-strand structures. Efe_RS has a more extended β-strand structure in R.67 (6vp4.1.A: S.67) and one extra β-strand structure in M.157, E.158, and T.159 (6vp4.1.A: N.157, T.158). Efe_MA has a more extended β-strand structure in S.77 and Q.68 (6vp4.1.A: S.67 and S.68) and the β-strand structure in T.160, D.161, and L.162 in 6vp4.1.A change into N.168, A.169, L.170, and T.171 there. In Efe_NS, the β-strand structure located in T.160, D.161, and L.162 in 6vp4.1.A also change into D.158, A.159, L.160, and T.161. Efe_SS does not have any change in α-helix or β-strand structures. All above changes are minor for the location of β-strand or the formation of a short helix, indicating structural conservation of these enzymes. They may not influence the based structure or work as an Efe. What is more, structural alignment results using PyMOL shows a minor difference in the structure (
Figure S1c). The 6VP4.1.A model showed that Efe mainly contained three ligand sites (
Figure S1b), including 1 × ARG, 1 × AKG, and 1 × FE binding site, which were located in: E.84, V.85, T.86, A.87, D.91, R.171, L.173, F.175, I.186, H.189, D.191, Y.192 L.206, H.268, V.270, R.277, A.279, A.281, F.283, F.314, R.316, C.317, and Y.318. The results also showed that all the five proteins were conserved at the binding sites of Fe and AKG, while at the ARG binding site V.85 (Efe_MS: L.85, Efe_RS: I.85, Efe_NS: I.85) and C.317 (Efe_MS: S.317) were found unconserved. V.85 is located at a residue and at hydrogen bond sites, which is relatively important. But V, I, and L are all non-polar amino acids containing fatty hydrocarbon side chains, which means this change is unlikely to have a major effect on the structure and function of the ARG ligand site. Therefore, we preliminarily predicted that the change of V.85 into L.85 or I.85 has little impact on ARG-binding and enzymatic activity. Besides, C.317 is at another residue, and according to the analysis of disulfide bond formation of a cysteine residue in the template model 6VP4.1.A (shown in
Figure S2), the distance of C.317 from other cysteine sites is more than 10A, which is too far to form disulfide bonds. Therefore, we preliminarily speculated that the change from C to S at this site in efe_MS might not be significant and affect its binding to ARG.
2.3. Expression of Ethylene Forming Enzymes in E. coli BL21
Six pBAD-
efe+ expression frameworks (
Figure S3) were constructed using the homology-based method in
E. coli DH5α and transformed to BL21 strain for expression. To trace the growth of each
E. coli BL21_
efe+ strain in LB medium, supplemented with arabinose and antibiotic (ampicillin) at different temperatures, the OD
600, and pH of the culture were measured.
As is shown in
Figure S4, low temperature (20 °C) slightly inhibited the growth rate of
E. coli, but the effect was not significant: the number of cells still increased and could grow to a high enough concentration. Meanwhile, pH in the culture was stable at 6.9–7.3, which reproves arabinose has little effect on the cultivation system, and metabolic flux was not directed towards acid production but presumably directed towards the TCA cycle as required for the Efe activity. Besides, compared the growth of BL21_
efe+ to wild type BL21 (WT), the growth curves were similar, indicating that the insertion of the Efe expression framework had no specific effect on the growth of
E. coli cells.
2.4. Improvement of the Induction Environment
RT-qPCR and SDS-PAGE were used to analyse the arabinose induction effect using BL21_efe_PS+ as the representative strain. In cultivation system, different concentrations of arabinose (0, 0.02%, 0.2%, 2%) and different temperatures (20 °C, 30 °C) were set as the variate.
According to the relative gene copy number of BL21_
efe_PS+ from RT-qPCR and protein expression from SDS-PAGE in different conditions (
Figure 4), the gene was expressed in all the conditions. It was best expressed (mRNA gene relative copies: 197.31, the proportion of target protein of crude extract in the supernatant was approximated as 13.5% predicted by ImageJ) with 0.02% concentration of arabinose at 20 °C. The temperature of 30 °C and high arabinose concentration resulted in the formation of insoluble inclusion bodies that had a negative effect on the performance of the engineered strains. Additional challenges may be associated with an excessive draw of TCA cycle intermediates at high enzymatic that compromise the growth rate at high enzymatic activities of the ethylene-forming enzyme. Therefore a careful balance of temperature, inducer concentration, and induction time is needed to maximise productivity. Therefore, a relatively modest temperature of 20 °C and a 0.02% concentration of arabinose were used in the next step of this work.
2.5. Heterologous Expression of Each BL21_efe+ Strain
In this experiment, six BL21_efe+ strains were cultured in LB with 50 μg/mL ampicillin and 0.02% arabinose at 20 °C for 5 h.
RT-qPCR (
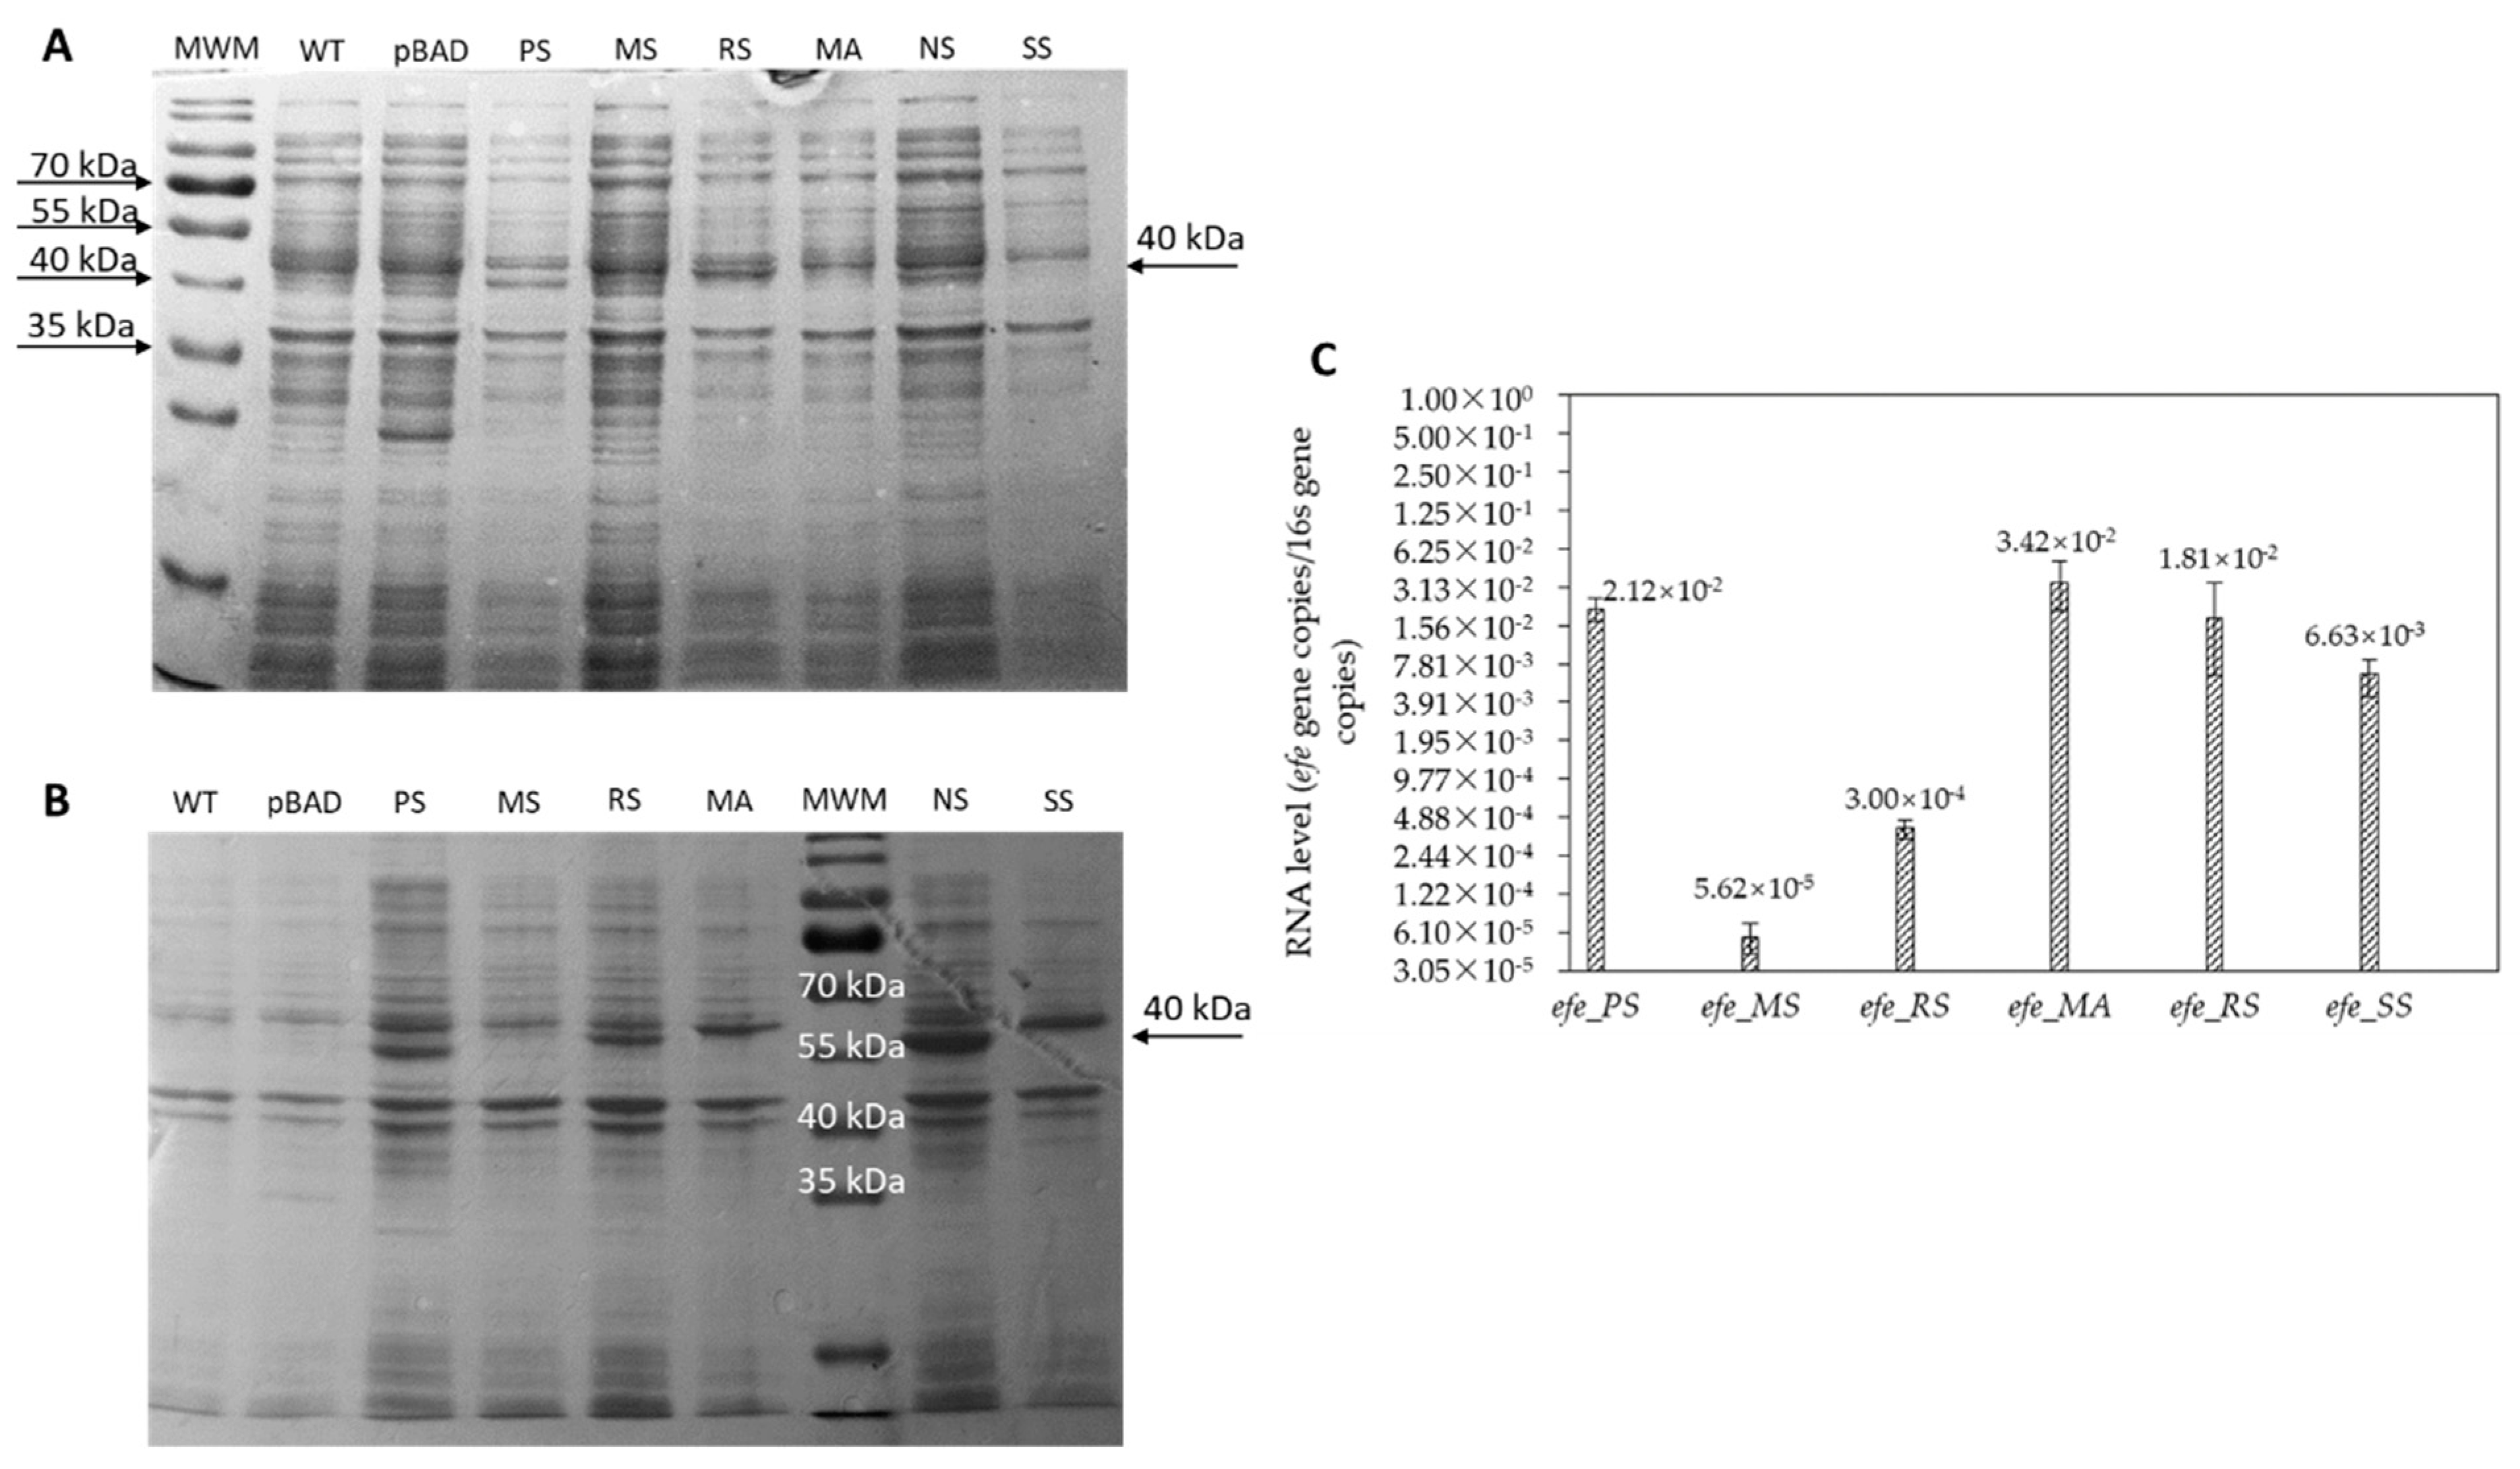
Figure 5C) was used to test the mRNA level. First, the standard curves were drawn to calculate the absolute gene copy numbers. PCR efficiency of these curves was around 90–110% (
Figure S5), proving that primer and standard curves were accurate. Then, the absolute gene copy number of
efe genes was compared to the absolute gene copy number of the 16sRNA gene to get the relative gene copy number shown in
Figure 5.
SDS-PAGE (
Figure 5A,B) was used to analyse the protein production in the crude extract. The bands of Efe protein were around 39–42 kDa. Their identity was also confirmed by a protein MS Q-E test (
Table S3, Figure S6). Analysis of the insoluble fraction using SDS-PAGE showed that the proportion of target protein of crude extract in the supernatant was low (5.6–12.7%), and some inclusion bodies were also formed. It may be because of the excessive protein concentration or challenges in the protein folding process. It may influence the productivity of ethylene and need to be improved.
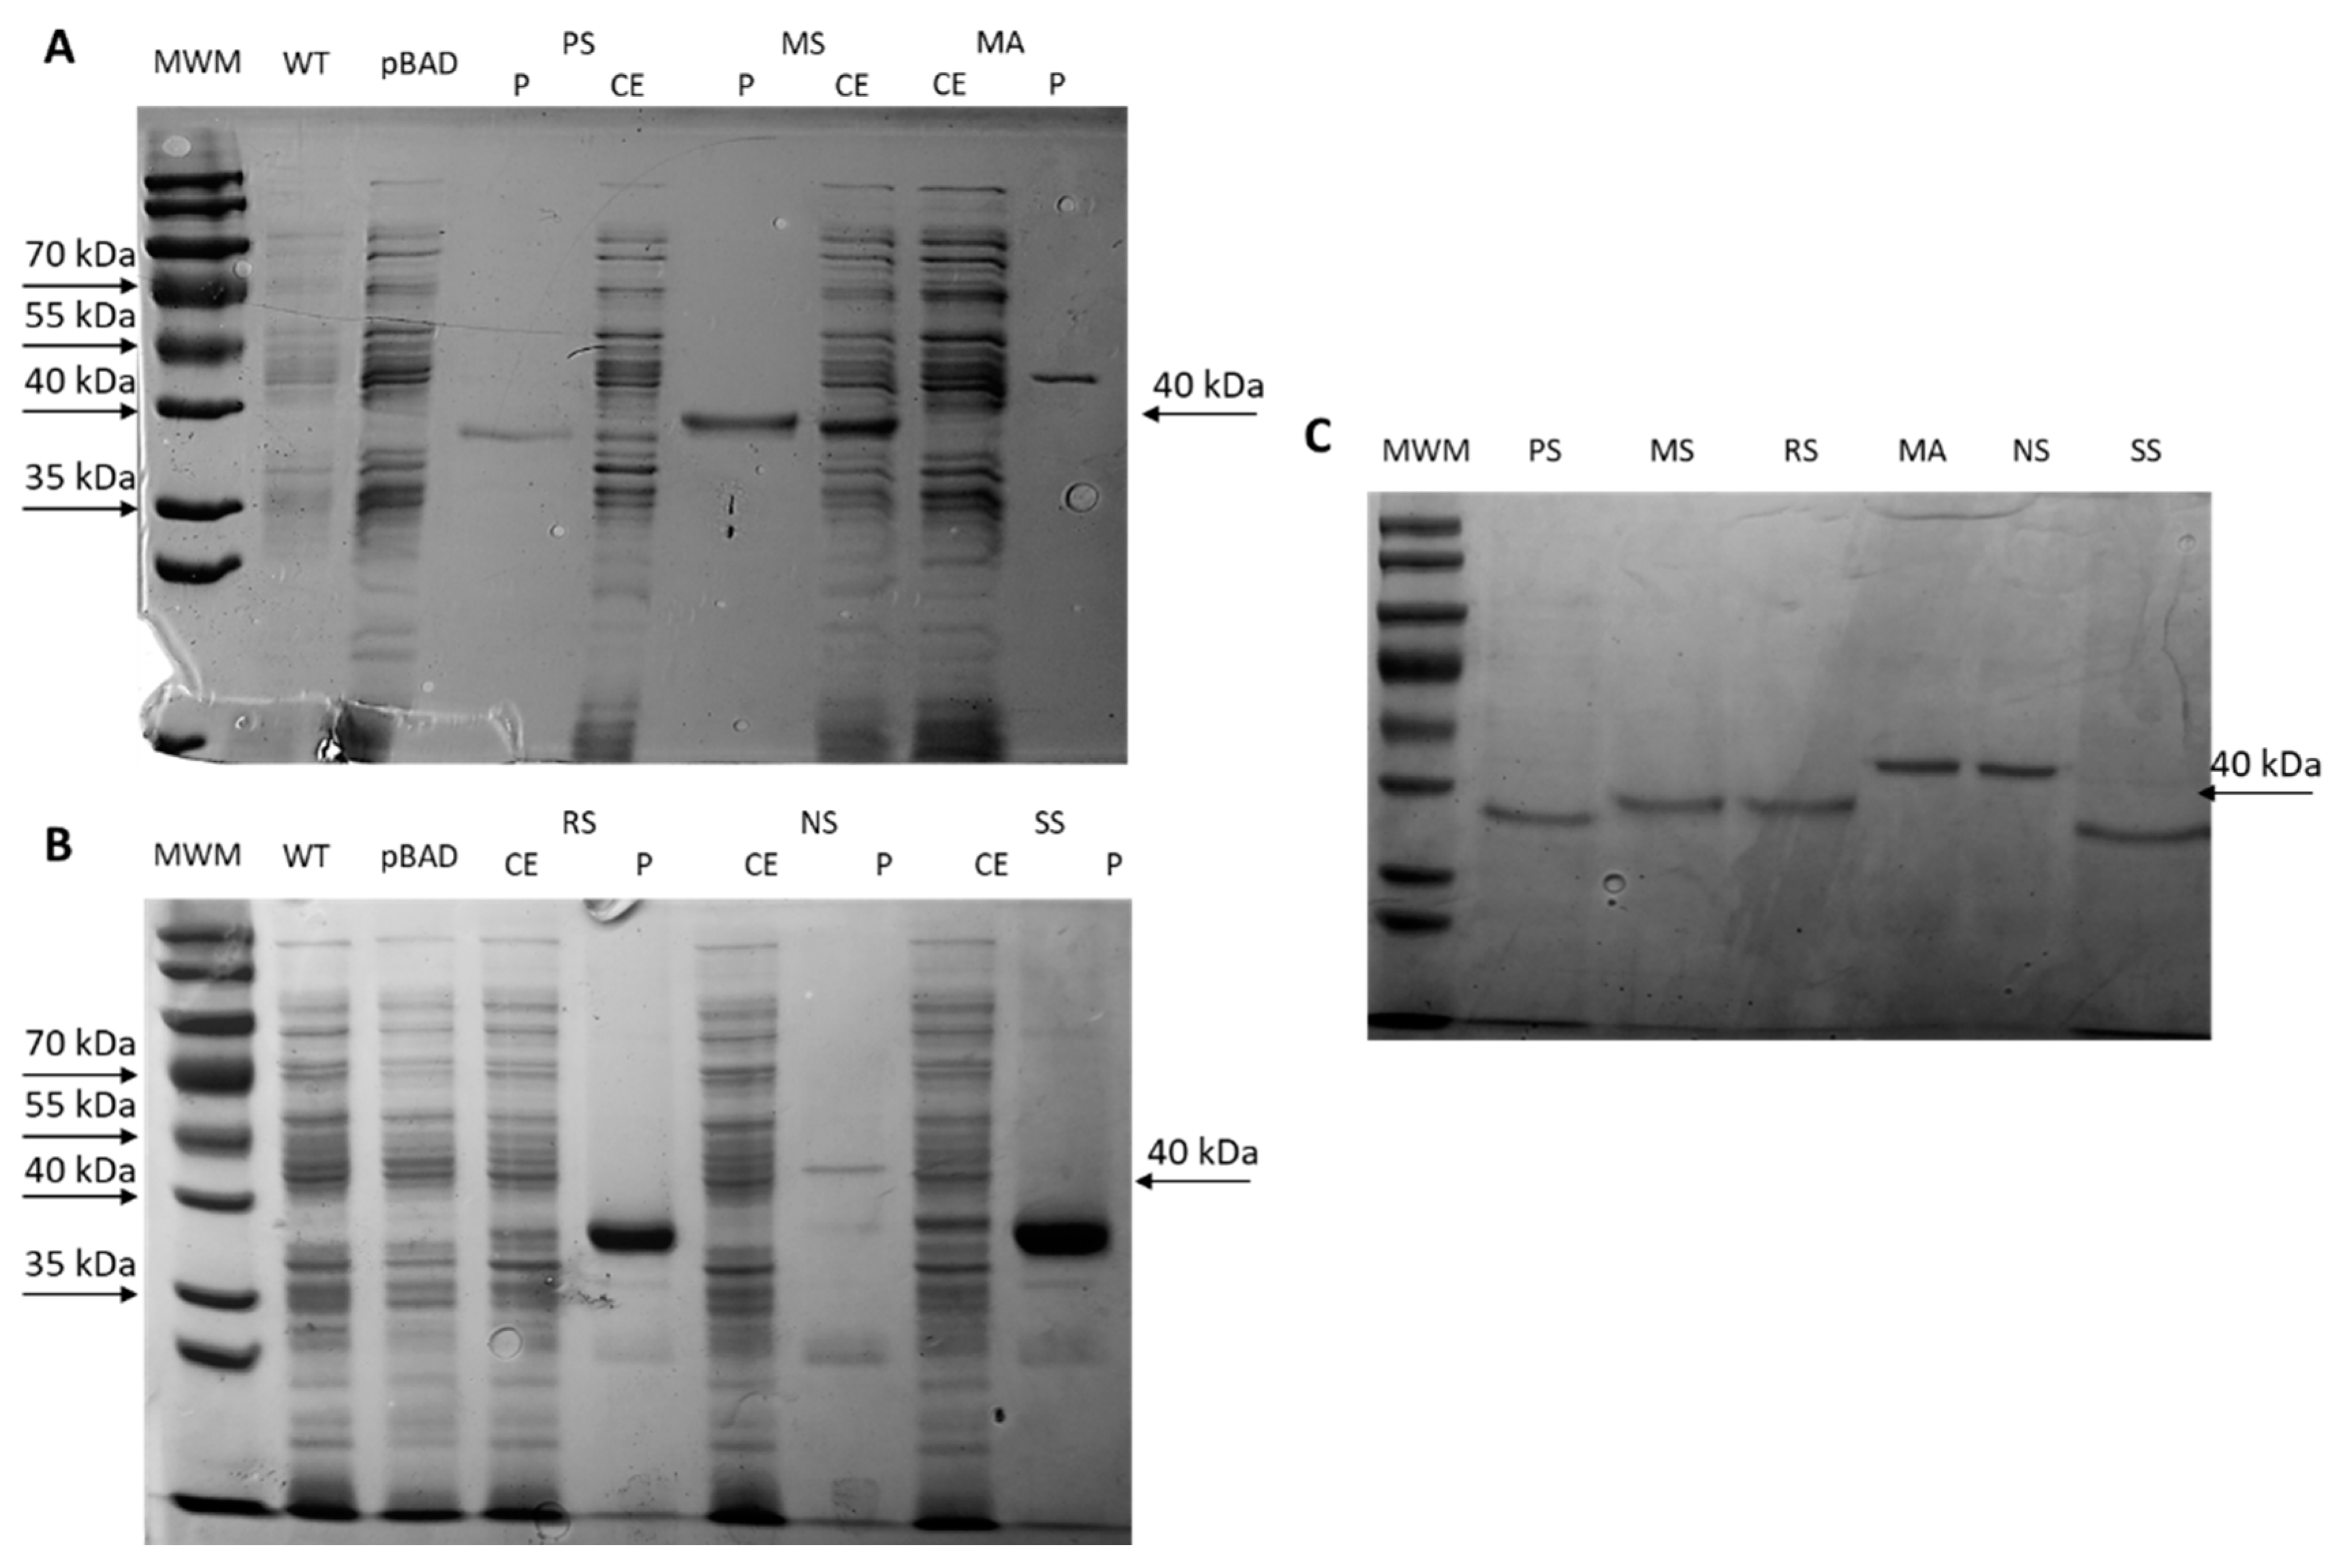
Efes with his-tag were purified with Ni beads (
Figure 6). Protein concentration measured by BCA kit was: Efe_PS: 4.3 μg/μL; Efe_RS: 1.107 μg/μL; Efe_MS: 8.88 μg/μL; Efe_MA: 5.38 μg/μL; Efe_NS: 3.97 μg/μL; Efe_SS: 5.55 μg/μL. Then, they were adjusted to the same protein concentration and used for the activity test in the next step (
Figure 6C).
2.6. Enzymatic Activity In Vitro
Enzymatic activity in vitro was calculated by converting AKG to ethylene in the reaction system. The K
m and k
cat of each Efes were calculated and shown in
Table 1. The K
m of the six Efes are 15.1–45.9 μM and 19.8–37.3 μM for AKG and ARG, respectively. In most of Efes, the K
m of ARG and AKG is similar, which means they have a fair affinity to these Efes. This is concurrent with previous studies where K
m (ARG) was determined as 18 μM and K
m (AKG) as 19 μM [
15]. However, Efe_MA and Efe_SS have a higher K
m (ARG) than K
m (AKG), which means a higher concentration of ARG in the reaction system may be more important for the reaction speed or vice versa.
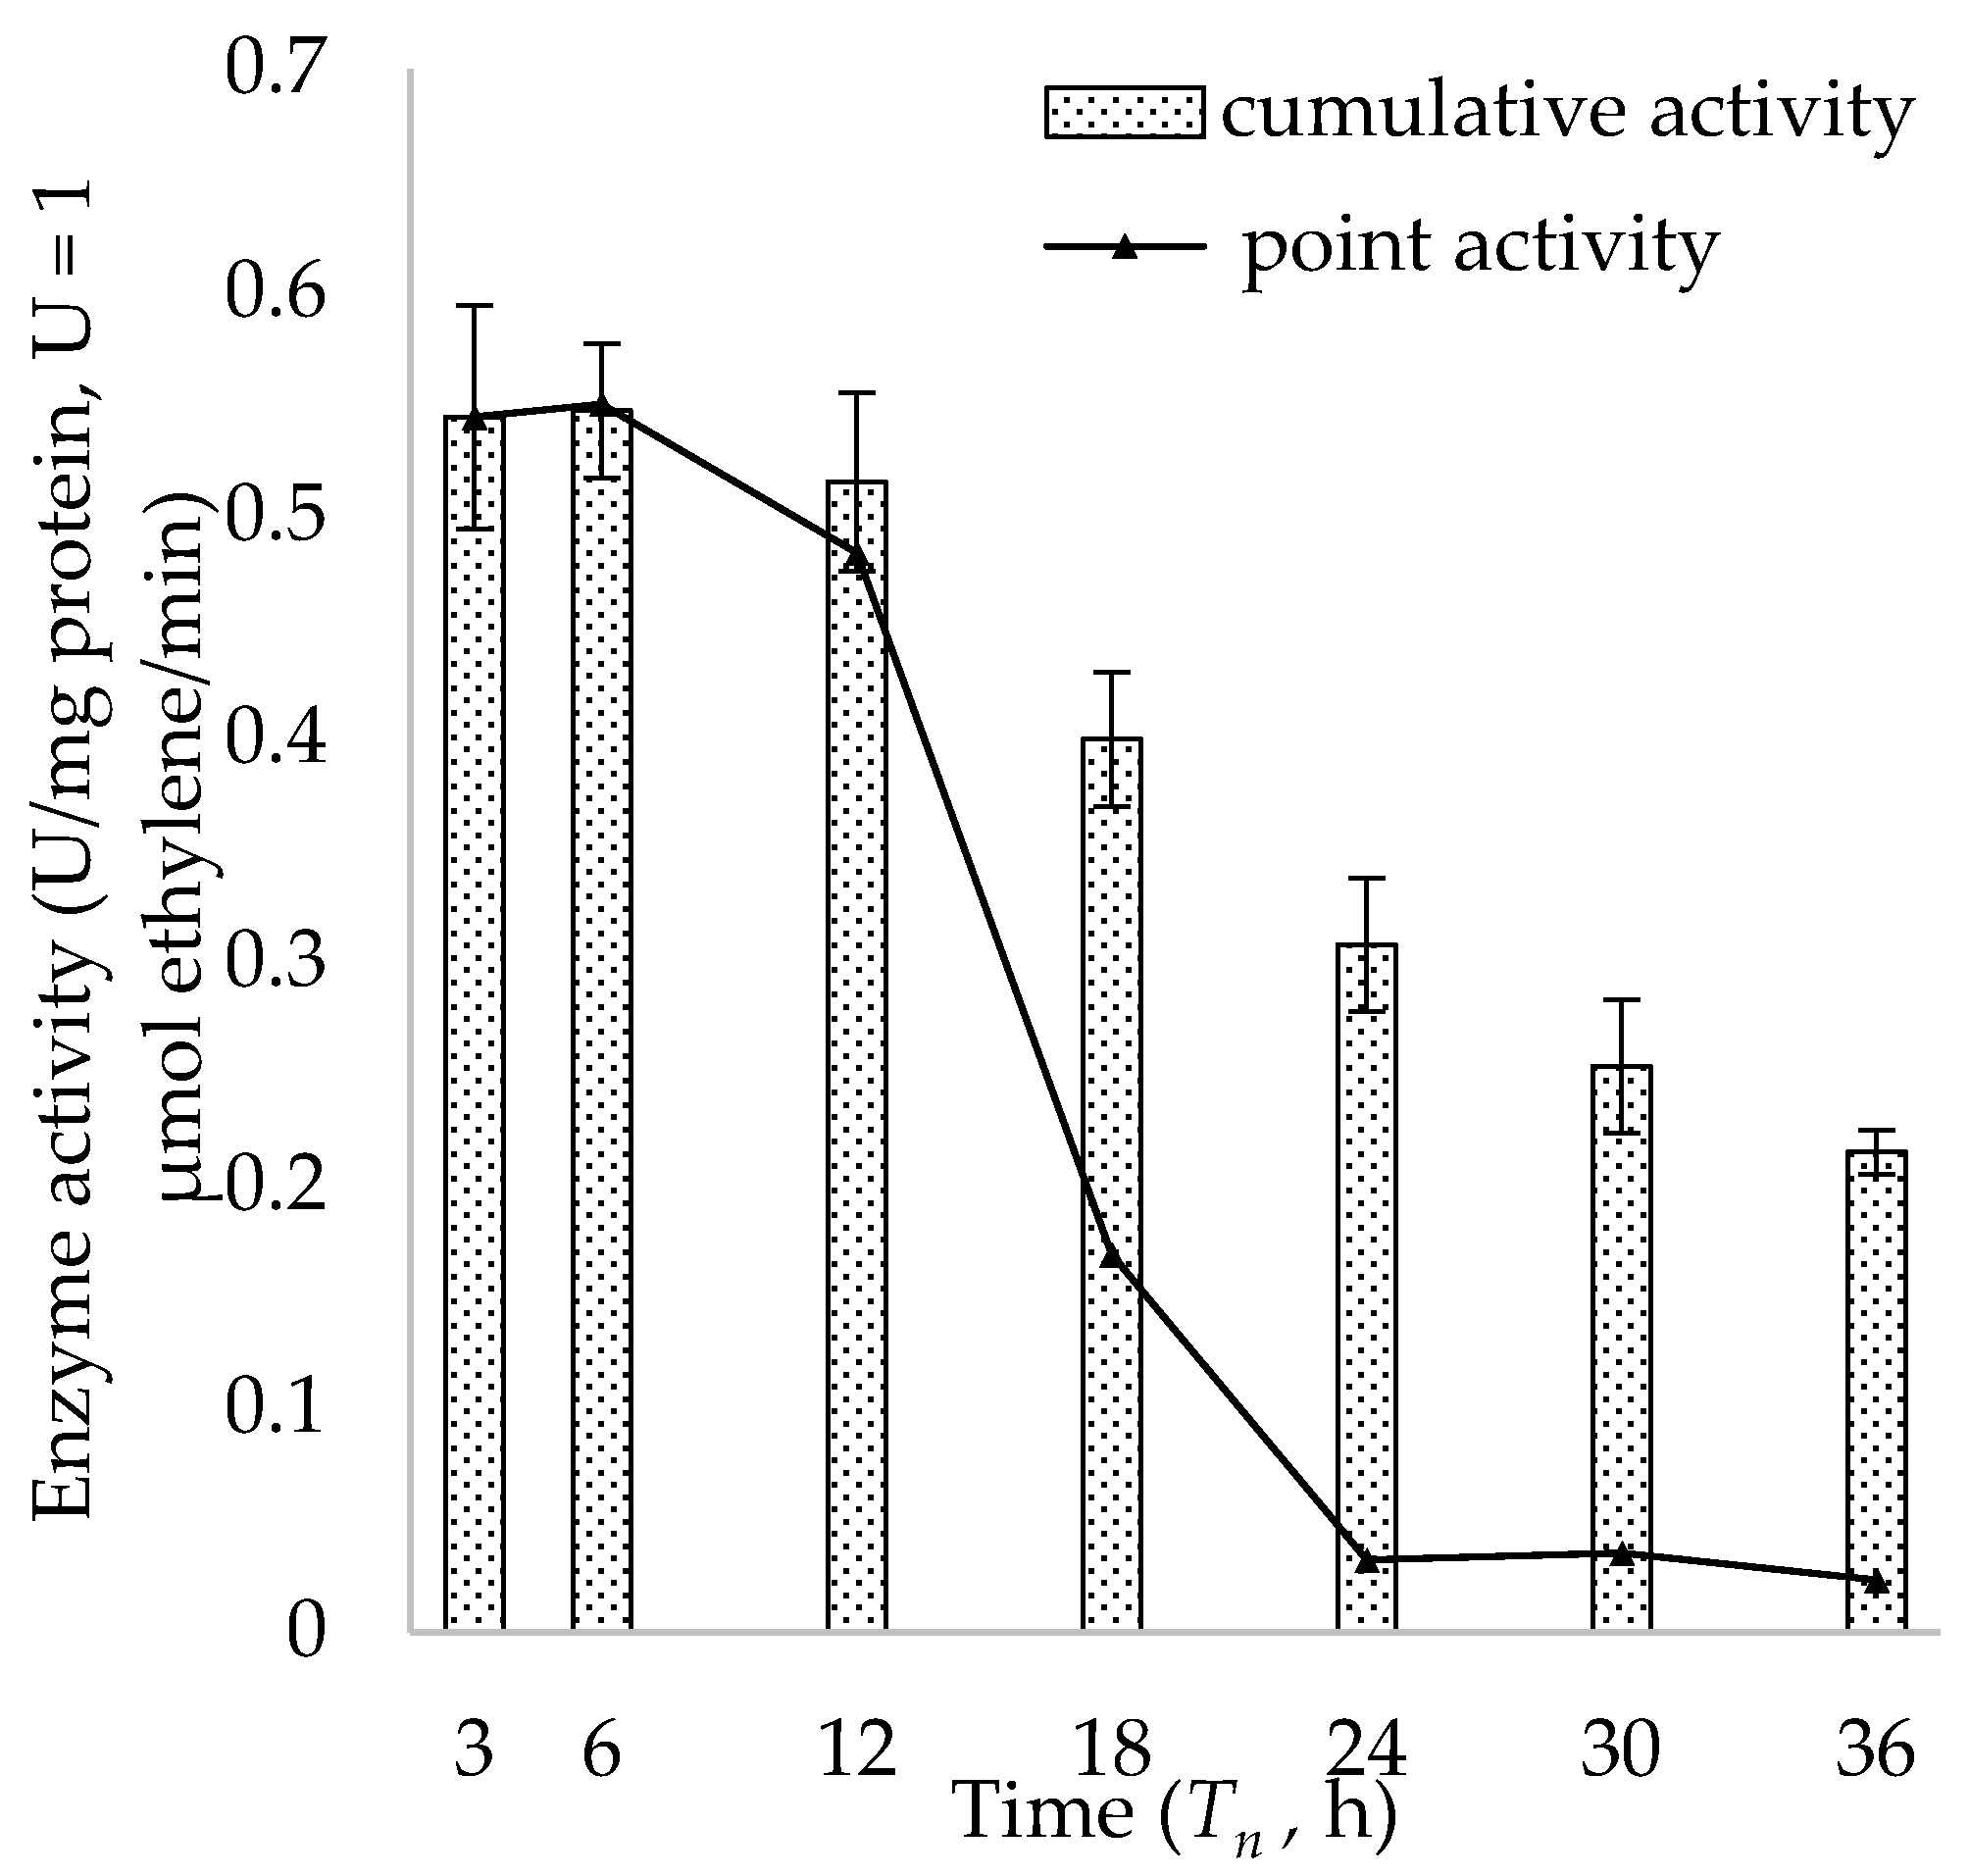
Efe_PS was used to explore the change of enzymatic activity in vitro with time at 20 °C. Samples were drawn from the reaction system at different time points (T
n) to detect the activity. The cumulative activity (activity from 0 h to T
n h) and the point activity (activity from T
n−1 h to T
n h) in vitro are both calculated (
Figure 7). The activity remained high before 12 h dropped subsequently, and the half-life (t
1/2) of the enzyme was around 12–18 h.
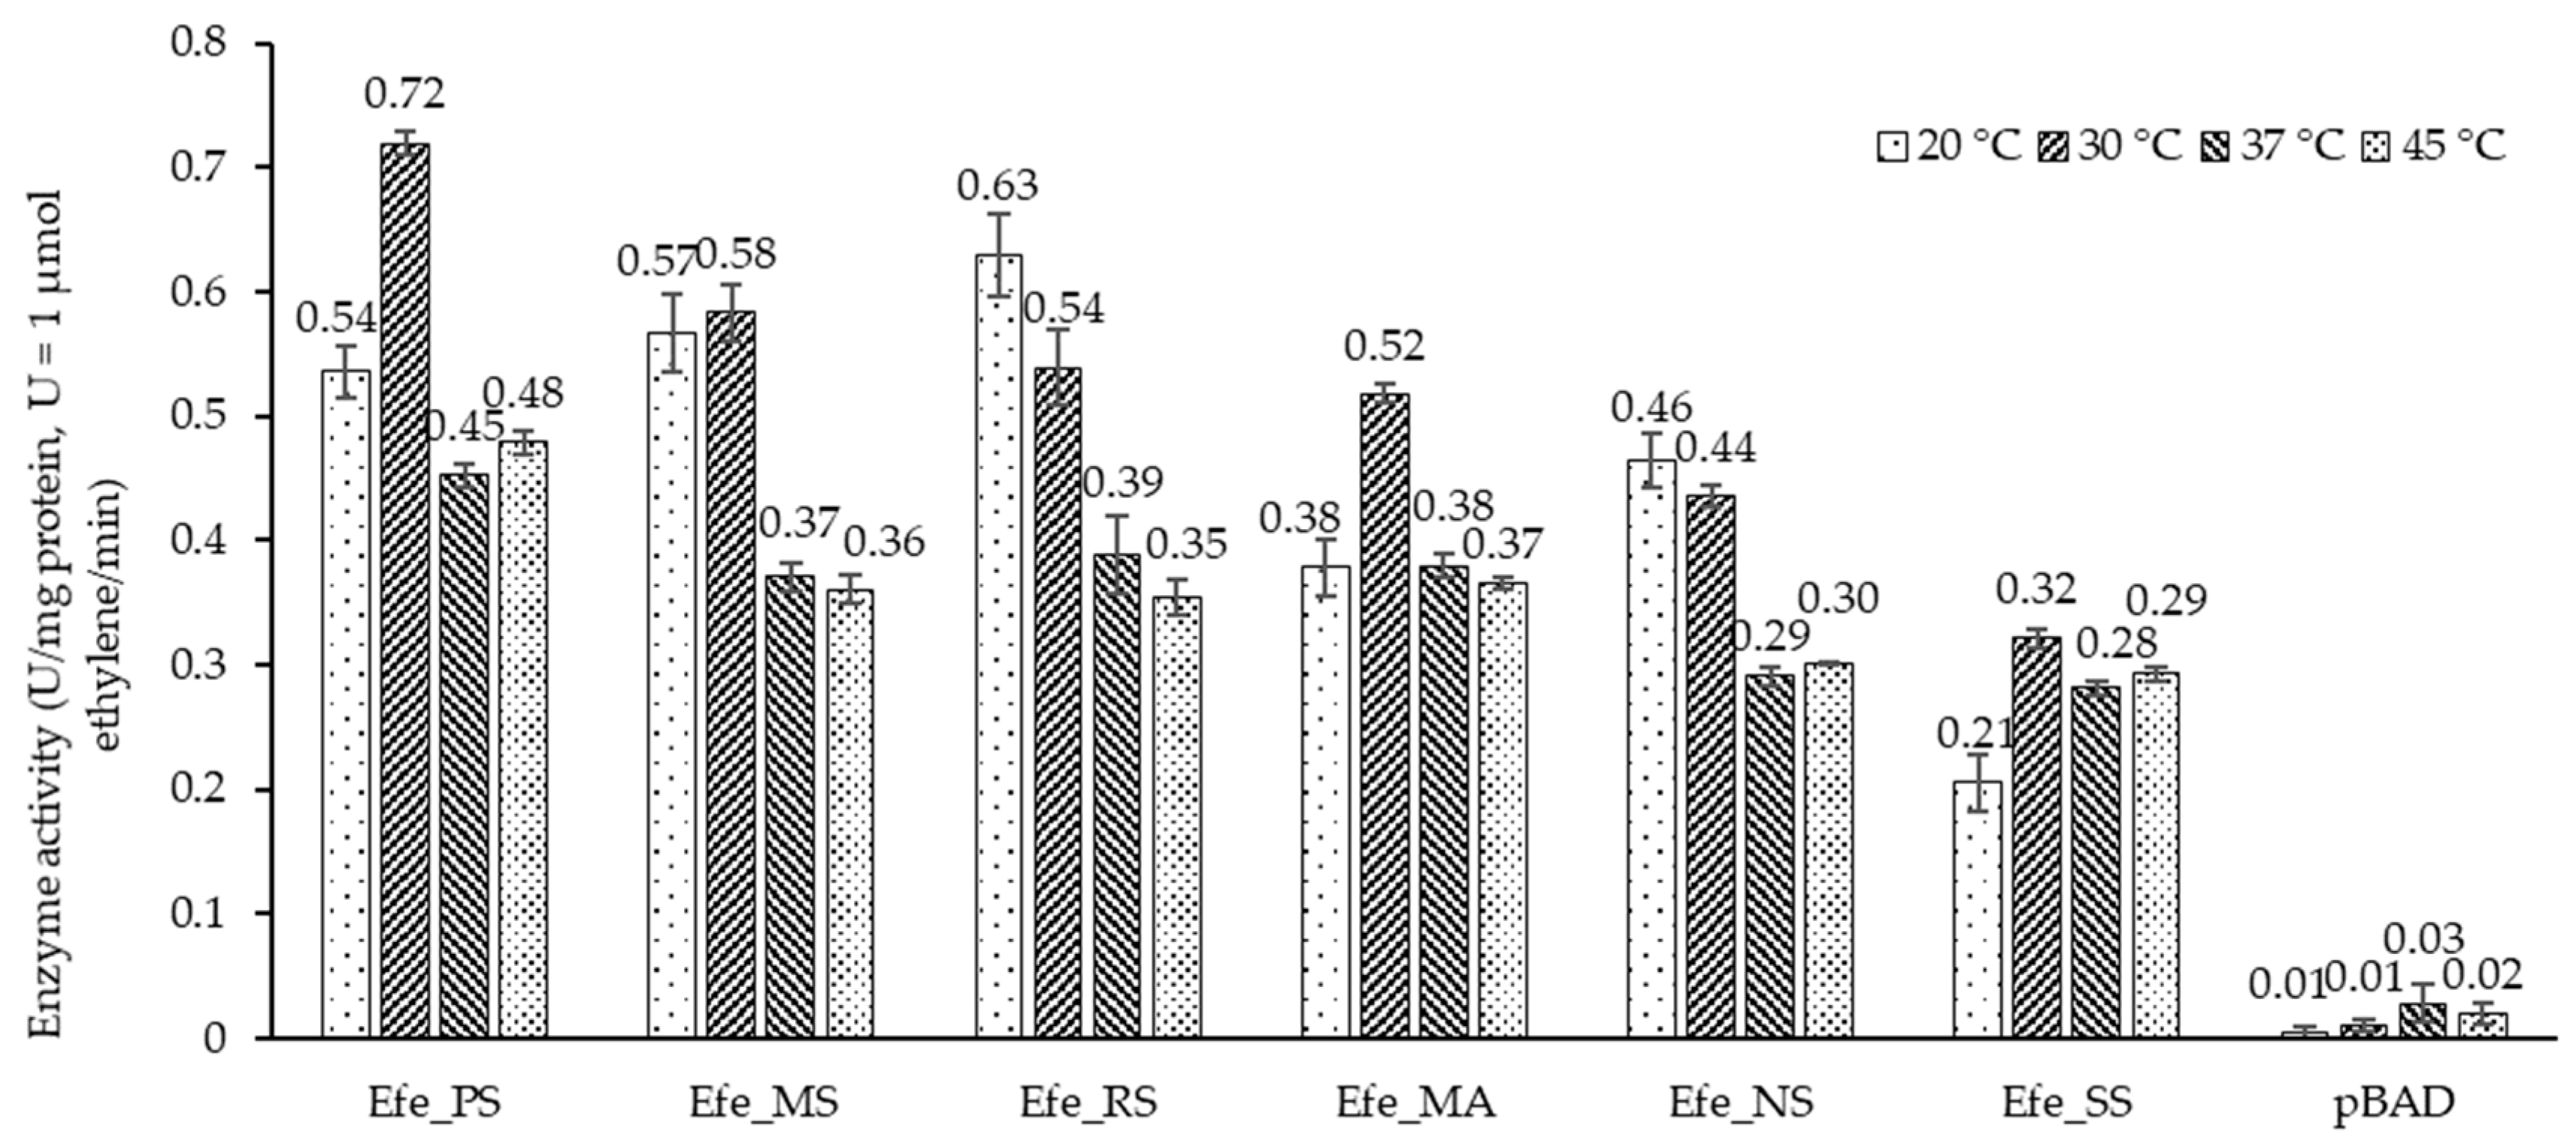
Based on these results, 12 h was set as the reaction time for the temperature study of activity in vitro. As is shown in
Figure 8, all the six Efes had a higher activity at the temperature of 20 °C or 30 °C. Although they still were capable of catalysis at 37 °C and 45 °C, their conversion rates were approximately half of the highest reported. Besides, there was little difference between the catalytic activity of the six enzymes. All the purified proteins worked well in vitro and proved that the minor alterations of the ARG ligand site in the structure do not significantly affect ARG binding. This result is concurrent with bioinformatic analyses. During the purification process, the enzymes were purified to homogeneity (
Table 2), but the purification yield was relatively low, ranging from 20–40%.
2.7. Ethylene Production in Cells
According to the selection of induction conditions and the study of enzymatic activity in vitro, enzymes were well expressed and kept active under 0.02% arabinose in LB at 20 °C. Therefore, these parameters were set as the ethylene production condition.
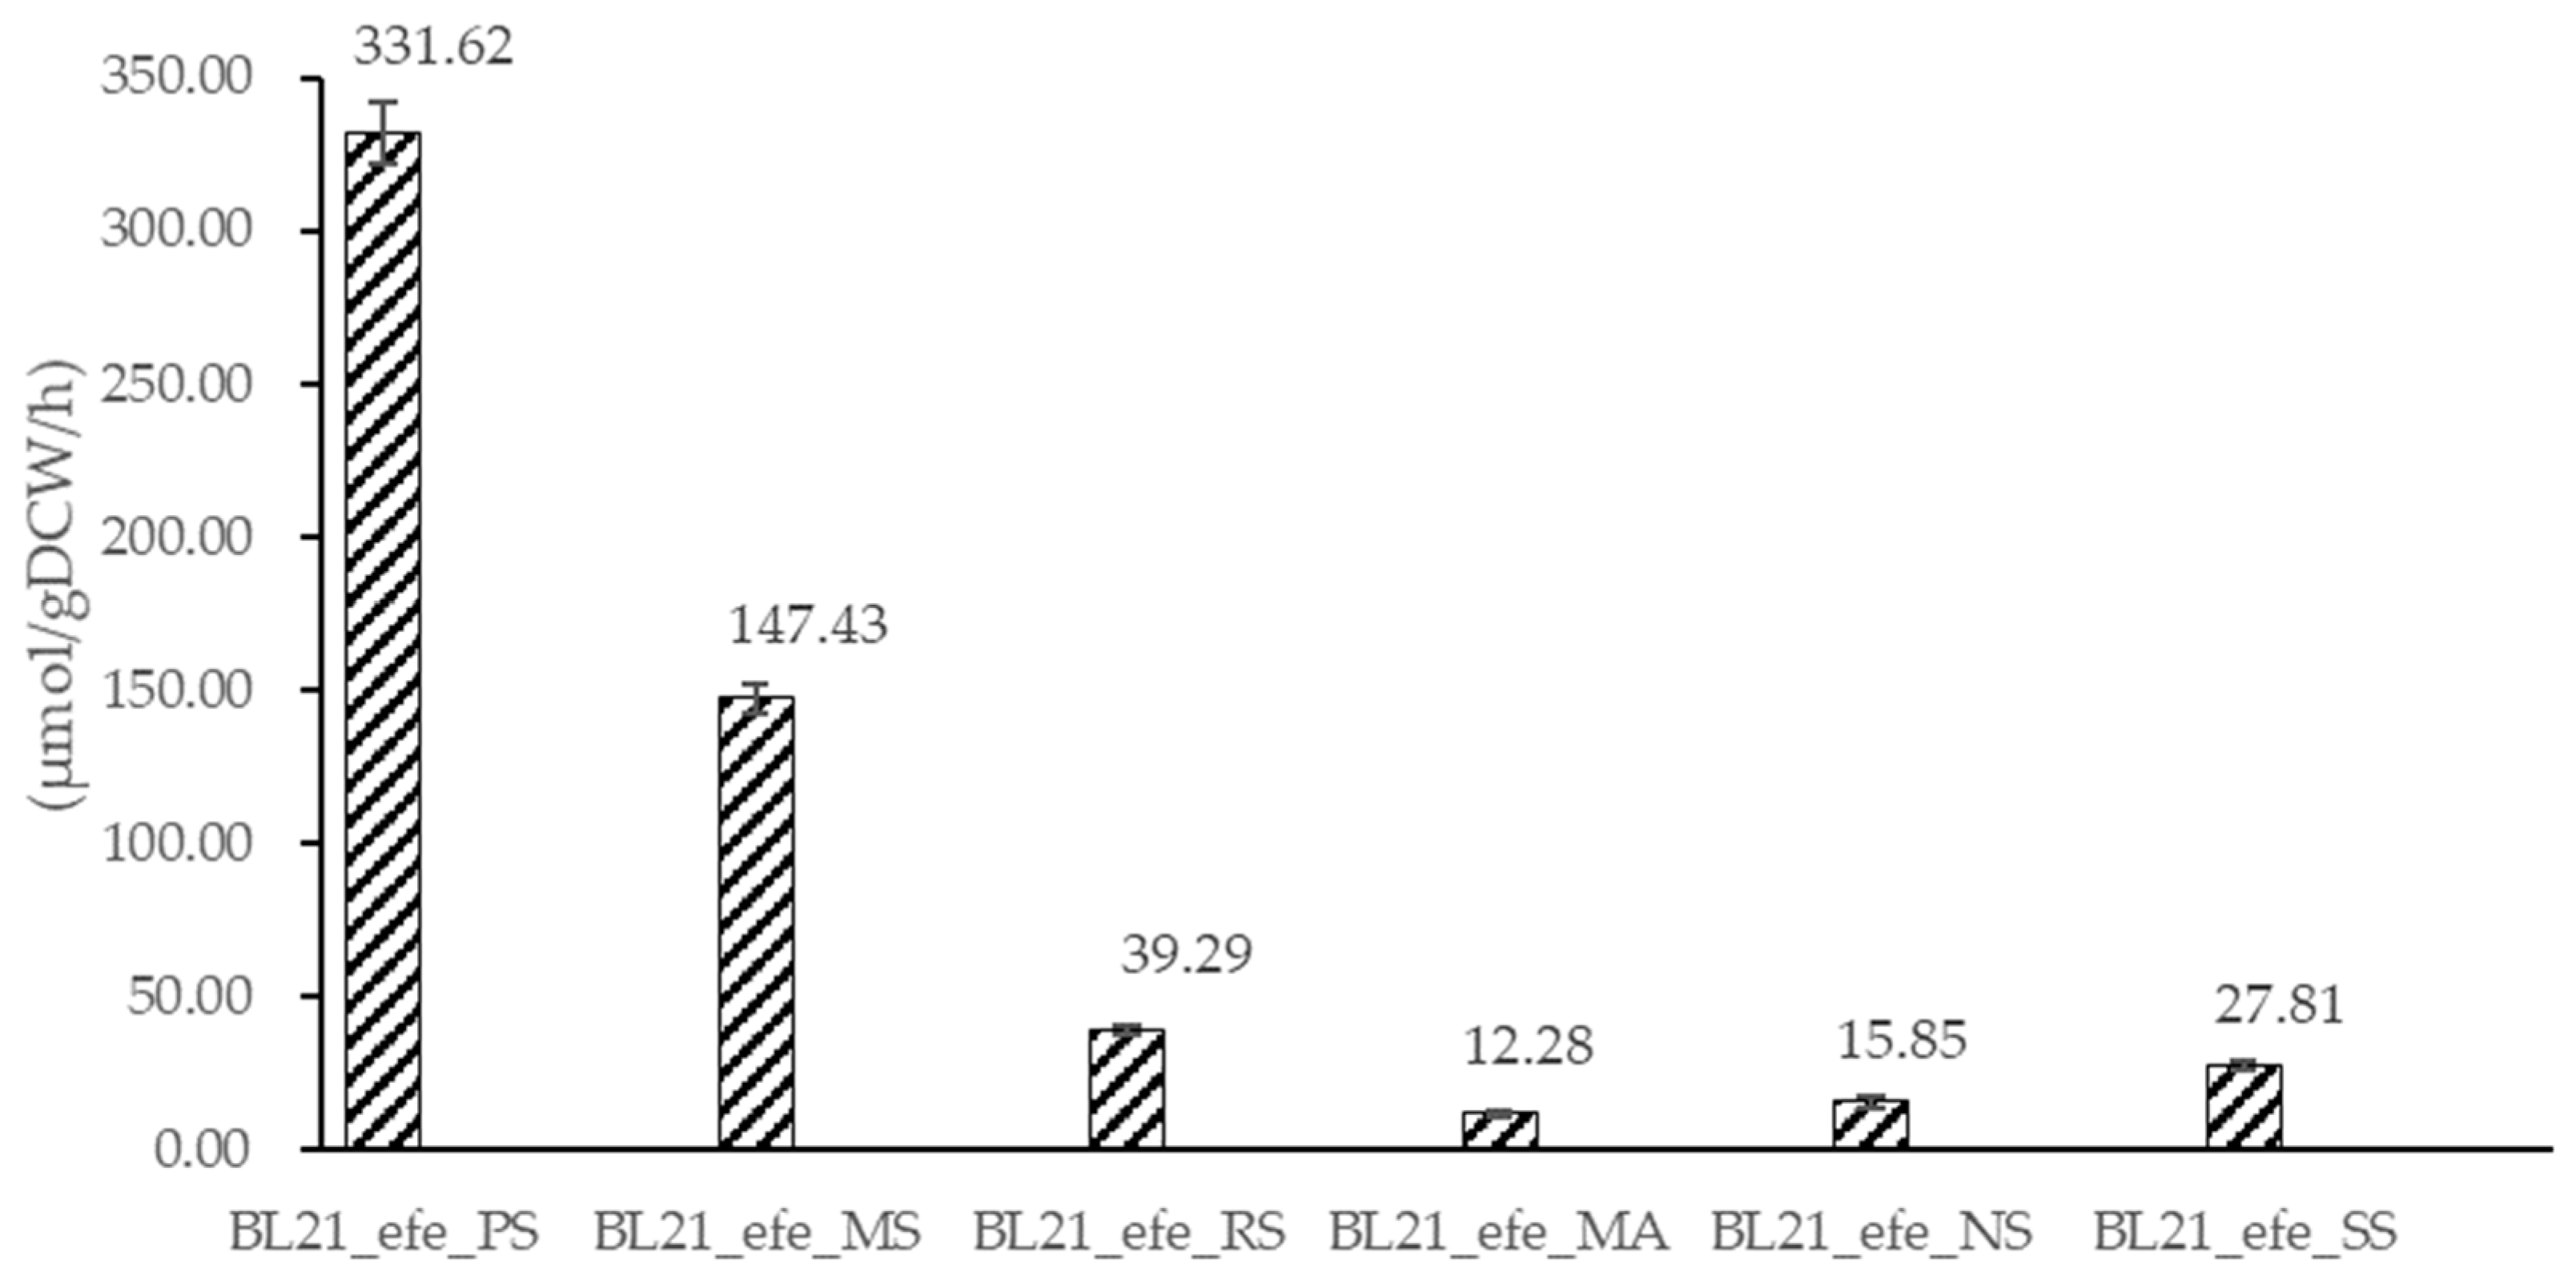
Ethylene production results of the six Efes are shown in
Figure 9. The activity of BL21_
efe_PS is 331.61 μmol/gDCW/h. It is a little lower than the activity before using a
lac promoter on a high-copy pUC18 vector (625.0 μmol/gDCW/h) or using a
tac promoter on a medium-copy pBR322 vector (412.9 μmol/gDCW/h) [
25]. Since plasmid pBAD in this study is a low-copy plasmid, it may lead to a lower RNA transcription and enzyme production in the cell. And it is reasonable that its activity in cells was slightly lower than in the previous study. For the other five strains, their ethylene production proves that all of them could work as an ethylene-forming enzyme, albeit at lower activity. Some of the factors contributing to that could be a lower protein expression or the formation of insoluble inclusion bodies that draft both amino acid building blocks and energy from the metabolism. Although Efe_MS and Efe_RS have relatively high activity in vitro at 20 °C, their transcript levels in engineered
E. coli are low, as shown in qPCR results. It may be the primary reason for low enzymatic activity in vivo. Therefore, in the future, it may be worth using a high-copy plasmid to improve the RNA level of Efe_MS and Efe_RS to improve the activity in cells. The three enzymes of lowest activity—Efe_MA, Efe_NS, and Efe_SS are of cyanobacterial origin. Additionally, Efe_MS is from deltaproteobacteria, Efe_RS from betaproteobacteria, and Efe_PS from gammaproteobacteria, all much closer phylogenetically to
E. coli. This could contribute to more efficient protein expression due to incompatibility of intracellular environment rare codons, amino acid sequence, challenging folding, etc. Besides, the changes in the β-strand of Efe_MS, Efe_MA, and Efe_RS may cause a lower activity ratio in cells to purified protein than Efe_MS and Efe_SS.
3. Discussion
The analysis of the molecular structure and sequence conservation (
Figure 3,
Table S2) shows that the sequences were conserved at the binding sites of Fe and AKG, while there were some non-conservative changes in the ARG binding sites and β-strands structures. But the change was not significant and not located in the key function sites. Combined with the successful production of ethylene in vitro and in vivo, these changes may have little effect on their work as Efe.
Experiments based on BL21_
efe_PS+ for optimising the induction environment (
Figure 4) showed that the
efe gene in pBAD plasmid was transcripted and expressed better at 20 °C than 30 °C and can work well in low concentration (0.02%) of arabinose as the inducer. This means that the cost of using arabinose as an inducer in large-scale production can be considerably low. Compared to the research of Digiacomo et al. [
34] using the combination of arabinose and light-induced promoter at 37 °C with 5 mM (~0.075%) arabinose (~25 nmol/OD
600/mL for 4 h), our ethylene production of BL21_
efe_PS+ (~3 μmol/OD
600/mL for 5 h) was markedly improved at 20 °C with 0.02% arabinose. Low temperature avoided the mass formation of inclusion bodies, and an appropriate arabinose concentration enabled the gene to achieve better expression. Meanwhile, the volatile character of the product is not affected by the lower expression temperature. The analysis of enzyme activities also shows that Efes maintain stability at 20 °C for a long time (
Figure 7). Therefore, incubating the expression cells at 20 °C with 0.02% arabinose was optimal for producing ethylene using this expression system. While SDS-PAGE analysis of the insoluble fraction confirmed the existence of inclusion bodies at 20 °C; their formation was reduced regarding other conditions. In the future, it would be worthwhile to utilize solubility partners to mitigate these deleterious effects, similar to the study of Ishihara et al. [
24].
In our study, the enzyme activities of Efes in vitro were significantly higher than those in vivo (
Table 2,
Figure 9). However, due to the complexity of protein purification and the strict requirements of the reaction conditions for purified protein, producing ethylene in cells may be more suitable for large-scale production. This difference may prove that the addition of precursor substances plays an important role in increasing yield, which was also proved by Lynch et al. [
35]: the addition of precursors (2 mM AKG and 3 mM ARG) can increase the yield in vivo by two to three times. Alternative metabolic methods to increase the flux towards AKG and ARG were also tested. With the analysis of the K
m of the six Efes, Efe_PS, Efe_MS, Efe_RS, Efe_NS have a higher level of K
m than the other two Efes. These four Efes may require lower addition of precursors in the medium and may be more suitable for industrial production. Combining the ethylene production in cells, the production of the five new Efes was 12.28–147.43 μmol/gDCW/h. It proves that all the strains can be successfully used in cells, but their activities are still lower than Efe_PS. Among the new Efes, Efe_MS showed the best ethylene production, and it may be a promising candidate for the industrial production of ethylene.
4. Materials and Methods
4.1. Efe Sequence Discovery
Potential ethylene forming enzymes sequences exhibiting 60–95% percent identity and 50–100% query coverage to the amino acid sequence of Efe of
P. syringae pv. phaseolicola (protein ID: AAD16440.1) from cyanobacteria and proteobacteria (
Table S1) were extracted from the NCBI database accessed on 1 February 2022 (
https://www.ncbi.nlm.nih.gov/). They were selected by NCBI blastp, in the nt/nr database, excluding models (XM/XP) and uncultured/environmental sample sequences. MEGA-X software (Available at
https://www.megasoftware.net/) [
36] was accessed on 3 February 2022 to perform a bootstrap tree with the Maximum Likelihood method and JTT matrix-based model [
37] for phylogenetic analysis after aligning sequences with ClustalW (gap opening: 10, gap extension: 0.2, delay divergent cutoff: 30%). The bootstrap consensus tree was inferred from 1000 replicates to represent the evolutionary relationship of the putative ethylene-forming proteins [
38].
4.2. Sequence Analysis and Structural Modelling
Six Efe amino acid sequences from different strains were aligned and compared in Geneious Prime 1 January 2022 (Available at
https://www.geneious.com/resources/#downloads). Structural models were built and accessed on 1 January 2022 by SWISS-MODEL (
https://swissmodel.expasy.org/) and aligned in PyMOL (Available at
https://pymol.org/2/) for secondary verification of the reliability of the structure, accessed on 1 January 2022. The structure of Efe in
P. syringae pv. phaseolicola (PDB ID: 6vp4.1.A) was set as the reference for the aligning and modelling. In addition, the conservation of helix structures and ligand binding sites (AKG, ARG, iron-binding sites) were analysed.
4.3. Strains, Plasmids, and Culture Conditions
All plasmids were constructed in E. coli DH5α, and expression work was done in E. coli BL21. The expression plasmid pBAD vector) was used for protein production. The plasmid was a gift from Scott Gradia (Addgene plasmid # 37501; RRID: Addgene_37501). The plasmid contained araBAD arabinose promoter and ampicillin resistance gene.
E. coli was grown on LB medium or agar plates at 37 °C in an incubator (HZQ-X300C, Yiheng, Shanghai, China). Further, 50–100 μg/mL of ampicillin was added to maintain plasmids along with arabinose, which was used to induce the expression of
efe genes. All the
E. coli strains and plasmids used in this study are listed in
Table 3.
After culturing overnight, cell culture was diluted into LB in a ratio of 1:50, cultured at 37 °C for 180 rpm until it grew to the concentration of OD600 = 0.4–0.6. Arabinose was added to the final concentration of 0.02%, the temperature was adjusted to 20 °C, and it was shaken for 5 h to express a protein or produce ethylene.
4.4. Construction of the Recombinant Plasmids
The protein sequences were obtained from NCBI, reverse translated, and synthesised by BGI Write (Beijing, China). The recombinant plasmids and primers used in this study are shown in
Table 3 and
Table 4.
Efe genes were combined to EcoRV-predigested pBAD_LIC_cloning_vector using ClonExpressII One Step Cloning Kit (Vazyme, Nanjing) (
Figure S3.). Primers for the assembly were designed with 15–20 bp overhangs (underlined). His-tag sequence (red) was added at the 3′-end of each gene to facilitate the protein purification step.
After the recombinant plasmids were constructed, they were transformed by the calcium ion transformation method initially to E. coli DH5α and ultimately to E. coli BL21.
Wherelowercase bases represent homology sequence, ITALICS—6 × His tag added to the C-terminal part of the protein.
4.5. Quantification of Cells and pH Detection of Culture
OD600 of the culture was tested for measuring cell density with an EPOCH microplate reader (BIOTEK, Winooski, VT, USA). The pH of the culture environment was measured with a PB-10 pH meter (SARTORIUS, Goettingen, Germany).
4.6. Real-Time RT-PCR Analysis
1.5 mL E. coli cells of each sample were collected by centrifugation at 4 °C at 8000 rpm for 3 min to isolate RNA with Total RNA kit I (Omega bio-tek, Norcross, GA, USA). PrimeScript™ RT reagent Kit with gDNA Eraser (Takara, Tokyo, Japan) was used to erase gDNA and reverse transcribe RNA to cDNA. qPCR was done with TB Green Premix Ex Taq II (TaKaRa) in a QuantStudio 5 real-time system (ABI, Thernofisher, Waltham, MA, USA). Primers for qPCR of the efe gene are F: 5’-ATGCCATAGCATTTTTATCC-3’ and R: 5′-GATTTAATCTGTATCAGG-3’. Standard curves were finished with 10-fold serial dilution of the standard fragments (around 100–200 bp, amplified by qPCR primers). They were used to ensure the PCR efficiency and calculate the RNA gene copies. A fragment of 16sRNA in E. coli was used as the reference gene for RT-qPCR. Its primers are F: 5’-ACTCCTACGGGAGGCAGCAG-3’ and R: 5’-ATTACCGCGGCTGCTGG-3’.
4.7. SDS-PAGE Analysis and Protein Purification
Cells were collected by centrifugation at 4 °C at 8000 rpm for 10 min. The pelleted fraction was suspended again in Binding buffer (20 mM Tris, 0.5 M NaCl, 5 mM imidazole, pH 7.8) or phosphate buffer (PBS). Cells were broken in ice using an Ultrasonic Cell Disruptor (SCIENTZ-IID, Ningbo, China). The supernatant and insoluble fraction were separately analysed with sodium dodecyl sulfate-polyacrylamide gel electrophoresis (SDS-PAGE). The proportion of target protein in it was calculated by ImageJ with its integrated density. A protein MS Q-E test (BGI, Guangzhou, China) was used to verify the expression results.
Efes were purified with Ni NTA Beads 6FF (Smart-life science, Shenzhen, China) according to the manufacturer’s instructions. They were washed and eluted with different concentrations of imidazole. Ultrafiltration centrifugal tubes (10 kDa, Sigma-Aldrich Merck, Darmstadat, Germany) were used to wash and concentrate the purified protein. The concentration of the purified protein was measured with BCA Protein Assay Kit (Thermo Scientific, Waltham, MA, USA).
4.8. Enzymatic Activity In Vitro
The activity of a purified protein in vitro was determined based on the conversion of AKG during the ethylene-forming reaction. The reaction system (800 μL) is consisted of 40 mM HEPES/NaOH (pH = 7.5), 0.2 mg/mL AKG, 0.5 mM ARG, 0.2 mM FeSO4, 1 mM L-histidine and 100 μL of 12 μg/mL purified proteins referring to the research of Katsuya [
24]. The reaction was initiated by combining the enzyme and the reaction solution. Then it was incubated for 12 h in sterile 1.5 mL microcentrifuge tubes at constant temperatures and stirred (300 rpm). Subsequently, the samples were incubated for 5 min at 80 °C to inactivate the enzyme and cool down. AKG or ARG in the reaction system was set to different concentration gradients to analyse k
cat and K
m of the six Efes and was calculated in the following way: 100 μL of 100 μg/mL purified proteins were added in the reaction system and incubated for 20 min at 20 °C. The concentration of AKG and ARG were saturating, and their respective ranges were 0.021–0.685 mM and 0.005–0.50 mM.
The amount of AKG converted during the reaction was determined by HPLC 1260 Infinity (Agilent, USA) with Agilent Hi-Plex column and RID detector. AKG was diluted into different concentrations in ddH
2O to make a standard curve. During the preparation of the reaction mixture, the same volume of ddH
2O and protein solution from BL21_pBAD as the Efes solution was added to the reaction buffer as the negative control group. Enzyme activity was defined as the amount (1 μmol) of ethylene produced by 1 mg of enzyme per minute. The ethylene production activity and AKG conversion activity in cells were calculated as follows:
ΔCAKG: AKG concentration difference in the system, measured by HPLC (μmol/mL); Cp: concentration of the Efe protein, measured by BCA kit (mg/mL); T: reaction time, 12 h (h).
4.9. Ethylene Production in Cells
Ethylene production in the gas phase was analysed in a headspace of a 60 mL bottle with a 5 mL cell culture. Such setup provides enough co-substrate O
2 and allows ethylene to be released into the headspace after formation in the cells. 1 mL air sample was injected to Agilent Technology 6850 GC FID with Porapak Q 3M × 1/8 column to measure the concentration of ethylene. Three biological replicates of each strain were prepared to measure ethylene production, while one was for density measurement with OD
600. The dry cellular weight measurement was done after freeze-drying for 24 h with a FREEZOME2.5 Lyophilizer (Labconco, Kansas City, MO, USA). The activity of ethylene production in cells was calculated as follows:
C: concentration of ethylene in the bottle, measured by GC (ppm); Va: gas volume in the bottle (mL); T: reaction time (h), 5 h; DCW: dry cellular weight, measured at the end of the reaction (g)
5. Conclusions
In this study, we identified and modelled five Efes selected by phylogenetic analysis and conservation of catalytic structure, heterologously expressed, and characterised them. The expression studies were performed in E. coli_BL21 using low-copy vector pBAD under the control of araC and araBAD promoter. The minor changes in structures were found in modelling and aligning, while all the five proteins retained the main framework of Efe. SDS-PAGE and qPCR results show that proteobacterial Efe_MS and Efe_RS had low mRNA levels, and some insoluble inclusion bodies were formed during the expression of these proteins. Improving the expression using a high-copy plasmid, changing the host, or improving the expression environment using fusion partners could facilitate higher ethylene yields. According to the comprehensive activity analysis in vitro and in vivo, the Efes have similar enzyme activity in vitro but very different enzyme activity in vivo. Nevertheless, activity in vitro and in vivo proves that all analysed enzymes exhibit ethylene-forming activity. They may be utilised in the clean production of ethylene and enzyme improvement, for example, using gene shuffling, which can be explored in the future. Comprehensive in vivo and in vitro enzyme activity for the five new Efes, Efe_MS has a lower Km of the precursor, AKG, and ARG, and the highest production in cells. It would be more appropriate as a promising candidate for the industrial production of ethylene.


 and
and 


