
Aortic Fibrosis in Insulin-Sensitive Mice with Endothelial Cell-Specific Deletion of Ceacam1 Gene

 , and
, and 
Abstract
1. Introduction
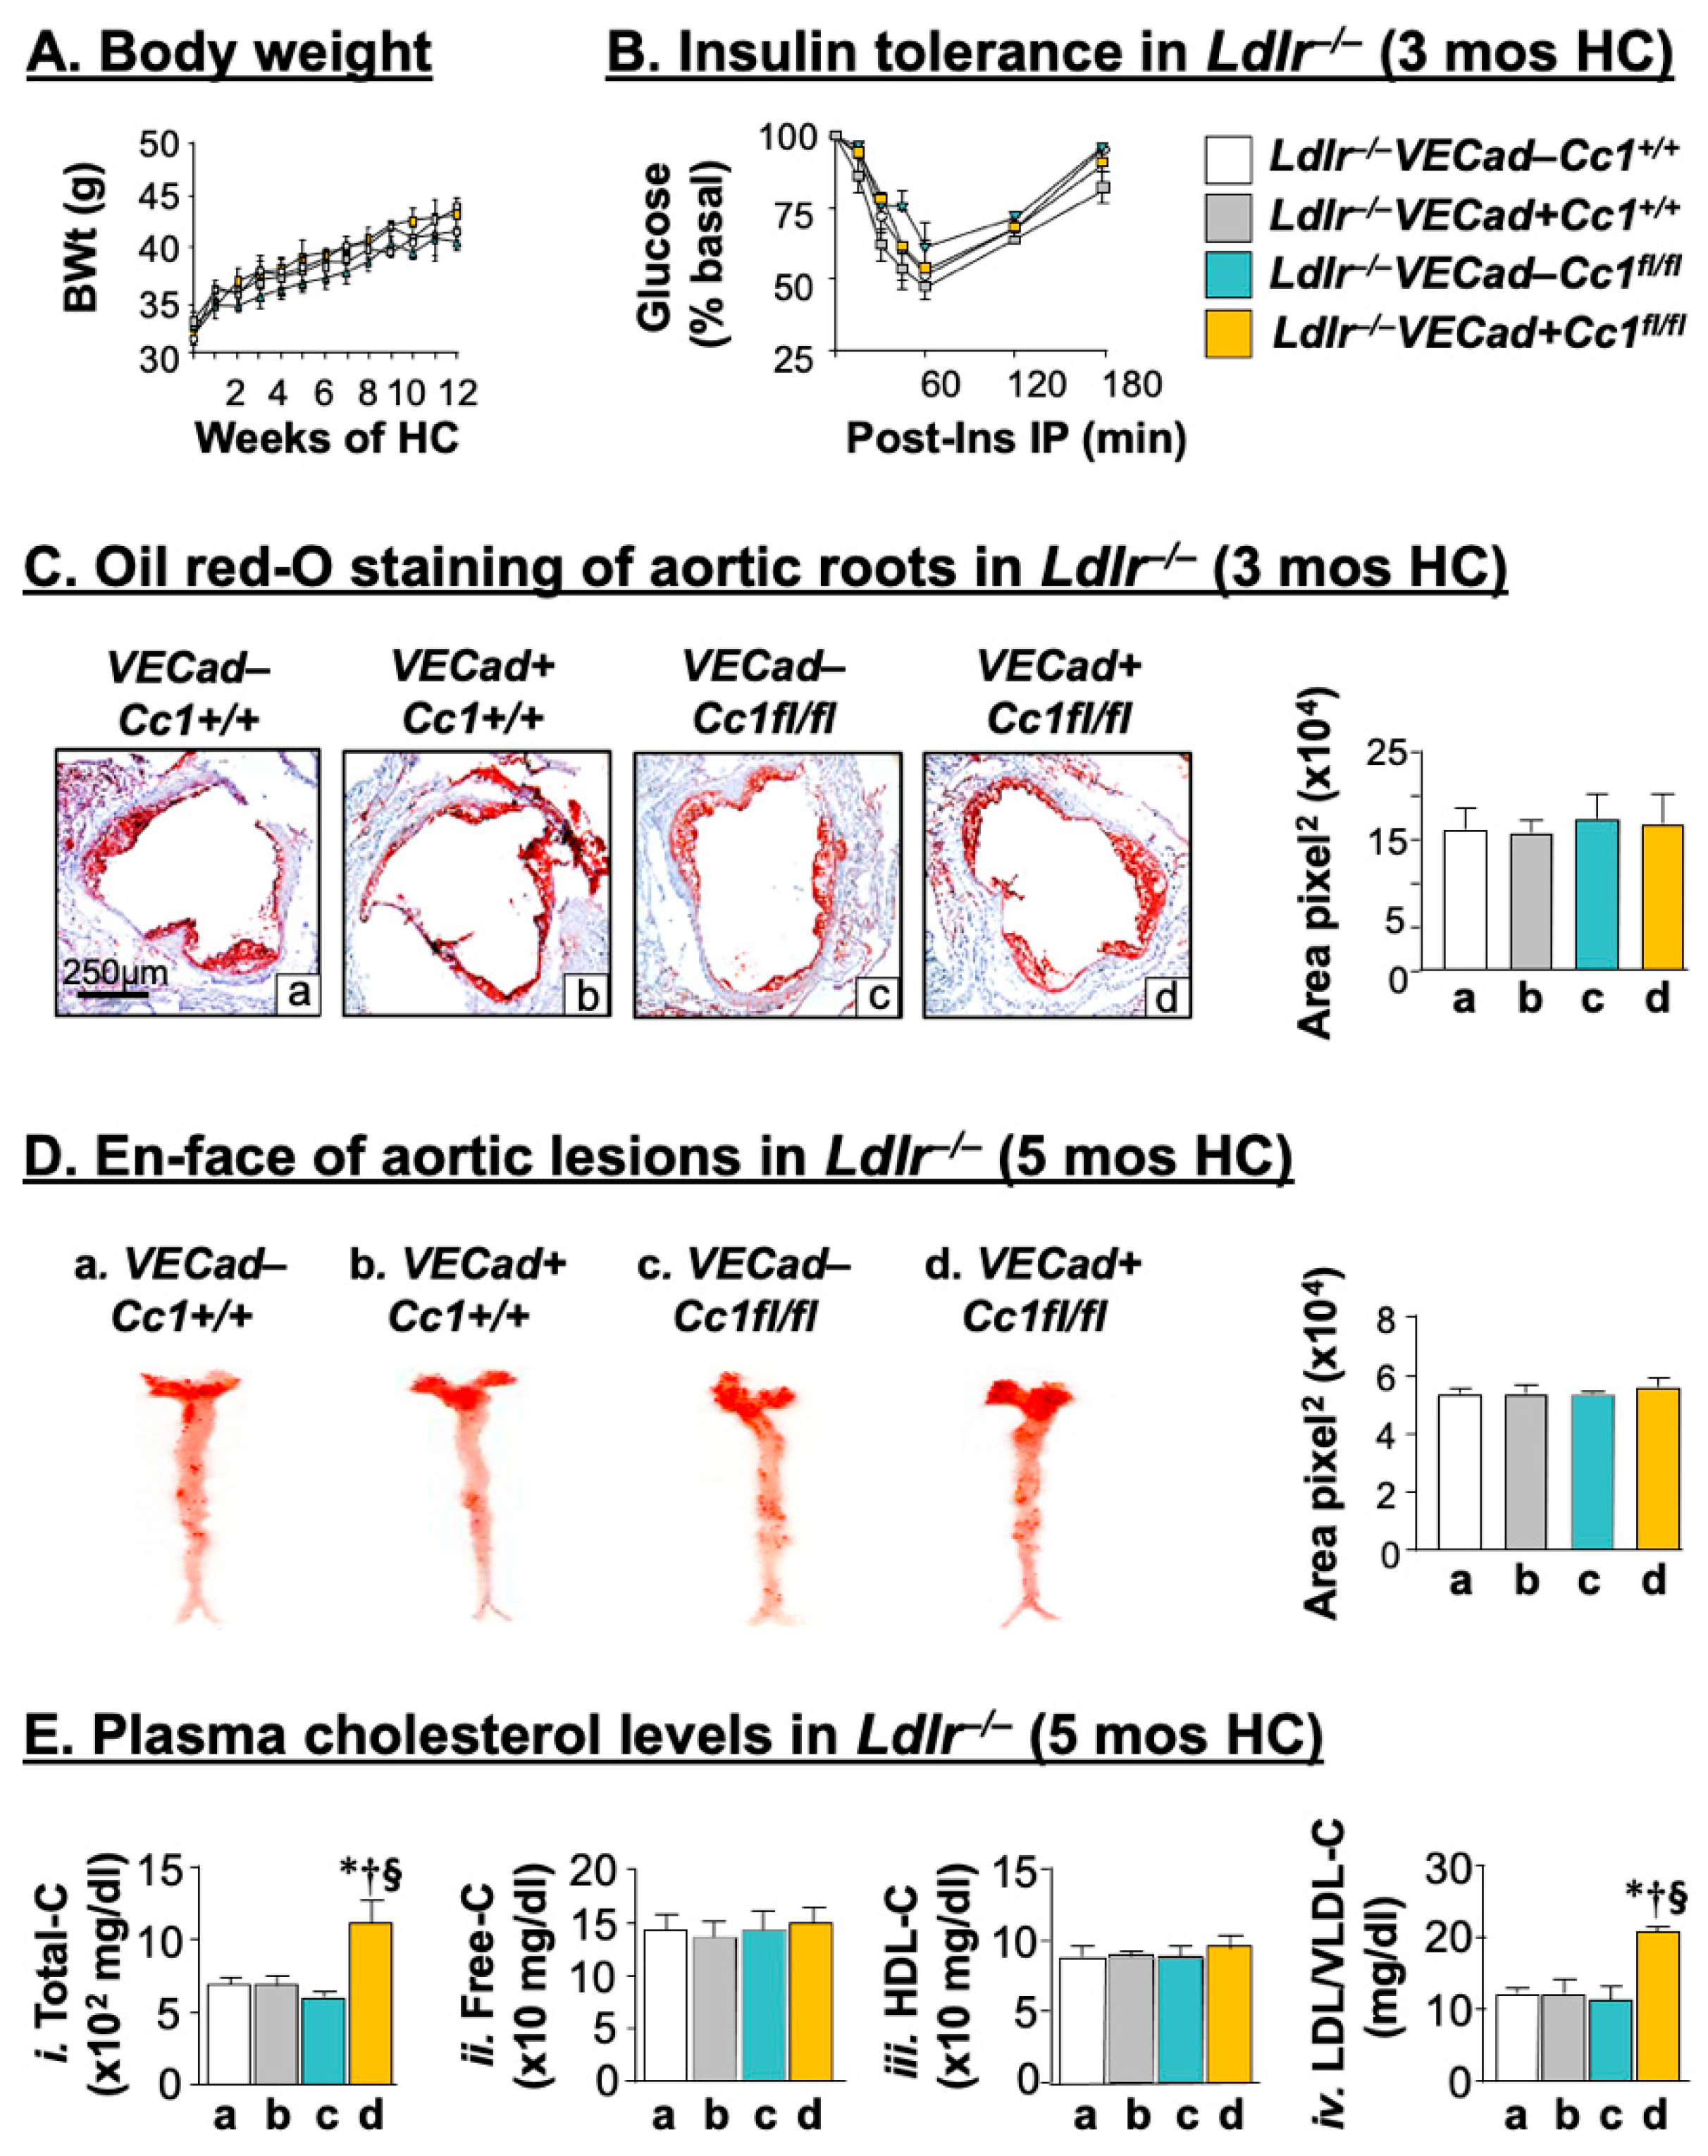
2. Results
2.1. Intact Insulin Sensitivity in the Presence of Hypercholesterolemia in Ldlr−/−VECadCre+Cc1fl/fl Mice
2.2. Ldlr−/−VECadCre+Cc1fl/fl Mice Did Not Develop Atheromatic Plaques
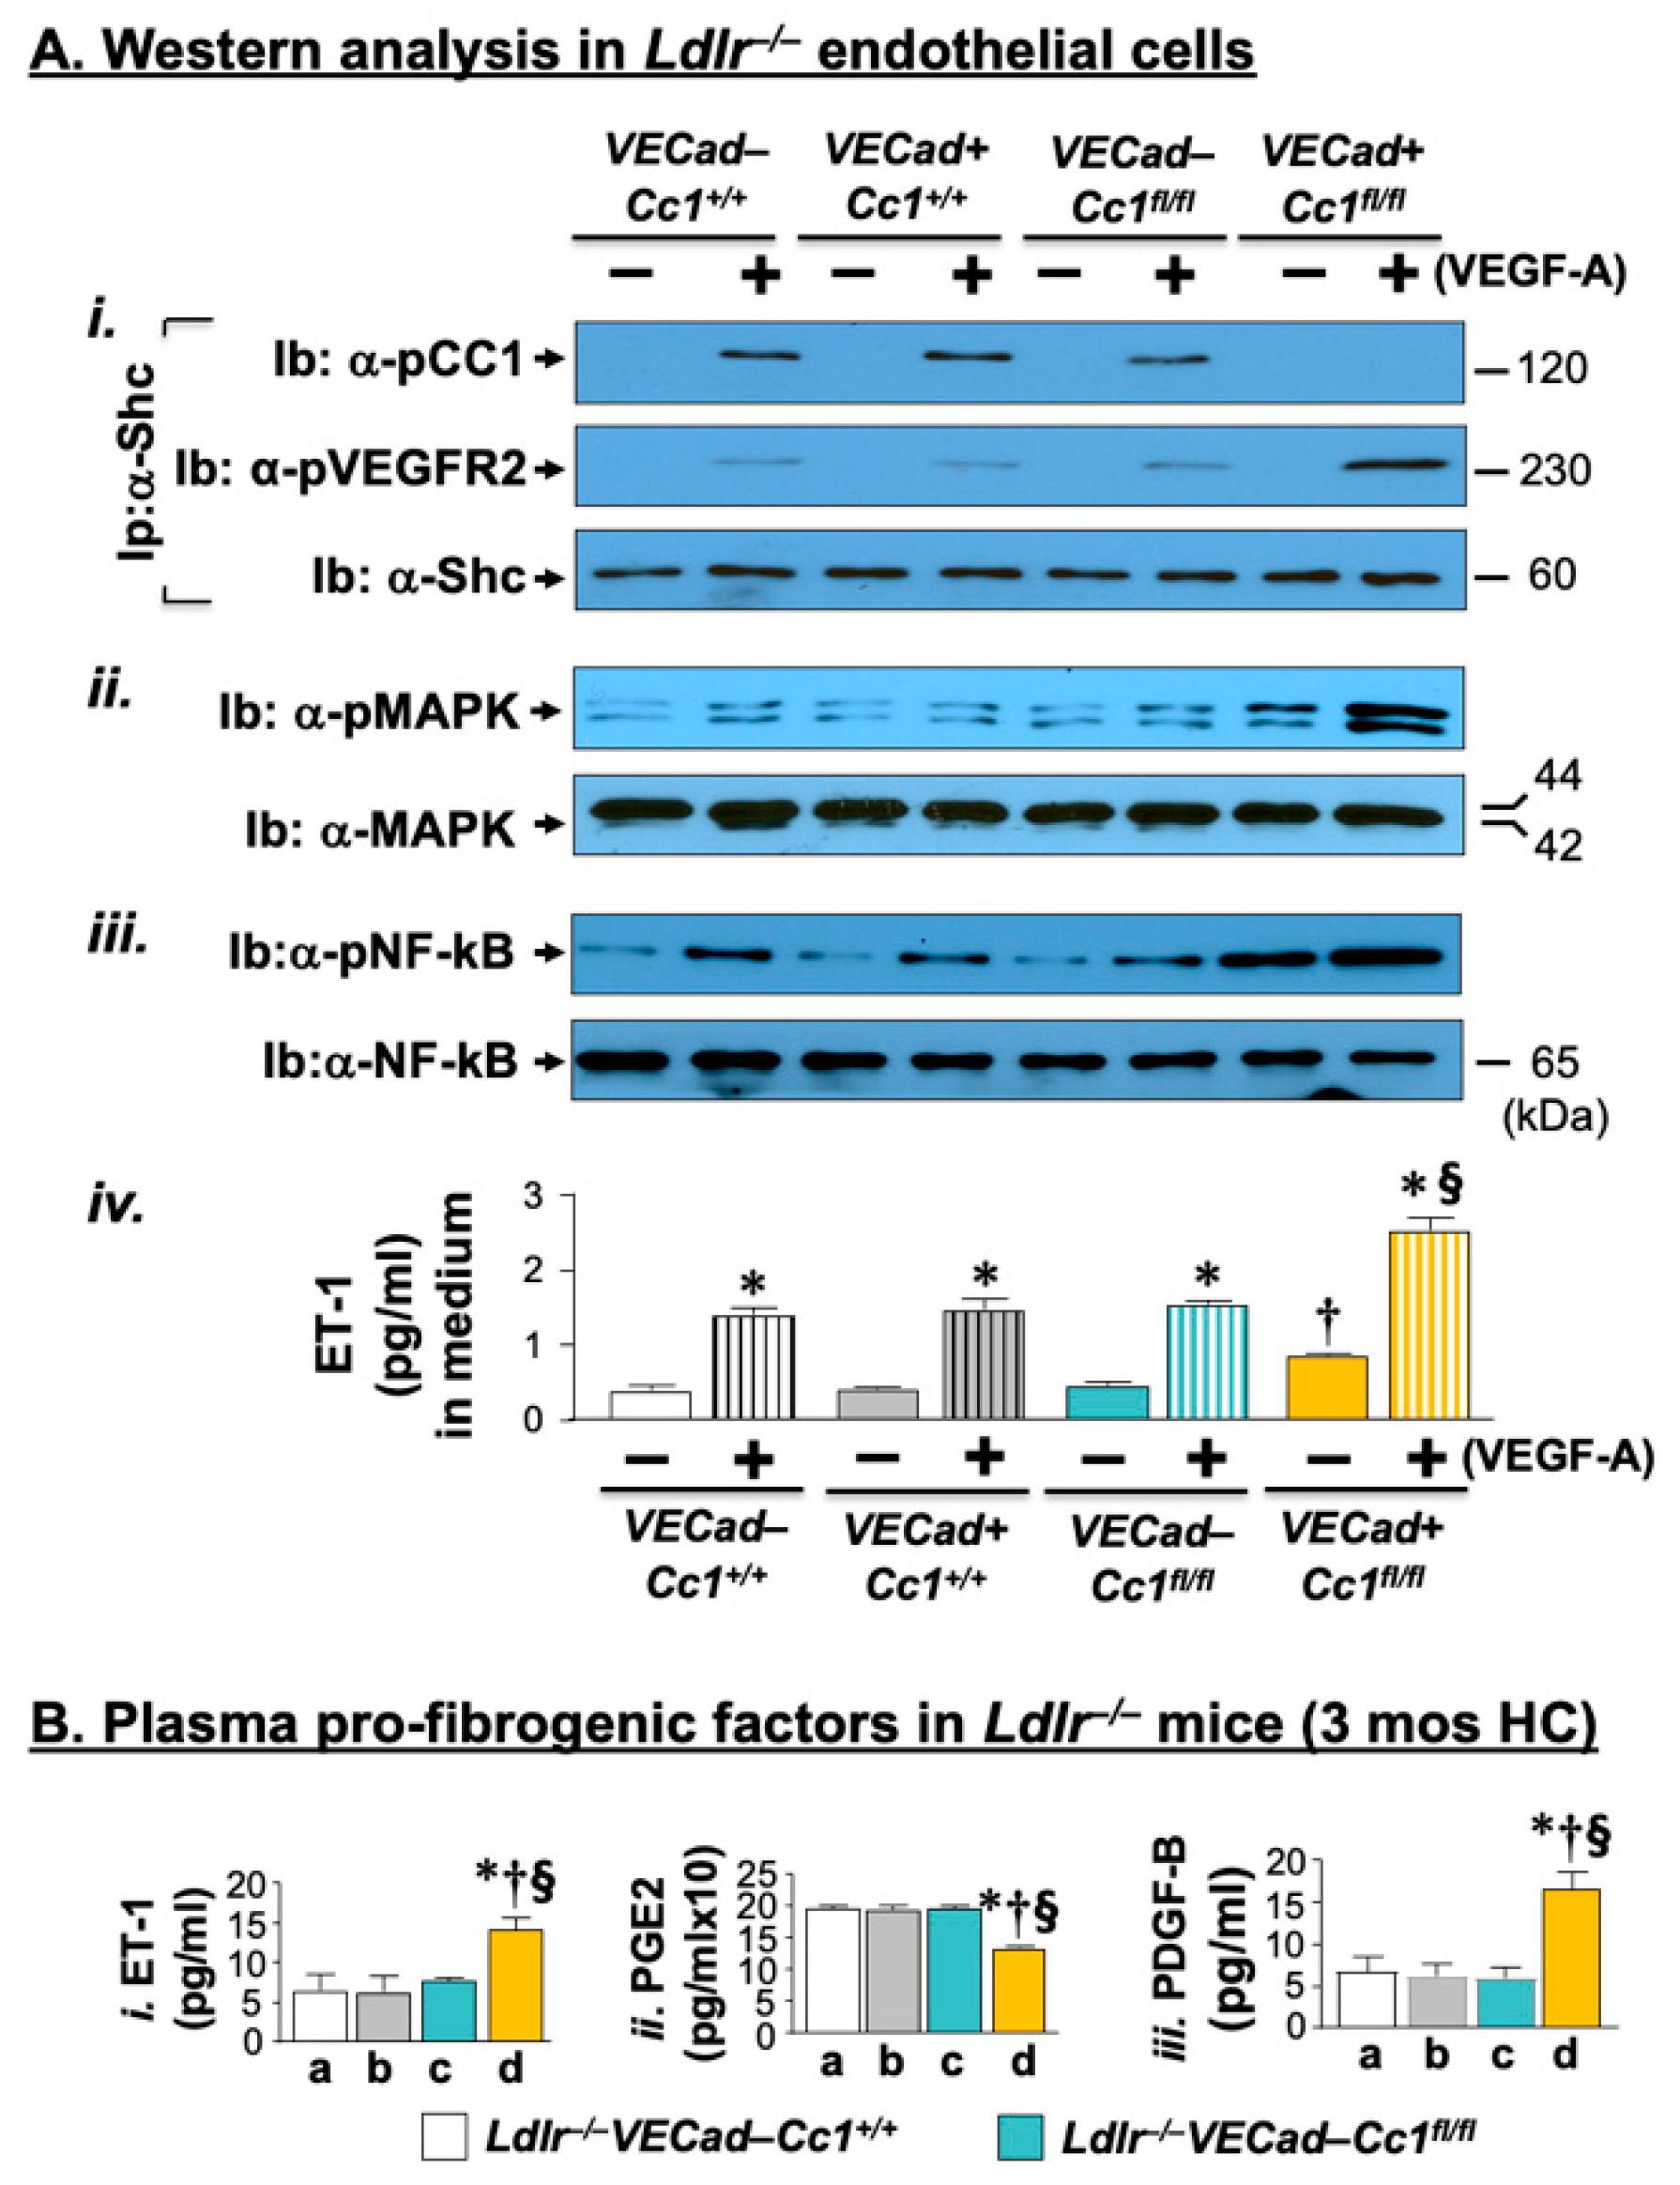
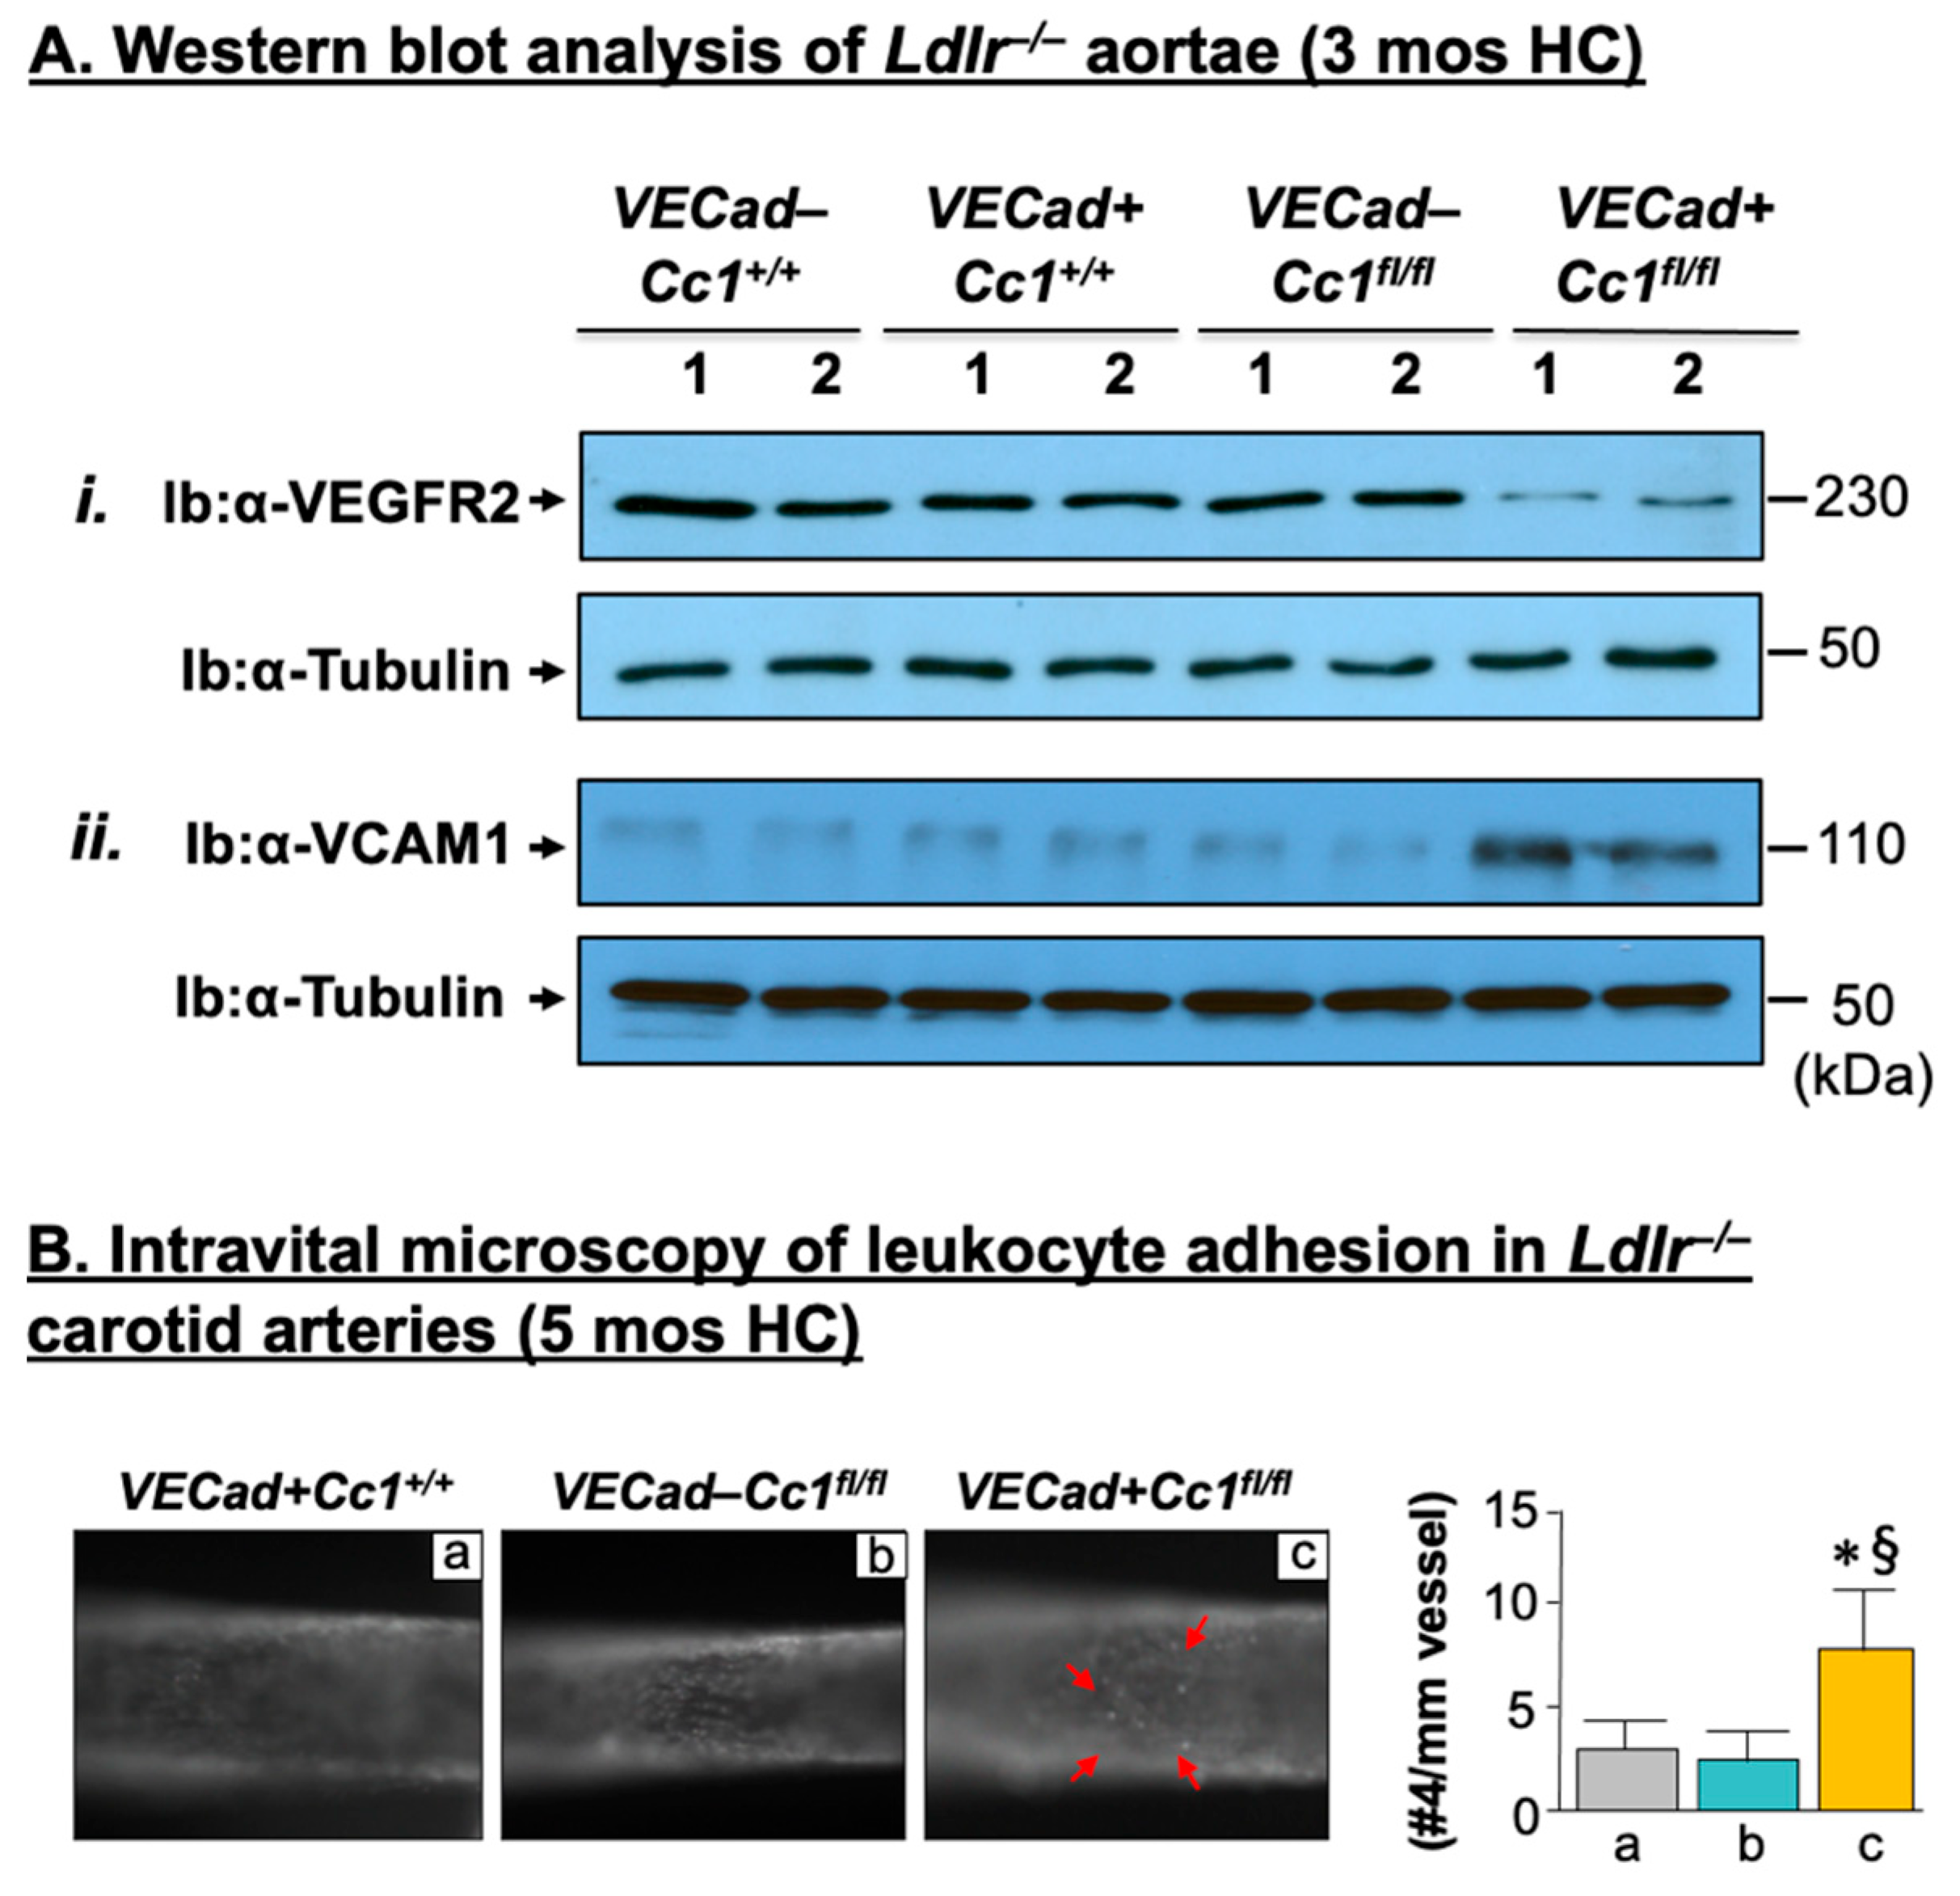
2.3. Elevated Pro-Inflammatory State in Ldlr−/−VECadCre+Cc1fl/fl Aortae
2.4. Increased Leukocyte Adhesion to the Vessel Walls of Ldlr−/−VECadCre+Cc1fl/fl Mice
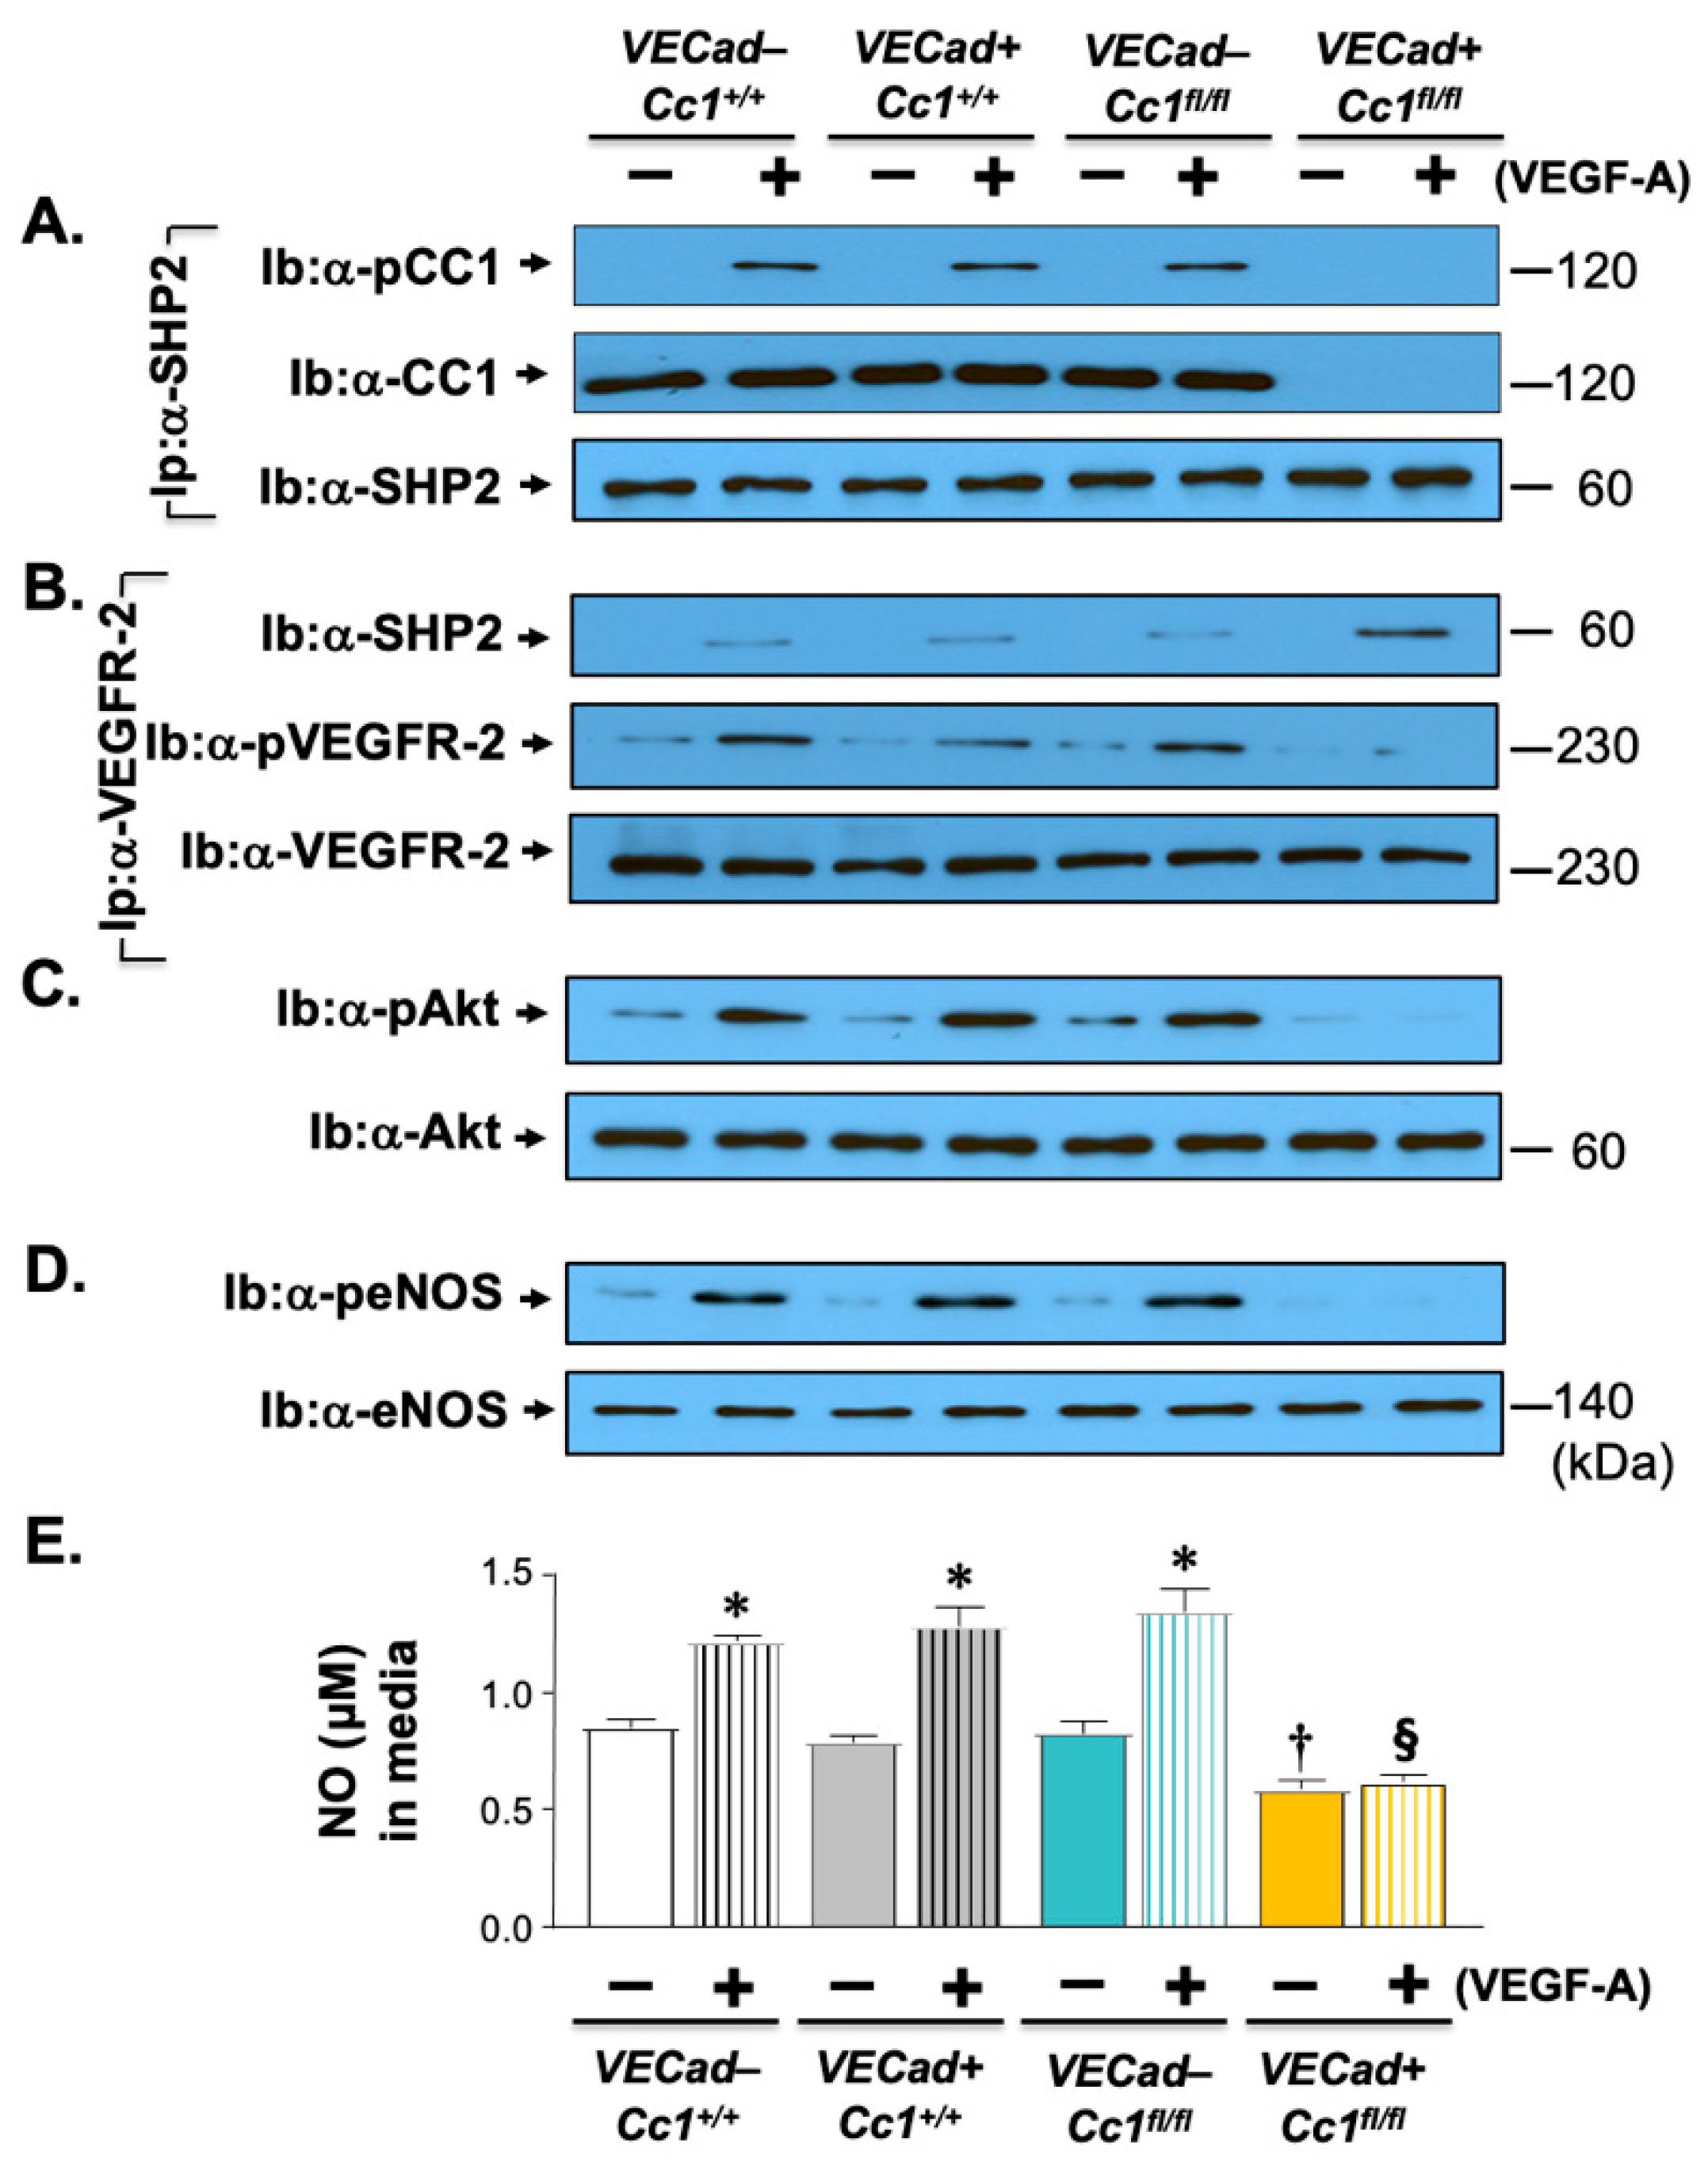
2.5. Increased Oxidative Stress in Ldlr−/−VECadCre+Cc1fl/fl Mice
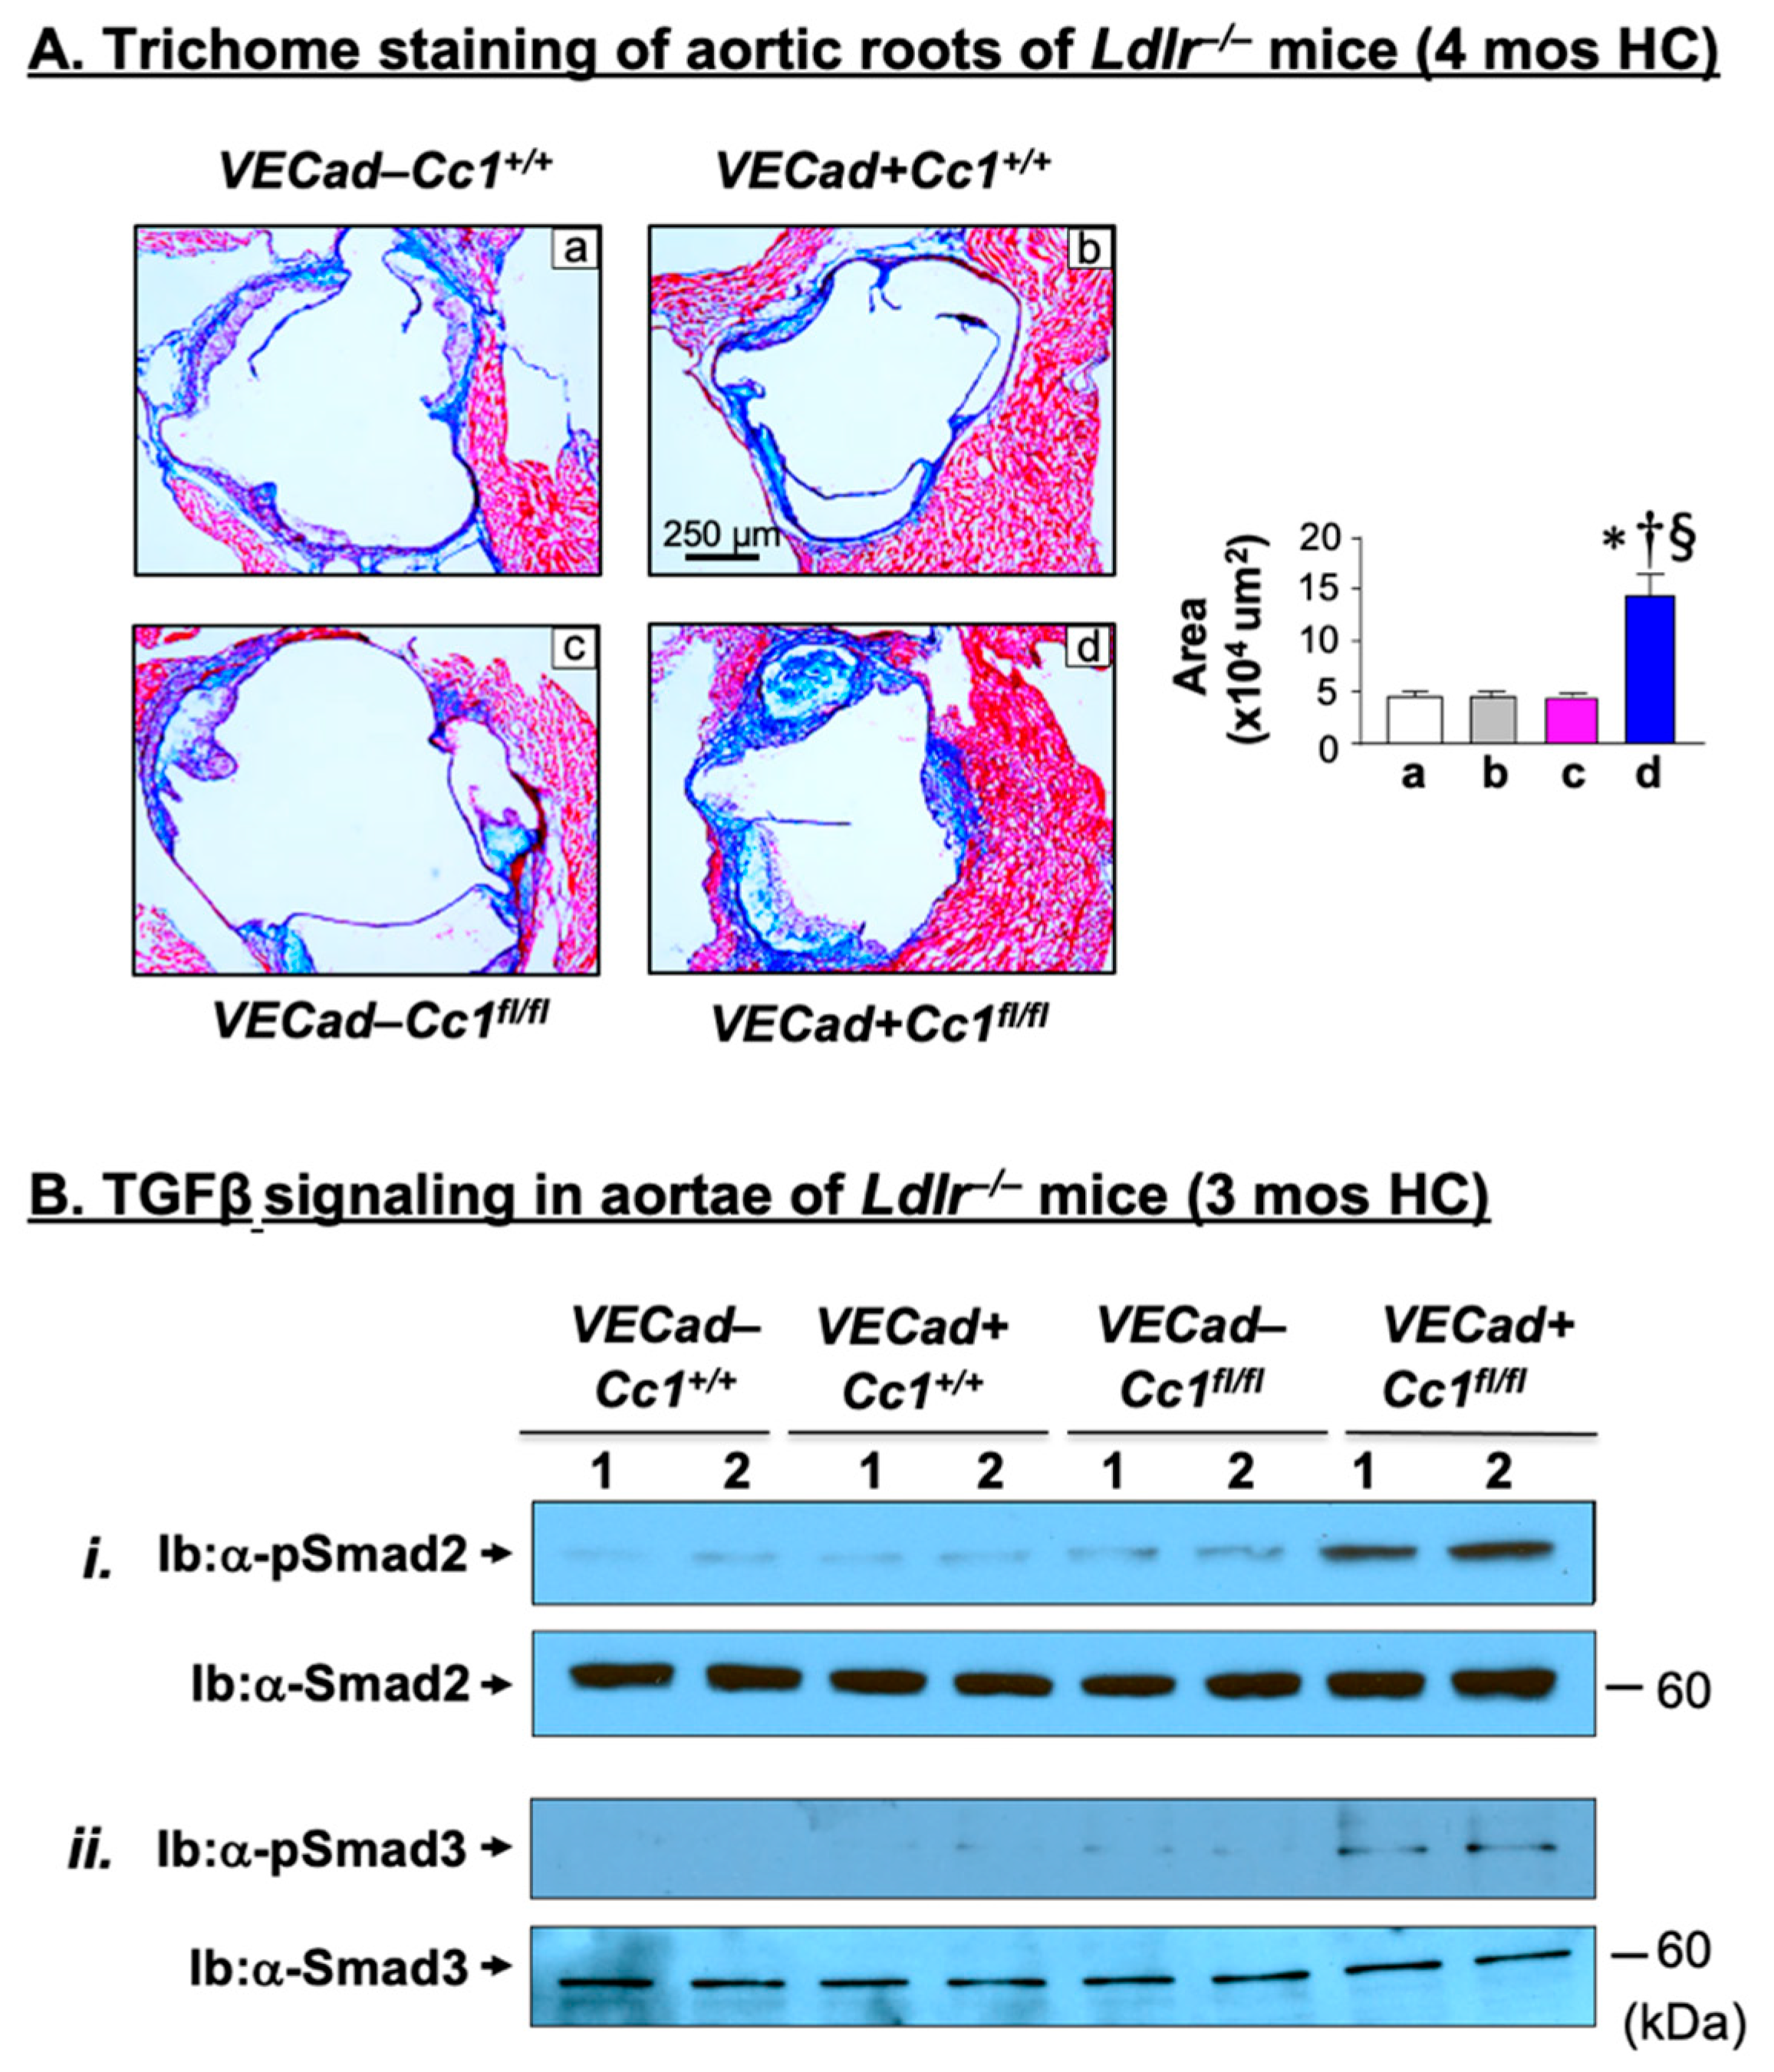
2.6. Increased Fibrosis in Ldlr−/−VECadCre+Cc1fl/fl Aortic Roots
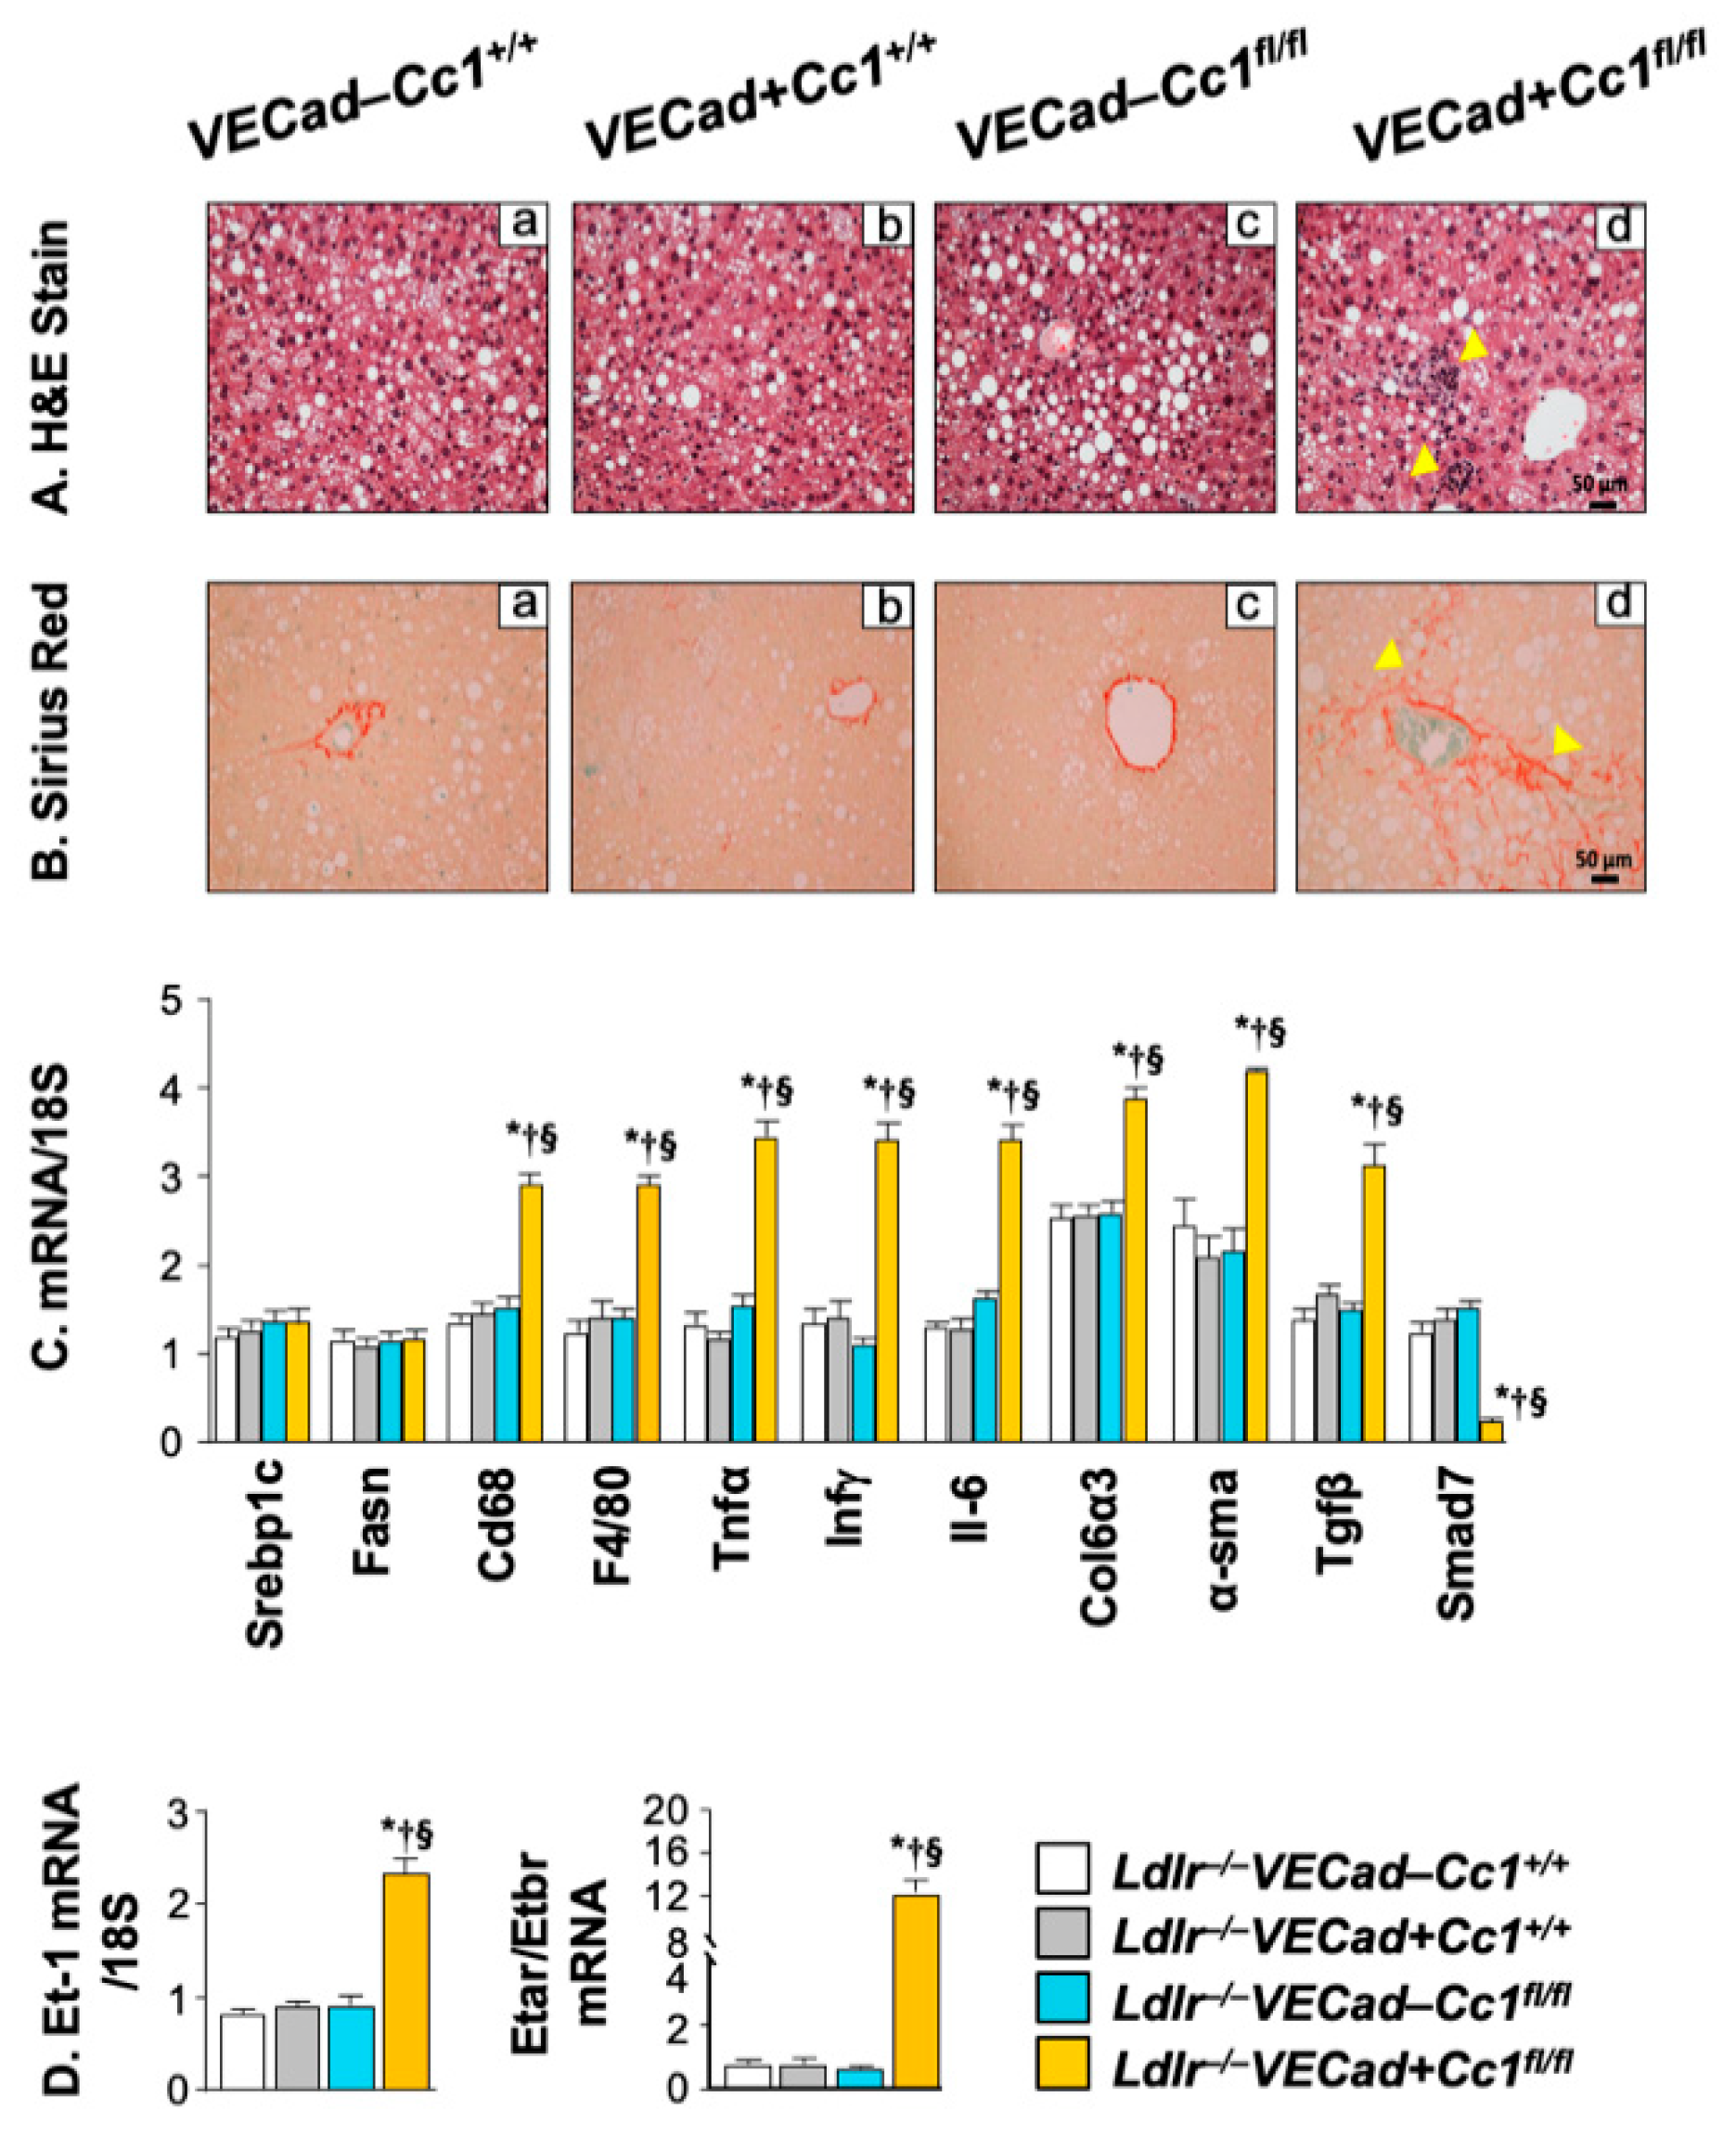
2.7. Increased Inflammation and Fibrosis in the Livers of Ldlr−/−VECadCre+Cc1fl/fl Mice
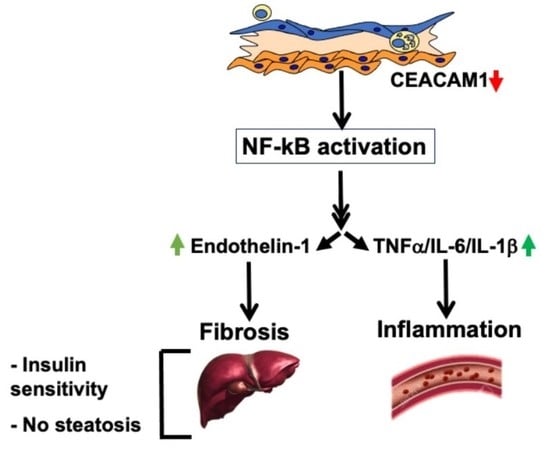
3. Discussion
4. Materials and Methods
4.1. Generation of Null Mice
4.2. Tolerance Tests
4.3. Plasma and Tissue Biochemistry
4.4. Isolation of Primary Cells
4.5. Aortic Root Sectioning and Plaque Analysis
4.6. En-Face Oil-Red-O Staining
4.7. Intravital Microscopy of Leukocyte Adhesion in Carotid Artery
4.8. Liver Histology
4.9. Western Blot Analysis
4.10. Real-Time Quantitative RT-PCR
4.11. Statistical Analysis
Supplementary Materials
Author Contributions
Funding
Institutional Review Board Statement
Data Availability Statement
Acknowledgments
Conflicts of Interest
References
- Libby, P.; Buring, J.E.; Badimon, L.; Hansson, G.K.; Deanfield, J.; Bittencourt, M.S.; Tokgozoglu, L.; Lewis, E.F. Atherosclerosis. Nat. Rev. Dis. Primers 2019, 5, 56. [Google Scholar] [CrossRef] [PubMed]
- Asrih, M.; Jornayvaz, F.R. Metabolic syndrome and nonalcoholic fatty liver disease: Is insulin resistance the link? Mol. Cell. Endocrinol. 2015, 418 Pt 1, 55–65. [Google Scholar] [CrossRef] [PubMed]
- Ormazabal, V.; Nair, S.; Elfeky, O.; Aguayo, C.; Salomon, C.; Zuniga, F.A. Association between insulin resistance and the development of cardiovascular disease. Cardiovasc. Diabetol. 2018, 17, 122. [Google Scholar] [CrossRef] [PubMed]
- Mundi, S.; Massaro, M.; Scoditti, E.; Carluccio, M.A.; van Hinsbergh, V.W.M.; Iruela-Arispe, M.L.; De Caterina, R. Endothelial permeability, LDL deposition, and cardiovascular risk factors-a review. Cardiovasc. Res. 2018, 114, 35–52. [Google Scholar] [CrossRef] [PubMed]
- Hartvigsen, K.; Binder, C.J.; Hansen, L.F.; Rafia, A.; Juliano, J.; Horkko, S.; Steinberg, D.; Palinski, W.; Witztum, J.L.; Li, A.C. A diet-induced hypercholesterolemic murine model to study atherogenesis without obesity and metabolic syndrome. Arterioscler. Thromb. Vasc. Biol. 2007, 27, 878–885. [Google Scholar] [CrossRef] [PubMed]
- Ardigo, D.; Franzini, L.; Valtuena, S.; Monti, L.D.; Reaven, G.M.; Zavaroni, I. Relation of plasma insulin levels to forearm flow-mediated dilatation in healthy volunteers. Am. J. Cardiol. 2006, 97, 1250–1254. [Google Scholar] [CrossRef] [PubMed]
- Gast, K.B.; Tjeerdema, N.; Stijnen, T.; Smit, J.W.; Dekkers, O.M. Insulin resistance and risk of incident cardiovascular events in adults without diabetes: Meta-analysis. PLoS ONE 2012, 7, e52036. [Google Scholar] [CrossRef] [PubMed]
- Di Pino, A.; DeFronzo, R.A. Insulin Resistance and Atherosclerosis: Implications for Insulin-Sensitizing Agents. Endocr. Rev. 2019, 40, 1447–1467. [Google Scholar] [CrossRef] [PubMed]
- Mather, K.J.; Steinberg, H.O.; Baron, A.D. Insulin resistance in the vasculature. J. Clin. Investig. 2013, 123, 1003–1004. [Google Scholar] [CrossRef]
- Galkina, E.; Ley, K. Vascular adhesion molecules in atherosclerosis. Arterioscler. Thromb. Vasc. Biol. 2007, 27, 2292–2301. [Google Scholar] [CrossRef]
- Quehenberger, P.; Bierhaus, A.; Fasching, P.; Muellner, C.; Klevesath, M.; Hong, M.; Stier, G.; Sattler, M.; Schleicher, E.; Speiser, W.; et al. Endothelin 1 transcription is controlled by nuclear factor-kappaB in AGE-stimulated cultured endothelial cells. Diabetes 2000, 49, 1561–1570. [Google Scholar] [CrossRef]
- Iademarco, M.F.; McQuillan, J.J.; Rosen, G.D.; Dean, D.C. Characterization of the promoter for vascular cell adhesion molecule-1 (VCAM-1). J. Biol. Chem. 1992, 267, 16323–16329. [Google Scholar] [CrossRef]
- Najjar, S.M.; Philippe, N.; Suzuki, Y.; Ignacio, G.A.; Formisano, P.; Accili, D.; Taylor, S.I. Insulin-stimulated phosphorylation of recombinant pp120/HA4, an endogenous substrate of the insulin receptor tyrosine kinase. Biochemistry 1995, 34, 9341–9349. [Google Scholar] [CrossRef]
- Nouvion, A.L.; Oubaha, M.; Leblanc, S.; Davis, E.C.; Jastrow, H.; Kammerer, R.; Breton, V.; Turbide, C.; Ergun, S.; Gratton, J.P.; et al. CEACAM1: A key regulator of vascular permeability. J. Cell Sci. 2010, 123 Pt 24, 4221–4230. [Google Scholar] [CrossRef]
- Najjar, S.M.; Perdomo, G. Hepatic Insulin Clearance: Mechanism and Physiology. Physiology (Bethesda) 2019, 34, 198–215. [Google Scholar] [CrossRef]
- Ghadieh, H.E.; Russo, L.; Muturi, H.T.; Ghanem, S.S.; Manaserh, I.H.; Noh, H.L.; Suk, S.; Kim, J.K.; Hill, J.W.; Najjar, S.M. Hyperinsulinemia drives hepatic insulin resistance in male mice with liver-specific Ceacam1 deletion independently of lipolysis. Metabolism 2019, 93, 33–43. [Google Scholar] [CrossRef]
- Najjar, S.M.; Ledford, K.J.; Abdallah, S.L.; Paus, A.; Russo, L.; Kaw, M.K.; Ramakrishnan, S.K.; Muturi, H.T.; Raphael, C.K.; Lester, S.G.; et al. Ceacam1 deletion causes vascular alterations in large vessels. Am. J. Physiol. Endocrinol. Metab. 2013, 305, E519–E529. [Google Scholar] [CrossRef]
- Russo, L.; Muturi, H.T.; Ghadieh, H.E.; Ghanem, S.S.; Bowman, T.A.; Noh, H.L.; Dagdeviren, S.; Dogbey, G.Y.; Kim, J.K.; Heinrich, G.; et al. Liver-specific reconstitution of CEACAM1 reverses the metabolic abnormalities caused by its global deletion in male mice. Diabetologia 2017, 60, 2463–2474. [Google Scholar] [CrossRef]
- Russo, L.; Muturi, H.T.; Ghadieh, H.E.; Wisniewski, A.M.; Morgan, E.E.; Quadri, S.S.; Landesberg, G.P.; Siragy, H.M.; Vazquez, G.; Scalia, R.; et al. Liver-specific rescuing of CEACAM1 reverses endothelial and cardiovascular abnormalities in male mice with null deletion of Ceacam1 gene. Mol. Metab. 2018, 9, 98–113. [Google Scholar] [CrossRef]
- Helal, R.A.; Russo, L.; Ghadieh, H.E.; Muturi, H.T.; Asalla, S.; Lee, A.D.; Gatto-Weis, C.; Najjar, S.M. Regulation of hepatic fibrosis by carcinoembryonic antigen-related cell adhesion molecule 1. Metabolism 2021, 121, 154801. [Google Scholar] [CrossRef]
- Ghadieh, H.E.; Abu Helal, R.; Muturi, H.T.; Issa, D.D.; Russo, L.; Abdallah, S.L.; Najjar, J.A.; Benencia, F.; Vazquez, G.; Li, W.; et al. Loss of Hepatic Carcinoembryonic Antigen-Related Cell Adhesion Molecule 1 Links Nonalcoholic Steatohepatitis to Atherosclerosis. Hepatol. Commun. 2020, 4, 1591–1609. [Google Scholar] [CrossRef] [PubMed]
- Rask-Madsen, C.; Buonomo, E.; Li, Q.; Park, K.; Clermont, A.C.; Yerokun, O.; Rekhter, M.; King, G.L. Hyperinsulinemia does not change atherosclerosis development in apolipoprotein E null mice. Arterioscler. Thromb. Vasc. Biol. 2012, 32, 1124–1131. [Google Scholar] [CrossRef] [PubMed]
- Wang, R.; Wang, M.; Ye, J.; Sun, G.; Sun, X. Mechanism overview and target mining of atherosclerosis: Endothelial cell injury in atherosclerosis is regulated by glycolysis (Review). Int. J. Mol. Med. 2021, 47, 65–76. [Google Scholar] [CrossRef] [PubMed]
- Ghavampour, S.; Kleefeldt, F.; Bommel, H.; Volland, J.; Paus, A.; Horst, A.; Pfeiffer, V.; Hubner, S.; Wagner, N.; Rueckschloss, U.; et al. Endothelial barrier function is differentially regulated by CEACAM1-mediated signaling. FASEB J. 2018, 32, 5612–5625. [Google Scholar] [CrossRef] [PubMed]
- Muturi, H.T.; Khuder, S.S.; Ghadieh, H.E.; Esakov, E.L.; Noh, H.; Kang, H.; McInerney, M.F.; Kim, J.K.; Lee, A.D.; Najjar, S.M. Insulin Sensitivity Is Retained in Mice with Endothelial Loss of Carcinoembryonic Antigen Cell Adhesion Molecule 1. Cells 2021, 10, 8. [Google Scholar] [CrossRef] [PubMed]
- Nagaishi, T.; Pao, L.; Lin, S.H.; Iijima, H.; Kaser, A.; Qiao, S.W.; Chen, Z.; Glickman, J.; Najjar, S.M.; Nakajima, A.; et al. SHP1 phosphatase-dependent T cell inhibition by CEACAM1 adhesion molecule isoforms. Immunity 2006, 25, 769–781. [Google Scholar] [CrossRef]
- Najjar, S.M.; Russo, L. CEACAM1 loss links inflammation to insulin resistance in obesity and non-alcoholic steatohepatitis (NASH). Semin. Immunopathol. 2014, 36, 55–71. [Google Scholar] [CrossRef]
- Horton, J.D.; Cohen, J.C.; Hobbs, H.H. PCSK9: A convertase that coordinates LDL catabolism. J. Lipid Res. 2009, 50, S172–S177. [Google Scholar] [CrossRef]
- Marchio, P.; Guerra-Ojeda, S.; Vila, J.M.; Aldasoro, M.; Victor, V.M.; Mauricio, M.D. Targeting Early Atherosclerosis: A Focus on Oxidative Stress and Inflammation. Oxid. Med. Cell Longev. 2019, 2019, 8563845. [Google Scholar] [CrossRef]
- Aveleira, C.A.; Lin, C.M.; Abcouwer, S.F.; Ambrosio, A.F.; Antonetti, D.A. TNF-alpha signals through PKCzeta/NF-kappaB to alter the tight junction complex and increase retinal endothelial cell permeability. Diabetes 2010, 59, 2872–2882. [Google Scholar] [CrossRef]
- Friedman, S.L. Mechanisms of hepatic fibrogenesis. Gastroenterology 2008, 134, 1655–1669. [Google Scholar] [CrossRef]
- Pelletier, S.; Dube, J.; Villeneuve, A.; Gobeil, F., Jr.; Yang, Q.; Battistini, B.; Guillemette, G.; Sirois, P. Prostaglandin E(2) increases cyclic AMP and inhibits endothelin-1 production/secretion by guinea-pig tracheal epithelial cells through EP(4) receptors. Br. J. Pharmacol. 2001, 132, 999–1008. [Google Scholar] [CrossRef]
- Zeisberg, M.; Kalluri, R. Cellular mechanisms of tissue fibrosis. 1. Common and organ-specific mechanisms associated with tissue fibrosis. Am. J. Physiol. Cell Physiol. 2013, 304, C216–C225. [Google Scholar] [CrossRef]
- Sun, X.; Harris, E.N. New aspects of hepatic endothelial cells in physiology and nonalcoholic fatty liver disease. Am. J. Physiol. Cell Physiol. 2020, 318, C1200–C1213. [Google Scholar] [CrossRef]
- Suryavanshi, S.V.; Kulkarni, Y.A. NF-kappabeta: A Potential Target in the Management of Vascular Complications of Diabetes. Front. Pharmacol. 2017, 8, 798. [Google Scholar] [CrossRef]
- Goldberg, I.J. Why does diabetes increase atherosclerosis? I don’t know! J. Clin. Investig. 2004, 114, 613–615. [Google Scholar] [CrossRef][Green Version]
- McKellar, G.E.; McCarey, D.W.; Sattar, N.; McInnes, I.B. Role for TNF in atherosclerosis? Lessons from autoimmune disease. Nat. Rev. Cardiol. 2009, 6, 410–417. [Google Scholar] [CrossRef]
- Marcos-Ramiro, B.; Garcia-Weber, D.; Millan, J. TNF-induced endothelial barrier disruption: Beyond actin and Rho. Thromb. Haemost. 2014, 112, 1088–1102. [Google Scholar] [CrossRef]
- Fernandez-Hernando, C.; Ackah, E.; Yu, J.; Suarez, Y.; Murata, T.; Iwakiri, Y.; Prendergast, J.; Miao, R.Q.; Birnbaum, M.J.; Sessa, W.C. Loss of Akt1 leads to severe atherosclerosis and occlusive coronary artery disease. Cell Metab. 2007, 6, 446–457. [Google Scholar] [CrossRef]
- Park, K.; Mima, A.; Li, Q.; Rask-Madsen, C.; He, P.; Mizutani, K.; Katagiri, S.; Maeda, Y.; Wu, I.H.; Khamaisi, M.; et al. Insulin decreases atherosclerosis by inducing endothelin receptor B expression. JCI Insight 2016, 1, 6. [Google Scholar] [CrossRef]
- Chen, P.Y.; Qin, L.; Li, G.; Wang, Z.; Dahlman, J.E.; Malagon-Lopez, J.; Gujja, S.; Cilfone, N.A.; Kauffman, K.J.; Sun, L.; et al. Endothelial TGF-beta signalling drives vascular inflammation and atherosclerosis. Nat. Metab. 2019, 1, 912–926. [Google Scholar] [CrossRef] [PubMed]
- Li, M.W.; Mian, M.O.; Barhoumi, T.; Rehman, A.; Mann, K.; Paradis, P.; Schiffrin, E.L. Endothelin-1 overexpression exacerbates atherosclerosis and induces aortic aneurysms in apolipoprotein E knockout mice. Arterioscler. Thromb. Vasc. Biol. 2013, 33, 2306–2315. [Google Scholar] [CrossRef] [PubMed]
- Gupta, R.M.; Libby, P.; Barton, M. Linking regulation of nitric oxide to endothelin-1: The Yin and Yang of vascular tone in the atherosclerotic plaque. Atherosclerosis 2020, 292, 201–203. [Google Scholar] [CrossRef] [PubMed]
- Wang, H.H.; Garruti, G.; Liu, M.; Portincasa, P.; Wang, D.Q. Cholesterol and Lipoprotein Metabolism and Atherosclerosis: Recent Advances in Reverse Cholesterol Transport. Ann. Hepatol. 2017, 16 (Suppl. S1), 27–42. [Google Scholar] [CrossRef]
- Ghadieh, H.E.; Muturi, H.T.; Russo, L.; Marino, C.C.; Ghanem, S.S.; Khuder, S.S.; Hanna, J.C.; Jash, S.; Puri, V.; Heinrich, G.; et al. Exenatide induces carcinoembryonic antigen-related cell adhesion molecule 1 expression to prevent hepatic steatosis. Hepatol. Commun. 2018, 2, 35–47. [Google Scholar] [CrossRef]
- Al-Share, Q.Y.; DeAngelis, A.M.; Lester, S.G.; Bowman, T.A.; Ramakrishnan, S.K.; Abdallah, S.L.; Russo, L.; Patel, P.R.; Kaw, M.K.; Raphael, C.K.; et al. Forced Hepatic Overexpression of CEACAM1 Curtails Diet-Induced Insulin Resistance. Diabetes 2015, 64, 2780–2790. [Google Scholar] [CrossRef]
- Li, W.; Nieman, M.; Sen Gupta, A. Ferric Chloride-induced Murine Thrombosis Models. J. Vis. Exp. 2016, 115, e54479. [Google Scholar] [CrossRef]


| Ldlr−/− VECad–Cc1+/+ | Ldlr−/− VECad+Cc1+/+ | Ldlr−/− VECad–Cc1fl/fl | Ldlr−/− VECad+Cc1fl/fl | |
|---|---|---|---|---|
| Body weight (g) | 41.5 ± 1.9 | 43.8 ± 1.9 | 40.0 ± 1.4 | 42.1 ± 1.8 |
| % Visceral fat (WAT/BW) | 4.6 ± 0.5 | 4.3 ± 0.5 | 3.9 ± 0.5 | 4.2 ± 0.2 |
| Fasting blood glucose (mg/dL) | 110 ± 9 | 108 ± 7 | 115 ± 15 | 104 ± 8 |
| Fed blood glucose (mg/dL) | 120 ± 7 | 108 ± 9 | 116 ± 5 | 132 ± 5 |
| Plasma Insulin (pM) | 23 ± 4 | 19 ± 1 | 19 ± 3 | 23 ± 2 |
| Plasma C-peptide (pM) | 377 ± 47 | 342 ± 29 | 343 ± 39 | 341 ± 29 |
| Plasma C/I molar ratio | 11 ± 4 | 12 ± 2 | 14 ± 2 | 12 ± 2 |
| Hepatic lipid | ||||
| Triacylglycerol (µg/mg protein) | 86 ± 11 | 83 ± 5 | 80 ± 6 | 87 ± 3 |
| HMGCR (U/mg protein × 103) | 22 ± 1 | 22 ± 1 | 21 ± 3 | 23 ± 1 |
| Plasma lipid | ||||
| NEFA (mEq/L × 10–2) | 28 ± 3 | 28 ± 1 | 28 ± 3 | 25 ± 2 |
| Triacylglycerol (mg/dL) | 69 ± 2 | 67 ± 6 | 69 ± 3 | 67 ± 6 |
| Total Cholesterol (mg/dL) | 685 ± 26 | 686 ± 36 | 596 ± 15 | 1043 ± 38 * † § |
| Free Cholesterol (mg/dL) | 151 ± 8 | 155 ± 8 | 149 ± 4 | 152 ± 13 |
| VLDL-C (mg/dL) | 130 ± 1 | 130 ± 3 | 135 ± 1 | 130 ± 1 |
| LDL-C (mg/dL) | 184 ± 3 | 169 ± 9 | 179 ± 9 | 234 ± 3 * † § |
| HDL-C (mg/dL) | 85 ± 3 | 87 ± 3 | 85 ± 3 | 88 ± 4 |
| ApoB100 (ng/mL) | 368 ± 25 | 455 ± 62 | 395 ± 63 | 1872 ± 137 * † § |
| ApoB48 (µg/mL) | 1907 ± 35 | 1765 ± 50 | 1828 ± 102 | 1790 ± 81 |
| PCSK9 (pg/mL) | 262 ± 8 | 241 ± 11 | 251 ± 8 | 338 ± 3 * † § |
| Plasma redox parameters | ||||
| NO (µM × 10−1) | 6.3 ± 0.1 | 6.3 ± 0.3 | 6.4 ± 0.6 | 3.9 ± 0.2 * † § |
| NAD/NADH (µM) | 4.9 ± 0.1 | 4.4 ± 0.8 | 3.6 ± 0.4 | 7.7 ± 0.7 * † § |
| 8-isoprostane (pg/mL × 10) | 8.8 ± 1.1 | 9.1 ± 1.0 | 7.6 ± 1.1 | 15.0 ± 1.3 * † § |
| GSH (µg/mL × 10−1) | 11.2 ± 0.8 | 15.1 ± 0.5 | 19.2 ± 0.6 | 4.9 ± 1.7 * † § |
| Aortic NO (µM/µg × 10−2) | 51.5 ± 1.1 | 53.4 ± 1.1 | 52.5 ± 2.1 | 19.3 ± 1.0 * † § |
Publisher’s Note: MDPI stays neutral with regard to jurisdictional claims in published maps and institutional affiliations. |
© 2022 by the authors. Licensee MDPI, Basel, Switzerland. This article is an open access article distributed under the terms and conditions of the Creative Commons Attribution (CC BY) license (https://creativecommons.org/licenses/by/4.0/).
Share and Cite
Abu Helal, R.; Muturi, H.T.; Lee, A.D.; Li, W.; Ghadieh, H.E.; Najjar, S.M. Aortic Fibrosis in Insulin-Sensitive Mice with Endothelial Cell-Specific Deletion of Ceacam1 Gene. Int. J. Mol. Sci. 2022, 23, 4335. https://doi.org/10.3390/ijms23084335
Abu Helal R, Muturi HT, Lee AD, Li W, Ghadieh HE, Najjar SM. Aortic Fibrosis in Insulin-Sensitive Mice with Endothelial Cell-Specific Deletion of Ceacam1 Gene. International Journal of Molecular Sciences. 2022; 23(8):4335. https://doi.org/10.3390/ijms23084335
Chicago/Turabian StyleAbu Helal, Raghd, Harrison T. Muturi, Abraham D. Lee, Wei Li, Hilda E. Ghadieh, and Sonia M. Najjar. 2022. "Aortic Fibrosis in Insulin-Sensitive Mice with Endothelial Cell-Specific Deletion of Ceacam1 Gene" International Journal of Molecular Sciences 23, no. 8: 4335. https://doi.org/10.3390/ijms23084335
APA StyleAbu Helal, R., Muturi, H. T., Lee, A. D., Li, W., Ghadieh, H. E., & Najjar, S. M. (2022). Aortic Fibrosis in Insulin-Sensitive Mice with Endothelial Cell-Specific Deletion of Ceacam1 Gene. International Journal of Molecular Sciences, 23(8), 4335. https://doi.org/10.3390/ijms23084335