
Convolutional Neural Networks for Mechanistic Driver Detection in Atrial Fibrillation


Abstract
:1. Introduction
2. Results
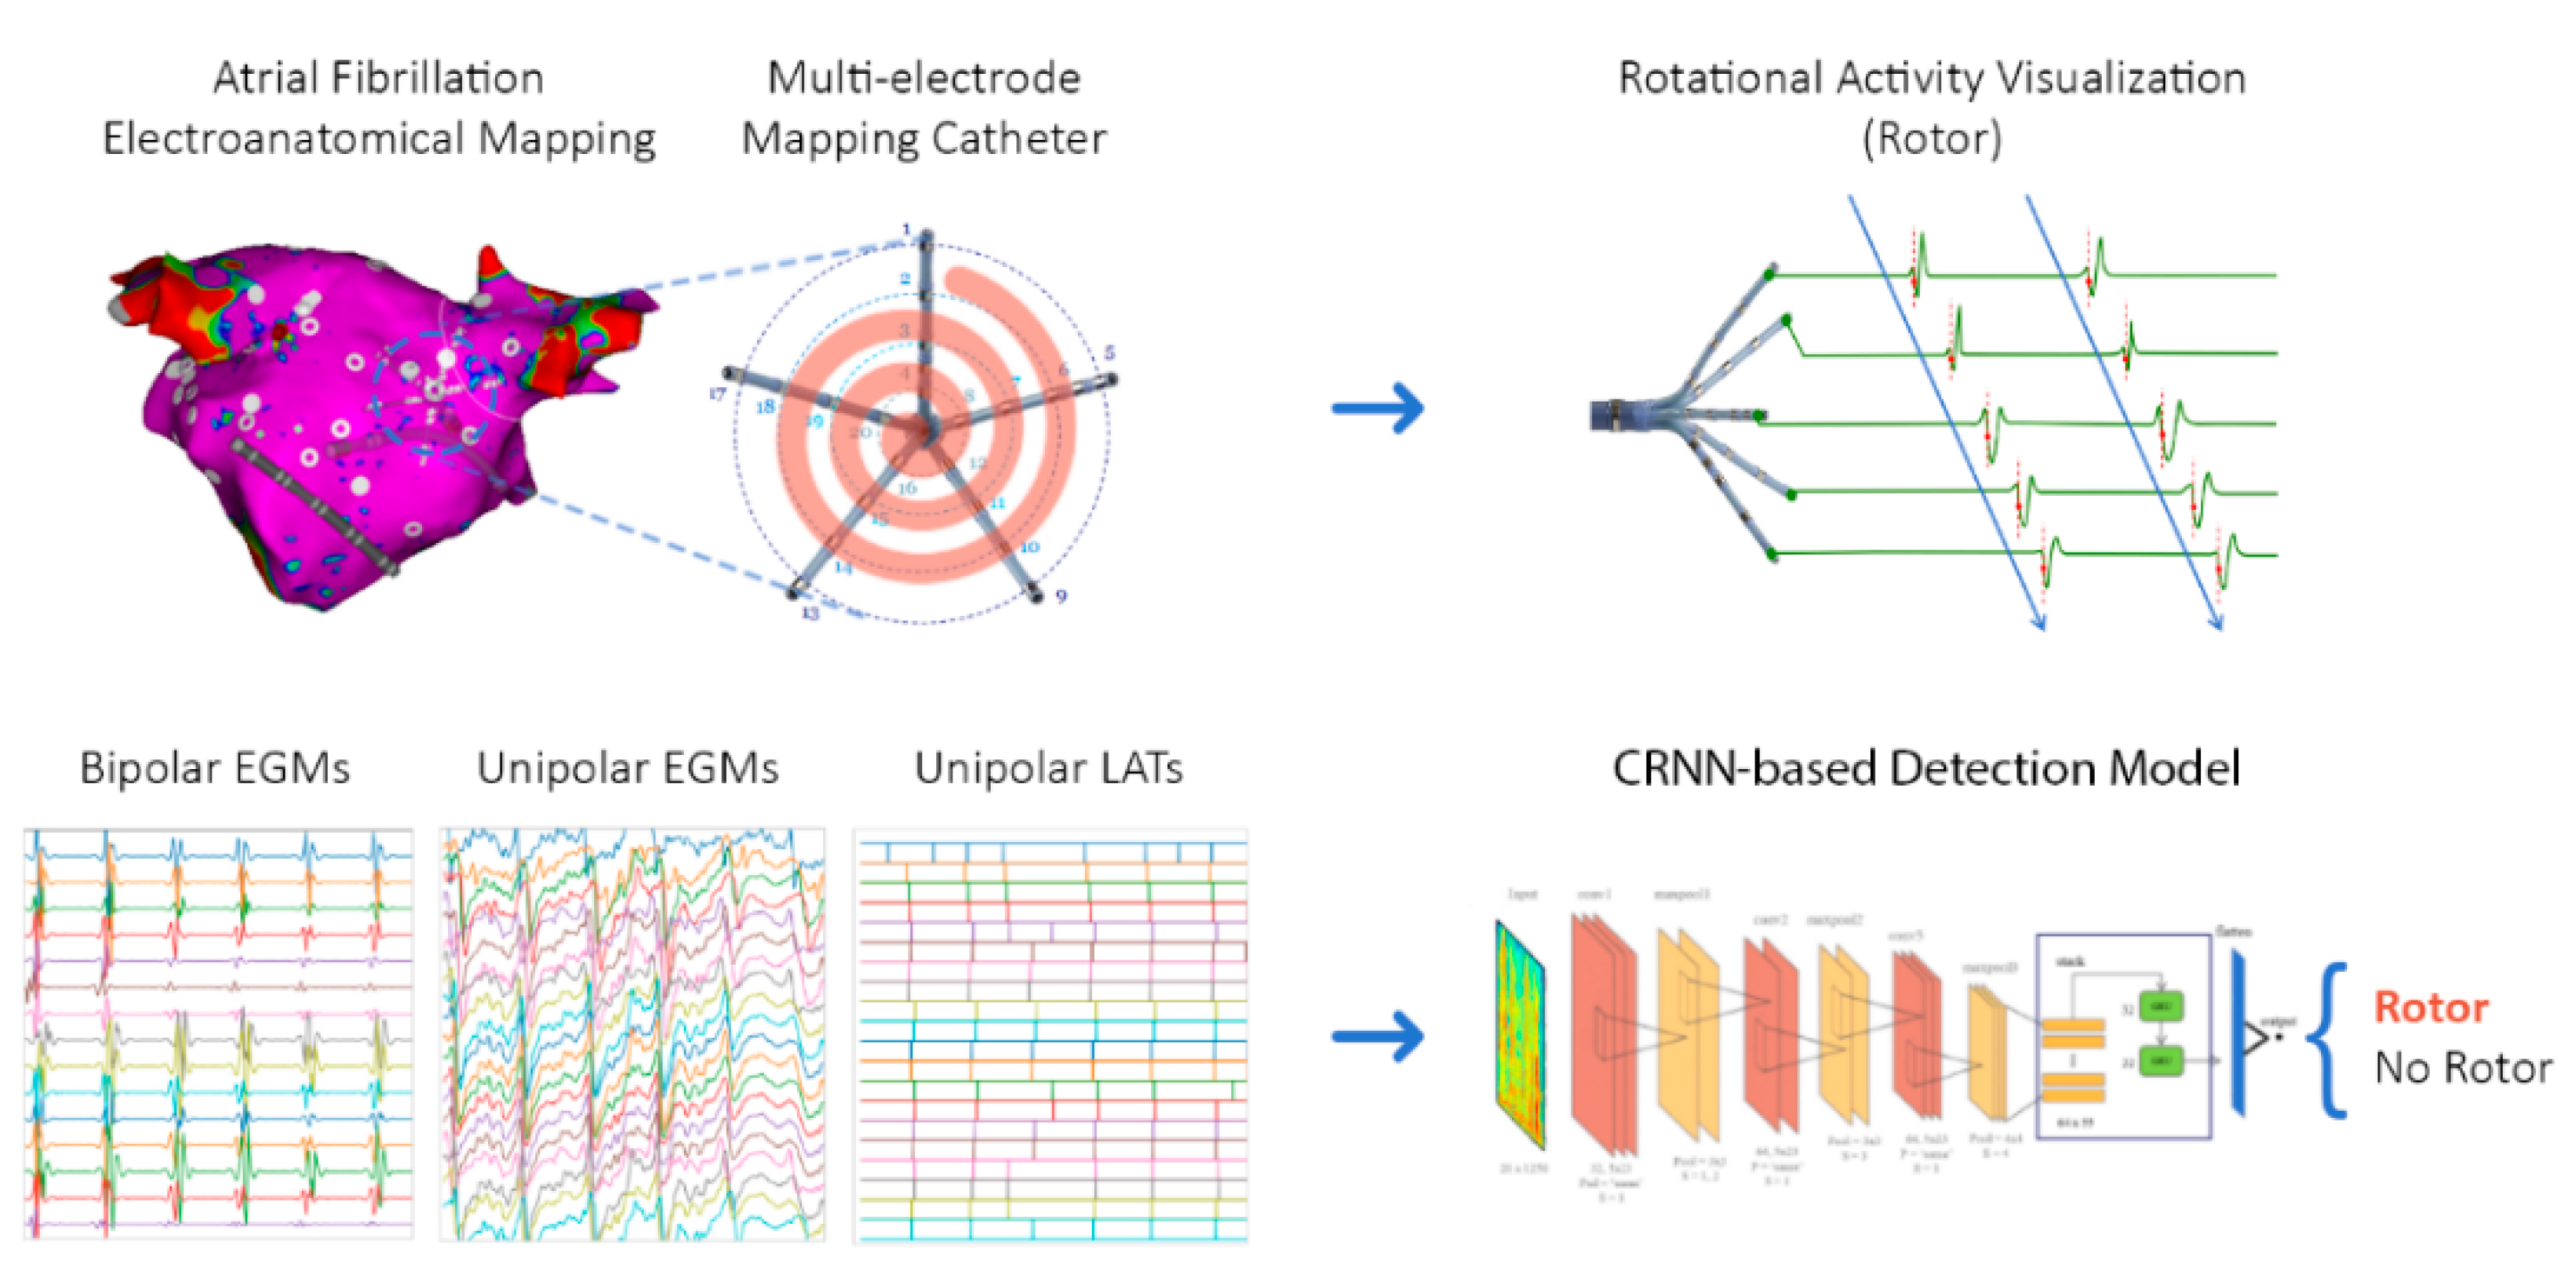
2.1. Overview
2.2. Patient Characteristics
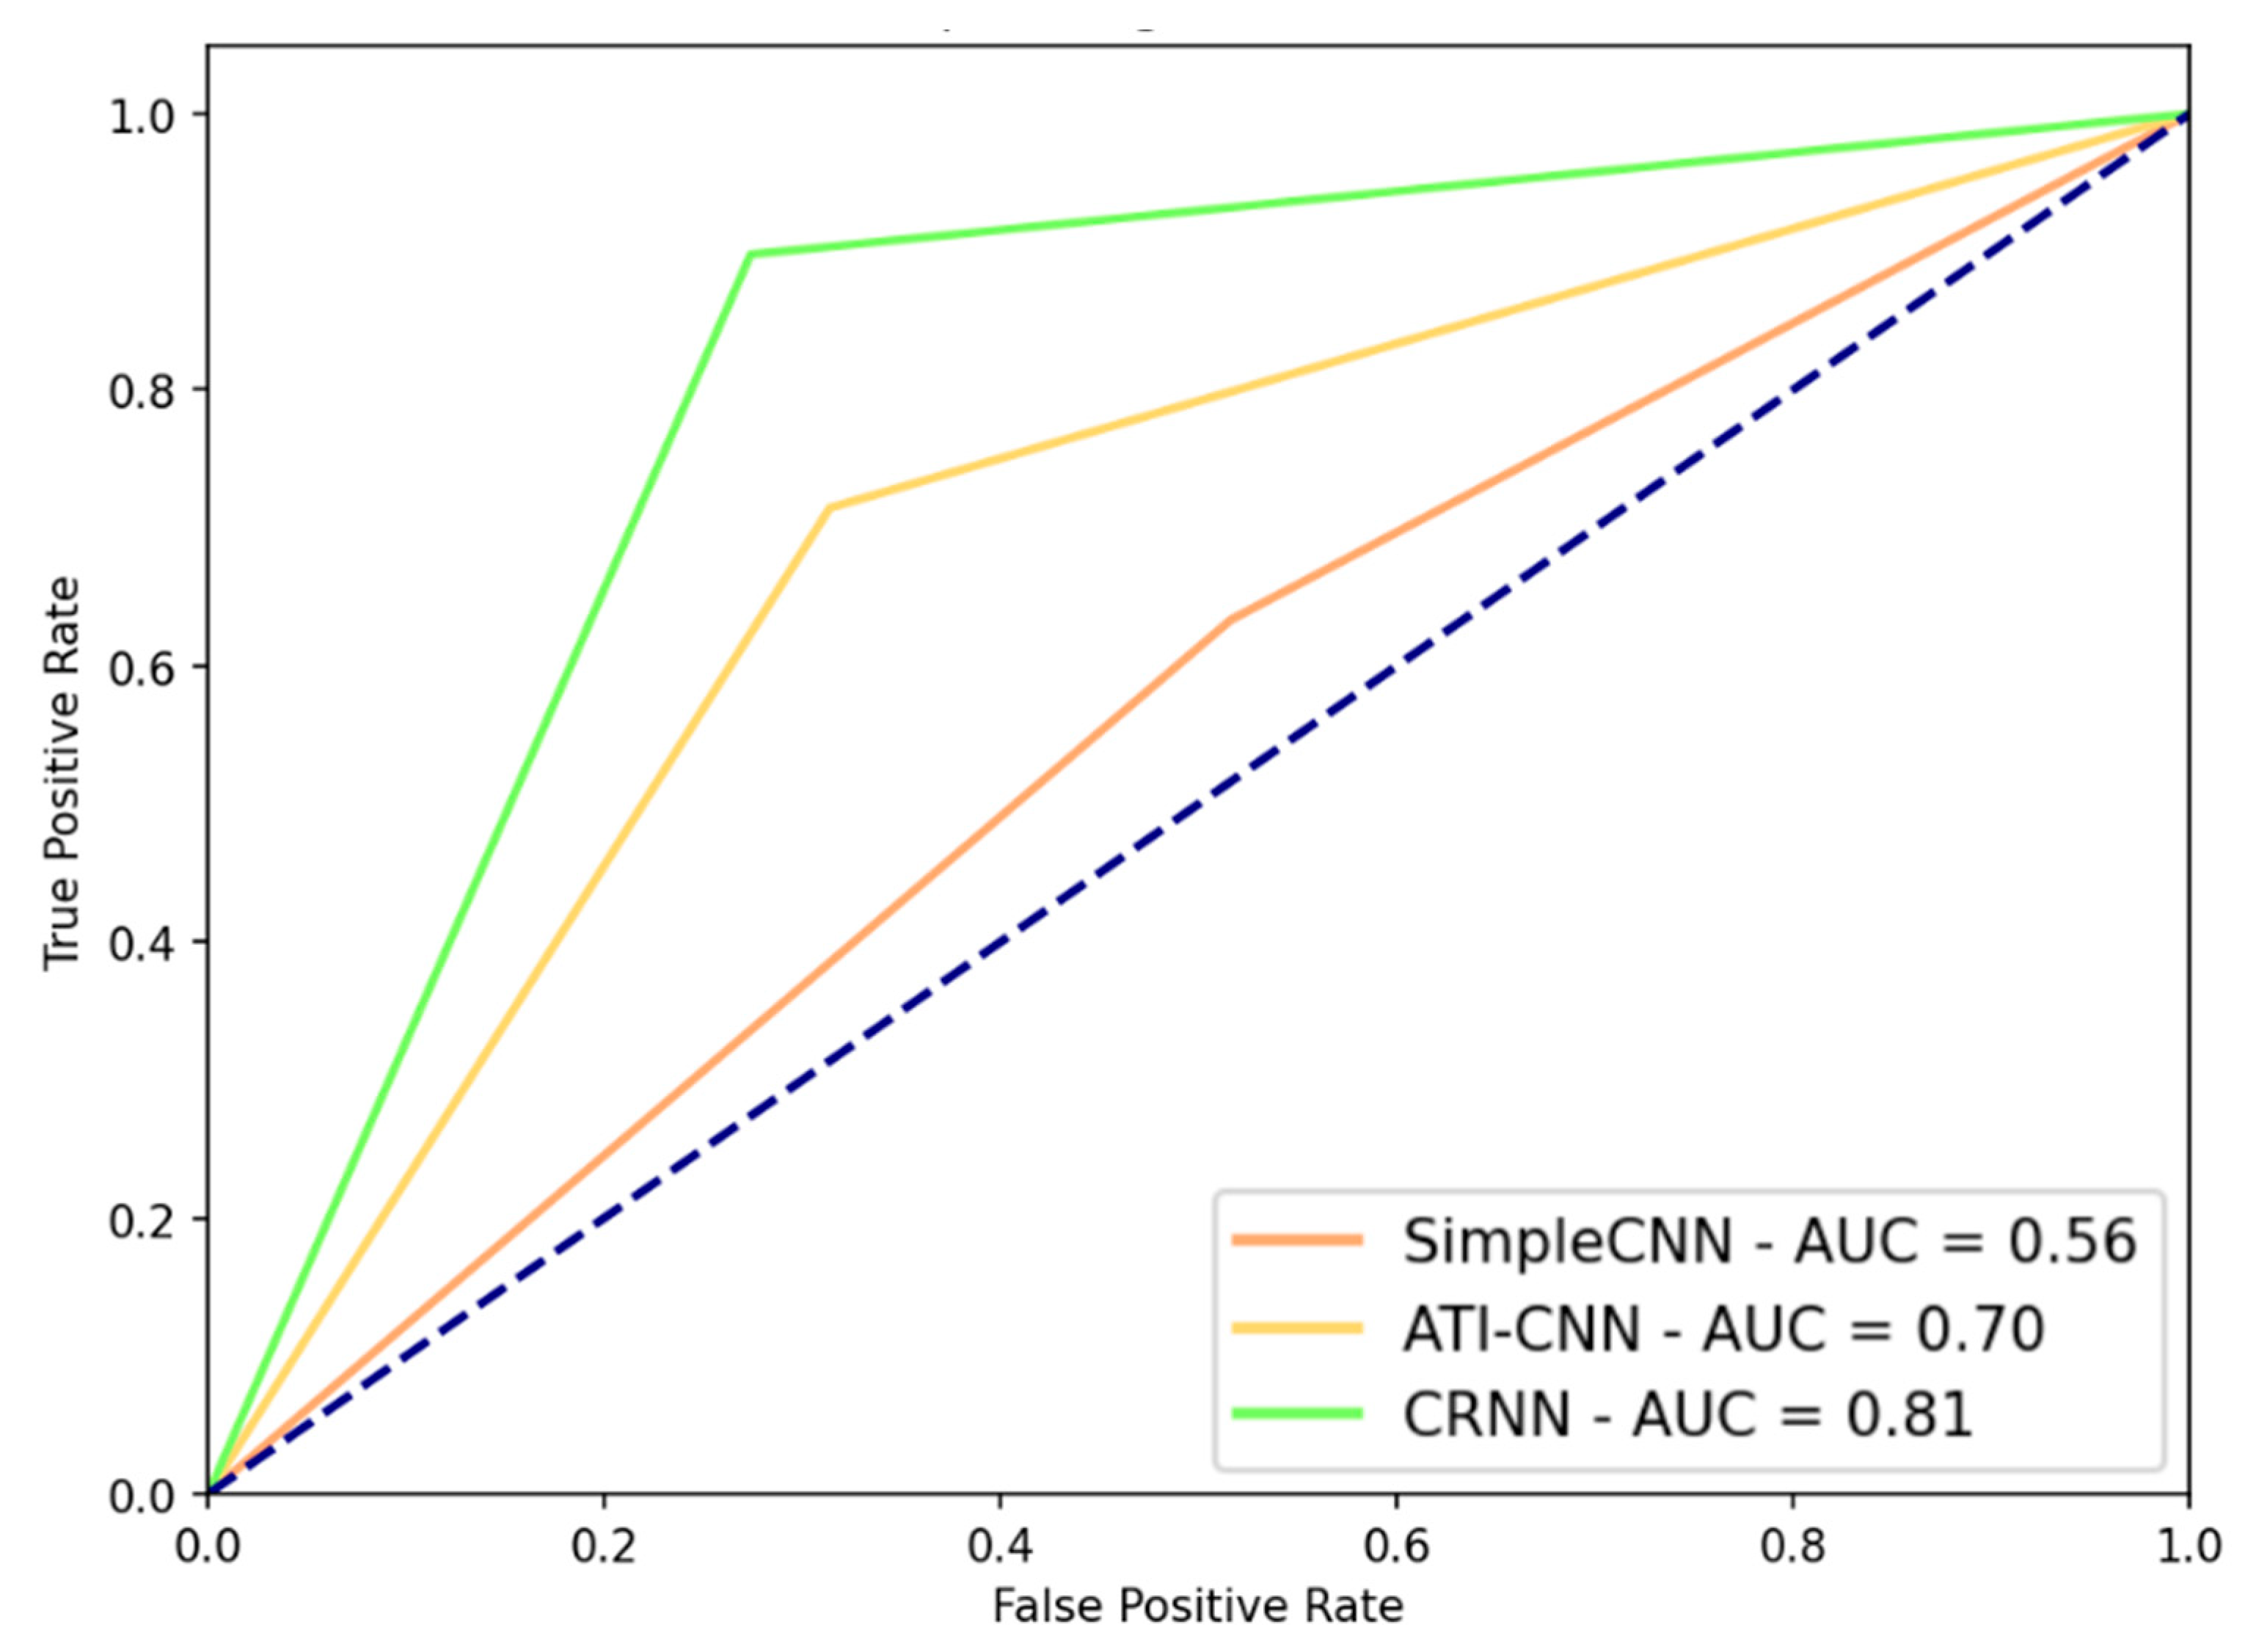
2.3. DL Model Performance
3. Discussion
3.1. Artificial Intelligence in Cardiology
3.2. AF Signals
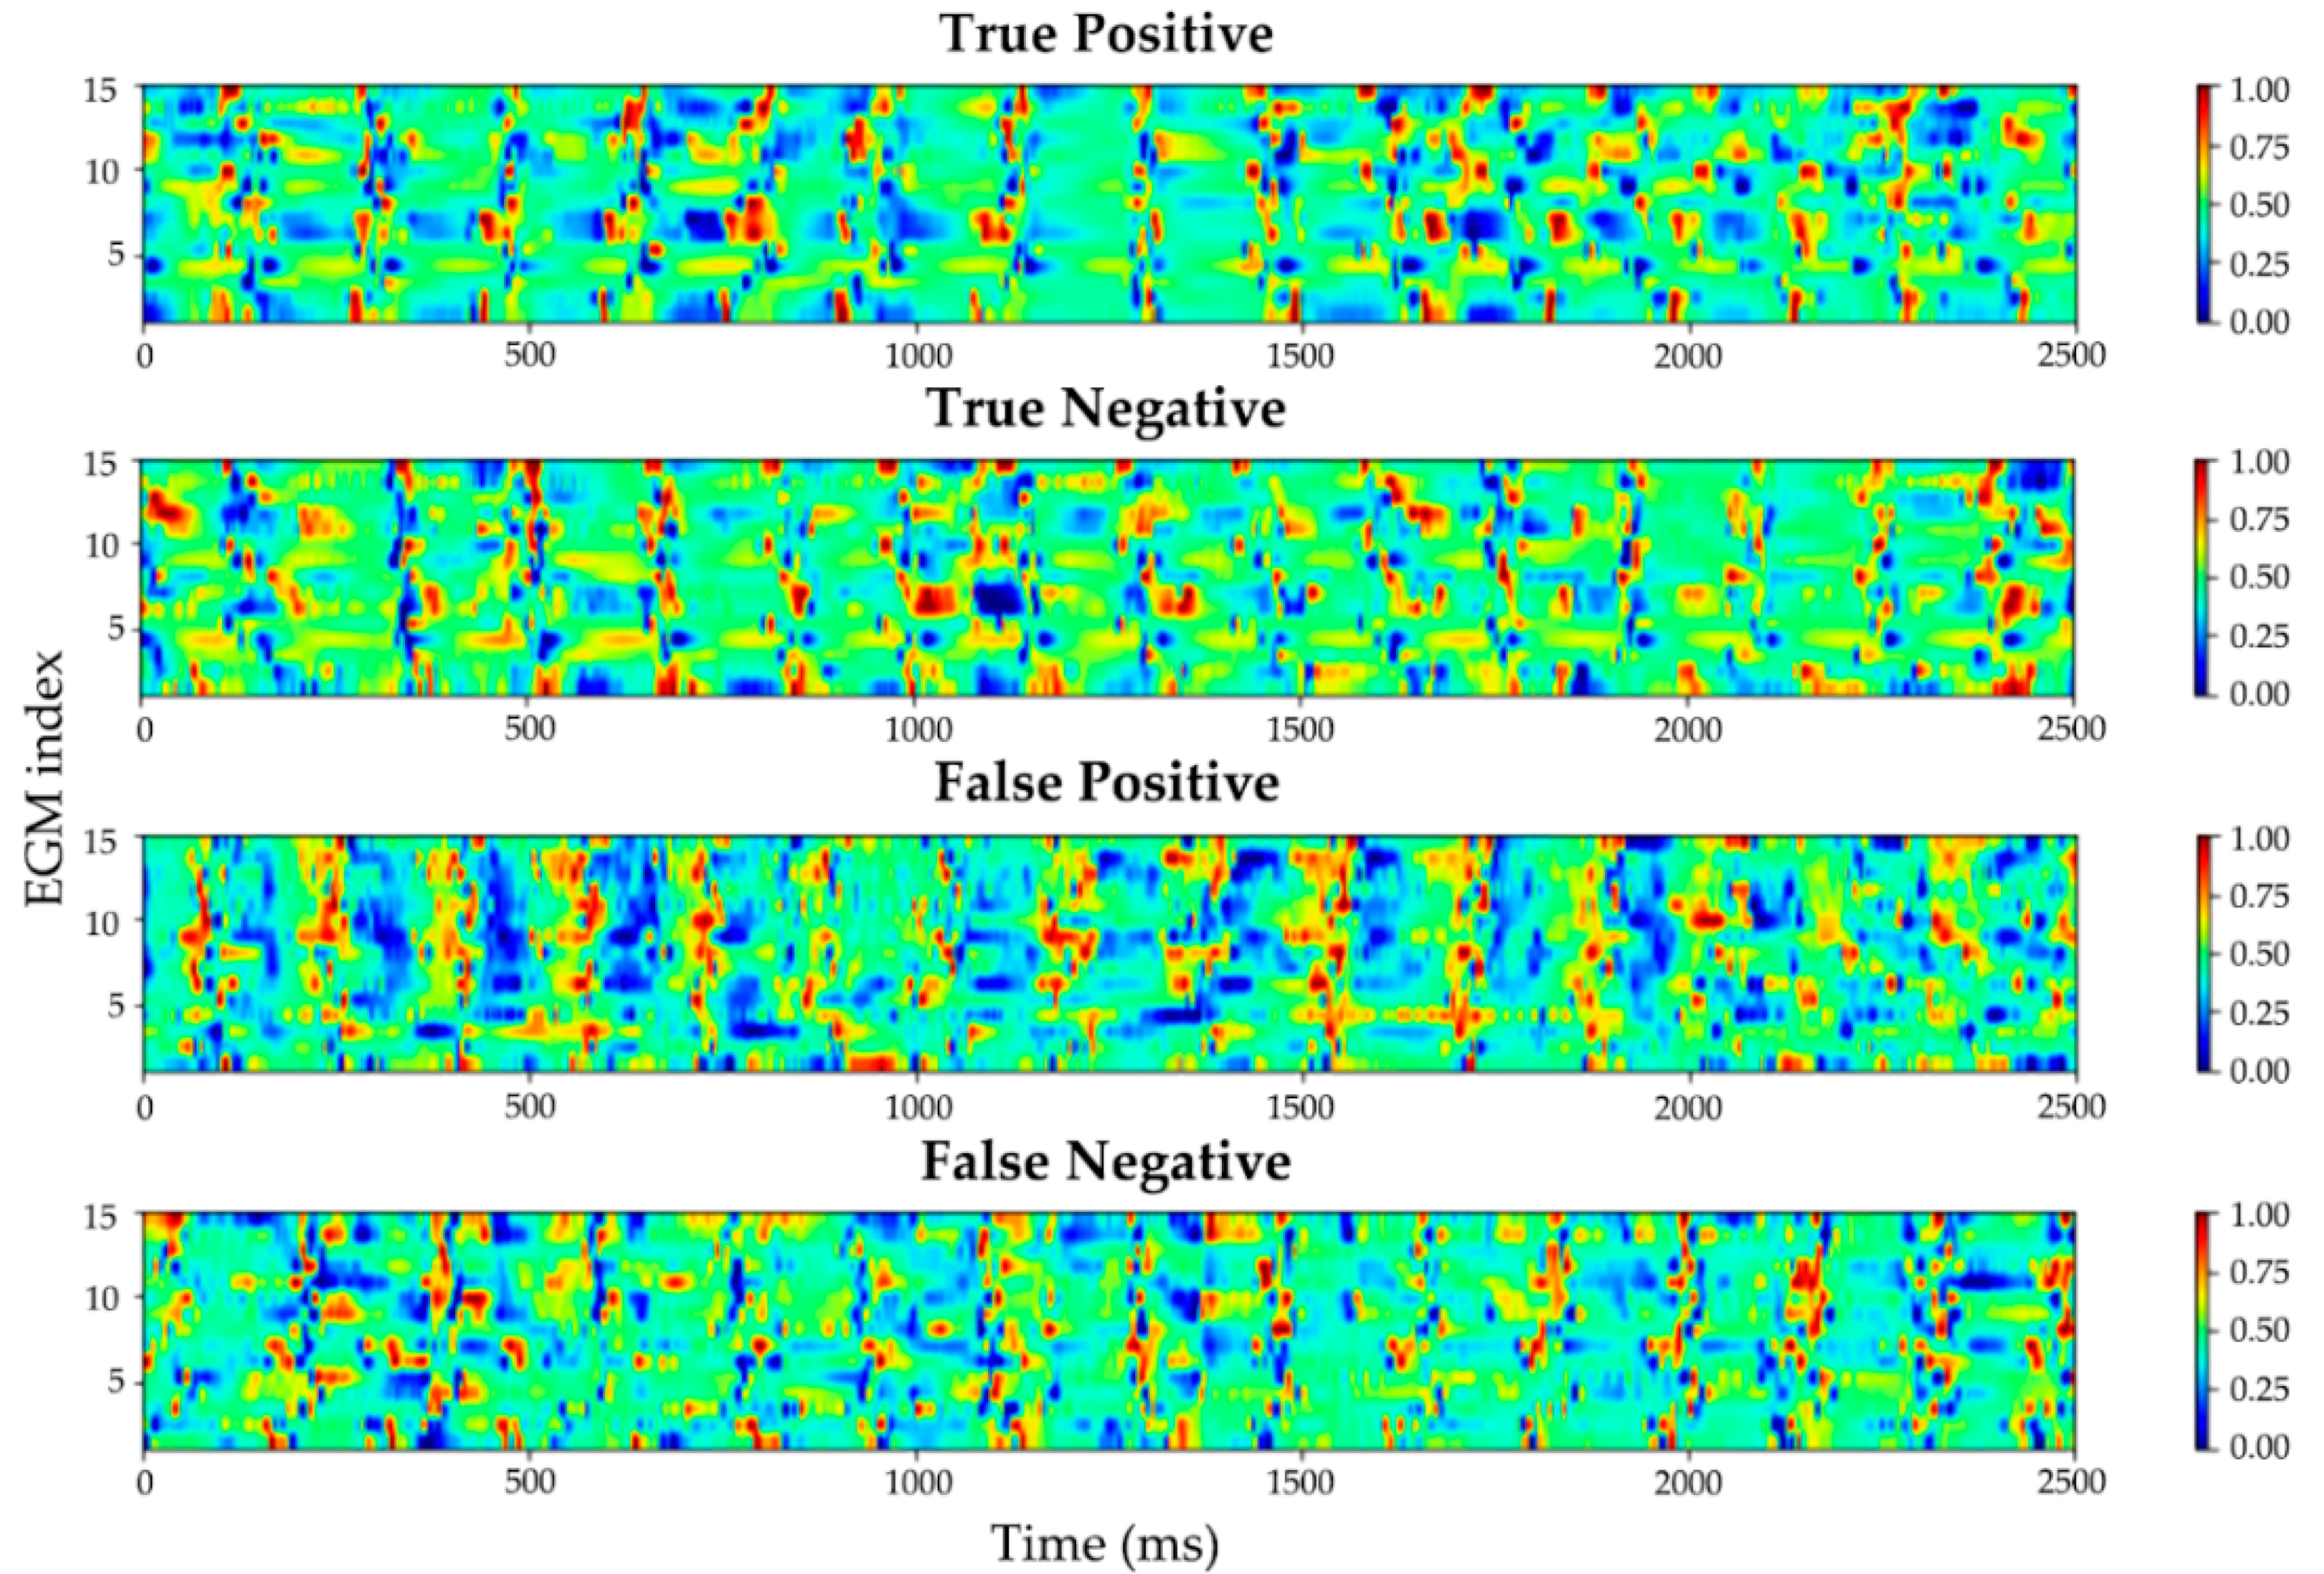
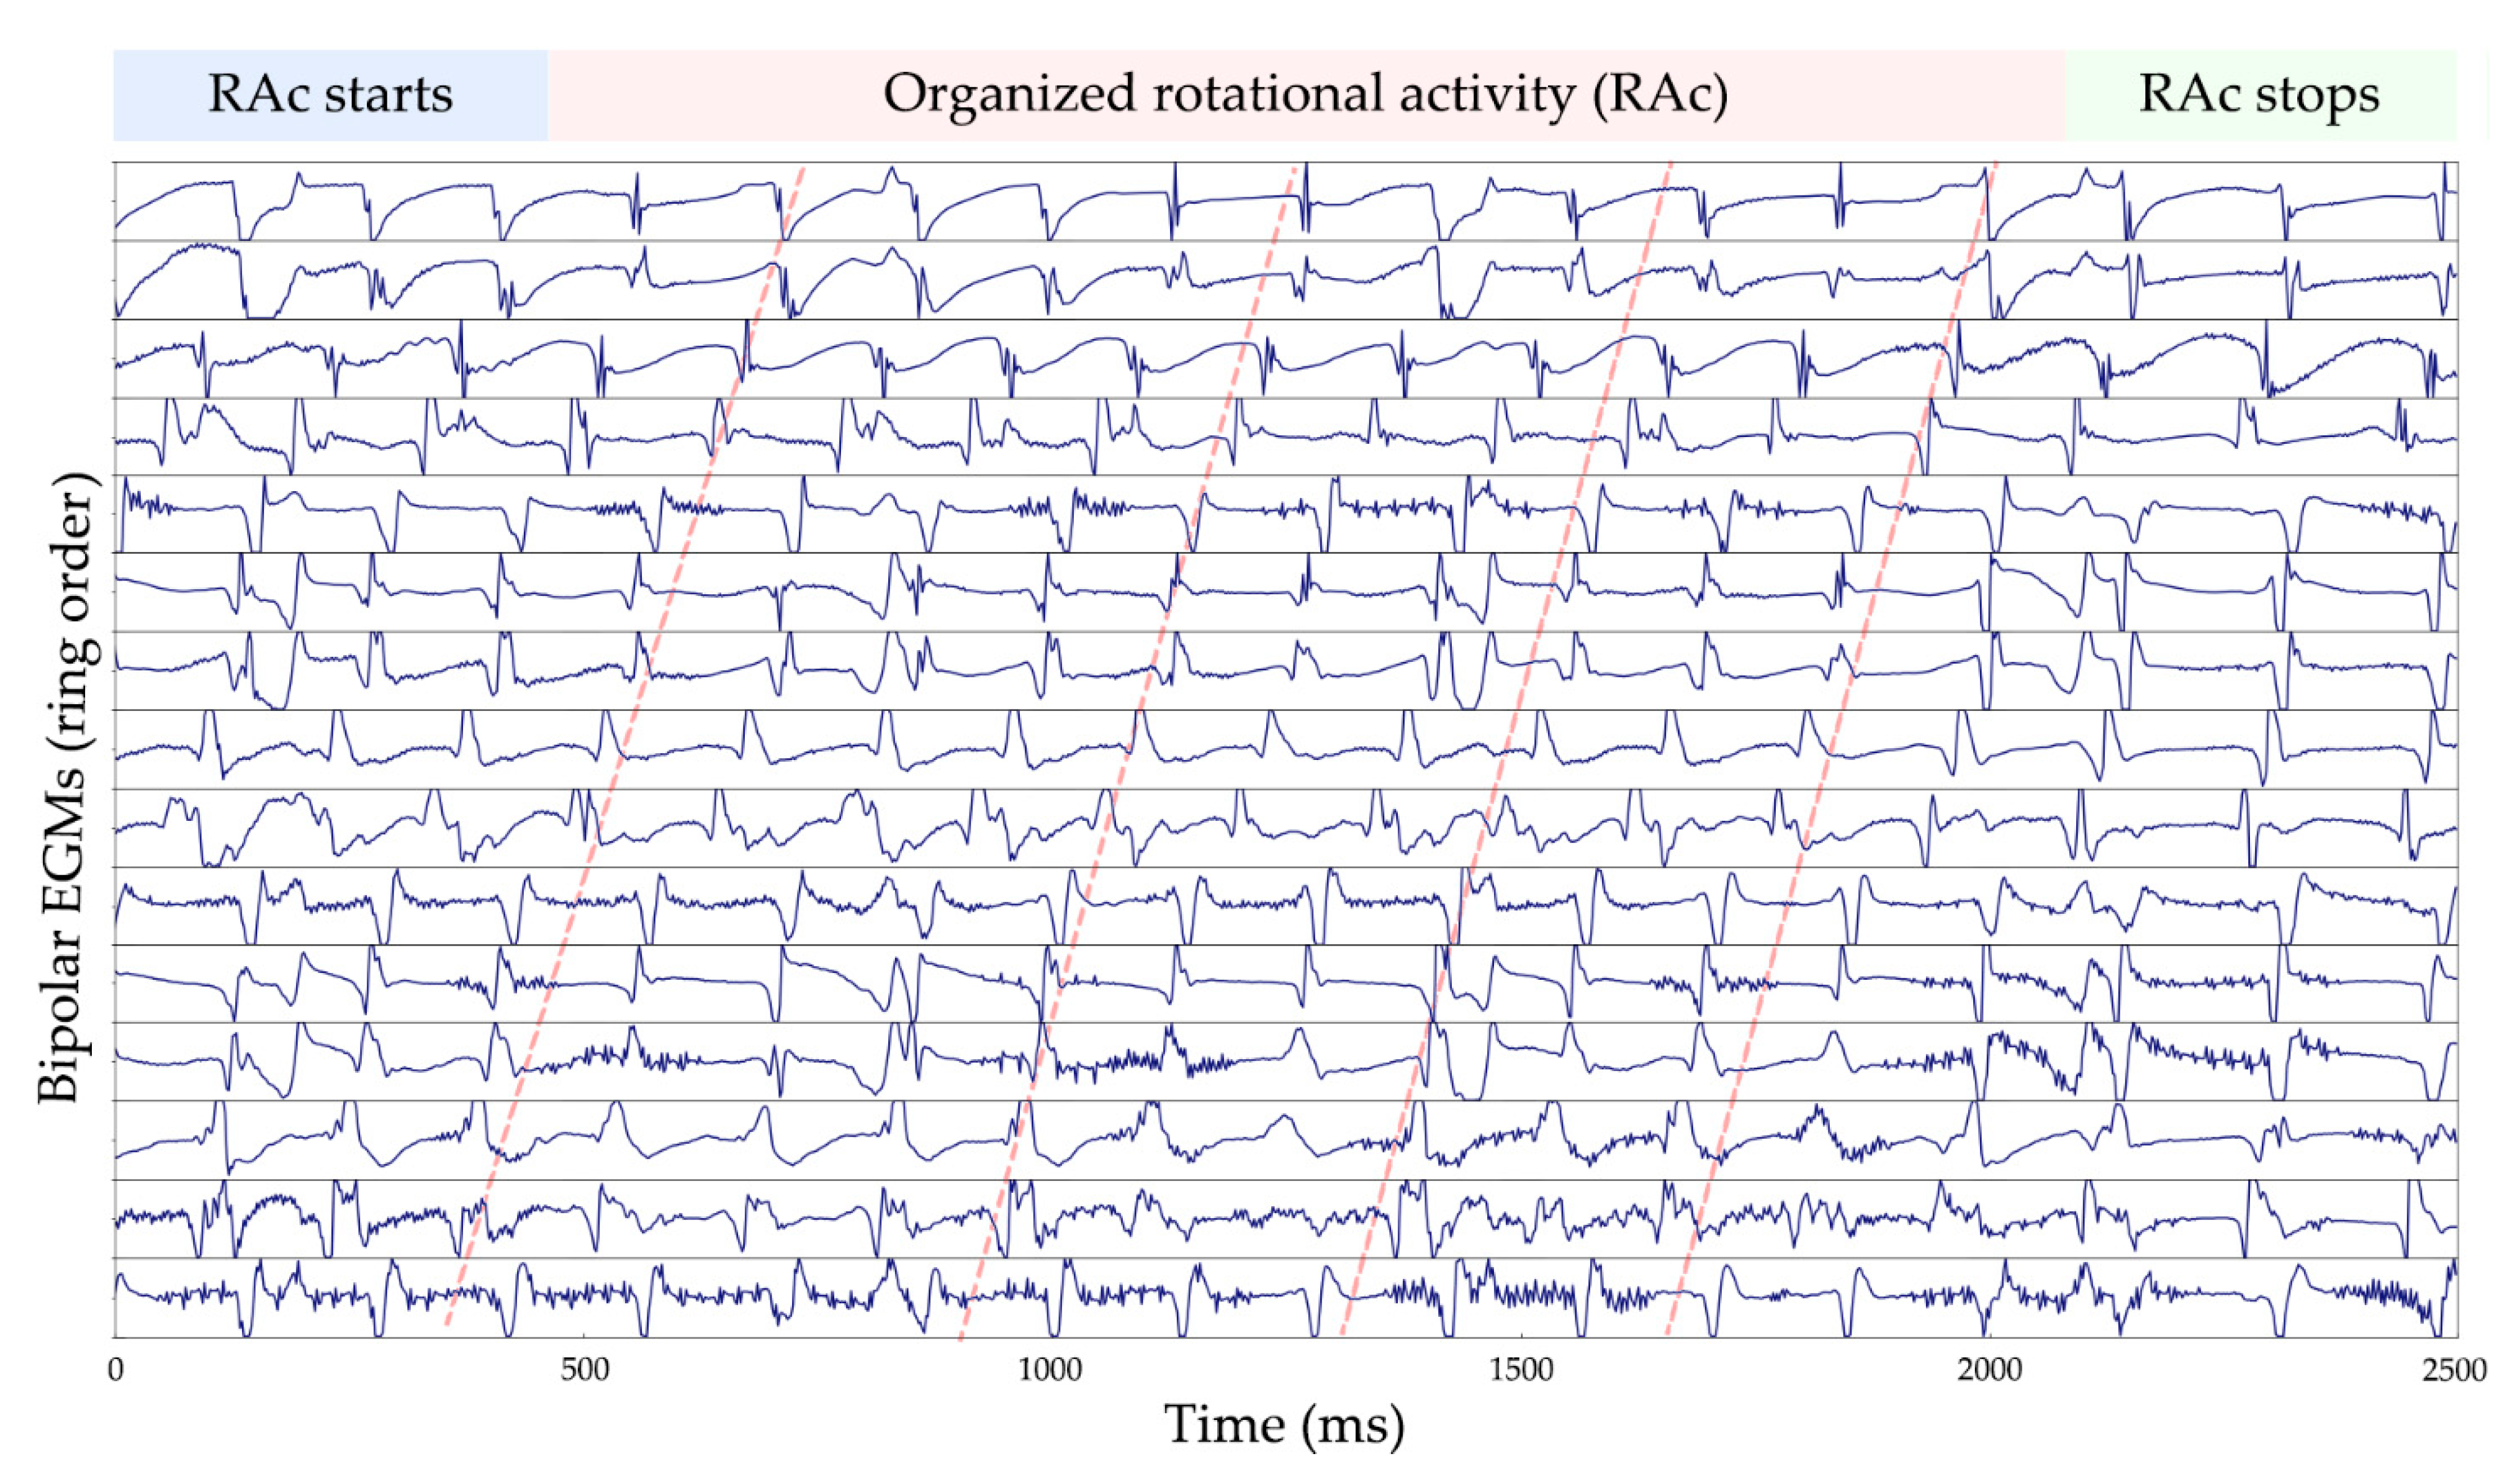
3.3. Rotational Activity Detection Analysis
3.4. Clinical Implications of Rotational Activity
3.5. Study Limitations
4. Materials and Methods
4.1. Patient Cohort
4.2. Signal Database
4.3. Signal Pre-Processing
4.4. Classification Models
4.4.1. SimpleCNN
4.4.2. ATI-CNN
4.4.3. CRNN
4.5. Implementation and Specifications
4.6. Statistical Analysis and Performance Metrics
5. Conclusions
Author Contributions
Funding
Institutional Review Board Statement
Informed Consent Statement
Data Availability Statement
Acknowledgments
Conflicts of Interest
References
- Rawat, W.; Wang, Z. Deep convolutional neural networks for image classification: A comprehensive review. Neural Comput. 2017, 29, 2352–2449. [Google Scholar] [CrossRef] [PubMed]
- Batmaz, Z.; Yurekli, A.; Bilge, A.; Kaleli, C. A review on deep learning for recommender systems: Challenges and remedies. Artif. Intell. Rev. 2019, 52, 1–37. [Google Scholar] [CrossRef]
- Cai, L.; Gao, J.; Zhao, D. A review of the application of deep learning in medical image classification and segmentation. Ann. Transl. Med. 2020, 8, 713. [Google Scholar] [CrossRef] [PubMed]
- Le, N.Q.K.; Nguyen, B.P. Prediction of FMN Binding Sites in Electron Transport Chains Based on 2-D CNN and PSSM Profiles. IEEE ACM Trans. Comput. Biol. Bioinform. 2021, 18, 2189–2197. [Google Scholar] [CrossRef]
- Le, N.Q.K.; Ho, Q.T. Deep transformers and convolutional neural network in identifying DNA N6-methyladenine sites in cross-species genomes. Methods 2021. [Google Scholar] [CrossRef]
- Yao, Q.; Wang, R.; Fan, X.; Liu, J.; Li, Y. Multi-class Arrhythmia detection from 12-lead varied-length ECG using Attention-based Time-Incremental Convolutional Neural Network. Inf. Fusion 2020, 53, 174–182. [Google Scholar] [CrossRef]
- Wu, M.; Lu, Y.; Yang, W.; Wong, S.Y. A Study on Arrhythmia via ECG Signal Classification Using the Convolutional Neural Network. Front. Comput. Neurosci. 2021, 14, 106. [Google Scholar] [CrossRef]
- Salinas-Martínez, R.; de Bie, J.; Marzocchi, N.; Sandberg, F. Detection of Brief Episodes of Atrial Fibrillation Based on Electrocardiomatrix and Convolutional Neural Network. Front. Physiol. 2021, 12, 1333. [Google Scholar] [CrossRef]
- Petmezas, G.; Haris, K.; Stefanopoulos, L.; Kilintzis, V.; Tzavelis, A.; Rogers, J.A.; Katsaggelos, A.K.; Maglaveras, N. Automated Atrial Fibrillation Detection using a Hybrid CNN-LSTM Network on Imbalanced ECG Datasets. Biomed. Signal Process. Control 2021, 63, 102194. [Google Scholar] [CrossRef]
- Ishaque, S.; Khan, N.; Krishnan, S. Trends in Heart-Rate Variability Signal Analysis. Front. Digit. Health 2021, 3, 13. [Google Scholar] [CrossRef]
- Jamart, K.; Xiong, Z.; Maso Talou, G.D.; Stiles, M.K.; Zhao, J. Mini Review: Deep Learning for Atrial Segmentation From Late Gadolinium-Enhanced MRIs. Front. Cardiovasc. Med. 2020, 7, 86. [Google Scholar] [CrossRef]
- Dagher, L.; Shi, H.; Zhao, Y.; Marrouche, N.F. Wearables in cardiology: Here to stay. Hear. Rhythm 2020, 17, 889–895. [Google Scholar] [CrossRef] [PubMed]
- Liao, S.; Ragot, D.; Nayyar, S.; Suszko, A.; Zhang, Z.; Wang, B.; Chauhan, V.S. Deep Learning Classification of Unipolar Electrograms in Human Atrial Fibrillation: Application in Focal Source Mapping. Front. Physiol. 2021, 12, 1162. [Google Scholar] [CrossRef] [PubMed]
- Zolotarev, A.M.; Hansen, B.J.; Ivanova, E.A.; Helfrich, K.M.; Li, N.; Janssen, P.M.L.; Mohler, P.J.; Mokadam, N.A.; Whitson, B.A.; Fedorov, M.V.; et al. Optical mapping-validated machine learning improves atrial fibrillation driver detection by multi-electrode mapping. Circ. Arrhythmia Electrophysiol. 2020, 13, 1199–1212. [Google Scholar] [CrossRef] [PubMed]
- Nagarajan, V.D.; Lee, S.L.; Robertus, J.L.; Nienaber, C.A.; Trayanova, N.A.; Ernst, S. Artificial intelligence in the diagnosis and management of arrhythmias. Eur. Heart J. 2021, 42, 3904–3916. [Google Scholar] [CrossRef]
- Benjamin, E.J.; Muntner, P.; Alonso, A.; Bittencourt, M.S.; Callaway, C.W.; Carson, A.P.; Chamberlain, A.M.; Chang, A.R.; Cheng, S.; Das, S.R.; et al. Heart Disease and Stroke Statistics—2019 Update: A Report From the American Heart Association. Circulation 2019, 139, e56–e528. [Google Scholar] [CrossRef]
- Moe, G. On the Multiple Wavelet Hypothesis of Atrial Fibrillation. Arch. Int. Phamacodyn. Ther. 1962, 140, 183–188. [Google Scholar]
- Haïssaguerre, M.; Jaïs, P.; Shah, D.C.; Takahashi, A.; Hocini, M.; Quiniou, G.; Garrigue, S.; Le Mouroux, A.; Le Métayer, P.; Clémenty, J. Spontaneous Initiation of Atrial Fibrillation by Ectopic Beats Originating in the Pulmonary Veins. N. Engl. J. Med. 1998, 339, 659–666. [Google Scholar] [CrossRef] [Green Version]
- Jalife, J.; Berenfeld, O.; Skanes, A.; Mandapati, R. Mechanisms of atrial fibrillation: Mother rotors or multiple daughter wavelets, or both? J. Cardiovasc. Electrophysiol. 1998, 9, S2–S12. [Google Scholar]
- Magnussen, C.; Niiranen, T.J.; Ojeda, F.M.; Gianfagna, F.; Blankenberg, S.; Njølstad, I.; Vartiainen, E.; Sans, S.; Pasterkamp, G.; Hughes, M.; et al. Sex Differences and Similarities in Atrial Fibrillation Epidemiology, Risk Factors, and Mortality in Community Cohorts. Circulation 2017, 136, 1588–1597. [Google Scholar] [CrossRef] [Green Version]
- Kuklik, P.; Zeemering, S.; van Hunnik, A.; Maesen, B.; Pison, L.; Lau, D.; Maessen, J.; Podziemski, P.; Meyer, C.; Schaffer, B.; et al. Identification of Rotors during Human Atrial Fibrillation Using Contact Mapping and Phase Singularity Detection: Technical Considerations. IEEE Trans. Biomed. Eng. 2016, 64, 310–318. [Google Scholar] [CrossRef] [PubMed]
- Daoud, E.G.; Zeidan, Z.; Hummel, J.D.; Weiss, R.; Houmsse, M.; Augostini, R.; Kalbfleisch, S.J. Identification of Repetitive Activation Patterns Using Novel Computational Analysis of Multielectrode Recordings During Atrial Fibrillation and Flutter in Humans. JACC Clin. Electrophysiol. 2017, 3, 207–216. [Google Scholar] [CrossRef] [PubMed]
- Ríos-Muñoz, G.R.; Arenal, Á.; Artés-Rodríguez, A. Real-Time Rotational Activity Detection in Atrial Fibrillation. Front. Physiol. 2018, 9, 208. [Google Scholar] [CrossRef] [PubMed] [Green Version]
- Luengo, D.; Rios-Munoz, G.; Elvira, V.; Sanchez, C.; Artes-Rodriguez, A. Hierarchical Algorithms for Causality Retrieval in Atrial Fibrillation Intracavitary Electrograms. IEEE J. Biomed. Health Inform. 2019, 23, 143–155. [Google Scholar] [CrossRef] [Green Version]
- Vandersickel, N.; Van Nieuwenhuyse, E.; Van Cleemput, N.; Goedgebeur, J.; El Haddad, M.; De Neve, J.; Demolder, A.; Strisciuglio, T.; Duytschaever, M.; Panfilov, A.V. Directed Networks as a Novel Way to Describe and Analyze Cardiac Excitation: Directed Graph Mapping. Front. Physiol. 2019, 10, 1138. [Google Scholar] [CrossRef]
- Atienza, F.; Almendral, J.; Ormaetxe, J.M.; Moya, Á.; Martínez-Alday, J.D.; Hernández-Madrid, A.; Castellanos, E.; Arribas, F.; Arias, M.Á.; Tercedor, L.; et al. Comparison of Radiofrequency Catheter Ablation of Drivers and Circumferential Pulmonary Vein Isolation in Atrial Fibrillation: A Noninferiority Randomized Multicenter RADAR-AF Trial. J. Am. Coll. Cardiol. 2014, 64, 2455–2467. [Google Scholar] [CrossRef] [Green Version]
- Adragão, P.; Carmo, P.; Cavaco, D.; Carmo, J.; Ferreira, A.; Moscoso Costa, F.; Carvalho, M.S.; Mesquita, J.; Quaresma, R.; Belo Morgado, F.; et al. Relationship between rotors and complex fractionated electrograms in atrial fibrillation using a novel computational analysis. Rev. Port. Cardiol. 2017, 36, 233–238. [Google Scholar] [CrossRef]
- Repici, A.; Badalamenti, M.; Maselli, R.; Correale, L.; Radaelli, F.; Rondonotti, E.; Ferrara, E.; Spadaccini, M.; Alkandari, A.; Fugazza, A.; et al. Efficacy of Real-Time Computer-Aided Detection of Colorectal Neoplasia in a Randomized Trial. Gastroenterology 2020, 159, 512–520.e7. [Google Scholar] [CrossRef]
- Lu, X.H. Application of Machine Learning and Grocery Transaction Data. 2015. [Google Scholar]
- Paszke, A.; Gross, S.; Massa, F.; Lerer, A.; Bradbury, J.; Chanan, G.; Killeen, T.; Lin, Z.; Gimelshein, N.; Antiga, L.; et al. PyTorch: An Imperative Style, High-Performance Deep Learning Library. In Advances in Neural Information Processing Systems 32; Wallach, H., Larochelle, H., Beygelzimer, A., de Alché-Buc, F., Fox, E., Garnett, R., Eds.; Curran Associates Inc.: Red Hook, NY, USA, 2019; pp. 8024–8035. [Google Scholar]
- Sanchez de la Nava, A.M.; Arenal, Á.; Fernández-Avilés, F.; Atienza, F. Artificial Intelligence-Driven Algorithm for Drug Effect Prediction on Atrial Fibrillation: An in silico Population of Models Approach. Front. Physiol. 2021, 12, 768468. [Google Scholar] [CrossRef]
- Li, X.; Almeida, T.P.; Dastagir, N.; Guillem, M.S.; Salinet, J.; Chu, G.S.; Stafford, P.J.; Schlindwein, F.S.; Ng, G.A. Standardizing Single-Frame Phase Singularity Identification Algorithms and Parameters in Phase Mapping During Human Atrial Fibrillation. Front. Physiol. 2020, 11, 869. [Google Scholar] [CrossRef]
- Jones, A.R.; Krummen, D.E.; Narayan, S.M. Non-invasive identification of stable rotors and focal sources for human atrial fibrillation: Mechanistic classification of atrial fibrillation from the electrocardiogram. EP Eur. 2013, 15, 1249–1258. [Google Scholar] [CrossRef] [PubMed]
- Narayan, S.M.; Krummen, D.E.; Enyeart, M.W.; Rappel, W.J. Computational Mapping Identifies Localized Mechanisms for Ablation of Atrial Fibrillation. PLoS ONE 2012, 7, e46034. [Google Scholar] [CrossRef] [PubMed]
- Rosa, G.; Quintanilla, J.G.; Salgado, R.; González-Ferrer, J.J.; Cañadas-Godoy, V.; Pérez-Villacastín, J.; Pérez-Castellano, N.; Jalife, J.; Filgueiras-Rama, D. Mapping Technologies for Catheter Ablation of Atrial Fibrillation Beyond Pulmonary Vein Isolation. Eur. Cardiol. 2021, 16, e21. [Google Scholar] [CrossRef] [PubMed]
- Quintanilla, J.G.; Alfonso-Almazán, J.M.; Pérez-Castellano, N.; Pandit, S.V.; Jalife, J.; Pérez-Villacastín, J.; Filgueiras-Rama, D. Instantaneous Amplitude and Frequency Modulations Detect the Footprint of Rotational Activity and Reveal Stable Driver Regions as Targets for Persistent Atrial Fibrillation Ablation. Circ. Res. 2019, 125, 609–627. [Google Scholar] [CrossRef] [PubMed]
- Herron, T.J.; Lee, P.; Jalife, J. Optical imaging of voltage and calcium in cardiac cells & tissues. Circ. Res. 2012, 110, 609–623. [Google Scholar] [CrossRef] [Green Version]
- Dretzke, J.; Chuchu, N.; Agarwal, R.; Herd, C.; Chua, W.; Fabritz, L.; Bayliss, S.; Kotecha, D.; Deeks, J.J.; Kirchhof, P.; et al. Predicting recurrent atrial fibrillation after catheter ablation: A systematic review of prognostic models. Europace 2020, 22, 748–760. [Google Scholar] [CrossRef]
- Vizzardi, E.; Curnis, A.; Latini, M.G.; Salghetti, F.; Rocco, E.; Lupi, L.; Rovetta, R.; Quinzani, F.; Bonadei, I.; Bontempi, L.; et al. Risk factors for atrial fibrillation recurrence: A literature review. J. Cardiovasc. Med. 2014, 15, 235–253. [Google Scholar] [CrossRef]
- Narayan, S.M.; Krummen, D.E.; Rappel, W.J. Clinical Mapping Approach to Diagnose Electrical Rotors and Focal Impulse Sources for Human Atrial Fibrillation. J. Cardiovasc. Electrophysiol. 2012, 23, 447–454. [Google Scholar] [CrossRef] [Green Version]
- Miller, J.M.; Kalra, V.; Das, M.K.; Jain, R.; Garlie, J.B.; Brewster, J.A.; Dandamudi, G. Clinical Benefit of Ablating Localized Sources for Human Atrial Fibrillation: The Indiana University FIRM Registry. J. Am. Coll. Cardiol. 2017, 69, 1247–1256. [Google Scholar] [CrossRef]
- Knecht, S.; Sohal, M.; Deisenhofer, I.; Albenque, J.P.; Arentz, T.; Neumann, T.; Cauchemez, B.; Duytschaever, M.; Ramoul, K.; Verbeet, T.; et al. Multicentre evaluation of non-invasive biatrial mapping for persistent atrial fibrillation ablation: The AFACART study. Europace 2017, 19, 1302–1309. [Google Scholar] [CrossRef]
- Calvo, D.; Rubín, J.; Pérez, D.; Morís, C. Ablation of Rotor Domains Effectively Modulates Dynamics of Human: Long-Standing Persistent Atrial Fibrillation. Circ. Arrhythm. Electrophysiol. 2017, 10, e005740. [Google Scholar] [CrossRef] [PubMed]
- Honarbakhsh, S.; Schilling, R.J.; Providencia, R.; Keating, E.; Chow, A.; Sporton, S.; Lowe, M.; Earley, M.J.; Lambiase, P.D.; Hunter, R.J. Characterization of drivers maintaining atrial fibrillation: Correlation with markers of rapidity and organization on spectral analysis. Hear. Rhythm 2018, 15, 1296–1303. [Google Scholar] [CrossRef] [PubMed]
- Willems, S.; Verma, A.; Betts, T.R.; Murray, S.; Neuzil, P.; Ince, H.; Steven, D.; Sultan, A.; Heck, P.M.; Hall, M.C.; et al. Targeting Nonpulmonary Vein Sources in Persistent Atrial Fibrillation Identified by Noncontact Charge Density Mapping: UNCOVER AF Trial. Circ. Arrhythm. Electrophysiol. 2019, 12, e007233. [Google Scholar] [CrossRef] [PubMed]
- Choudry, S.; Mansour, M.; Sundaram, S.; Nguyen, D.T.; Dukkipati, S.R.; Whang, W.; Kessman, P.; Reddy, V.Y. RADAR: A Multicenter Food and Drug Administration Investigational Device Exemption Clinical Trial of Persistent Atrial Fibrillation. Circ. Arrhythm. Electrophysiol. 2020, 13, e007825. [Google Scholar] [CrossRef] [PubMed]
- Lee, G.; Kumar, S.; Teh, A.; Madry, A.; Spence, S.; Larobina, M.; Goldblatt, J.; Brown, R.; Atkinson, V.; Moten, S.; et al. Epicardial Wave Mapping in Human Long-Lasting Persistent Atrial Fibrillation: Transient Rotational Circuits, Complex Wavefronts, and Disorganized Activity. Eur. Heart J. 2014, 35, 86–97. [Google Scholar] [CrossRef] [Green Version]
- Hindricks, G.; Potpara, T.; Dagres, N.; Arbelo, E.; Bax, J.; Blomström-Lundqvist, C.; Boriani, G.; Castella, M.; Dan, G.; Dilaveris, P.; et al. 2020 ESC Guidelines for the diagnosis and management of atrial fibrillation developed in collaboration with the European Association of Cardio-Thoracic Surgery (EACTS). Eur. Heart J. 2021, 42, 373–498. [Google Scholar] [CrossRef]
- Ríos-Muñoz, G.R.; Soto, N.; Ávila, P.; Carta, A.; Atienza, F.; Datino, T.; González-Torrecilla, E.; Fernández-Avilés, F.; Arenal, Á. Structural Remodeling and Rotational Activity in Persistent/Long-Lasting Atrial Fibrillation: Gender-Effect Differences and Impact on Post-Ablation Outcome. Front. Cardiovasc. Med. 2022, 9, 819429. [Google Scholar] [CrossRef]
- Krizhevsky, A.; Sutskever, I.; Hinton, G.E. ImageNet classification with deep convolutional neural networks. Commun. ACM 2017, 60, 84–90. [Google Scholar] [CrossRef]
- Zheng, X.; Zhang, C.; Chen, P.; Zhao, K.; Jiang, H.; Jiang, Z.; Pan, H.; Wang, Z.; Jia, W. A CRNN system for sound event detection based on gastrointestinal sound dataset collected by wearable auscultation devices. IEEE Access 2020, 8, 157892–157905. [Google Scholar] [CrossRef]
- Andersen, R.S.; Peimankar, A.; Puthusserypady, S. A deep learning approach for real-time detection of atrial fibrillation. Expert Syst. Appl. 2019, 115, 465–473. [Google Scholar] [CrossRef]
- Kingma, D.P.; Ba, J.L. Adam: A Method for Stochastic Optimization. In Proceedings of the 3rd International Conference Learning Representations ICLR 2015, San Diego, CA, USA, 7–9 May 2015. [Google Scholar] [CrossRef]
- Chicco, D.; Jurman, G. The advantages of the Matthews correlation coefficient (MCC) over F1 score and accuracy in binary classification evaluation. BMC Genom. 2020, 21, 6. [Google Scholar] [CrossRef] [PubMed] [Green Version]


| Characteristics | All Patients | Training Set | Test Set | p-Value |
|---|---|---|---|---|
| N | 75 (100.0) | 43 | 5 | - |
| Age (years) | 60.7 ± 9.7 | 61.4 ± 9.5 | 60.0 ± 4.1 | 0.7509 |
| Sex | ||||
| Men | 56 (74.7) | 37 (86.0) | 3 (60.0) | 0.1389 |
| Women | 19 (25.3) | 6 (14.0) | 2 (40.0) | 0.1389 |
| Atrial volume (cm3) | 148.5 ± 39.4 | 158.6 ± 40.5 | 144.4 ± 37.7 | 0.4649 |
| Diagnosis of AF (years) | 3.1 ± 3.5 | 3.6 ± 2.5 | 1.8 ± 1.5 | 0.1594 |
| Comorbidities | ||||
| BSA (m2) | 2.0 ± 0.2 | 2.1 ± 0.2 | 2.1 ± 0.1 | 0.6083 |
| CHA2DS2-VASc | 1.8 ± 1.5 | 1.6 ± 1.4 | 2.0 ± 1.3 | 0.5403 |
| COPD | 4 (5.3) | 4 (9.0) | 0 (0.0) | 0.4777 |
| Diabetes mellitus | 12 (16.0) | 6 (14.0) | 1 (20.0) | 0.7188 |
| Dyslipidemia | 26 (34.7) | 16 (37.0) | 3 (60.0) | 0.3222 |
| Heart failure | 13 (17.3) | 8 (16.6) | 1 (20.0) | 0.9362 |
| Hypertension | 36 (48.04) | 21 (49.0) | 3 (60.0) | 0.6384 |
| Obstructive sleep apnea | 16 (21.3) | 10 (23.0) | 0 (0.0) | 0.2263 |
| SHD | 22 (29.3) | 12 (28.0) | 3 (60.0) | 0.1416 |
| Stroke | 4 (5.33) | 4 (9.0) | 0 (0.0) | 0.4777 |
| Signal acquisitions (per patient) | ||||
| Number of acquisitions | 37.2 ± 14.7 | 39.9 ± 13.6 | 35.0 ± 8.6 | 0.4471 |
| Number of rotational events | 51.2 ± 112.4 | 66.5 ± 111.9 | 50.4 ± 57.2 | 0.7568 |
| Rotor cycle duration (ms) | 166.8 ± 36.1 | 167.0 ± 36.4 | 164.4 ± 31.1 | 0.9073 |
| DL Model | Input Data | Signal Length | Sampling Frequency | Validation Accuracy | Test Accuracy | Precision | Recall | Specificity | MCC |
|---|---|---|---|---|---|---|---|---|---|
| (Type) | (ms) | (Hz) | (%) | (%) | (%) | (%) | (%) | ||
| SimpleCNN | uEGMs | 500 | 500 | 49.83 | 49.93 | 49.96 | 77.82 | 22.05 | −0.002 |
| 250 | 50.99 | 49.07 | 49.25 | 60.72 | 37.43 | −0.019 | |||
| 100 | 53.54 | 52.13 | 52.26 | 49.38 | 54.89 | 0.043 | |||
| 2500 | 500 | 51.23 | 49.97 | 49.94 | 26.88 | 73.05 | −0.001 | ||
| 250 | 48.82 | 50.62 | 50.37 | 84.33 | 16.91 | 0.017 | |||
| 100 | 50.20 | 51.24 | 51.15 | 55.00 | 47.48 | 0.025 | |||
| bEGMs | 500 | 500 | 50.00 | 50.00 | 50.00 | 100.00 | 0.00 | 0.000 | |
| 250 | 50.00 | 50.01 | 50.00 | 100.00 | 0.01 | 0.008 | |||
| 100 | 48.96 | 49.46 | 49.27 | 36.73 | 62.18 | −0.011 | |||
| 2500 | 500 | 50.00 | 50.00 | 50.00 | 100.00 | 0.00 | 0.000 | ||
| 250 | 50.00 | 50.00 | 50.00 | 100.00 | 0.00 | 0.000 | |||
| 100 | 50.00 | 50.05 | 50.03 | 100.00 | 0.10 | 0.022 | |||
| uLATs | 500 | 500 | 57.90 | 55.86 | 55.10 | 63.32 | 48.39 | 0.118 | |
| 250 | 55.97 | 53.21 | 52.87 | 59.08 | 47.34 | 0.065 | |||
| 100 | 53.61 | 52.51 | 52.45 | 53.64 | 51.38 | 0.050 | |||
| 2500 | 500 | 51.07 | 50.77 | 51.14 | 34.67 | 66.88 | 0.016 | ||
| 250 | 51.36 | 49.80 | 49.78 | 44.77 | 54.84 | −0.004 | |||
| 100 | 52.16 | 48.59 | 48.62 | 49.97 | 47.20 | −0.028 | |||
| ATI-CNN | uEGMs | 500 | 500 | 64.00 | 58.56 | 70.63 | 29.32 | 87.80 | 0.211 |
| 250 | 58.82 | 56.83 | 73.20 | 21.54 | 92.11 | 0.193 | |||
| 100 | 62.00 | 58.81 | 66.80 | 35.05 | 82.57 | 0.200 | |||
| 2500 | 500 | 63.37 | 59.28 | 68.18 | 34.80 | 83.76 | 0.213 | ||
| 250 | 59.85 | 58.83 | 71.11 | 29.73 | 87.92 | 0.217 | |||
| 100 | 54.33 | 55.67 | 66.41 | 22.95 | 88.39 | 0.150 | |||
| bEGMs | 500 | 500 | 62.69 | 63.30 | 71.97 | 43.56 | 83.04 | 0.289 | |
| 250 | 67.60 | 58.75 | 68.16 | 32.86 | 84.65 | 0.205 | |||
| 100 | 67.42 | 62.00 | 69.78 | 42.33 | 81.67 | 0.261 | |||
| 2500 | 500 | 64.01 | 59.85 | 63.46 | 46.44 | 73.26 | 0.204 | ||
| 250 | 65.49 | 63.05 | 65.09 | 56.31 | 69.80 | 0.263 | |||
| 100 | 65.74 | 58.96 | 57.69 | 67.21 | 50.70 | 0.182 | |||
| uLATs | 500 | 500 | 64.14 | 63.29 | 69.56 | 47.25 | 79.33 | 0.281 | |
| 250 | 70.56 | 65.36 | 68.63 | 56.57 | 74.14 | 0.312 | |||
| 100 | 76.44 | 70.03 | 69.48 | 71.44 | 68.62 | 0.401 | |||
| 2500 | 500 | - | - | - | - | - | - 1 | ||
| 250 | 62.39 | 54.23 | 75.75 | 12.43 | 96.02 | 0.154 | |||
| 100 | 70.89 | 65.46 | 59.85 | 93.95 | 36.97 | 0.376 | |||
| CRNN | uEGMs | 500 | 500 | 71.76 | 68.40 | 77.91 | 51.36 | 85.44 | 0.400 |
| 250 | 65.76 | 63.12 | 77.17 | 37.25 | 88.98 | 0.310 | |||
| 100 | 56.25 | 64.81 | 70.93 | 50.18 | 79.44 | 0.310 | |||
| 2500 | 500 | 63.05 | 60.55 | 46.73 | 64.73 | 58.27 | 0.220 | ||
| 250 | 71.40 | 63.66 | 70.90 | 46.34 | 80.98 | 0.290 | |||
| 100 | 64.86 | 61.71 | 58.20 | 83.11 | 40.31 | 0.260 | |||
| bEGMs | 500 | 500 | 78.39 | 72.52 | 67.12 | 89.80 | 50.24 | 0.410 | |
| 250 | 72.57 | 59.88 | 76.89 | 28.24 | 91.51 | 0.260 | |||
| 100 | 73.18 | 65.48 | 67.85 | 58.82 | 72.13 | 0.310 | |||
| 2500 | 500 | 80.93 | 80.04 | 74.14 | 92.27 | 67.82 | 0.680 | ||
| 250 | 79.23 | 63.96 | 63.28 | 66.50 | 61.42 | 0.280 | |||
| 100 | 74.64 | 60.33 | 63.47 | 48.70 | 71.97 | 0.210 | |||
| uLATs | 500 | 500 | 74.28 | 68.72 | 67.09 | 73.46 | 63.98 | 0.376 | |
| 250 | 69.60 | 61.87 | 57.30 | 93.21 | 30.54 | 0.305 | |||
| 100 | 73.15 | 64.61 | 60.96 | 81.27 | 47.95 | 0.310 | |||
| 2500 | 500 | 50.48 | 49.84 | 30.77 | 0.26 | 99.41 | −0.025 | ||
| 250 | 67.86 | 56.94 | 53.87 | 96.68 | 17.20 | 0.229 | |||
| 100 | 70.71 | 60.23 | 71.01 | 34.57 | 85.89 | 0.238 |
| Layer | Kernel Size (H, W, D) | Stride (H, W) | Activations 1 | |
|---|---|---|---|---|
| Unipolar EGMs, LATs | Bipolar EGMs | |||
| Input | - | - | 1250 × 20 × 1 | 1250 × 15 × 1 |
| Zero Padding 2D 1 | (37, 0, 0) | 1324 × 20 × 1 | 1324 × 15 × 1 | |
| Batch Normalization 1 | - | - | ||
| Dropout 1 | - | - | 1324 × 20 × 1 | 1324 × 15 × 1 |
| Conv2D 1 | (5, 23, 32) | (1, 1) | 1324 × 20 × 32 | 1324 × 15 × 32 |
| Batch Normalization 2 | - | - | 1324 × 20 × 32 | 1324 × 15 × 32 |
| LeakyReLU 1 | - | - | 1324 × 20 × 32 | 1324 × 15 × 32 |
| Max Pooling 2D 1 | (2, 2, 32) | (2, 1) | 662 × 19 × 32 | 662 × 14 × 32 |
| Dropout 2 | - | - | 662 × 19 × 32 | 662 × 14 × 32 |
| Conv2D 2 | (5, 23, 64) | (1, 1) | 662 × 19 × 64 | 662 × 14 × 64 |
| Batch Normalization 3 | - | - | 662 × 19 × 64 | 662 × 14 × 64 |
| LeakyReLU 2 | - | - | 662 × 19 × 64 | 662 × 14 × 64 |
| Max Pooling 2D 3 | (3, 3, 64) | (3, 3) | 220 × 6 × 64 | 220 × 4 × 64 |
| Dropout 3 | - | - | 220 × 6 × 64 | 220 × 4 × 64 |
| Conv2D 3 | (5, 23, 64) | (1, 1) | 220 × 6 × 64 | 220 × 4 × 64 |
| Batch Normalization 4 | - | - | 220 × 6 × 64 | 220 × 4 × 64 |
| Leaky ReLU 3 | - | - | 220 × 6 × 64 | 220 × 4 × 64 |
| Max Pooling 2D 3 | (4, 4, 64) | (4, 4) | 55 × 1 × 64 | 55 × 1 × 64 |
| Dropout 4 | - | - | 55 × 1 × 64 | 55 × 1 × 64 |
| Reshape 1 | - | - | 55 × 64 | 55 × 64 |
| GRU 1 | 32 units | - | 55 × 32 | 55 × 32 |
| GRU 2 | 32 units | - | 32 | 32 |
| Dropout 5 | - | - | 32 | 32 |
| Dense | - | - | 1 | 1 |
Publisher’s Note: MDPI stays neutral with regard to jurisdictional claims in published maps and institutional affiliations. |
© 2022 by the authors. Licensee MDPI, Basel, Switzerland. This article is an open access article distributed under the terms and conditions of the Creative Commons Attribution (CC BY) license (https://creativecommons.org/licenses/by/4.0/).
Share and Cite
Ríos-Muñoz, G.R.; Fernández-Avilés, F.; Arenal, Á. Convolutional Neural Networks for Mechanistic Driver Detection in Atrial Fibrillation. Int. J. Mol. Sci. 2022, 23, 4216. https://doi.org/10.3390/ijms23084216
Ríos-Muñoz GR, Fernández-Avilés F, Arenal Á. Convolutional Neural Networks for Mechanistic Driver Detection in Atrial Fibrillation. International Journal of Molecular Sciences. 2022; 23(8):4216. https://doi.org/10.3390/ijms23084216
Chicago/Turabian StyleRíos-Muñoz, Gonzalo Ricardo, Francisco Fernández-Avilés, and Ángel Arenal. 2022. "Convolutional Neural Networks for Mechanistic Driver Detection in Atrial Fibrillation" International Journal of Molecular Sciences 23, no. 8: 4216. https://doi.org/10.3390/ijms23084216
APA StyleRíos-Muñoz, G. R., Fernández-Avilés, F., & Arenal, Á. (2022). Convolutional Neural Networks for Mechanistic Driver Detection in Atrial Fibrillation. International Journal of Molecular Sciences, 23(8), 4216. https://doi.org/10.3390/ijms23084216