
A Leucyl-tRNA Synthetase Urzyme: Authenticity of tRNA Synthetase Catalytic Activities and Promiscuous Phosphorylation of Leucyl-5′AMP


Abstract
1. Introduction
- (i)
- Because we are ignorant of the stages by which ancestral active sites assimilated newer modules, we must use protein engineering to reconstruct ancestral forms.
- (ii)
- Urzymes are consequently inherently less stable than full-length counterparts because their construction eliminates substantial sources of stability.
- (iii)
- Exposure of extensive patches of hydrophobic residues complementary in structure to the deleted stabilizing mass renders urzymes less soluble, requiring solubilization as maltose-binding protein (MBP) fusions.
- (iv)
- Although transition-state stabilization is ~60% of that for full-length aaRS [7], urzyme catalysis is still 4–5 orders of magnitude weaker than full length aaRS, reducing experimental signal to noise.
- (v)
- Not knowing all requirements for activity contributes to poor reproducibility [14].
- (i)
- Purified P horikoshii LeuRS and LeuAC both retain near stoichiometric amounts of bound leucyl-5′AMP [20], complicating straightforward interpretation of the [leucine]-dependence of pyrophosphate exchange assays.
- (ii)
- LeuAC and MBP cannot be separated cleanly following TEV cleavage because the urzyme and MBP cleavage products aggregate.
- (iii)
- (iv)
- Use of [α32P] ATP to monitor all three nucleotides—ATP, ADP, and AMP—during amino acid activation by both LeuRS and LeuAC reveals significant production of the non-canonical nucleotide [32P] ADP, posing unexpected mechanistic puzzles.
2. Results
2.1. LeuAC Is a Novel Class I Urzyme Derived from a Large Class IA aaRS
2.1.1. The MBP-LeuAC Fusion Is Pure Enough to Exclude Contaminating Activities
2.1.2. TEV-Cleaved LeuAC Fusion Protein Remains Non-Covalently Bound to MBP
2.2. Both LeuRS and LeuAC Retain Tightly Bound Leucyl-5′ AMP
2.3. LeuAC Accelerates Amino Acid Activation
2.3.1. Single Turnover Kinetic Experiments Establish the Stoichiometry of Catalysts
2.3.2. TEV-Cleavage of the MBP Fusion Protein Enhances the First-Order Rate of ATP Consumption
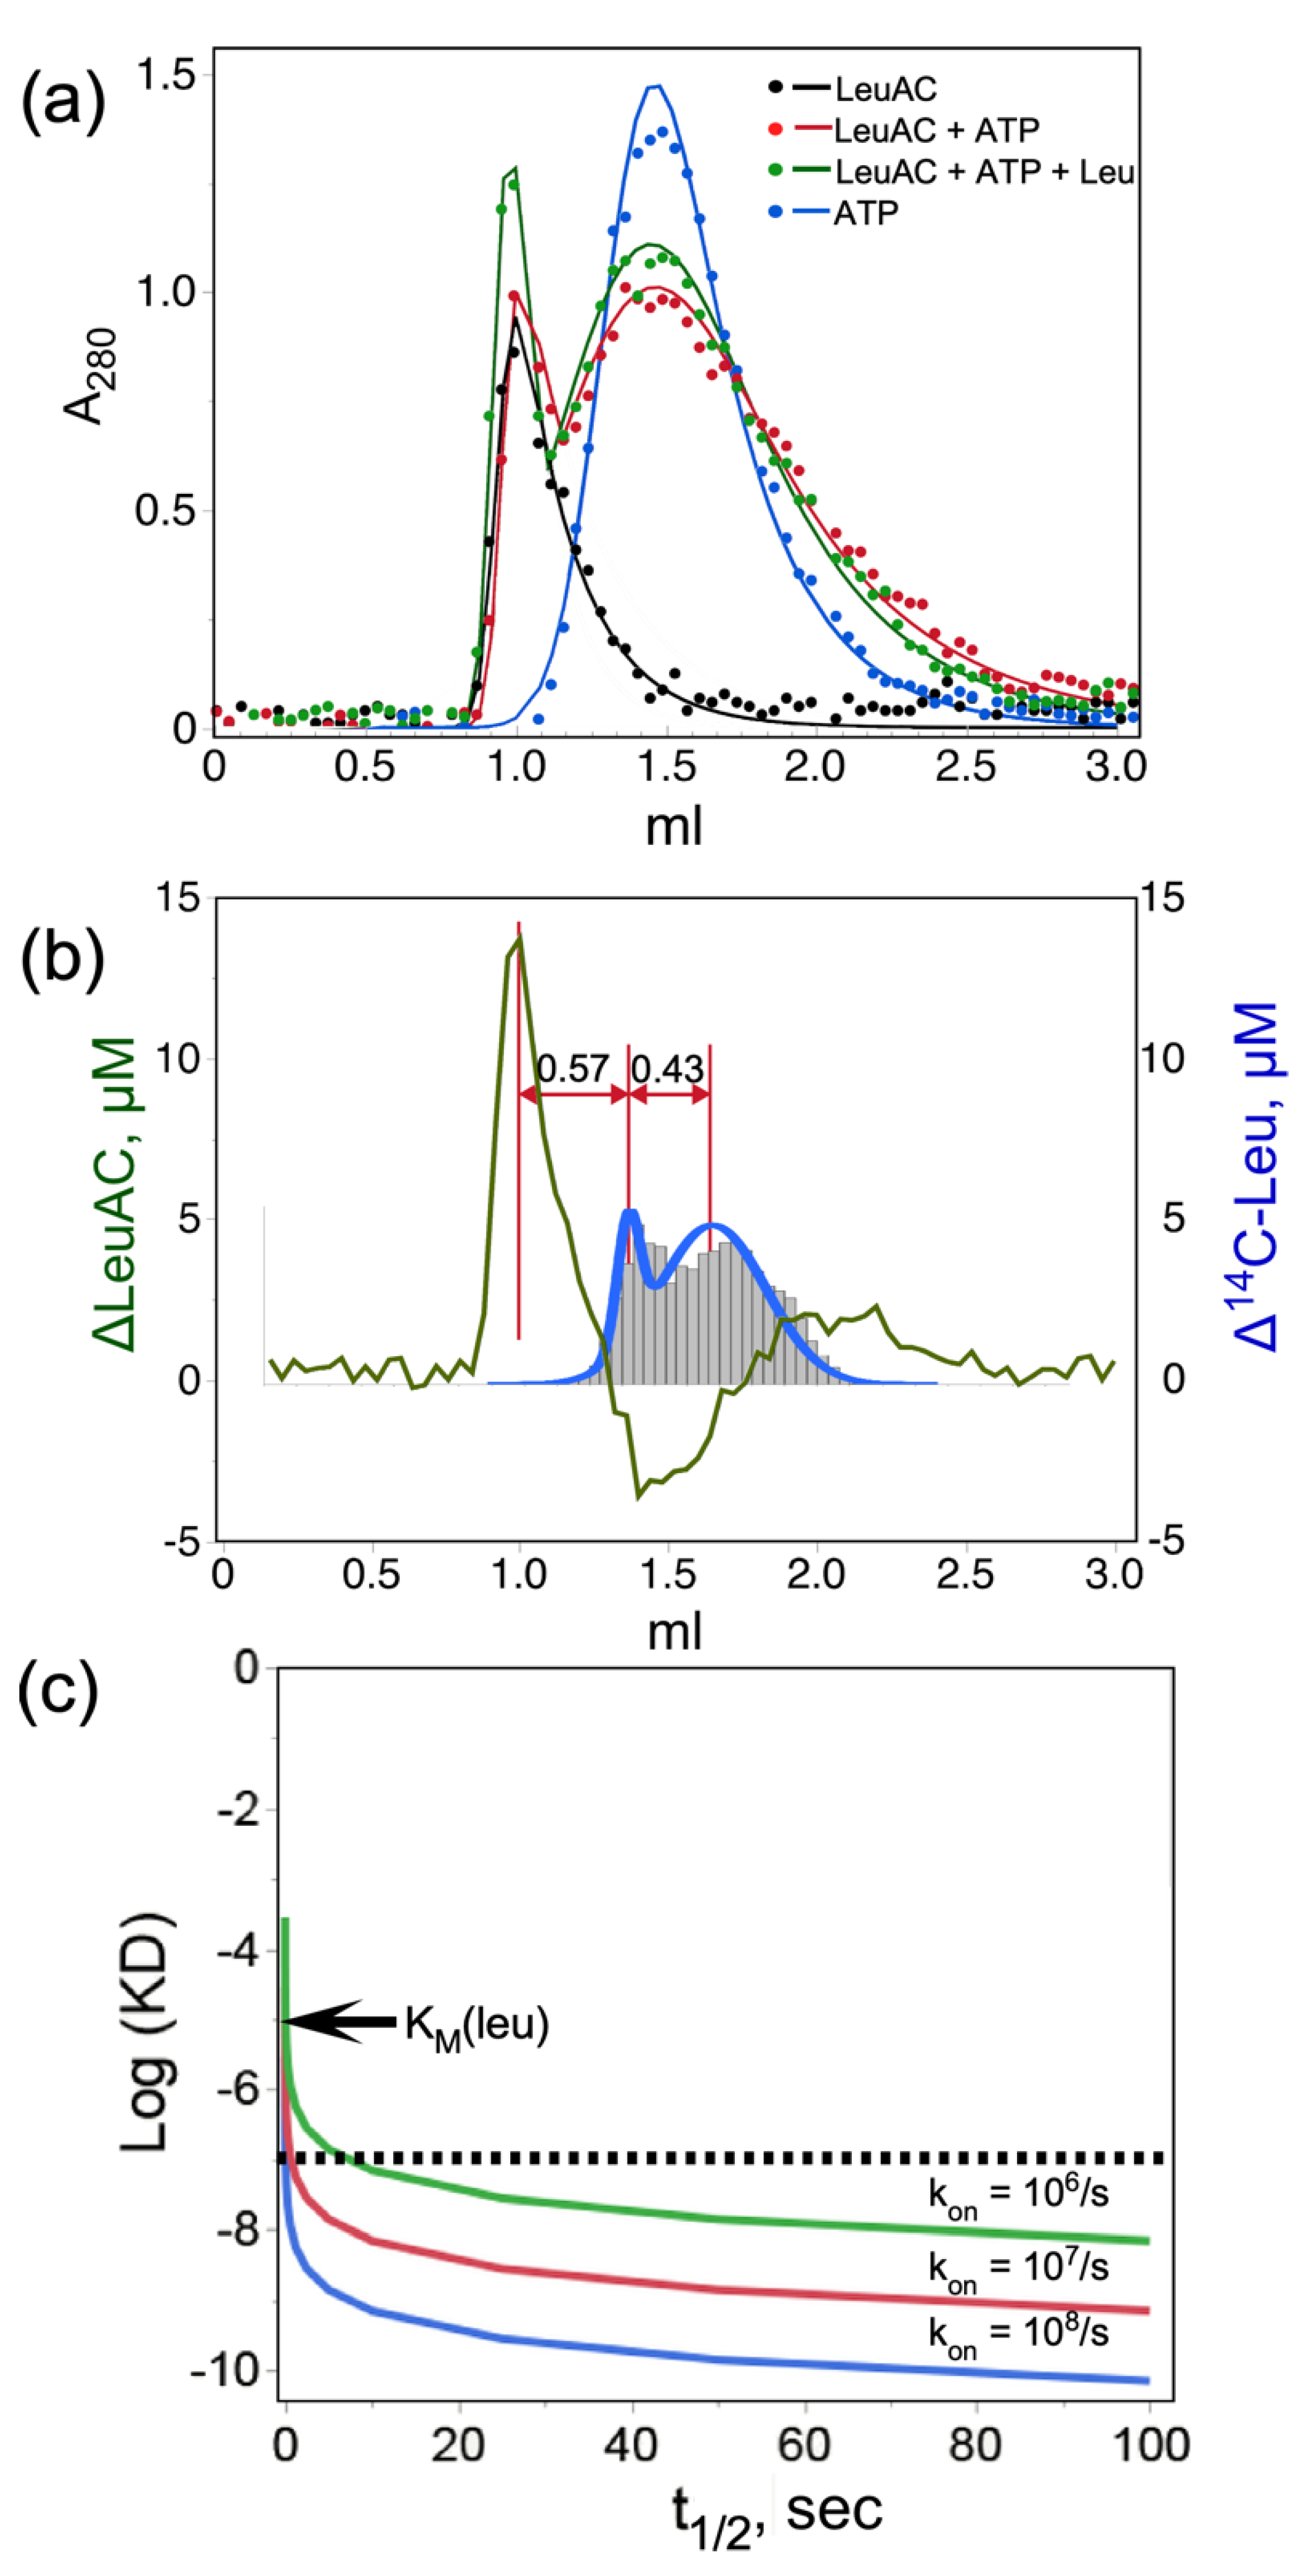
2.3.3. Mutual Perturbations by LeuAC and Substrates in Size Exclusion Chromatography Implicate a Significant Fraction of Active Protein
2.3.4. The LeuAC MBP Fusion Protein Catalyzes Pyrophosphate Exchange
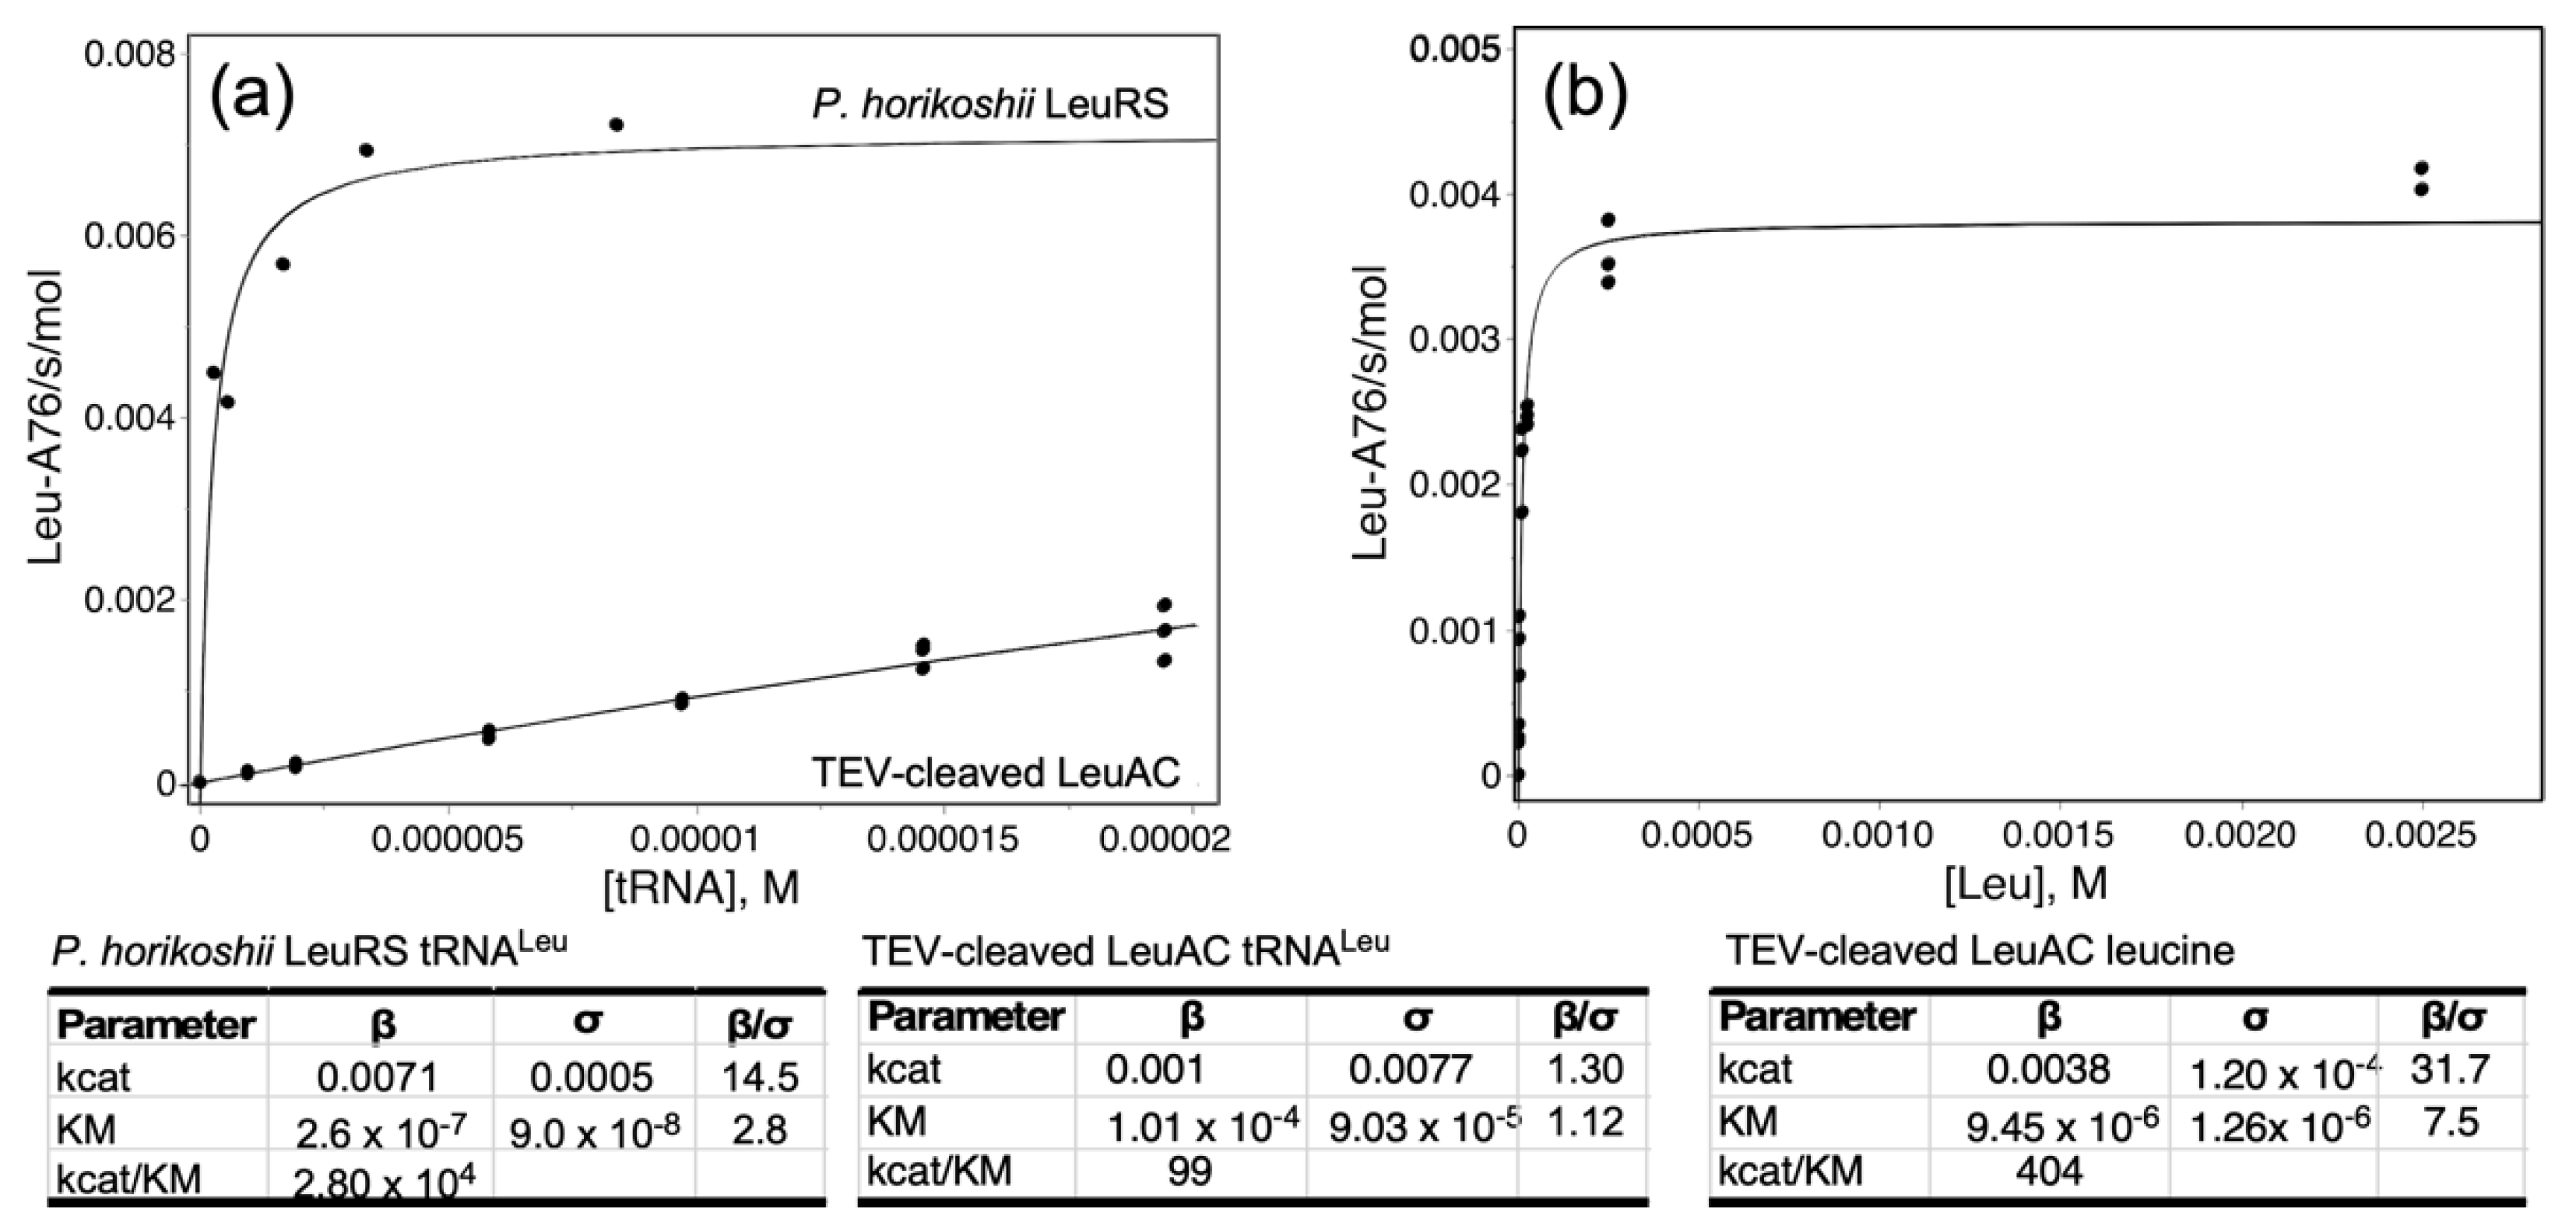
2.4. LeuRS, LeuAC MBP Fusion, and TEV-Cleaved LeuAC Catalyze tRNALeu Aminoacylation
2.5. LeuAC Michaelis–Menten Kinetic Parameters Distinguish Its Activity from That of LeuRS
2.6. Product Release Is Rate-Limiting for Both Amino ACID activation and tRNAleu Aminoacylation by LeuAC
2.7. Product Release Is Rate-Limiting for Both Amino Acid Activation and tRNAleu Aminoacylation by LeuAC
3. Discussion
3.1. LeuAC Is an Authentic Catalyst of Both Amino Acid Activation and tRNA Acylation
3.2. Near Quantitative Production of ADP Poses Novel Mechanistic Questions
3.3. Promiscuous ATP Binding Sites May Enable In Situ Phosphorylation of Leu-5′AMP

3.4. Urzyme Catalysis Arises Largely from Secondary-Structural Conformation
3.5. Realizing the Potential Utility of aaRS Urzymes Will Require More Thoughtful Re-Design
4. Materials and Methods
4.1. Expression and Purification of LeuRS and LeuAC
4.2. Nitrocellulose Filter Binding of the LeuRS/LeuAC Leucyl-Adenylate Complex
4.3. Size Exclusion Chromatography of the LeuAC Leucyl-Adenylate Complex
4.4. Pyrophosphate (PPi) Exchange Assays
4.5. Single Turnover Active-Site Titration Assays
4.6. tRNALeu Aminoacylation Assays
4.7. Data Processing and Statistical Analysis
4.8. Molecular Modeling
5. Conclusions
Supplementary Materials
Author Contributions
Funding
Data Availability Statement
Acknowledgments
Conflicts of Interest
References
- Carter, C.W., Jr. Cognition, Mechanism, and Evolutionary Relationships in Aminoacyl-tRNA Synthetases. Ann. Rev. Biochem. 1993, 62, 715–748. [Google Scholar] [CrossRef] [PubMed]
- Carter, C.W., Jr.; Wills, P.R. The Roots of Genetic Coding in Aminoacyl-tRNA Synthetase Duality. Annu. Rev. Biochem. 2021, 90, 349–373. [Google Scholar] [CrossRef] [PubMed]
- Carter, C.W., Jr. How did the proteome emerge from pre-biotic chemistry? In Pre-Biotic Chemistry and Life’s Origin; Fiore, M., Ed.; The Royal Society of Chemistry: London, UK, 2022. [Google Scholar]
- Wills, P.R.; Carter, C.W., Jr. Impedance matching and the choice between alternative pathways for the origin of genetic coding. Int. J. Mol. Sci. 2020, 21, 7392. [Google Scholar] [CrossRef] [PubMed]
- Carter, C.W., Jr. The Evolution of Genetic Coding. In Scientia; Science Diffusion, Ltd.: Bristol, UK, 2019. [Google Scholar]
- Carter, C.W., Jr.; Popinga, A.; Bouckaert, R.; Wills, P.R. Multidimensional Phylogenetic Metrics Identify Class I Aminoacyl-tRNA Synthetase Evolutionary Mosaicity and Inter-modular Coupling. Int. J. Mol. Sci. 2022, 23, 1520. [Google Scholar] [CrossRef] [PubMed]
- Li, L.; Francklyn, C.; Carter, C.W., Jr. Aminoacylating Urzymes Challenge the RNA World Hypothesis. J. Biol. Chem. 2013, 288, 26856–26863. [Google Scholar] [CrossRef]
- Li, L.; Weinreb, V.; Francklyn, C.; Carter, C.W., Jr. Histidyl-tRNA Synthetase Urzymes: Class I and II Aminoacyl-tRNA Synthetase Urzymes have Comparable Catalytic Activities for Cognate Amino Acid Activation. J. Biol. Chem. 2011, 286, 10387–10395. [Google Scholar] [CrossRef]
- Pham, Y.; Kuhlman, B.; Butterfoss, G.L.; Hu, H.; Weinreb, V.; Carter, C.W., Jr. Tryptophanyl-tRNA synthetase Urzyme: A model to recapitulate molecular evolution and investigate intramolecular complementation. J. Biol. Chem. 2010, 285, 38590–38601. [Google Scholar] [CrossRef]
- Pham, Y.; Li, L.; Kim, A.; Erdogan, O.; Weinreb, V.; Butterfoss, G.; Kuhlman, B.; Carter, C.W., Jr. A Minimal TrpRS Catalytic Domain Supports Sense/Antisense Ancestry of Class I and II Aminoacyl-tRNA Synthetases. Mol. Cell 2007, 25, 851–862. [Google Scholar] [CrossRef]
- Rodin, S.N.; Ohno, S. Two Types of Aminoacyl-tRNA Synthetases Could be Originally Encoded by Complementary Strands of the Same Nucleic Acid. Orig. Life Evol. Biosph. 1995, 25, 565–589. [Google Scholar] [CrossRef]
- Martinez, L.; Jimenez-Rodriguez, M.; Gonzalez-Rivera, K.; Williams, T.; Li, L.; Weinreb, V.; Chandrasekaran, S.N.; Collier, M.; Ambroggio, X.; Kuhlman, B.; et al. Functional Class I and II Amino Acid Activating Enzymes Can Be Coded by Opposite Strands of the Same Gene. J. Biol. Chem. 2015, 290, 19710–19725. [Google Scholar] [CrossRef]
- Carter, C.W., Jr. Urzymology: Experimental Access to a Key Transition in the Appearance of Enzymes. J. Biol. Chem. 2014, 289, 30213–30220. [Google Scholar] [CrossRef] [PubMed]
- Carter, C.W., Jr.; Ries-Kautt, M. Improving Marginal Crystals. In Crystallographic Methods; Doublié, S., Ed.; Humana Press: Totawa, NJ, USA, 2006; pp. 153–174. [Google Scholar]
- Onodera, K.; Suganuma, N.; Takano, H.; Sugita, Y.; Shoji, T.; Minobe, A.; Yamaki, N.; Otsuka, R.; Mutsuro-Aoki, H.; Umehara, T.; et al. Amino acid activation analysis of primitive aminoacyl-tRNA synthetases encoded by both strands of a single gene using the malachite green assay. BioSystems 2021, 208, 104481. [Google Scholar] [CrossRef] [PubMed]
- Fersht, A.R.; Ashford, J.S.; Bruton, C.J.; Jakes, R.; Koch, G.L.E.; Hartley, B.S. Active Site Titration and Aminoacyl Adenylate Binding Stoichiometry of Amionacyl-tRNA Synthetases. Biochemistry 1975, 14, 1–4. [Google Scholar] [CrossRef] [PubMed]
- Carter, C.W., Jr.; Wills, P.R. Experimental Solutions to Problems Defining the Origin of Codon-Directed Protein Synthesis. BioSystems 2019, 183, 103979. [Google Scholar] [CrossRef] [PubMed]
- Carter, C.W., Jr.; Wills, P.R. Class I and II aminoacyl-tRNA synthetase tRNA groove discrimination created the first synthetase•tRNA cognate pairs and was therefore essential to the origin of genetic coding. IUBMB Life 2019, 71, 1088–1098. [Google Scholar] [CrossRef] [PubMed]
- Carter, C.W., Jr.; Wills, P.R. Hierarchical groove discrimination by Class I and II aminoacyl-tRNA synthetases reveals a palimpsest of the operational RNA code in the tRNA acceptor-stem bases. Nucleic Acids Res. 2018, 46, 9667–9683. [Google Scholar] [CrossRef]
- Cvetesic, N.; Perona, J.J.; Gruic-Sovulj, I. Kinetic Partitioning between Synthetic and Editing Pathways in Class I Aminoacyl-tRNA Synthetases Occurs at Both Pre-transfer and Post-transfer Hydrolytic Steps. J. Biol. Chem. 2012, 287, 25381–25394. [Google Scholar] [CrossRef]
- Boniecki, M.T.; Vu, M.T.; Betha, A.K.; Martinis, S.A. CP1-dependent partitioning of pretransfer and posttransfer editing in leucyl-tRNA synthetase. Proc. Nat. Acad. Sci. USA 2008, 105, 19223–19228. [Google Scholar] [CrossRef]
- Vu, M.T.; Martinis, S.A. A Unique Insert of Leucyl-tRNA Synthetase Is Required for Aminoacylation and Not Amino Acid Editing. Biochemistry 2007, 46, 5170–5176. [Google Scholar] [CrossRef][Green Version]
- Lincecum, T.L., Jr.; Tukalo, M.; Yaremchuk, A.; Mursinna, R.S.; Williams, A.M.; Sproat, B.S.; Van Den Eynde, W.; Link, A.; Calenbergh, S.V.; Grotli, M.; et al. Structural and Mechanistic Basis of Pre- and Post-Transfer Editing by Leucyl-tRNA Synthetase. Mol. Cell 2003, 11, 951–963. [Google Scholar] [CrossRef]
- Prætorius-Ibba, M.; Rogers, R.; Samson, T.E.; Kelman, Z.; Ibba, M. Association between Archaeal Prolyl- and Leucyl-tRNA Synthetases Enhances tRNAPro Aminoacylation. J. Biol. Chem. 2005, 280, 26099–26104. [Google Scholar] [CrossRef] [PubMed]
- Rapaport, E.; Remy, P.; Kleinkauf, H.; Vater, J.; Zamecnik, P.C. Aminoacyl-tRNA synthetases catalyze AMP–>ADP–>ATP exchange reactions, indicating labile covalent enzyme-amino acid intermediates. Proc. Nati. Acad. Sci. USA 1987, 84, 7891–7895. [Google Scholar] [CrossRef] [PubMed]
- Carter, C.W., Jr. What RNA World? Why a Peptide/RNA Partnership Merits Renewed Experimental Attention. Life 2015, 5, 294–320. [Google Scholar] [CrossRef] [PubMed]
- Carter, C.W., Jr.; Li, L.; Weinreb, V.; Collier, M.; Gonzales-Rivera, K.; Jimenez-Rodriguez, M.; Erdogan, O.; Chandrasekharan, S.N. The Rodin-Ohno Hypothesis That Two Enzyme Superfamilies Descended from One Ancestral Gene: An Unlikely Scenario for the Origins of Translation That Will Not Be Dismissed. Biol. Direct 2014, 9, 11. [Google Scholar] [CrossRef] [PubMed]
- Jacak, R.J.; Leaver-Fay, A.T.; Kuhlman, B. Computational protein design with explicit consideration of surface hydrophobic patches. Proteins 2012, 80, 825–838. [Google Scholar] [CrossRef] [PubMed]
- Praetorius-Ibba, M.; Stange-Thomann, N.; Kitabatake, M.; Ali, K.; Soll, I.; Carter, C.W., Jr.; Ibba, M.; Soll, D. Ancient adaptation of the active site of tryptophanyl-tRNA synthetase for tryptophan binding. Biochemistry 2000, 39, 13136–13143. [Google Scholar] [CrossRef]
- Phillips, M.L.; White, R.L. Dependence of Chromatogram Peak Areas Obtained by Curve-Fitting on the Choice of Peak Shape Function. J. Chromatogr. Sci. 1997, 35, 75–81. [Google Scholar] [CrossRef]
- Berger, G.; Girault, G. Macromolecule–ligand binding studied by the Hummel and Dreyer method: Current state of the methodology. J. Chromatogr. B 2003, 797, 51–61. [Google Scholar] [CrossRef]
- Zeeberg, B.; Caplow, M. Determination of Free and Bound Microtubular Protein and Guanine Nucleotide under Equilibrium Conditions. Biochemistry 1979, 18, 3880–3885. [Google Scholar] [CrossRef]
- Sobotta, J.; Geisberger, T.; Moosmann, C.; Scheidler, C.M.; Eisenreich, W.; Wächtershäuser, G.N.; Huber, C. A Possible Primordial Acetyleno/Carboxydotrophic Core Metabolism. Life 2020, 10, 35. [Google Scholar] [CrossRef]
- Yan, W.; Ye, Q.; Tan, M.G.; Chen, X.; Eriani, G.; Wang, E.-D. Modulation of Aminoacylation and Editing Properties of Leucyl-tRNA Synthetase by a Conserved Structural Module. J. Biol. Chem. 2015, 290, 12256–12267. [Google Scholar] [CrossRef] [PubMed]
- ZHOU, X.-L.; WANG, M.; TAN, M.G.; HUANG, Q.; ERIANI, G.; WANG, E.-D. Functional characterization of leucine-specific domain 1 from eukaryal and archaeal leucyl-tRNA synthetases. Biochem. J. 2010, 429, 505–513. [Google Scholar] [CrossRef] [PubMed]
- Hopfield, J.J.; Yamane, T.; Yue, V.; Coutts, S.M. Direct Experimetnal Evidence for Kinetic Proofreading in Amino “Acylation of tRNA Ile”. Proc. Natl. Acad. Sci. USA 1976, 73, 1164–1168. [Google Scholar] [CrossRef] [PubMed]
- Kothe, M.; Purcarea, C.; Guy, H.I.; Evans, D.R.; Powers-Lee, S.G. Direct demonstration of carbamoyl phosphate formation on the C-terminal domain of carbamoyl phosphate synthetase. Protein Sci. 2005, 14, 37–44. [Google Scholar] [CrossRef] [PubMed]
- Jencks, W.P. Coenzyme A Transferases. In The Enzymes; Boyer, P.D., Ed.; Academic Press: New York, NY, USA, 1973; Volume 9, pp. 483–496. [Google Scholar]
- Dimroth, P.; Buckel, W.; Loyal, R.; Eggerer, H. Isolation and Function of the Subunits of Citramalate Lyase and Formation of Hybrids with the Subunits of Citrate Lyase. Eur. J. Biochem. 1977, 80, 469–477. [Google Scholar] [CrossRef]
- Wolfgang Buckel, Acetic Anhydride: An Intermediate Analogue in the Acyl-Exchange Reaction of Citramalate Lyase. Eur. J. Biochem. 1976, 64, 263–267. [CrossRef]
- Wolfenden, R.; Williams, R. Solvent Water and the Biological Group-Transfer Potential of Phosphoric and Carboxylic Anhydrides. J. Am. Chem. Soc. 1985, 107, 4345–4346. [Google Scholar] [CrossRef]
- Liao, J.-C.; Sun, S.; Chandler, D.; Oster, G. The conformational states of Mg ATP in water. Eur. Biophys. J. 2004, 33, 29–37. [Google Scholar] [CrossRef]
- Kobayashi, E.; Yura, K.; Nagai, Y. Distinct Conformation of ATP Molecule in Solution and on Protein. Biophysics 2013, 9, 1–12. [Google Scholar] [CrossRef][Green Version]
- Pettersen, E.F.; Goddard, T.D.; Huang, C.C.; Couch, G.S.; Greenblatt, D.M.; Meng, E.C.; Ferrin, T.E. UCSF Chimera—A visualization system for exploratory research and analysis. J. Comput. Chem. 2004, 25, 1605–1612. [Google Scholar] [CrossRef]
- Weinreb, V.; Li, L.; Chandrasekaran, S.N.; Koehl, P.; Delarue, M.; Carter, C.W., Jr. Enhanced Amino Acid Selection in Fully-Evolved Tryptophanyl-tRNA Synthetase, Relative to its Urzyme, Requires Domain Movement Sensed by the D1 Switch, a Remote, Dynamic Packing Motif. J. Biol. Chem. 2014, 289, 4367–4376. [Google Scholar] [CrossRef] [PubMed]
- Li, L.; Carter, C.W., Jr. Full Implementation of the Genetic Code by Tryptophanyl-tRNA Synthetase Requires Intermodular Coupling. J. Biol. Chem. 2013, 288, 34736–34745. [Google Scholar] [CrossRef] [PubMed]
- Liu, Y.; Kuhlman, B. RosettaDesign server for protein design. Nucleic Acids Res. 2006, 34, 235–238. [Google Scholar] [CrossRef] [PubMed]
- Sapienza, P.J.; Li, L.; Williams, T.; Lee, A.L.; Carter, C.W., Jr. An Ancestral Tryptophanyl-tRNA Synthetase Precursor Achieves High Catalytic Rate Enhancement without Ordered Ground-State Tertiary Structures. ACS Chem. Biol. 2016, 11, 1661–1668. [Google Scholar] [CrossRef]
- Kuhlman, B.; Bradley, P. Advances in protein structure prediction and design. Nat. Rev. Mol. Cell Biol. 2019, 20, 681–697. [Google Scholar] [CrossRef]
- Parks, T.D.; Leuther, K.K.; Howard, E.D.; Johnston, S.A.; Dougherty, W. Release of proteins and peptides from fusion proteins using a recombinant plant virus proteinase. Anal. Biochem. 1994, 216, 413–417. [Google Scholar] [CrossRef]
- Francklyn, C.S.; First, E.A.; Perona, J.J.; Hou, Y.-M. Methods for kinetic and thermodynamic analysis of aminoacyl-tRNA synthetases. Methods 2008, 44, 100–118. [Google Scholar] [CrossRef]
- Johnson, K.A. New standards for collecting and fitting steady state kinetic data. Beilstein J. Org. Chem. 2019, 15, 16–29. [Google Scholar] [CrossRef]
- CCP4, The CCP4 Suite: Programs for Protein Crystallography. Acta Cryst. 1994, D50, 760–763.
- Pymol: The PyMOL Molecular Graphics System, Schrödinger, LLC. Available online: https://pymolwiki.org/index.php/MAC_Install#Open-Source_PyMOL (accessed on 15 July 2021).
- Hu, H.; Elstner, M.; Hermans, J. Comparison of a QM/MM force field and molecular mechanics force fields in simulations of alanine and glycine “dipeptides” (Ace-Ala-Nme and Ace-Gly-Nme) in water in relation to the problem of modeling the unfolded peptide backbone in solution. Proteins 2003, 50, 451–463. [Google Scholar] [CrossRef]
- MacKerell, A.D.; Bashford, D.; Bellott, M.; Dunbrack, R.L.; Evanseck, J.D.; Field, M.J.; Fischer, S.; Gao, J.; Guo, H.; Ha, S.; et al. All-atom empirical potential for molecular modeling and dynamics studies of proteins. J. Phys. Chem. B 1998, 102, 3586–3616. [Google Scholar] [CrossRef] [PubMed]
- Still, W.C.; Tempczyk, A.; Hawley, R.C.; Hendrickson, T. Semianalytical treatment of solvation for molecular mechanics and dynamics. J. Am. Chem. Soc. 1990, 112, 6127. [Google Scholar] [CrossRef]
- Carter, C.W., Jr.; Wolfenden, R. Acceptor-stem and anticodon bases embed amino acid chemistry into tRNA. RNA Biol. 2016, 13, 145–151. [Google Scholar] [CrossRef] [PubMed]
- Carter, C.W., Jr.; Wolfenden, R. tRNA Acceptor-Stem and Anticodon Bases Form Independent Codes Related to Protein Folding. Proc. Nat. Acad. Sci. USA 2015, 112, 7489–7494. [Google Scholar] [CrossRef]
- Wolfenden, R.; Lewis, C.A.; Yuan, Y.; Carter, C.W., Jr. Temperature dependence of amino acid hydrophobicities. Proc. Nat. Acad. Sci. USA 2015, 112, 7484–7488. [Google Scholar] [CrossRef]


| Sample | ATP | ADP | AMP | TEV | kchem | ΔG‡ (kchem) | kcat | ΔG‡ (kcat) | C | A |
|---|---|---|---|---|---|---|---|---|---|---|
| MBP_LeuAC2 | 1 | 0 | 0 | 0 | 0.0017 | 3.79 | 2.7 × 10⁻⁵ | 6.24 | 0.6 | 0.2 |
| MBP_LeuAC2, LSA | 1 | 0 | 0 | 0 | 0.0017 | 3.77 | 2.2 × 10⁻⁵ | 6.35 | 0.49 | 0.3 |
| MBP_LeuAC2, APQ | 1 | 0 | 0 | 0 | 0.0018 | 3.74 | 1.7 × 10⁻⁵ | 6.52 | 0.48 | 0.3 |
| MBP_LeuAC2 | 0 | 1 | 0 | 0 | 0.0015 | 3.86 | 2.3 × 10⁻⁵ | 6.33 | 0.37 | 0.2 |
| MBP_LeuAC2, Vanadate | 0 | 1 | 0 | 0 | 0.0015 | 3.84 | 1.2 × 10⁻⁵ | 6.73 | 0.5 | 0.3 |
| MBP_LeuAC2, LSA | 0 | 1 | 0 | 0 | 0.0018 | 3.75 | 2.0 × 10⁻⁵ | 6.41 | 0.48 | 0.3 |
| MBP_LeuAC2, APQ | 0 | 1 | 0 | 0 | 0.0017 | 3.78 | 1.4 x10⁻⁵ | 6.63 | 0.5 | 0.3 |
| MBP_LeuAC2 | 0 | 0 | 1 | 0 | 0.0027 | 3.51 | 8.2 × 10⁻⁷ | 8.29 | 0.04 | 0 |
| MBP_LeuAC2_Vanadate | 0 | 0 | 1 | 0 | 0.0034 | 3.36 | 2.8 × 10⁻⁶ | 7.57 | 0.03 | 0 |
| MBP_LeuAC1 | 1 | 0 | 0 | 0 | 0.0013 | 3.93 | 3.6 × 10⁻⁶ | 7.43 | 0.8 | 0.2 |
| LeuAC1_Tev_cleaved | 1 | 0 | 0 | 1 | 0.0033 | 3.39 | 0.00002 | 6.41 | 0.27 | 0.6 |
| LeuAC1_Tev_cleaved | 1 | 0 | 0 | 1 | 0.0032 | 3.40 | 2.1 × 10⁻⁵ | 6.38 | 0.26 | 0.6 |
| LeuAC1_Tev_cleaved | 0 | 1 | 0 | 1 | 0.0031 | 3.42 | 3.2 × 10⁻⁶ | 7.50 | 0.71 | 0.6 |
| LeuAC1_Tev_cleaved | 0 | 1 | 0 | 1 | 0.0032 | 3.41 | 2.1 × 10⁻⁶ | 7.74 | 0.69 | 0.6 |
| LeuAC1_Tev_cleaved | 0 | 0 | 1 | 1 | 0.0049 | 3.14 | 1.6 × 10⁻⁵ | 6.54 | 0.04 | 0 |
| LeuAC1_Tev_cleaved | 0 | 0 | 1 | 1 | 0.0077 | 2.88 | 1.9 × 10⁻⁵ | 6.43 | 0.03 | 0 |
| LeuAC1_Tev-cleaved, Ile | 1 | 0 | 0 | 1 | 0.0038 | 3.30 | 0.00003 | 6.16 | 0.36 | 0.5 |
| LeuAC1_Tev-cleaved, no aa | 1 | 0 | 0 | 1 | 0.0037 | 3.31 | 0.00003 | 6.16 | 0.34 | 0.5 |
| LeuAC1_Tev-cleaved, Ile | 0 | 1 | 0 | 1 | 0.0039 | 3.28 | 0.00001 | 7.06 | 0.6 | 0.5 |
| LeuAC1_Tev-cleaved, no aa | 0 | 1 | 0 | 1 | 0.0039 | 3.29 | 0.00001 | 6.88 | 0.62 | 0.5 |
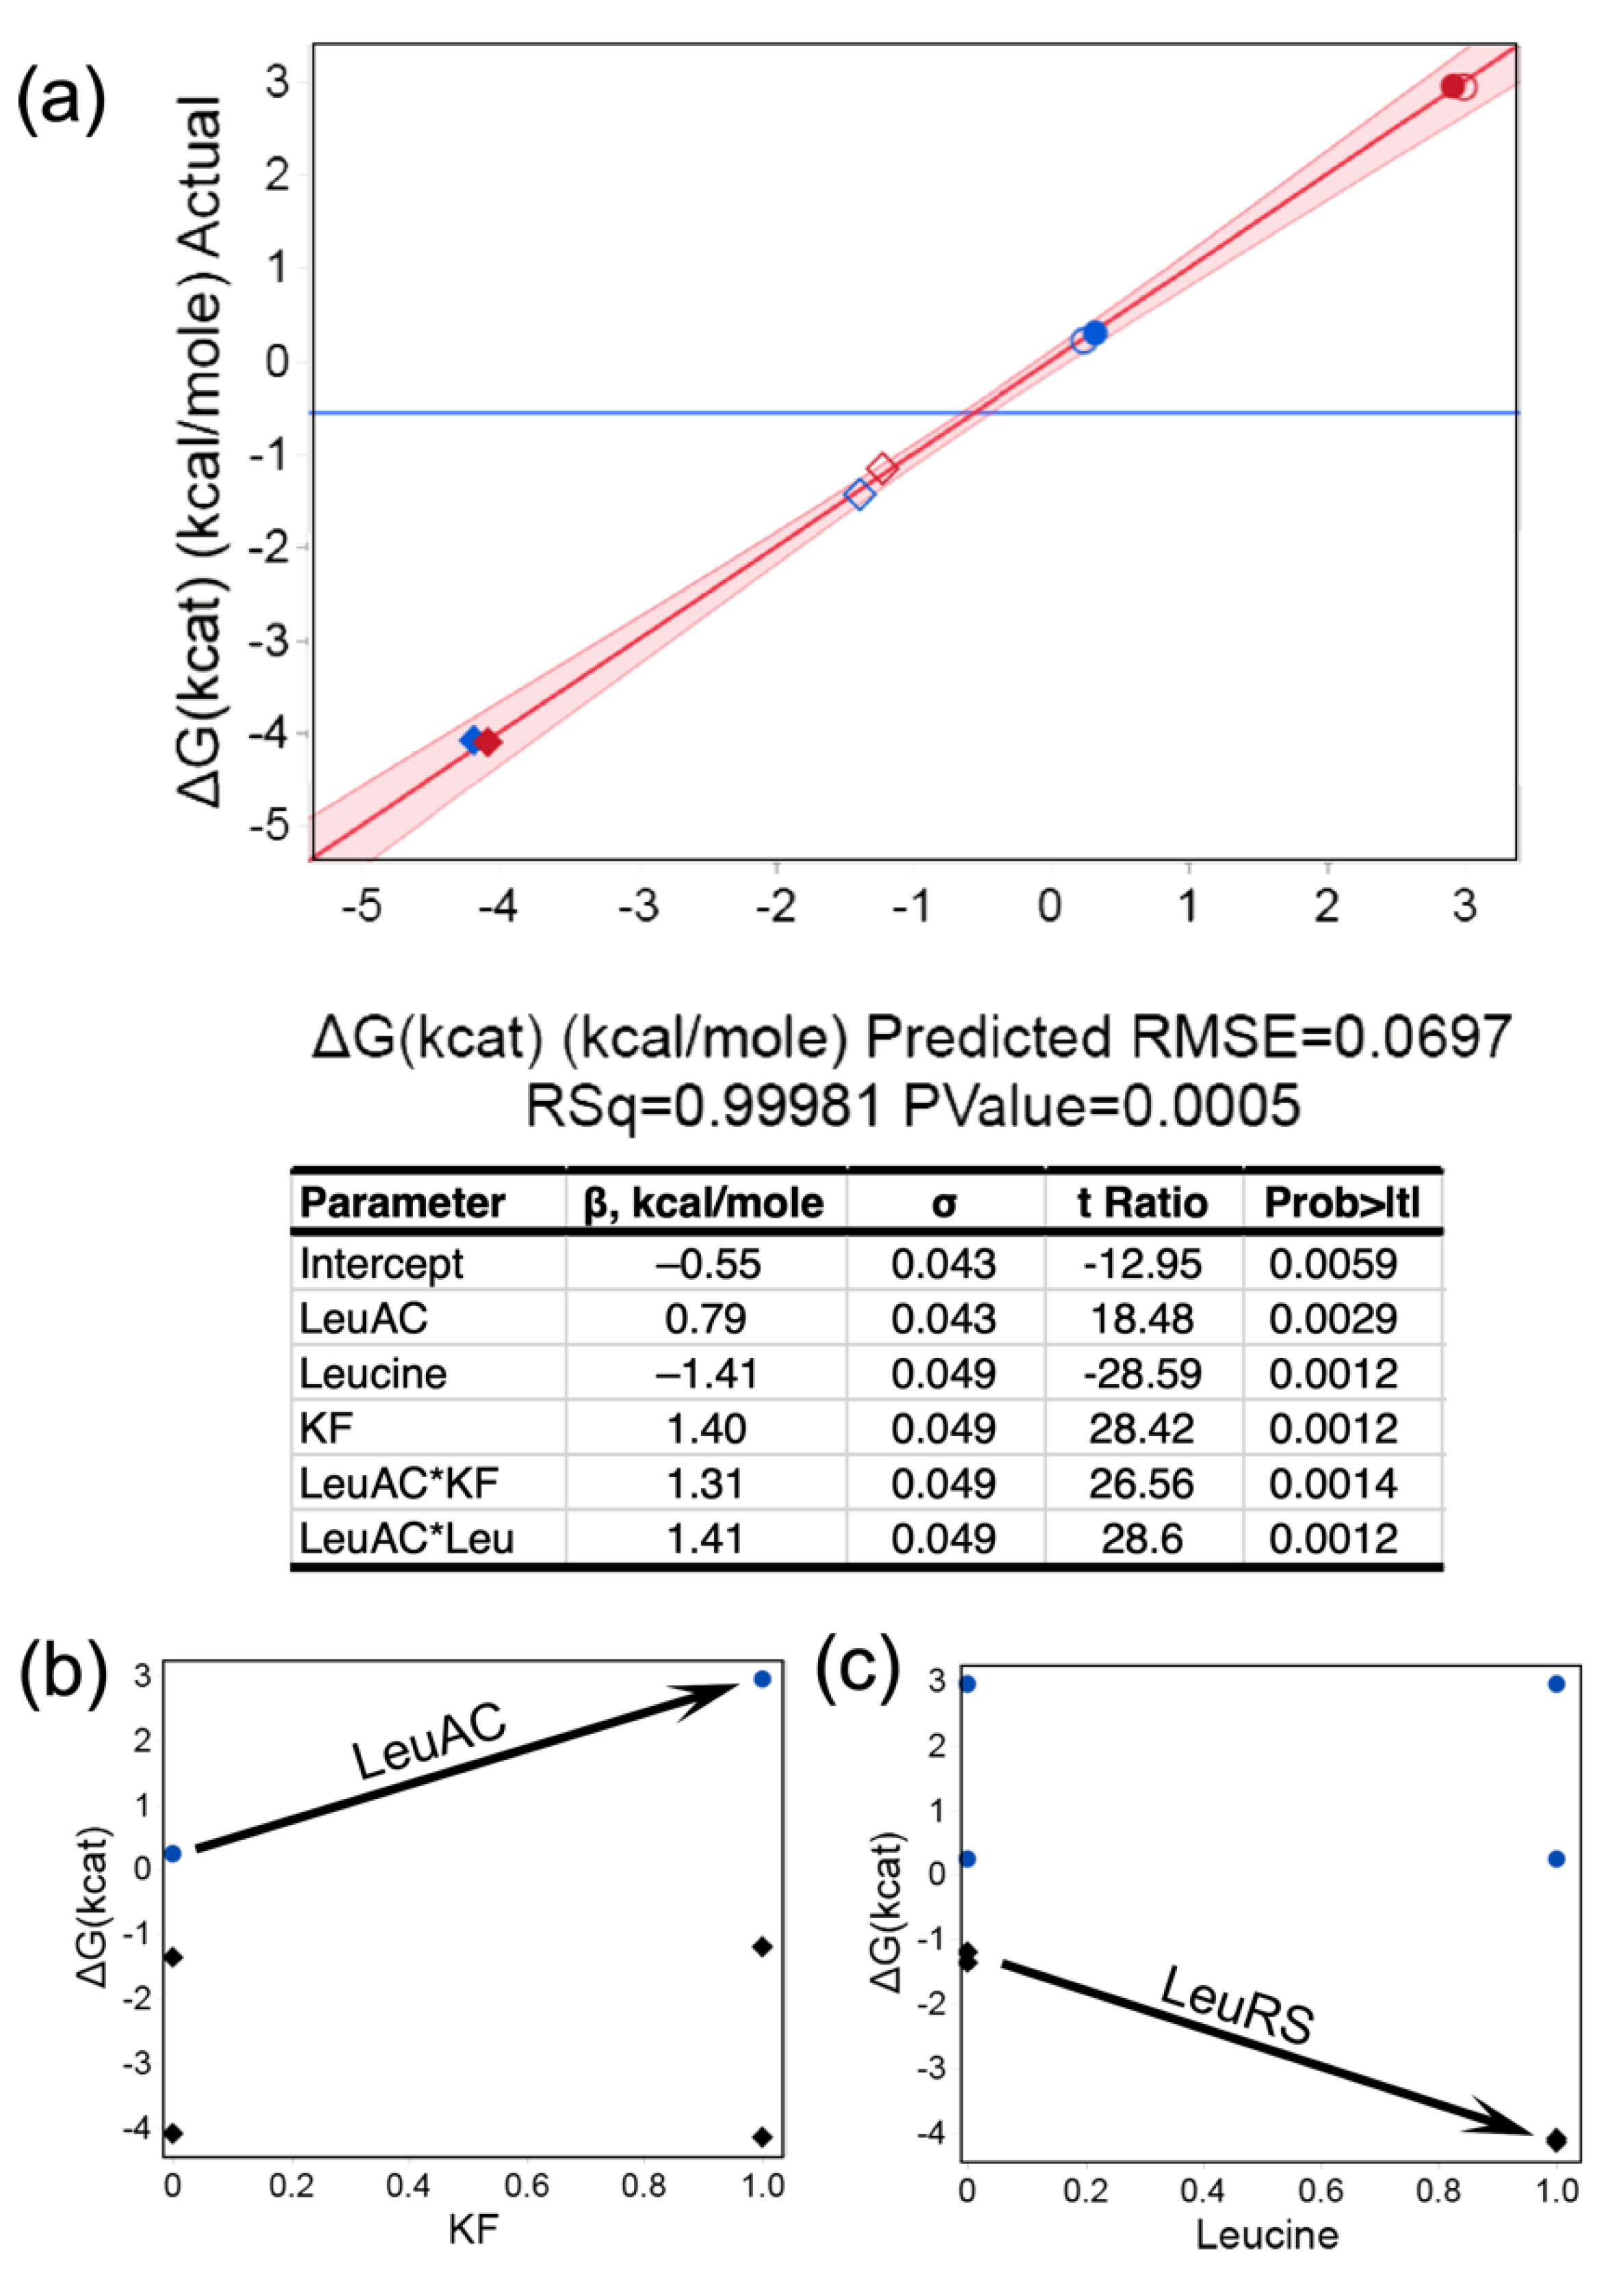
| EXPT | LeuAC | Leucine | KF | [Enz], M | Δ[ATP]/Time | kcat (/s) | ΔG‡ (kcat) (Kcal/Mole) |
|---|---|---|---|---|---|---|---|
| 1 | 1 | 0 | 0 | 3.00 × 10⁻⁶ | 2.02 × 10⁻⁶ | 6.7 × 10⁻¹ | 0.234 |
| 2 | 1 | 0 | 1 | 3.00 × 10⁻⁶ | 2.06 × 10⁻⁸ | 6.9 × 10⁻³ | 2.949 |
| 3 | 1 | 1 | 0 | 3.00 × 10⁻⁶ | 2.00 × 10⁻⁶ | 6.7 × 10⁻¹ | 0.239 |
| 4 | 1 | 1 | 1 | 3.00 × 10⁻⁶ | 2.07 × 10⁻⁴ | 6.9 × 10⁻³ | 2.945 |
| 5 | −1 | 0 | 0 | 3.00 × 10⁻⁶ | 3.15 × 10⁻⁶ | 10.0 | −1.391 |
| 6 | −1 | 0 | 1 | 3.00 × 10⁻⁶ | 2.28 × 10⁻⁶ | 7.6 | −1.201 |
| 7 | −1 | 1 | 0 | 3.00 × 10⁻⁶ | 3.12 × 10⁻⁴ | 1.000 | −4.112 |
| 8 | −1 | 1 | 1 | 3.00 × 10⁻⁶ | 3.15 × 10⁻⁴ | 1.100 | −4.119 |
| Term | β. Kcal/Mole | σ | t Ratio | Prob>|t| |
|---|---|---|---|---|
| Activation | ||||
| Intercept | 2.60 | 0.10 | 25 | <0.0001 |
| A | 4.05 | 0.31 | 13 | 0.0002 |
| KMSKS | −0.50 | 0.03 | −18 | 0.00006 |
| TEV | −0.56 | 0.04 | −13 | 0.0002 |
| (KMSKS) × (TEV) | −1.72 | 0.09 | −19 | 0.00005 |
| Acylation | ||||
| Intercept | 5.11 | 0.05 | 103.7 | <0.0001 |
| KMSKS | −0.29 | 0.06 | −4.7 | 0.003 |
| Activation | All LeuRS | Ph LeuRS | Ec LeuRS | All LeuAC | MBP_fusion | TEV-Cleaved |
|---|---|---|---|---|---|---|
| <ΔG‡kchem/kcat> | −3.37 | −3.81 | −3.20 | −2.45 | −2.26 | −2.60 |
| Stdev | 0.39 | 0.31 | 0.26 | 0.42 | 0.42 | 0.39 |
| n | 7 | 2 | 5 | 13 | 6 | 7 |
| Aminoacylation | ||||||
| <ΔG‡kchemkcat> | −2.81 | −2.27 | −1.97 | −2.57 | ||
| Stdev | 0.71 | 0.77 | 0.69 | 0.82 | ||
| n | 20 | 8 | 4 | 4 | ||
Publisher’s Note: MDPI stays neutral with regard to jurisdictional claims in published maps and institutional affiliations. |
© 2022 by the authors. Licensee MDPI, Basel, Switzerland. This article is an open access article distributed under the terms and conditions of the Creative Commons Attribution (CC BY) license (https://creativecommons.org/licenses/by/4.0/).
Share and Cite
Hobson, J.J.; Li, Z.; Hu, H.; Carter, C.W., Jr. A Leucyl-tRNA Synthetase Urzyme: Authenticity of tRNA Synthetase Catalytic Activities and Promiscuous Phosphorylation of Leucyl-5′AMP. Int. J. Mol. Sci. 2022, 23, 4229. https://doi.org/10.3390/ijms23084229
Hobson JJ, Li Z, Hu H, Carter CW Jr. A Leucyl-tRNA Synthetase Urzyme: Authenticity of tRNA Synthetase Catalytic Activities and Promiscuous Phosphorylation of Leucyl-5′AMP. International Journal of Molecular Sciences. 2022; 23(8):4229. https://doi.org/10.3390/ijms23084229
Chicago/Turabian StyleHobson, Jessica J., Zhijie Li, Hao Hu, and Charles W. Carter, Jr. 2022. "A Leucyl-tRNA Synthetase Urzyme: Authenticity of tRNA Synthetase Catalytic Activities and Promiscuous Phosphorylation of Leucyl-5′AMP" International Journal of Molecular Sciences 23, no. 8: 4229. https://doi.org/10.3390/ijms23084229
APA StyleHobson, J. J., Li, Z., Hu, H., & Carter, C. W., Jr. (2022). A Leucyl-tRNA Synthetase Urzyme: Authenticity of tRNA Synthetase Catalytic Activities and Promiscuous Phosphorylation of Leucyl-5′AMP. International Journal of Molecular Sciences, 23(8), 4229. https://doi.org/10.3390/ijms23084229