
Antiproliferative and Cytotoxic Activities of Fluorescein—A Diagnostic Angiography Dye

 , ,
, ,  and
and 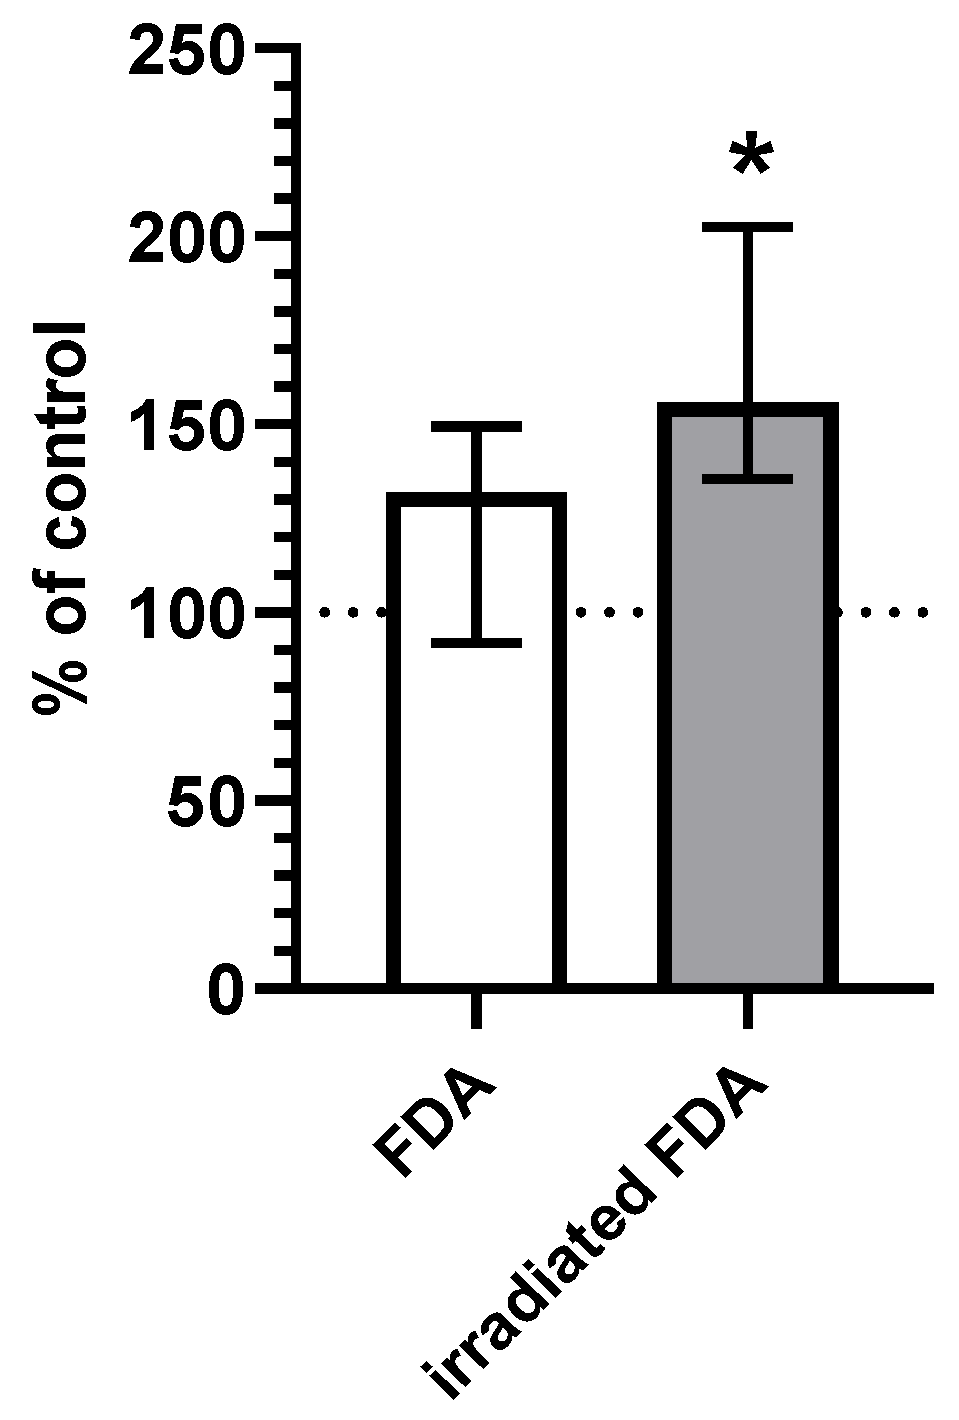
Abstract
:1. Introduction
2. Results
2.1. CO and 1O2 Release upon Fluorescein Photoexcitation
2.2. CO Content in HepG2 Cells
2.3. Cell Viability
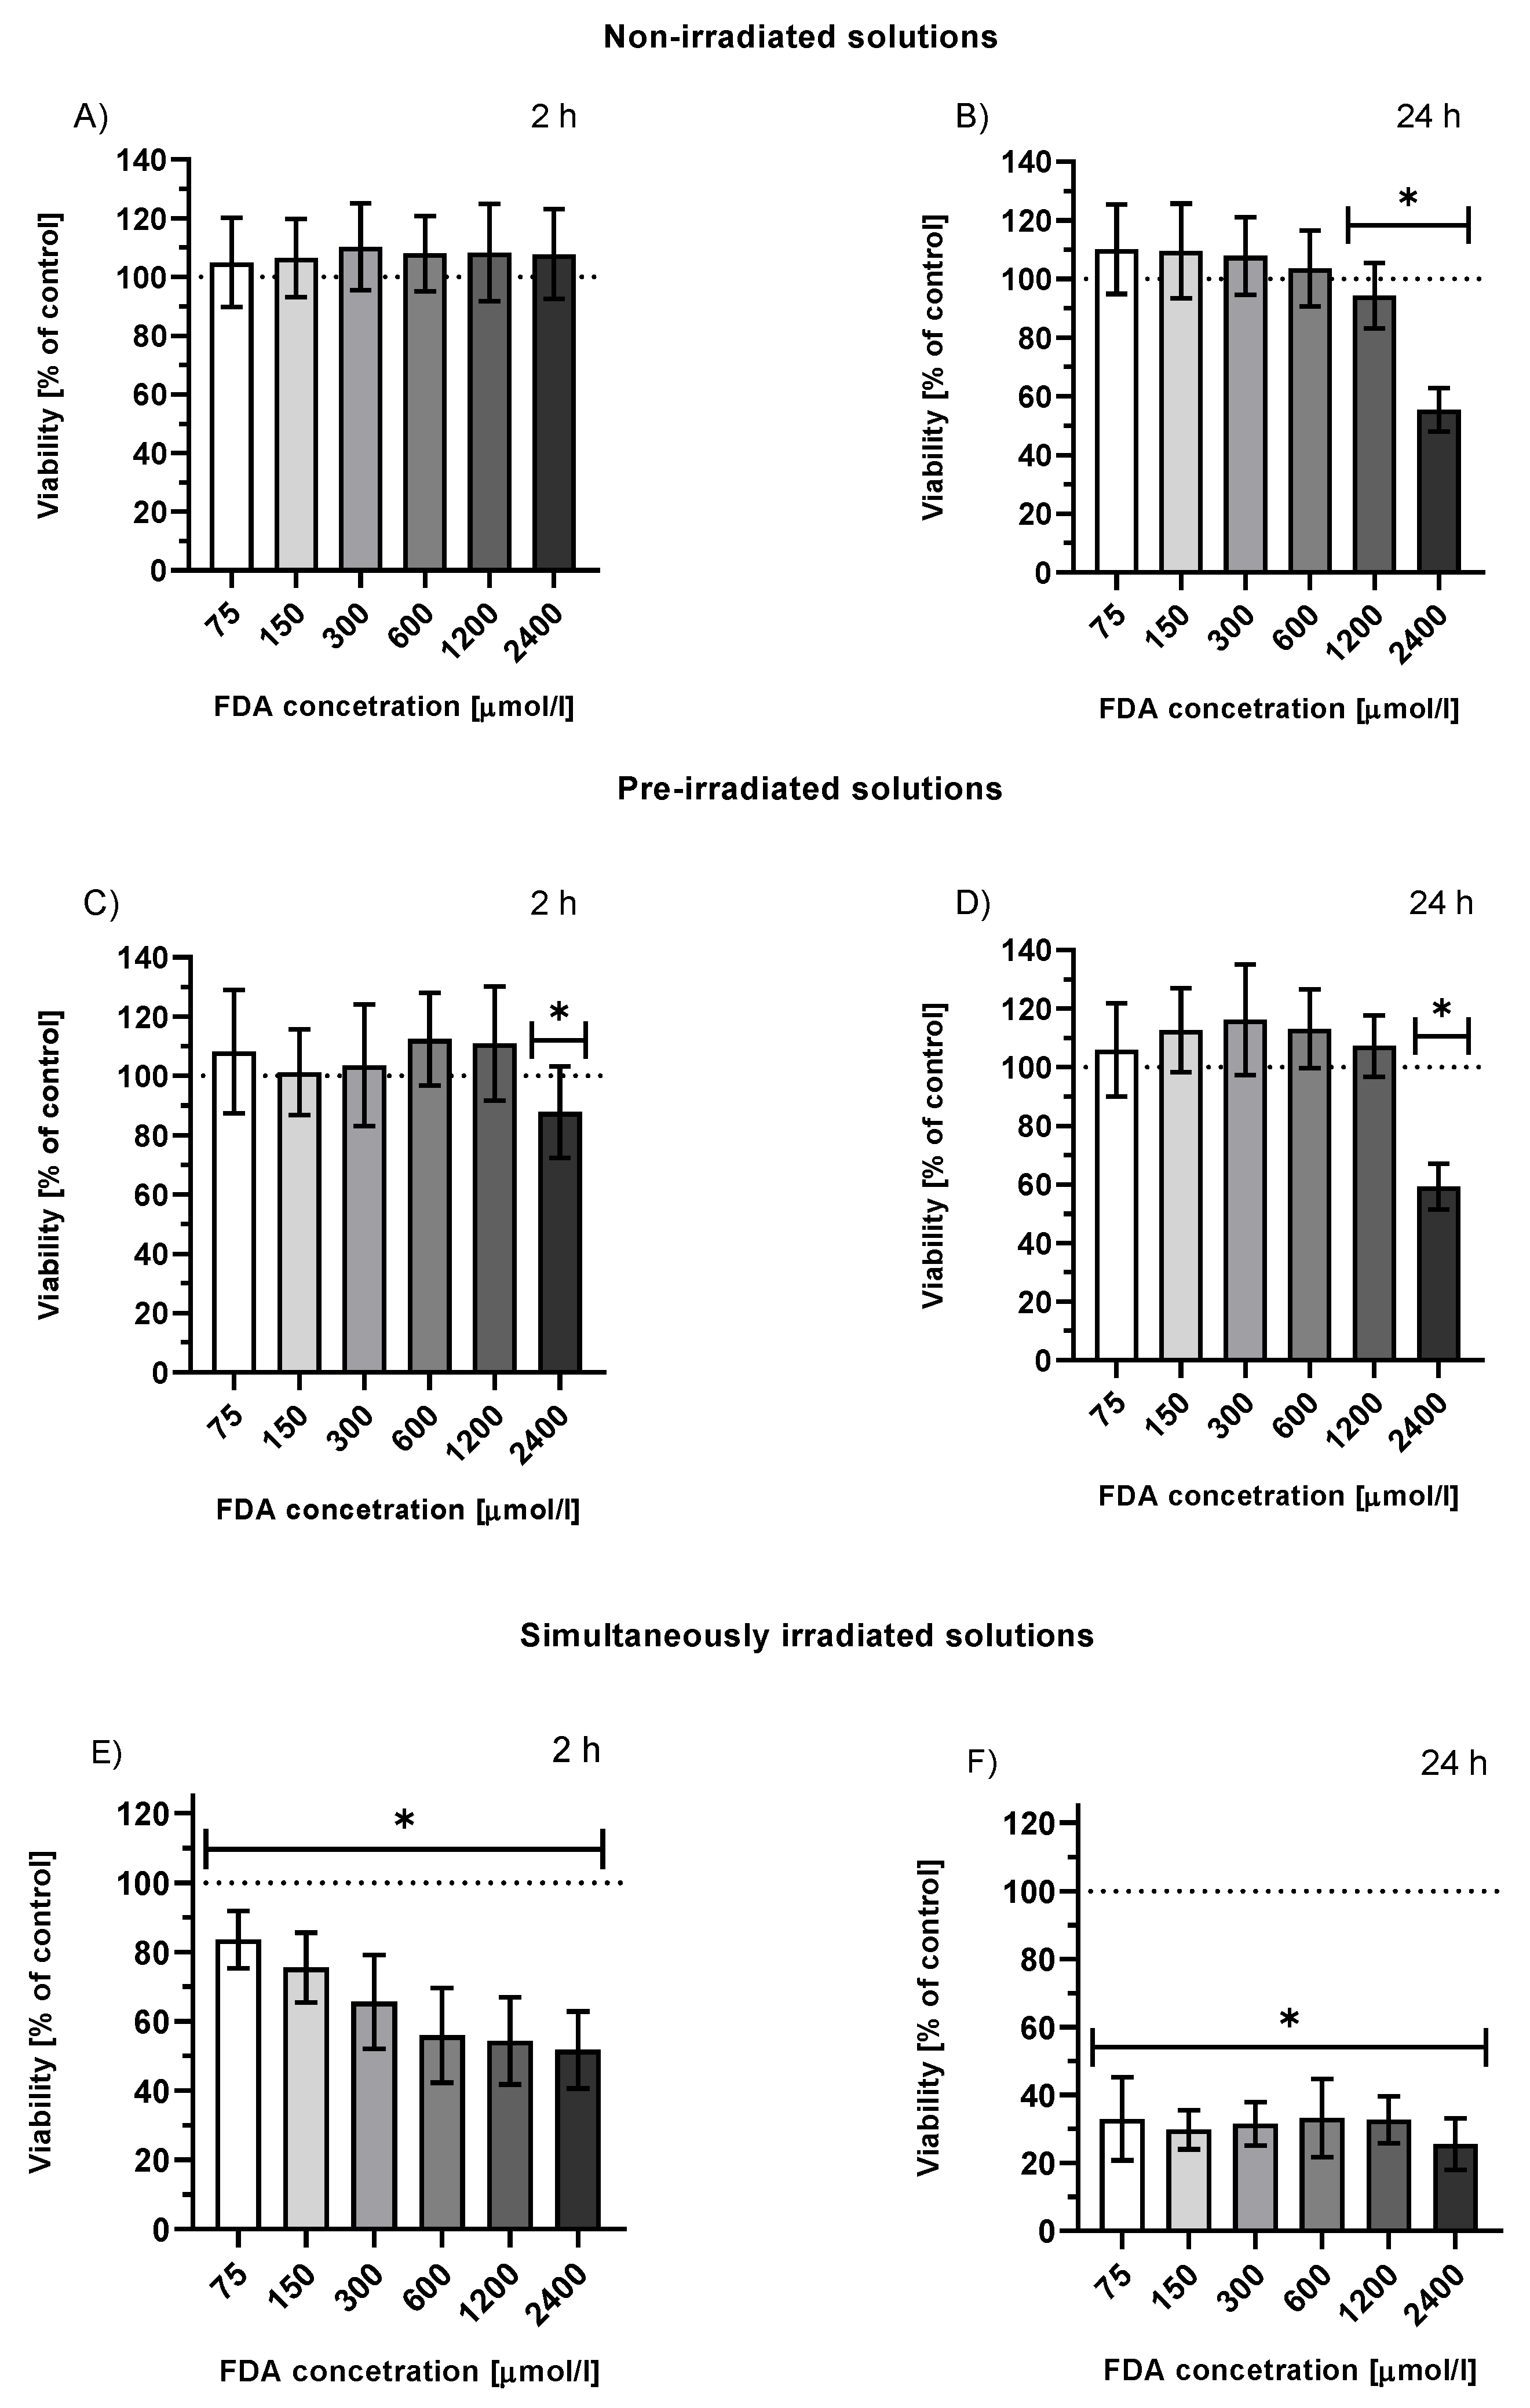
2.3.1. Viability of HepG2 Cells Treated with FDA or Fluorescein Photoproducts
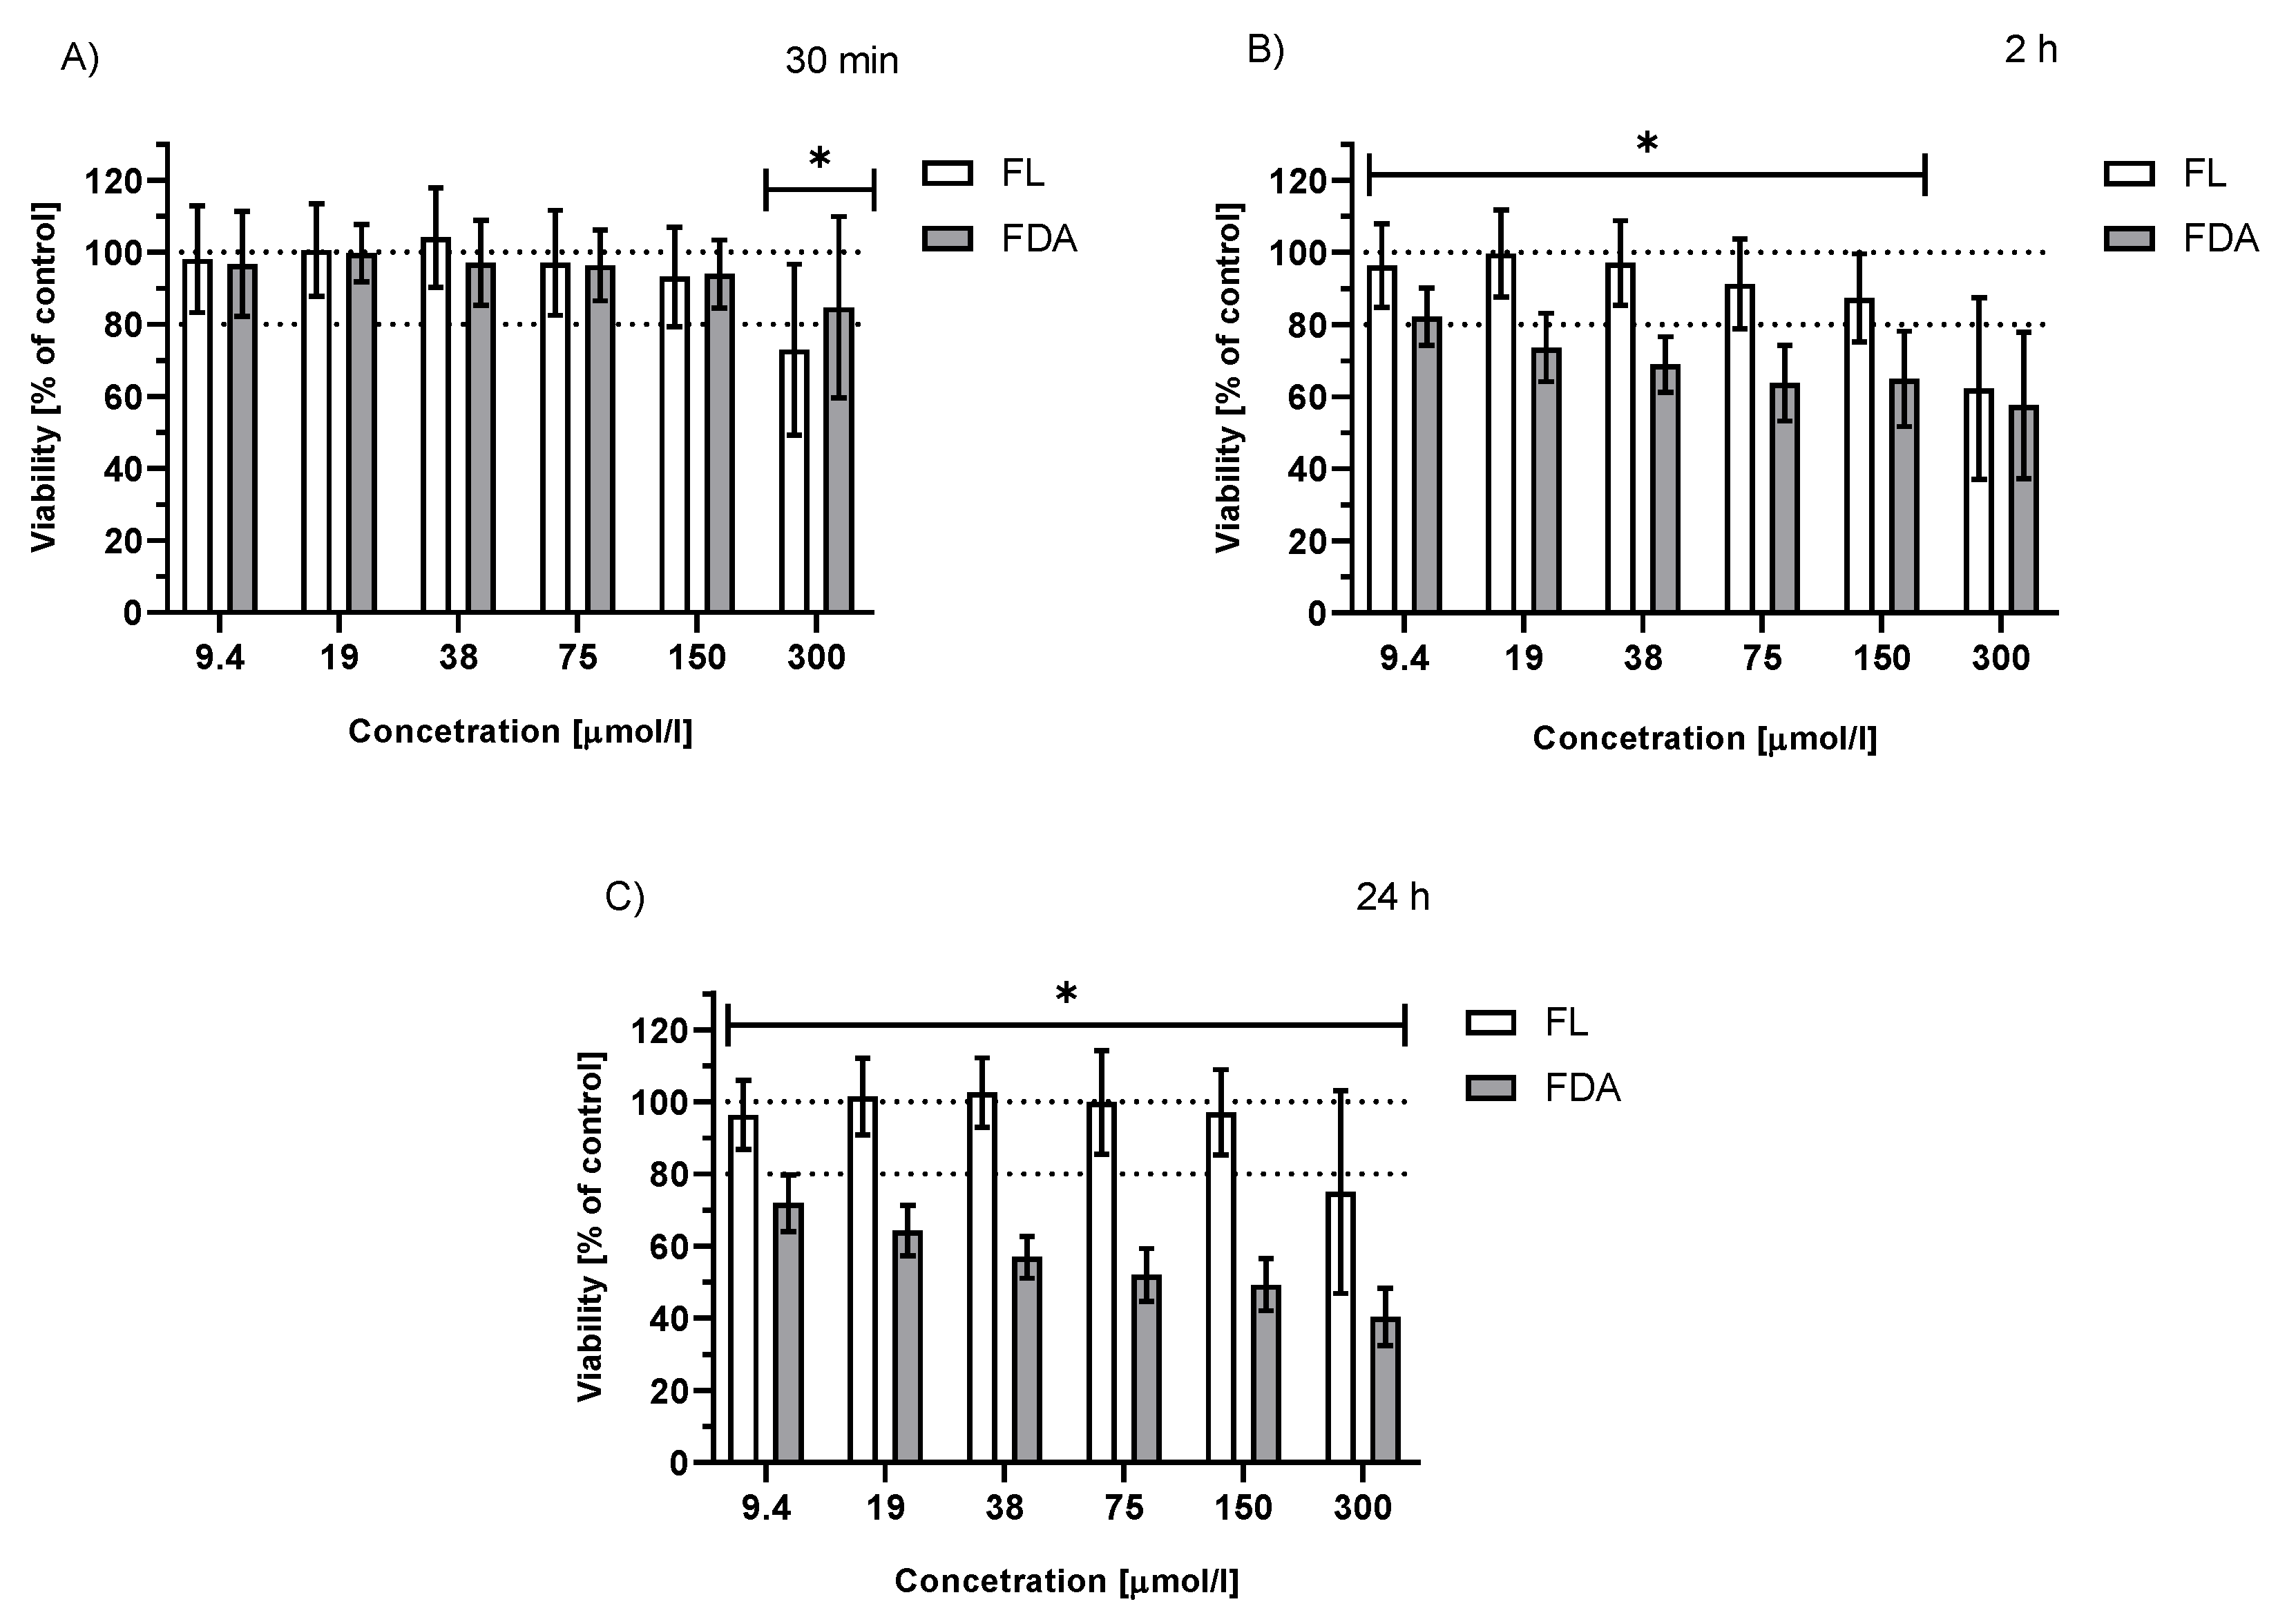
2.3.2. Viability of Irradiated HepG2 Cells Treated with FDA or Fluorescein
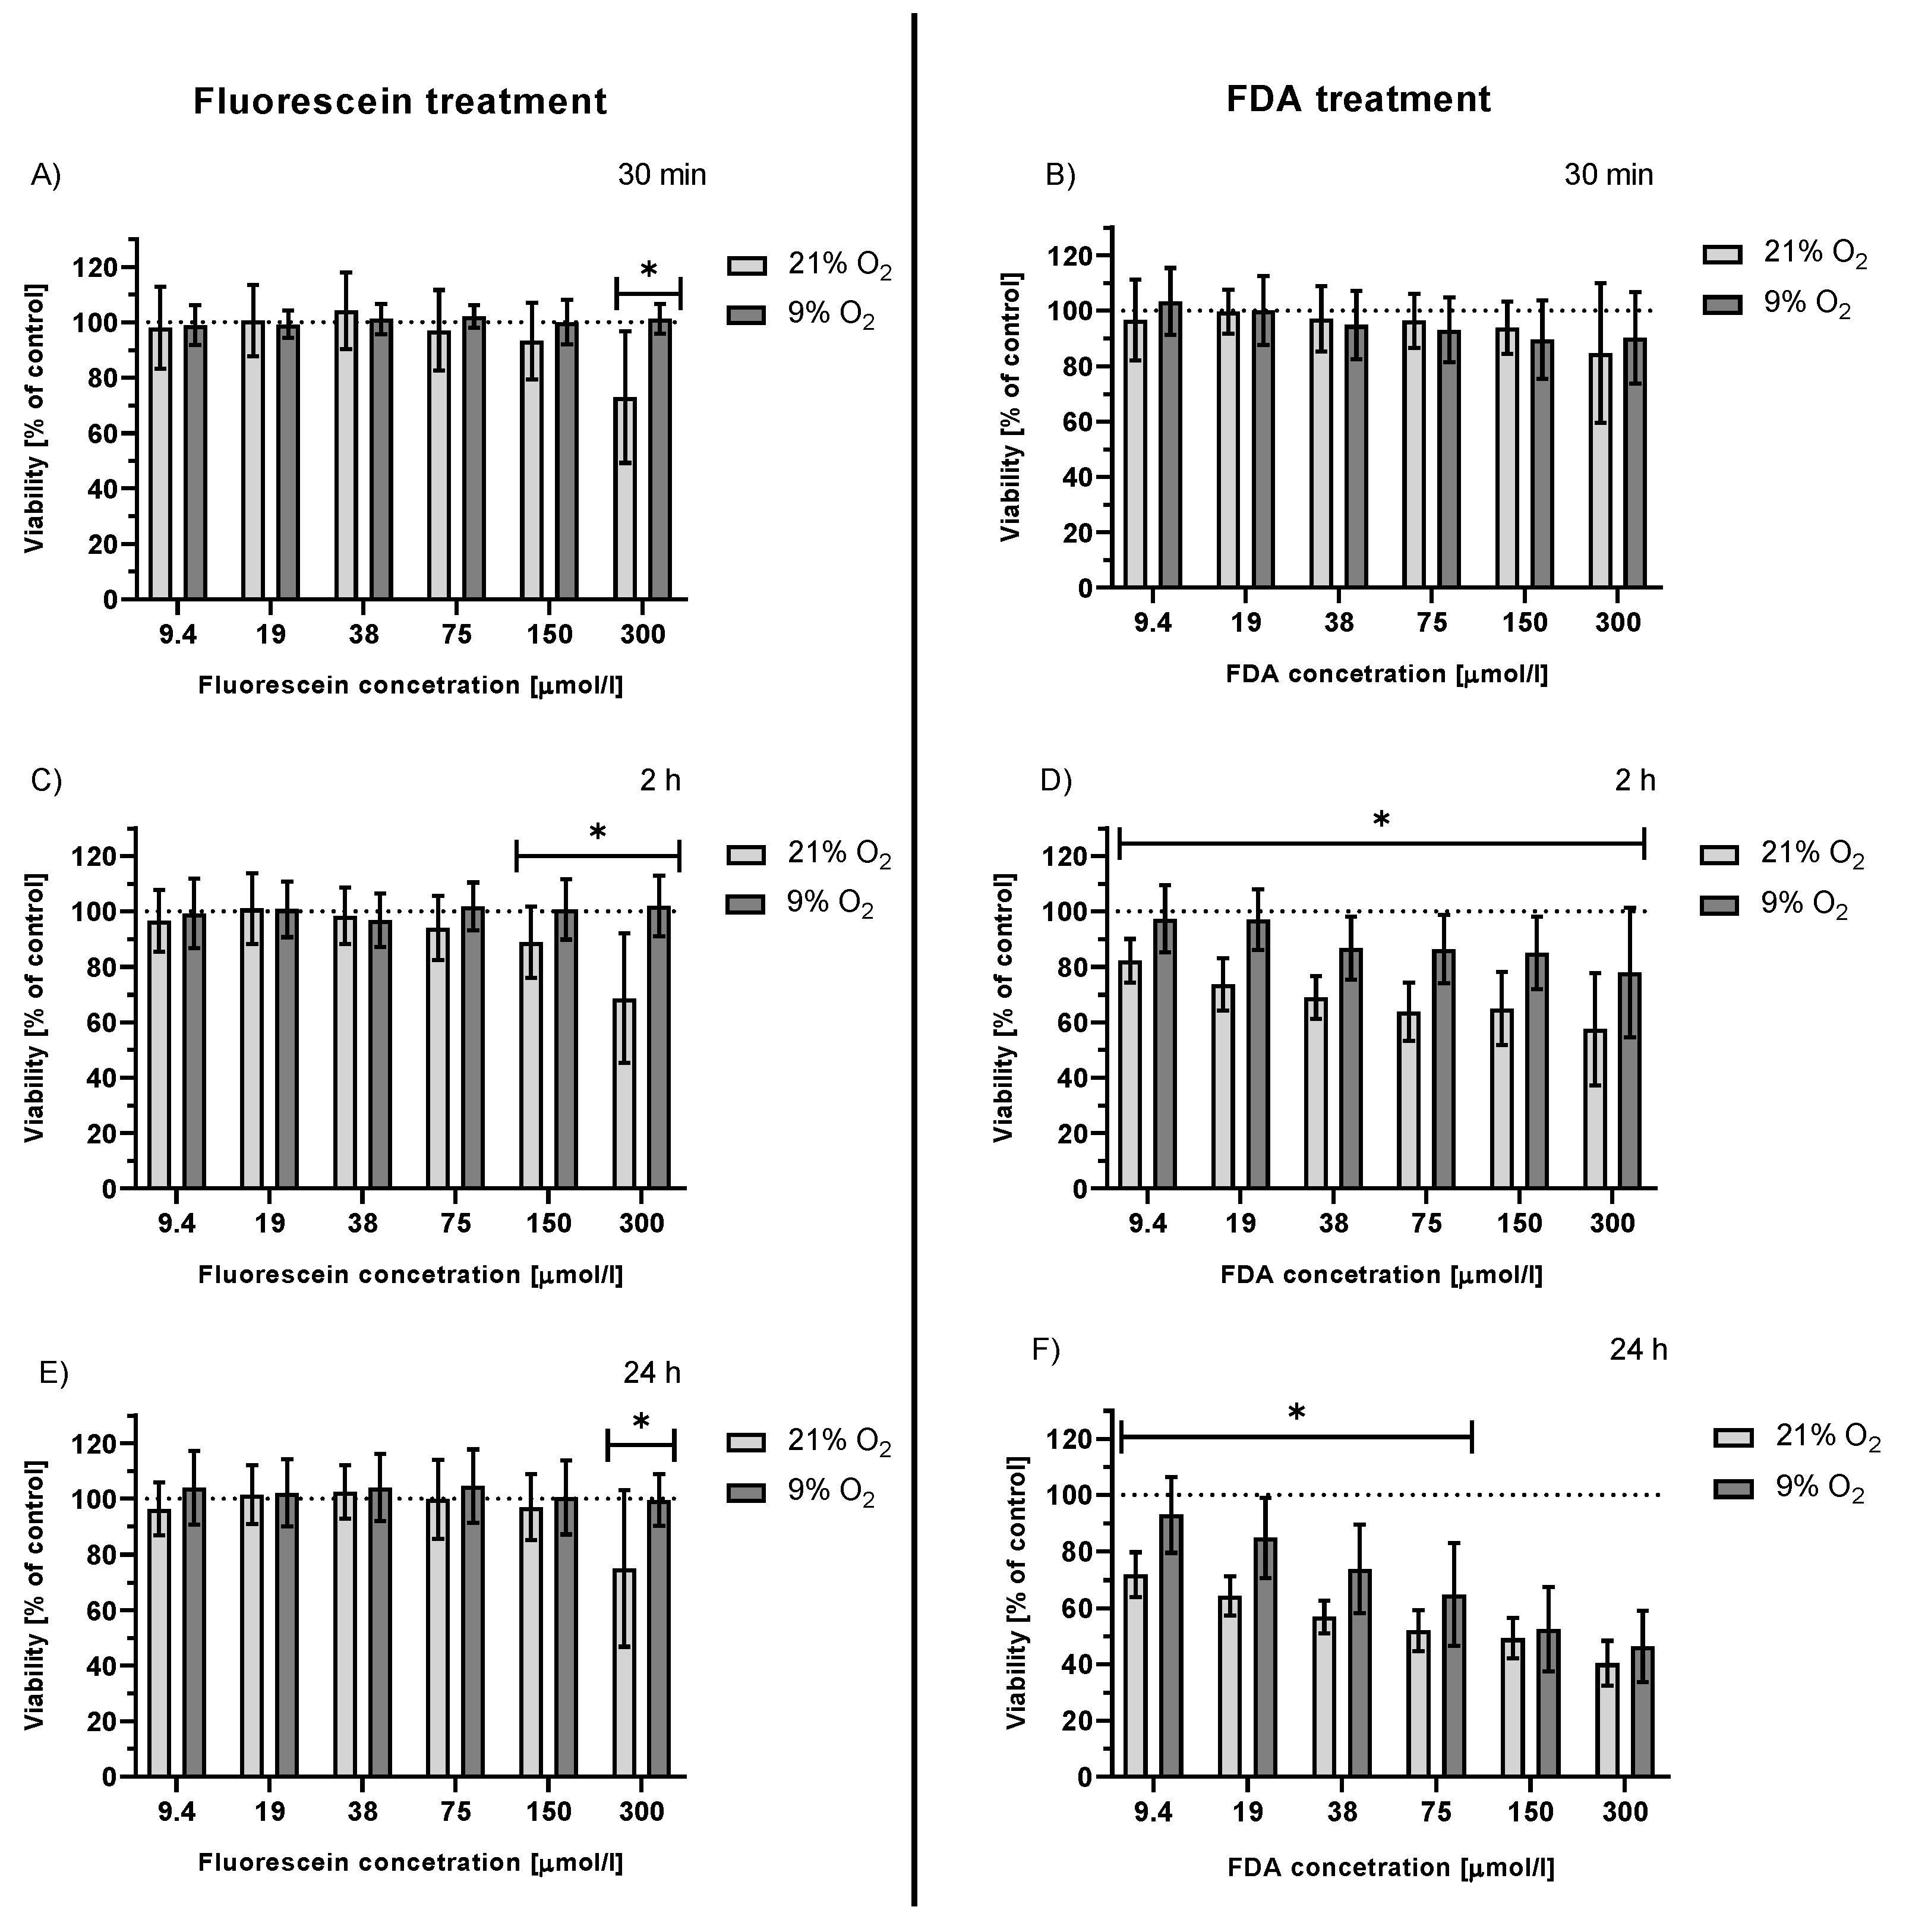
2.3.3. Viability of Irradiated HepG2 Cells Treated with FDA and Fluorescein under Hypoxemic Conditions
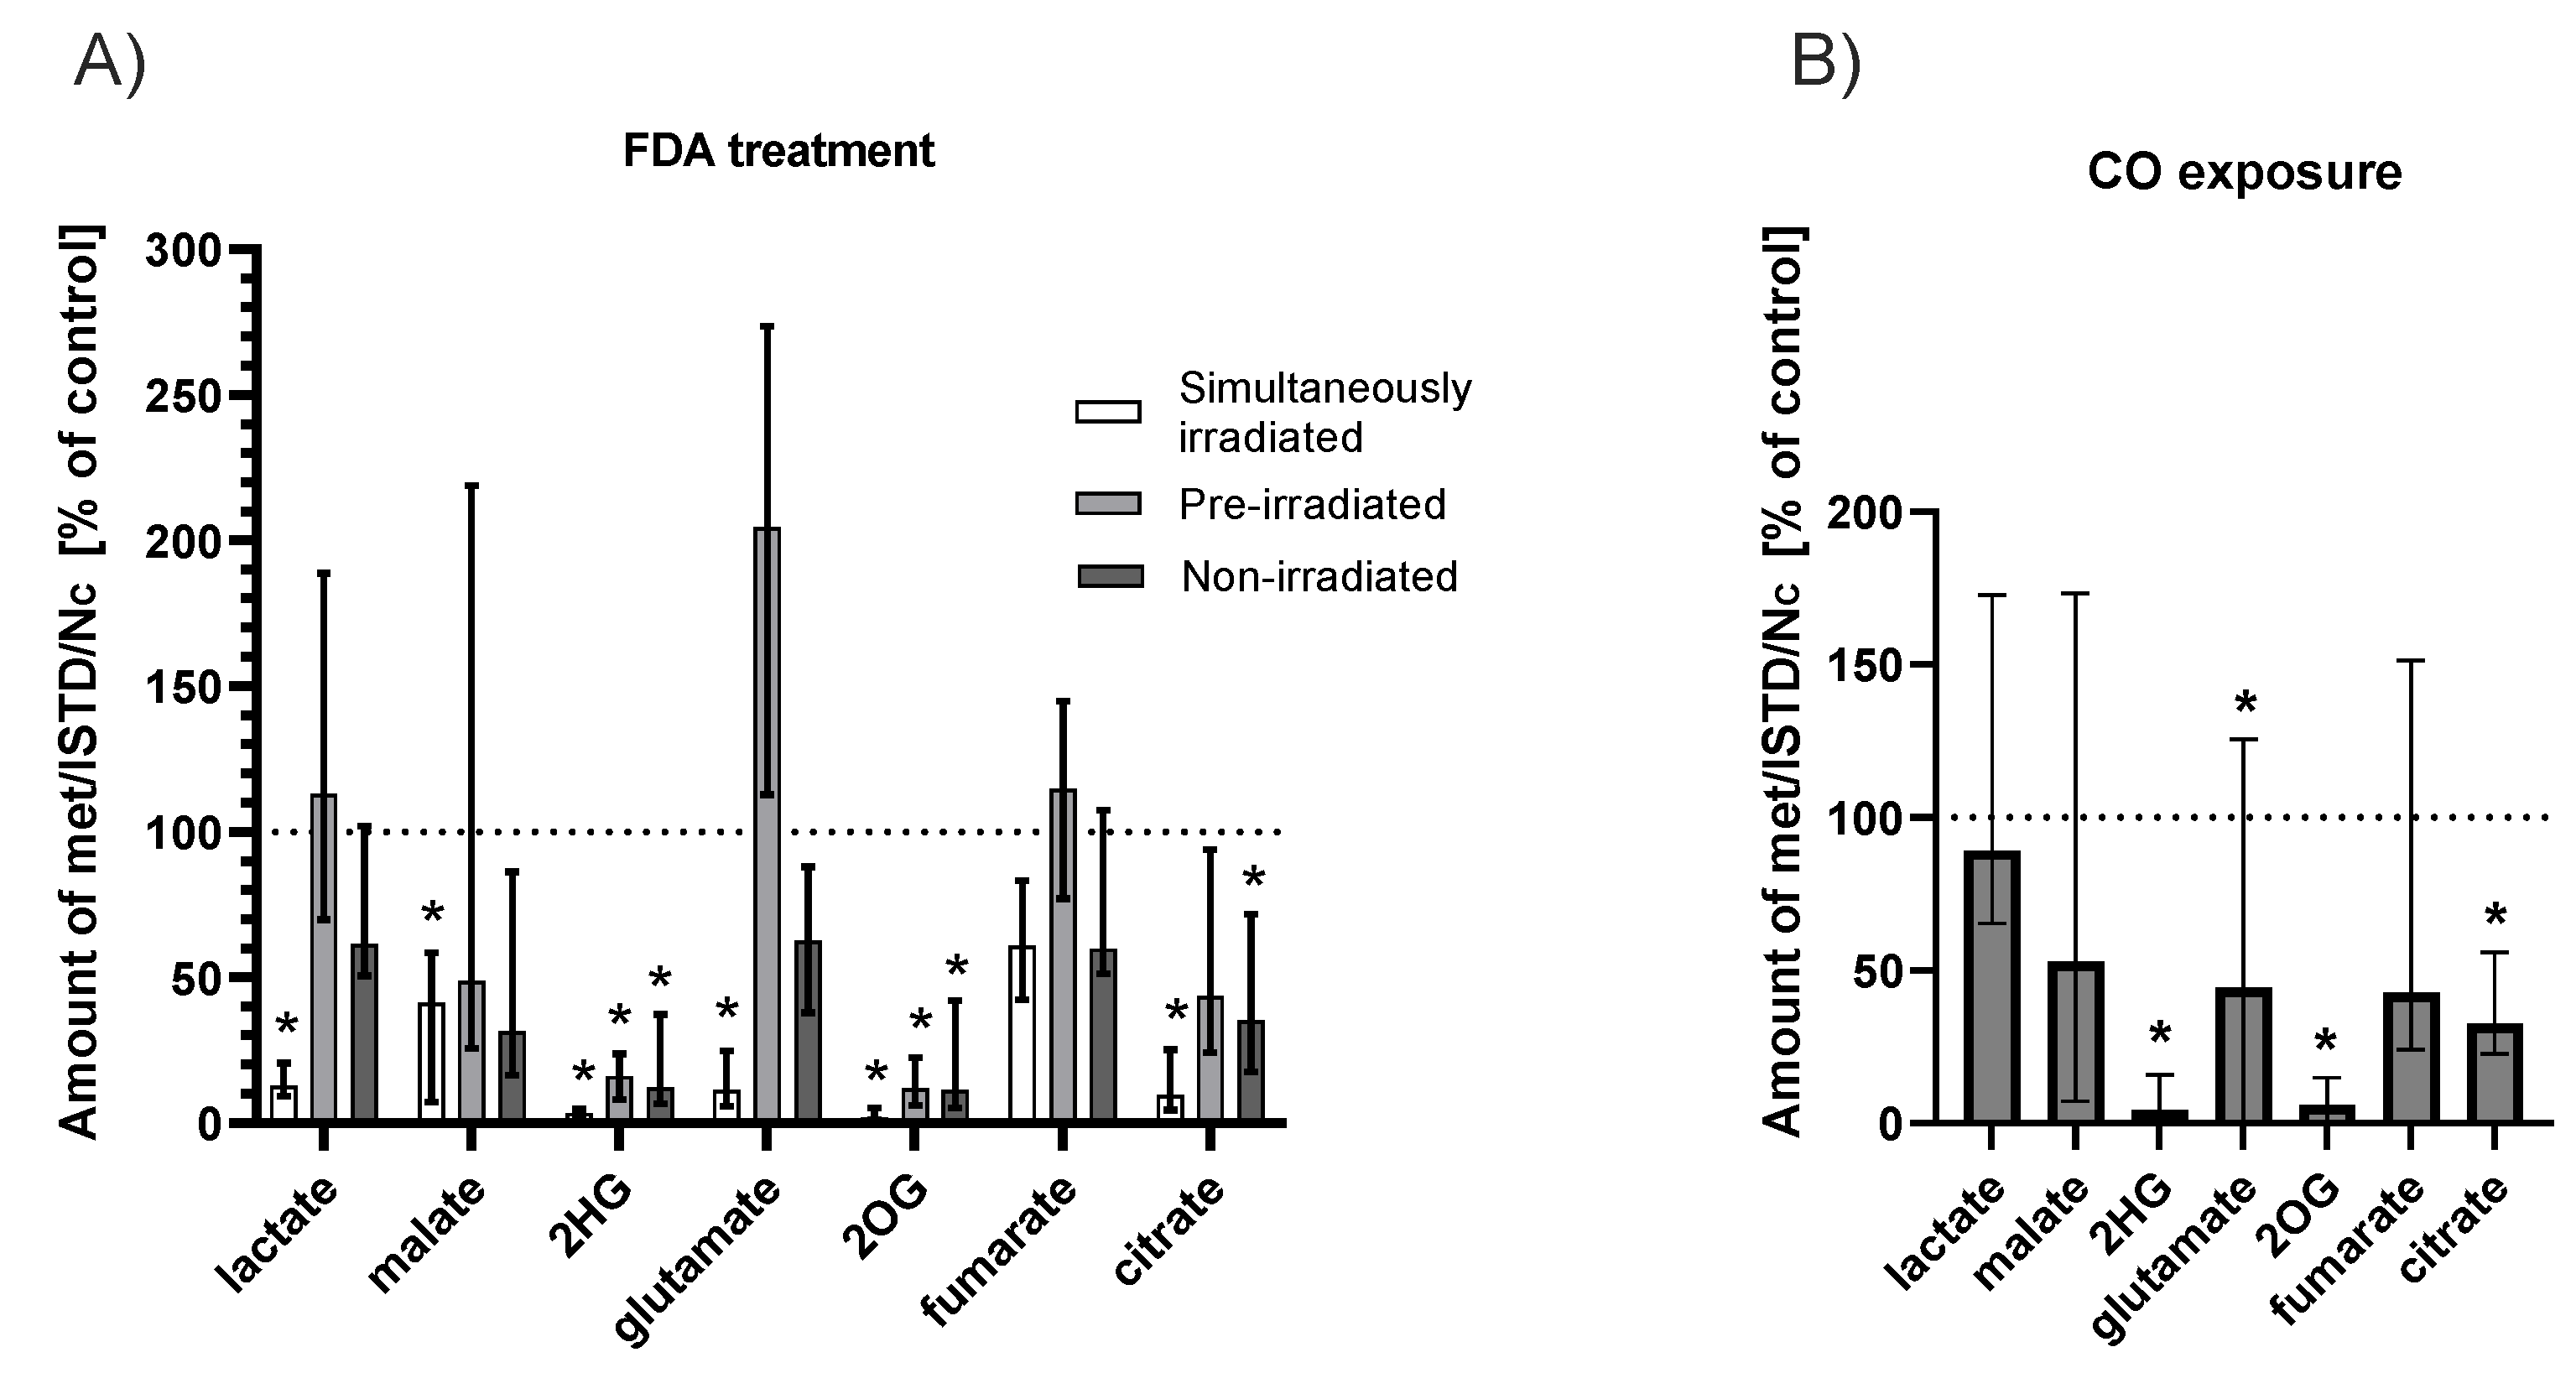
2.4. Effect of Fluorescein Photoreaction on Krebs Cycle Metabolites
2.4.1. FDA Solution
2.4.2. CO Atmosphere
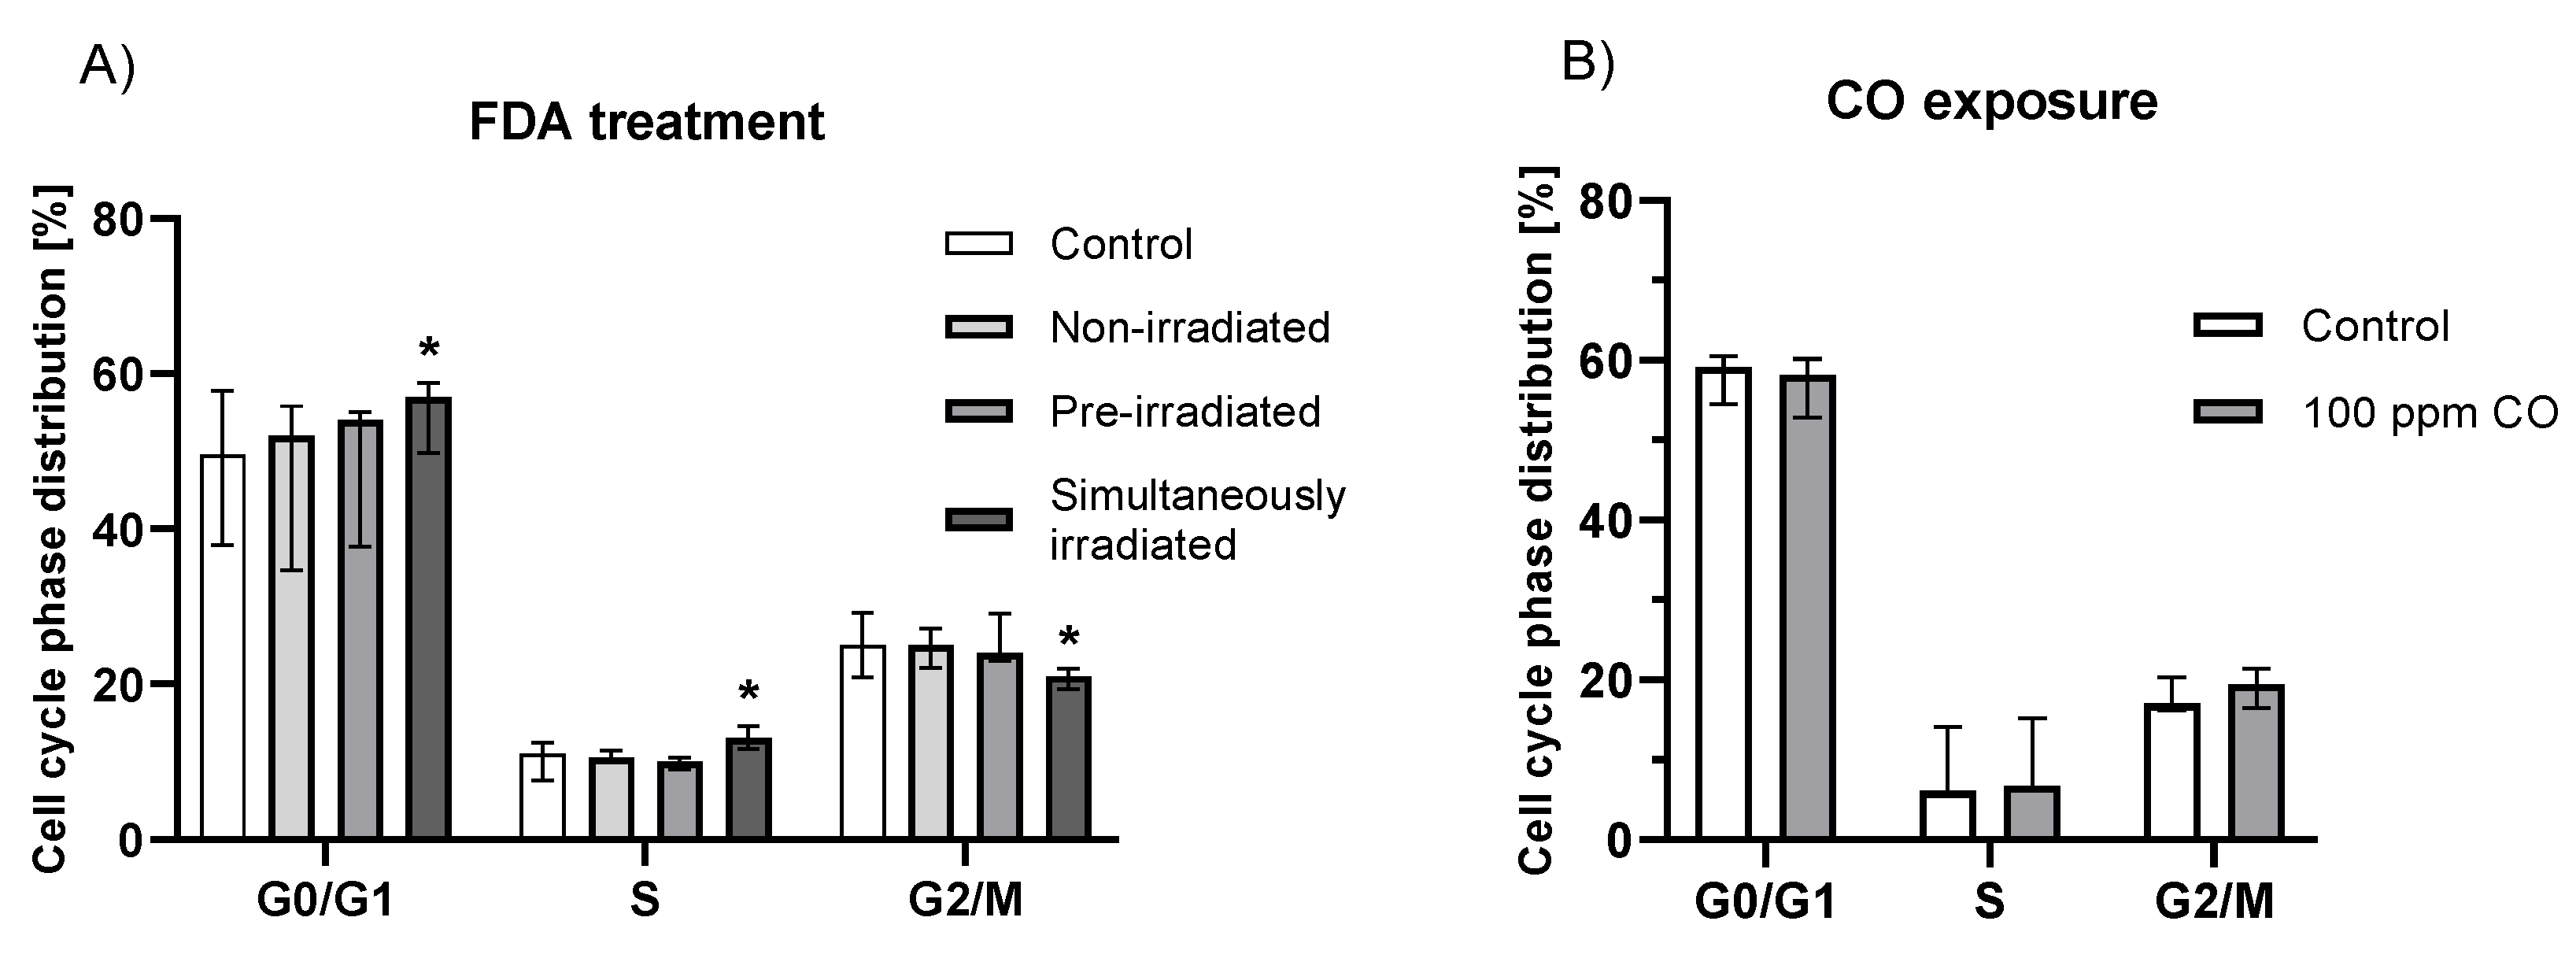
2.5. Effect of Fluorescein Photochemical Reaction on Cell Cycle
3. Discussion
4. Materials and Methods
4.1. Chemicals
4.2. Cell Cultures
4.3. CO Content in HepG2 Cells
4.3.1. Treatment and Sample Preparation
4.3.2. GC-RGA Analysis
4.4. Cell Viability
4.4.1. Cytotoxicity of Fluorescein and Its Photoproducts
4.4.2. Cytotoxicity of Photoproducts
4.5. Determination of Intracellular Krebs Cycle Metabolites
4.5.1. Cell Treatment and Sample Preparation
4.5.2. GC-MS Analysis
4.6. Cell Cycle Analysis
4.7. CO Exposure
4.8. Statistical Analyses
Supplementary Materials
Author Contributions
Funding
Institutional Review Board Statement
Informed Consent Statement
Data Availability Statement
Acknowledgments
Conflicts of Interest
References
- Brancato, R.; Bandello, F.; Lattanzio, R. Iris fluorescein angiography in clinical practice. Surv. Ophthalmol. 1997, 42, 41–70. [Google Scholar] [CrossRef]
- Zimmern, P.E.; Laub, D.; Leach, G.E. Fluorescein angiography of the bladder: Technique and relevance to bladder cancer and interstitial cystitis patients. J. Urol. 1995, 154, 62–65. [Google Scholar] [CrossRef]
- Sonn, G.A.; Jones, S.-N.E.; Tarin, T.V.; Du, C.B.; Mach, K.E.; Jensen, K.C.; Liao, J.C. Optical biopsy of human bladder neoplasia with in vivo confocal laser endomicroscopy. J. Urol. 2009, 182, 1299–1305. [Google Scholar] [CrossRef] [PubMed]
- Shkolyar, E.; Laurie, M.A.; Mach, K.E.; Trivedi, D.R.; Zlatev, D.V.; Chang, T.C.; Metzner, T.J.; Leppert, J.T.; Kao, C.-S.; Liao, J.C. Optical biopsy of penile cancer with in vivo confocal laser endomicroscopy. Urol. Oncol. Semin. Orig. Investig. 2019, 37, 809.e1–809.e8. [Google Scholar] [CrossRef] [PubMed]
- Acerbi, F.; Broggi, M.; Eoli, M.; Anghileri, E.; Cavallo, C.; Boffano, C.; Cordella, R.; Cuppini, L.; Pollo, B.; Schiariti, M. Is fluorescein-guided technique able to help in resection of high-grade gliomas? Neurosurg. Focus 2014, 36, E5. [Google Scholar] [CrossRef] [PubMed]
- Wang, L.M.; Banu, M.A.; Canoll, P.; Bruce, J.N. Rationale and Clinical Implications of Fluorescein-Guided Supramarginal Resection in Newly Diagnosed High-Grade Glioma. Front. Oncol. 2021, 11, 2008. [Google Scholar] [CrossRef] [PubMed]
- 22nd Model List of Essential Medicines. Available online: https://www.who.int/publications/i/item/WHO-MHP-HPS-EML-2021.02 (accessed on 15 October 2021).
- British National Formulary 81. Available online: https://www.webofpharma.com/2021/08/bnf-81-pdf-free-download-british.html (accessed on 15 October 2021).
- Hara, T.; Inami, M.; Hara, T. Efficacy and safety of fluorescein angiography with orally administered sodium fluorescein. Am. J. Ophthalmol. 1998, 126, 560–564. [Google Scholar] [CrossRef]
- Novotny, H.R.; Alvis, D.L. A method of photographing fluorescence in circulating blood in the human retina. Circulation 1961, 24, 82–86. [Google Scholar] [CrossRef] [Green Version]
- Marmoy, O.R.; Henderson, R.H.; Ooi, K. Recommended protocol for performing oral fundus fluorescein angiography (FFA) in children. Eye 2020, 36, 234–236. [Google Scholar] [CrossRef]
- Hammer, D.X.; Ferguson, R.D.; Patel, A.H.; Vazquez, V.; Husain, D. Angiography with a multifunctional line scanning ophthalmoscope. J. Biomed. Opt. 2012, 17, 026008. [Google Scholar] [CrossRef] [Green Version]
- Usui, Y. Determination of quantum yield of singlet oxygen formation by photosensitization. Chem. Lett. 1973, 2, 743–744. [Google Scholar] [CrossRef]
- Gandin, E.; Lion, Y.; Van de Vorst, A. Quantum yield of singlet oxygen production by xanthene derivatives. Photochem. Photobiol. 1983, 37, 271–278. [Google Scholar] [CrossRef]
- Antony, L.A.P.; Slanina, T.s.; Sebej, P.; Solomek, T.; Klán, P. Fluorescein analogue xanthene-9-carboxylic acid: A transition-metal-free CO releasing molecule activated by green light. Org. Lett. 2013, 15, 4552–4555. [Google Scholar] [CrossRef] [PubMed]
- Ryter, S.W.; Otterbein, L.E. Carbon monoxide in biology and medicine. Bioessays 2004, 26, 270–280. [Google Scholar] [CrossRef]
- Briviba, K.; Klotz, L.-O.; Sies, H. Toxic and signaling effects of photochemically or chemically generated singlet oxygen in biological systems. Biol. Chem. 1997, 378, 1259–1265. [Google Scholar]
- Devasagayam, T.; Kamat, J.P. Biological significance of singlet oxygen. Indian J. Exp. Biol. 2002, 40, 680–692. [Google Scholar]
- Agostinis, P.; Berg, K.; Cengel, K.A.; Foster, T.H.; Girotti, A.W.; Gollnick, S.O.; Hahn, S.M.; Hamblin, M.R.; Juzeniene, A.; Kessel, D. Photodynamic therapy of cancer: An update. CA Cancer J. Clin. 2011, 61, 250–281. [Google Scholar] [CrossRef]
- Otterbein, L.E.; Bach, F.H.; Alam, J.; Soares, M.; Lu, H.T.; Wysk, M.; Davis, R.J.; Flavell, R.A.; Choi, A.M. Carbon monoxide has anti-inflammatory effects involving the mitogen-activated protein kinase pathway. Nat. Med. 2000, 6, 422–428. [Google Scholar] [CrossRef]
- Brouard, S.; Otterbein, L.E.; Anrather, J.; Tobiasch, E.; Bach, F.H.; Choi, A.M.; Soares, M.P. Carbon monoxide generated by heme oxygenase 1 suppresses endothelial cell apoptosis. J. Exp. Med. 2000, 192, 1015–1026. [Google Scholar] [CrossRef]
- Morita, T.; Mitsialis, S.A.; Koike, H.; Liu, Y.; Kourembanas, S. Carbon monoxide controls the proliferation of hypoxic vascular smooth muscle cells. J. Biol. Chem. 1997, 272, 32804–32809. [Google Scholar] [CrossRef] [Green Version]
- Vítek, L.; Gbelcová, H.; Muchová, L.; Váňová, K.; Zelenka, J.; Koníčková, R.; Šuk, J.; Zadinova, M.; Knejzlík, Z.; Ahmad, S. Antiproliferative effects of carbon monoxide on pancreatic cancer. Dig. Liver Dis. 2014, 46, 369–375. [Google Scholar] [CrossRef] [PubMed]
- Agarwal, M.L.; Clay, M.E.; Harvey, E.J.; Evans, H.H.; Antunez, A.R.; Oleinick, N.L. Photodynamic therapy induces rapid cell death by apoptosis in L5178Y mouse lymphoma cells. Cancer Res. 1991, 51, 5993–5996. [Google Scholar] [PubMed]
- Star, W.M.; Marijnissen, H.P.; van den Berg-Blok, A.E.; Versteeg, J.A.; Franken, K.A.; Reinhold, H.S. Destruction of rat mammary tumor and normal tissue microcirculation by hematoporphyrin derivative photoradiation observed in vivo in sandwich observation chambers. Cancer Res. 1986, 46, 2532–2540. [Google Scholar] [PubMed]
- Krinsky, N.I. Singlet oxygen in biological systems. Trends Biochem. Sci. 1977, 2, 35–38. [Google Scholar] [CrossRef]
- Davies, M.J. Singlet oxygen-mediated damage to proteins and its consequences. Biochem. Biophys. Res. Commun. 2003, 305, 761–770. [Google Scholar] [CrossRef]
- Blumenthal, I. Carbon monoxide poisoning. J. R. Soc. Med. 2001, 94, 270–272. [Google Scholar] [CrossRef]
- Bernard, C. Leçons sur Les Effets des Substances Toxiques et Médicamenteuses; Librairie, J.B., Ed.; Baillière et Fils: Leon, France, 1857. [Google Scholar]
- Douglas, C.; Haldane, J.; Haldane, J. The laws of combination of haemoglobin with carbon monoxide and oxygen. J. Physiol. 1912, 44, 275–304. [Google Scholar] [CrossRef] [Green Version]
- Haldane, J.; Smith, J.L. The absorption of oxygen by the lungs. J. Physiol. 1897, 22, 231. [Google Scholar] [CrossRef] [Green Version]
- Nomof, N.; Hopper, J.; Brown, E.; Scott, K.; Wennesland, R. Simultaneous determinations of the total volume of red blood cells by use of carbon monoxide and chromium 51 in healthy and diseased human subjects. J. Clin. Investig. 1954, 33, 1382–1387. [Google Scholar] [CrossRef]
- Coburn, R.F. The carbon monoxide body stores. Ann. N. Y. Acad. Sci. 1970, 174, 11–22. [Google Scholar] [CrossRef]
- Miró, Ò.; Casademont, J.; Barrientos, A.; Urbano–Márquez, Á.; Cardellach, F. Mitochondrial cytochrome c oxidase inhibition during acute carbon monoxide poisoning. Pharmacol. Toxicol. 1998, 82, 199–202. [Google Scholar] [CrossRef] [PubMed]
- Zhang, J.; Piantadosi, C.A. Mitochondrial oxidative stress after carbon monoxide hypoxia in the rat brain. J. Clin. Investig. 1992, 90, 1193–1199. [Google Scholar] [CrossRef] [PubMed]
- Thom, S.R. Carbon monoxide-mediated brain lipid peroxidation in the rat. J. Appl. Physiol. 1990, 68, 997–1003. [Google Scholar] [CrossRef] [PubMed]
- Martínek, M.; Ludvíková, L.; Šranková, M.; Navrátil, R.; Muchová, L.; Huzlík, J.; Roithová, J.; Vítek, L.; Klán, P.; Šebej, P. Photochemistry of Common Xanthene Fluorescent Dyes as Efficient Visible-light Activatable CO-Releasing Molecules. ChemRxiv 2022. [Google Scholar] [CrossRef]
- Rotman, B.; Papermaster, B.W. Membrane properties of living mammalian cells as studied by enzymatic hydrolysis of fluorogenic esters. Proc. Natl. Acad. Sci. USA 1966, 55, 134. [Google Scholar] [CrossRef] [Green Version]
- Yankell, S.L.; Loux, J.J. Acute toxicity testing of erythrosine and sodium fluorescein in mice and rats. J. Periodontol. 1977, 48, 228–231. [Google Scholar] [CrossRef]
- Gollnick, K.; Schenck, G. Mechanism and stereoselectivity of photosensitized oxygen transfer reactions. Pure Appl. Chem. 1964, 9, 507–526. [Google Scholar] [CrossRef]
- Brown, S.; Piantadosi, C. In vivo binding of carbon monoxide to cytochrome c oxidase in rat brain. J. Appl. Physiol. 1990, 68, 604–610. [Google Scholar] [CrossRef]
- Estabrook, R.W.; Franklin, M.R.; Hildebrandt, A.G. Factors influencing the inhibitory effect of carbon monoxide on cytochrome P-450-catalyzed mixed function oxidation reactions. Ann. N. Y. Acad. Sci. 1970, 174, 218–232. [Google Scholar] [CrossRef]
- Wilkinson, F.; Helman, W.P.; Ross, A.B. Rate constants for the decay and reactions of the lowest electronically excited singlet state of molecular oxygen in solution. An expanded and revised compilation. J. Phys. Chem. Ref. Data 1995, 24, 663–677. [Google Scholar] [CrossRef] [Green Version]
- Lazarus, L.S.; Simons, C.R.; Arcidiacono, A.; Benninghoff, A.D.; Berreau, L.M. Extracellular vs intracellular delivery of CO: Does it matter for a stable, diffusible gasotransmitter? J. Med. Chem. 2019, 62, 9990–9995. [Google Scholar] [CrossRef] [PubMed]
- Reinke, C.; Bevans-Fonti, S.; Drager, L.F.; Shin, M.-K.; Polotsky, V.Y. Effects of different acute hypoxic regimens on tissue oxygen profiles and metabolic outcomes. J. Appl. Physiol. 2011, 111, 881–890. [Google Scholar] [CrossRef] [PubMed] [Green Version]
- Kaczara, P.; Sitek, B.; Przyborowski, K.; Kurpinska, A.; Kus, K.; Stojak, M.; Chlopicki, S. Antiplatelet effect of carbon monoxide is mediated by NAD+ and ATP depletion. Arterioscler. Thromb. Vasc. Biol. 2020, 40, 2376–2390. [Google Scholar] [CrossRef]
- Lavitrano, M.; Smolenski, R.T.; Musumeci, A.; Maccherini, M.; Slominska, E.; Di Florio, E.; Bracco, A.; Mancini, A.; Stassi, G.; Patti, M. Carbon monoxide improves cardiac energetics and safeguards the heart during reperfusion after cardiopulmonary bypass in pigs. FASEB J. 2004, 18, 1093–1095. [Google Scholar] [CrossRef] [PubMed]
- Tsui, T.-Y.; Siu, Y.-T.; Schlitt, H.J.; Fan, S.-T. Heme oxygenase-1-derived carbon monoxide stimulates adenosine triphosphate generation in human hepatocyte. Biochem. Biophys. Res. Commun. 2005, 336, 898–902. [Google Scholar] [CrossRef] [PubMed]
- Suliman, H.B.; Carraway, M.S.; Tatro, L.G.; Piantadosi, C.A. A new activating role for CO in cardiac mitochondrial biogenesis. J. Cell Sci. 2007, 120, 299–308. [Google Scholar] [CrossRef] [PubMed] [Green Version]
- Queiroga, C.S.; Almeida, A.S.; Alves, P.M.; Brenner, C.; Vieira, H.L. Carbon monoxide prevents hepatic mitochondrial membrane permeabilization. BMC Cell Biol. 2011, 12, 10. [Google Scholar] [CrossRef] [Green Version]
- Song, R.; Mahidhara, R.S.; Liu, F.; Ning, W.; Otterbein, L.E.; Choi, A.M. Carbon monoxide inhibits human airway smooth muscle cell proliferation via mitogen-activated protein kinase pathway. Am. J. Respir. Cell Mol. Biol. 2002, 27, 603–610. [Google Scholar] [CrossRef]
- Pae, H.-O.; Oh, G.-S.; Choi, B.-M.; Chae, S.-C.; Kim, Y.-M.; Chung, K.-R.; Chung, H.-T. Carbon monoxide produced by heme oxygenase-1 suppresses T cell proliferation via inhibition of IL-2 production. J. Immunol. 2004, 172, 4744–4751. [Google Scholar] [CrossRef] [Green Version]
- Liang, P.; Kolodieznyi, D.; Creeger, Y.; Ballou, B.; Bruchez, M.P. Subcellular Singlet Oxygen and Cell Death: Location Matters. Front. Chem. 2020, 8, 1045. [Google Scholar] [CrossRef]
- Vreman, H.J.; Stevenson, D.K. Heme oxygenase activity as measured by carbon monoxide production. Anal. Biochem. 1988, 168, 31–38. [Google Scholar] [CrossRef]
- O’brien, R.; Gottlieb-Rosenkrantz, P. An automatic method for viability assay of cultured cells. J. Histochem. Cytochem. 1970, 18, 581–589. [Google Scholar] [CrossRef] [PubMed] [Green Version]
- Dvořák, A.; Zelenka, J.; Smolková, K.; Vítek, L.; Ježek, P. Background levels of neomorphic 2-hydroxyglutarate facilitate proliferation of primary fibroblasts. Physiol. Res. 2017, 66, 293–304. [Google Scholar] [CrossRef] [PubMed]

Publisher’s Note: MDPI stays neutral with regard to jurisdictional claims in published maps and institutional affiliations. |
© 2022 by the authors. Licensee MDPI, Basel, Switzerland. This article is an open access article distributed under the terms and conditions of the Creative Commons Attribution (CC BY) license (https://creativecommons.org/licenses/by/4.0/).
Share and Cite
Šranková, M.; Dvořák, A.; Martínek, M.; Šebej, P.; Klán, P.; Vítek, L.; Muchová, L. Antiproliferative and Cytotoxic Activities of Fluorescein—A Diagnostic Angiography Dye. Int. J. Mol. Sci. 2022, 23, 1504. https://doi.org/10.3390/ijms23031504
Šranková M, Dvořák A, Martínek M, Šebej P, Klán P, Vítek L, Muchová L. Antiproliferative and Cytotoxic Activities of Fluorescein—A Diagnostic Angiography Dye. International Journal of Molecular Sciences. 2022; 23(3):1504. https://doi.org/10.3390/ijms23031504
Chicago/Turabian StyleŠranková, Mária, Aleš Dvořák, Marek Martínek, Peter Šebej, Petr Klán, Libor Vítek, and Lucie Muchová. 2022. "Antiproliferative and Cytotoxic Activities of Fluorescein—A Diagnostic Angiography Dye" International Journal of Molecular Sciences 23, no. 3: 1504. https://doi.org/10.3390/ijms23031504
APA StyleŠranková, M., Dvořák, A., Martínek, M., Šebej, P., Klán, P., Vítek, L., & Muchová, L. (2022). Antiproliferative and Cytotoxic Activities of Fluorescein—A Diagnostic Angiography Dye. International Journal of Molecular Sciences, 23(3), 1504. https://doi.org/10.3390/ijms23031504