Article

Changes of Gut Microbiota by Natural mtDNA Variant Differences Augment Susceptibility to Metabolic Disease and Ageing

1
Lübeck Institute of Experimental Dermatology, University of Lübeck, 23562 Lübeck, Germany
2
Institute for Cardiogenetics, University of Lübeck, 23562 Lübeck, Germany
3
College of Medicine and Sharjah Institute for Medical Research, University of Sharjah, Sharjah 27272, United Arab Emirates
*
Author to whom correspondence should be addressed.
Int. J. Mol. Sci. 2022, 23(3), 1056; https://doi.org/10.3390/ijms23031056
Submission received: 14 December 2021 / Revised: 13 January 2022 / Accepted: 18 January 2022 / Published: 19 January 2022
(This article belongs to the Special Issue Mitochondria Genome)

Abstract

:
We recently reported on two mouse strains carrying different single nucleotide variations in the mitochondrial complex I gene, i.e., B6-mtBPL mice carrying m.11902T>C and B6-mtALR carrying m.4738C>A. B6-mtBPL mice exhibited a longer lifespan and a lower metabolic disease susceptibility despite mild mitochondrial functional differences in steady-state. As natural polymorphisms in the mitochondrial DNA (mtDNA) are known to be associated with distinct patterns of gut microbial composition, we further investigated the gut microbiota composition in these mice strains. In line with mouse phenotypes, we found a significantly lower abundance of Proteobacteria, which is positively associated with pathological conditions, in B6-mtBPL compared to B6-mtALR mice. A prediction of functional profile of significantly differential bacterial genera between these strains revealed an involvement of glucose metabolism pathways. Whole transcriptome analysis of liver samples from B6-mtBPL and B6-mtALR mice confirmed these findings. Thus, both host gene expression and gut microbial changes caused by the mtDNA variant differences may contribute to the ageing and metabolic phenotypes observed in these mice strains. Since gut microbiota are easier to modulate, compared with mtDNA variants, identification of such mtDNA variants, specific gut bacterial species and bacterial metabolites may be a potential intervention to modulate common diseases, which are differentially susceptible to individuals with different mtDNA variants.

1. Introduction

The mammalian mitochondrial DNA (mtDNA) encodes 37 genes, including 13 protein-coding genes for oxidative phosphorylation (OXPHOS) machinery, 22 transfer RNA genes and 2 ribosomal RNA genes [1]. Some variations (both mutations and polymorphisms) are known to cause dysfunction in mitochondria, such as increased ROS production and reduced OXPHOS activities, and consequently result in pathological conditions including primary mitochondrial diseases [2,3,4,5]. Since mitochondrial function is central for cellular metabolism and activities, such dysfunctions are directly linked to health and diseases other than primary mitochondrial disorders. In fact, studies demonstrating that the association of mtDNA variants with common complex diseases, including ageing and age-associated diseases, have been reported in humans [6], and these are supported by a number of experimental observations using mammalian models, including conplastic mouse strains that carry distinct variants in mtDNA [7,8,9,10,11].
At the same time, such common diseases are reportedly associated with the composition of the gut microbiome [12,13]. Our group and others have revealed previously that mtDNA variants are associated with the composition of the gut microbiome [14,15]. One study demonstrated that differential mitochondrial ROS levels caused by ageing or mtDNA mutations are associated with the abundance of specific bacterial species [15]. Similarly, a mouse model with accelerated ageing due to a knock-in mutation at the proofreading domain of the mtDNA polymerase gamma also had changes in gut microbiota composition in addition to mitochondrial dysfunction [16]. In contrast, we recently reported that two mouse strains that carry two nucleotide single nucleotide variants in the mtDNA-coded mitochondrial complex I gene, i.e., B6-mtALR mice carry m.4738C>A and B6-mtBPL mice with m.11902T>C, do not exhibit major mitochondrial dysfunction in steady-state [17]. More specifically, the levels of OXPHOS complex enzyme activities and mitochondrial super oxide as well as mitochondrial membrane potentials were comparable between the B6-mtBPL and B6-mtALR mice, while the levels of maximal respiration and spare capacity exhibited a trend of reduction in B6-mtALR compared with B6-mtBPL mice [17].
As a follow-up study of our previous findings in B6-mtBPL and B6-mtALR mice, we now sought to elucidate further consequences of the single nucleotide difference in mtDNA variants in complex I, which putatively influences the lifespan and glucose metabolism, with a specific focus on the gut microbiota.

2. Results

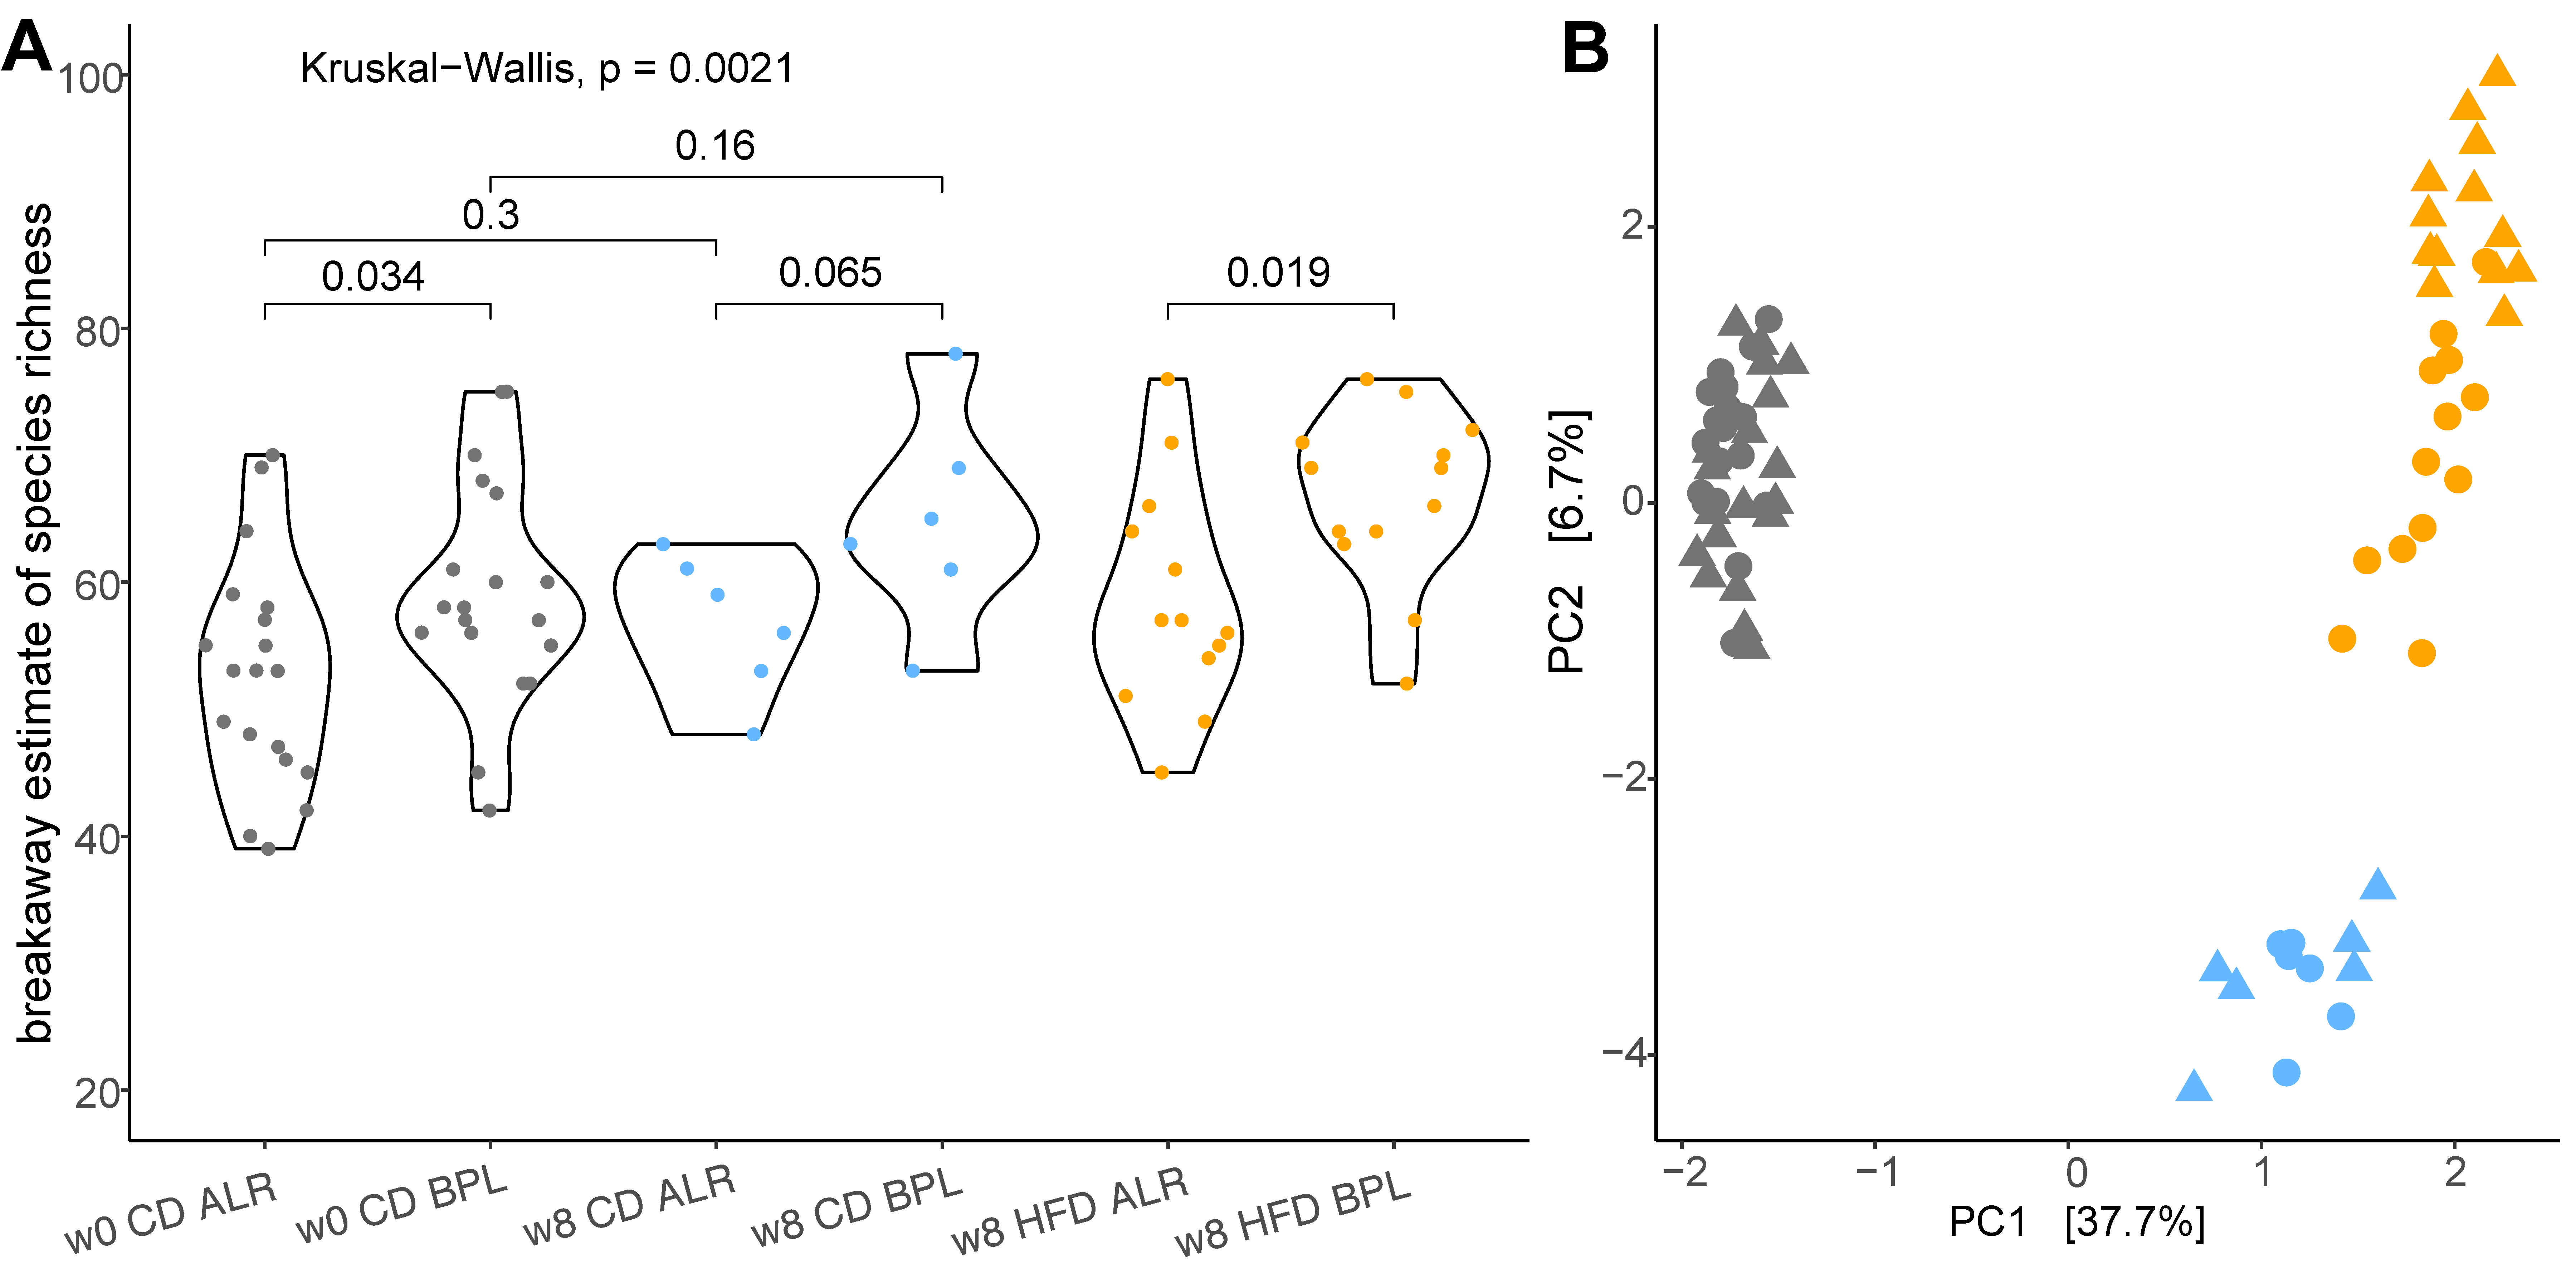
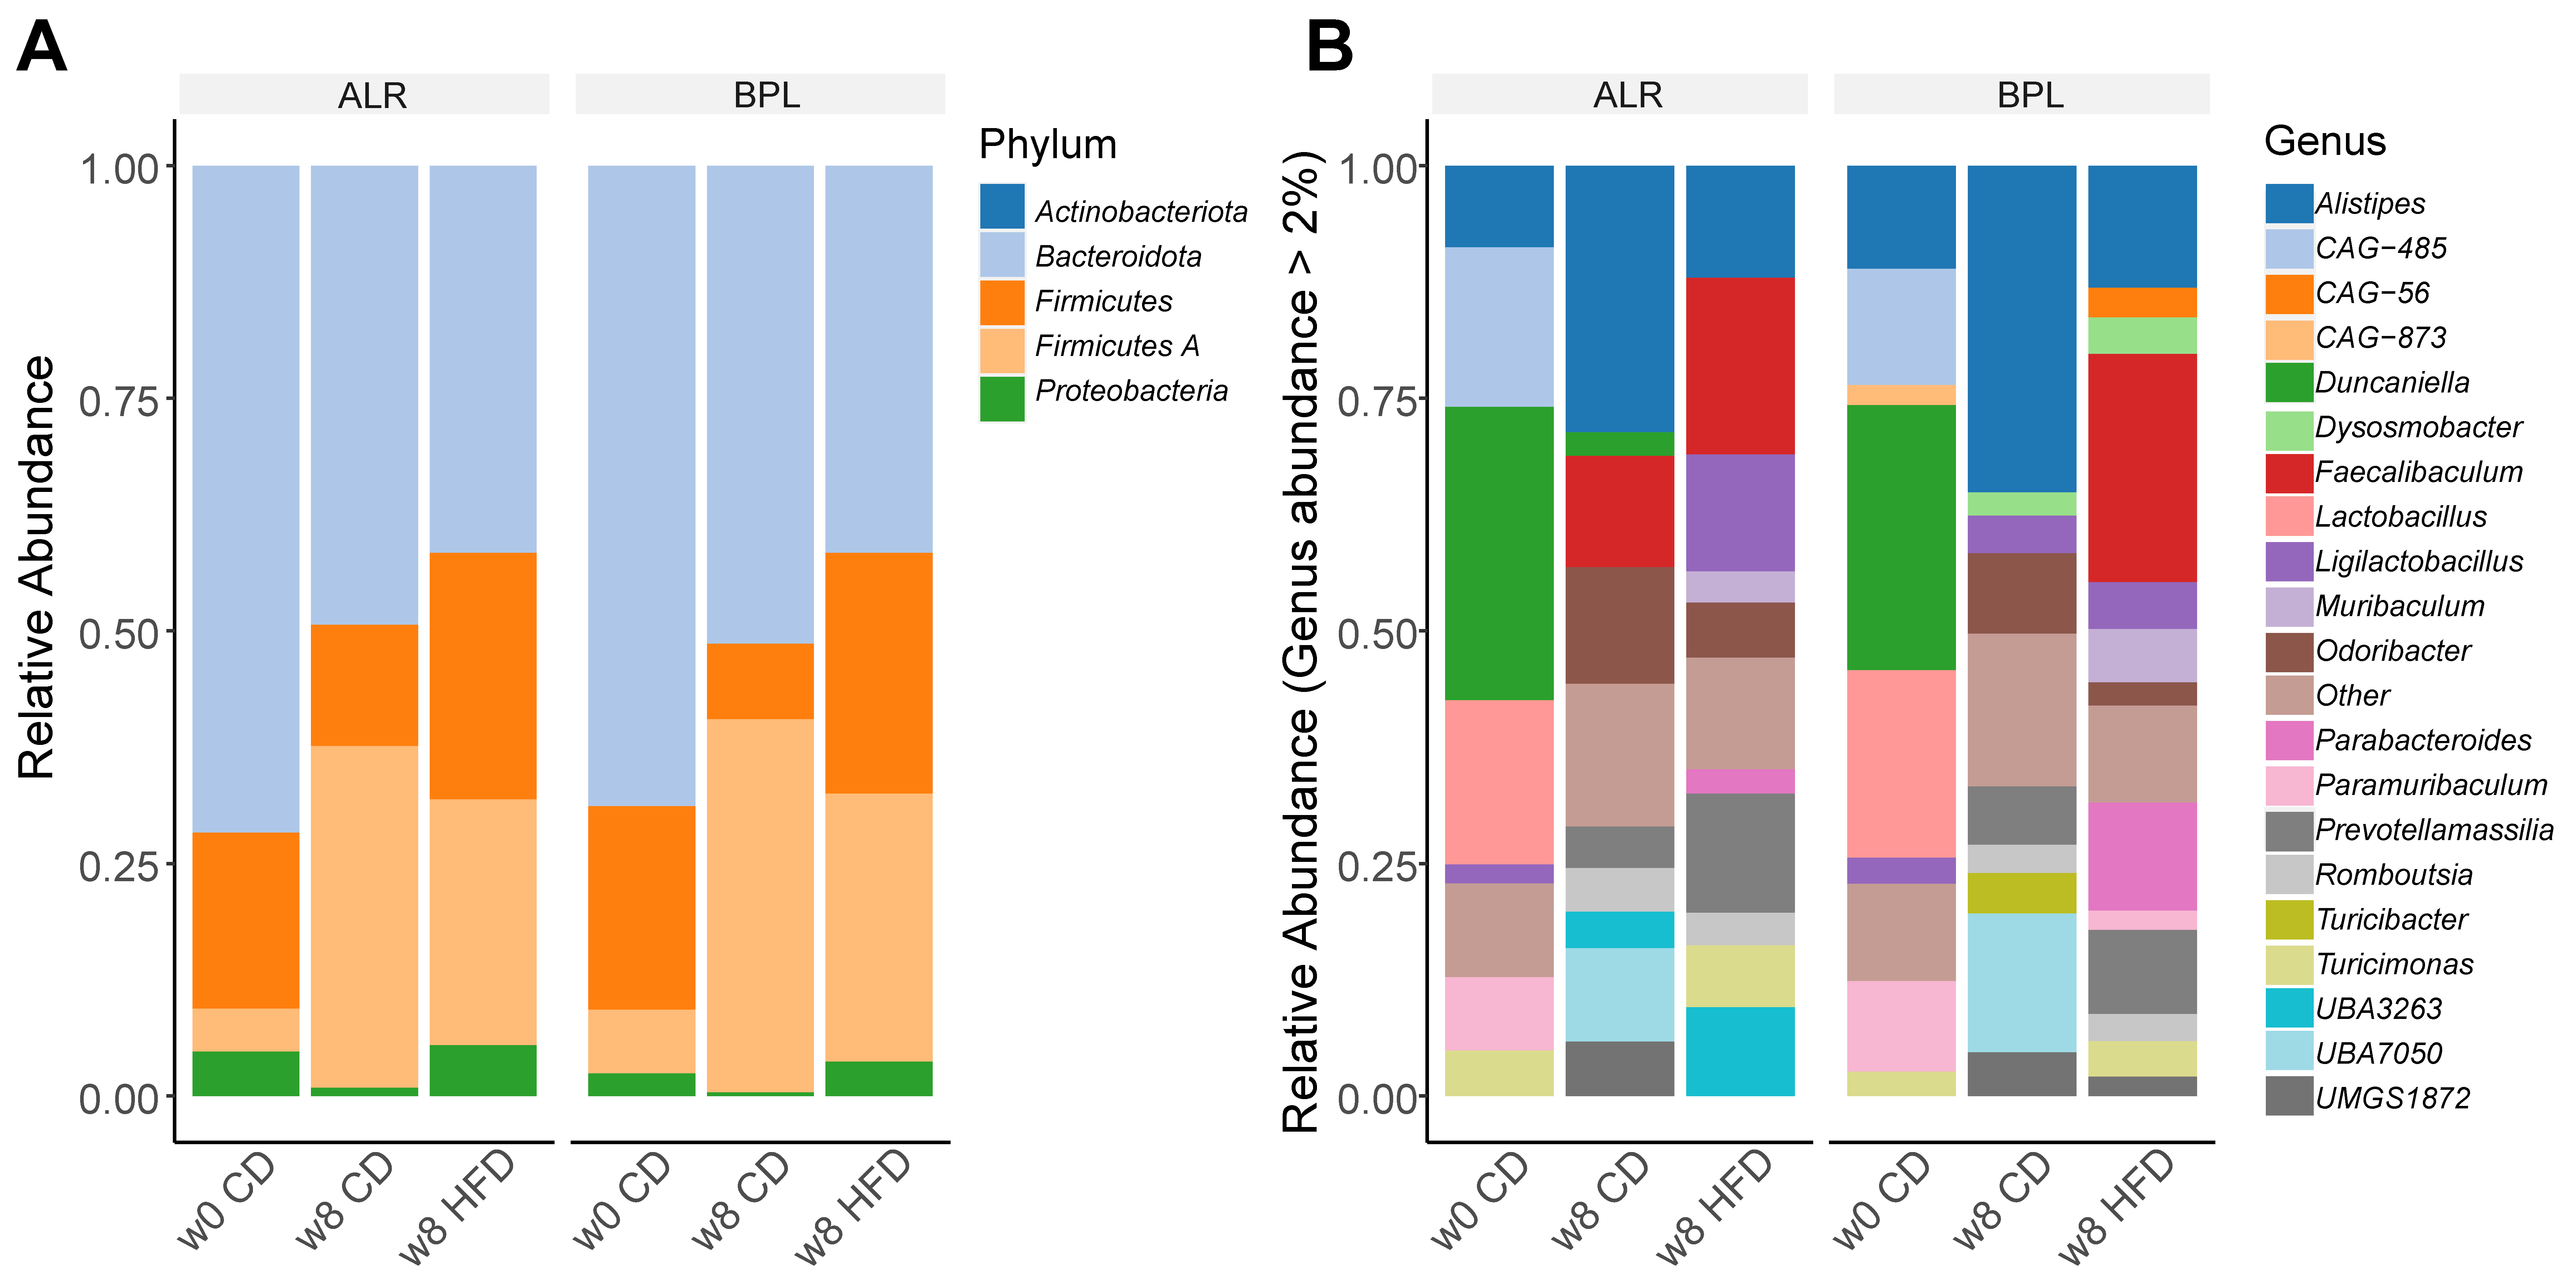
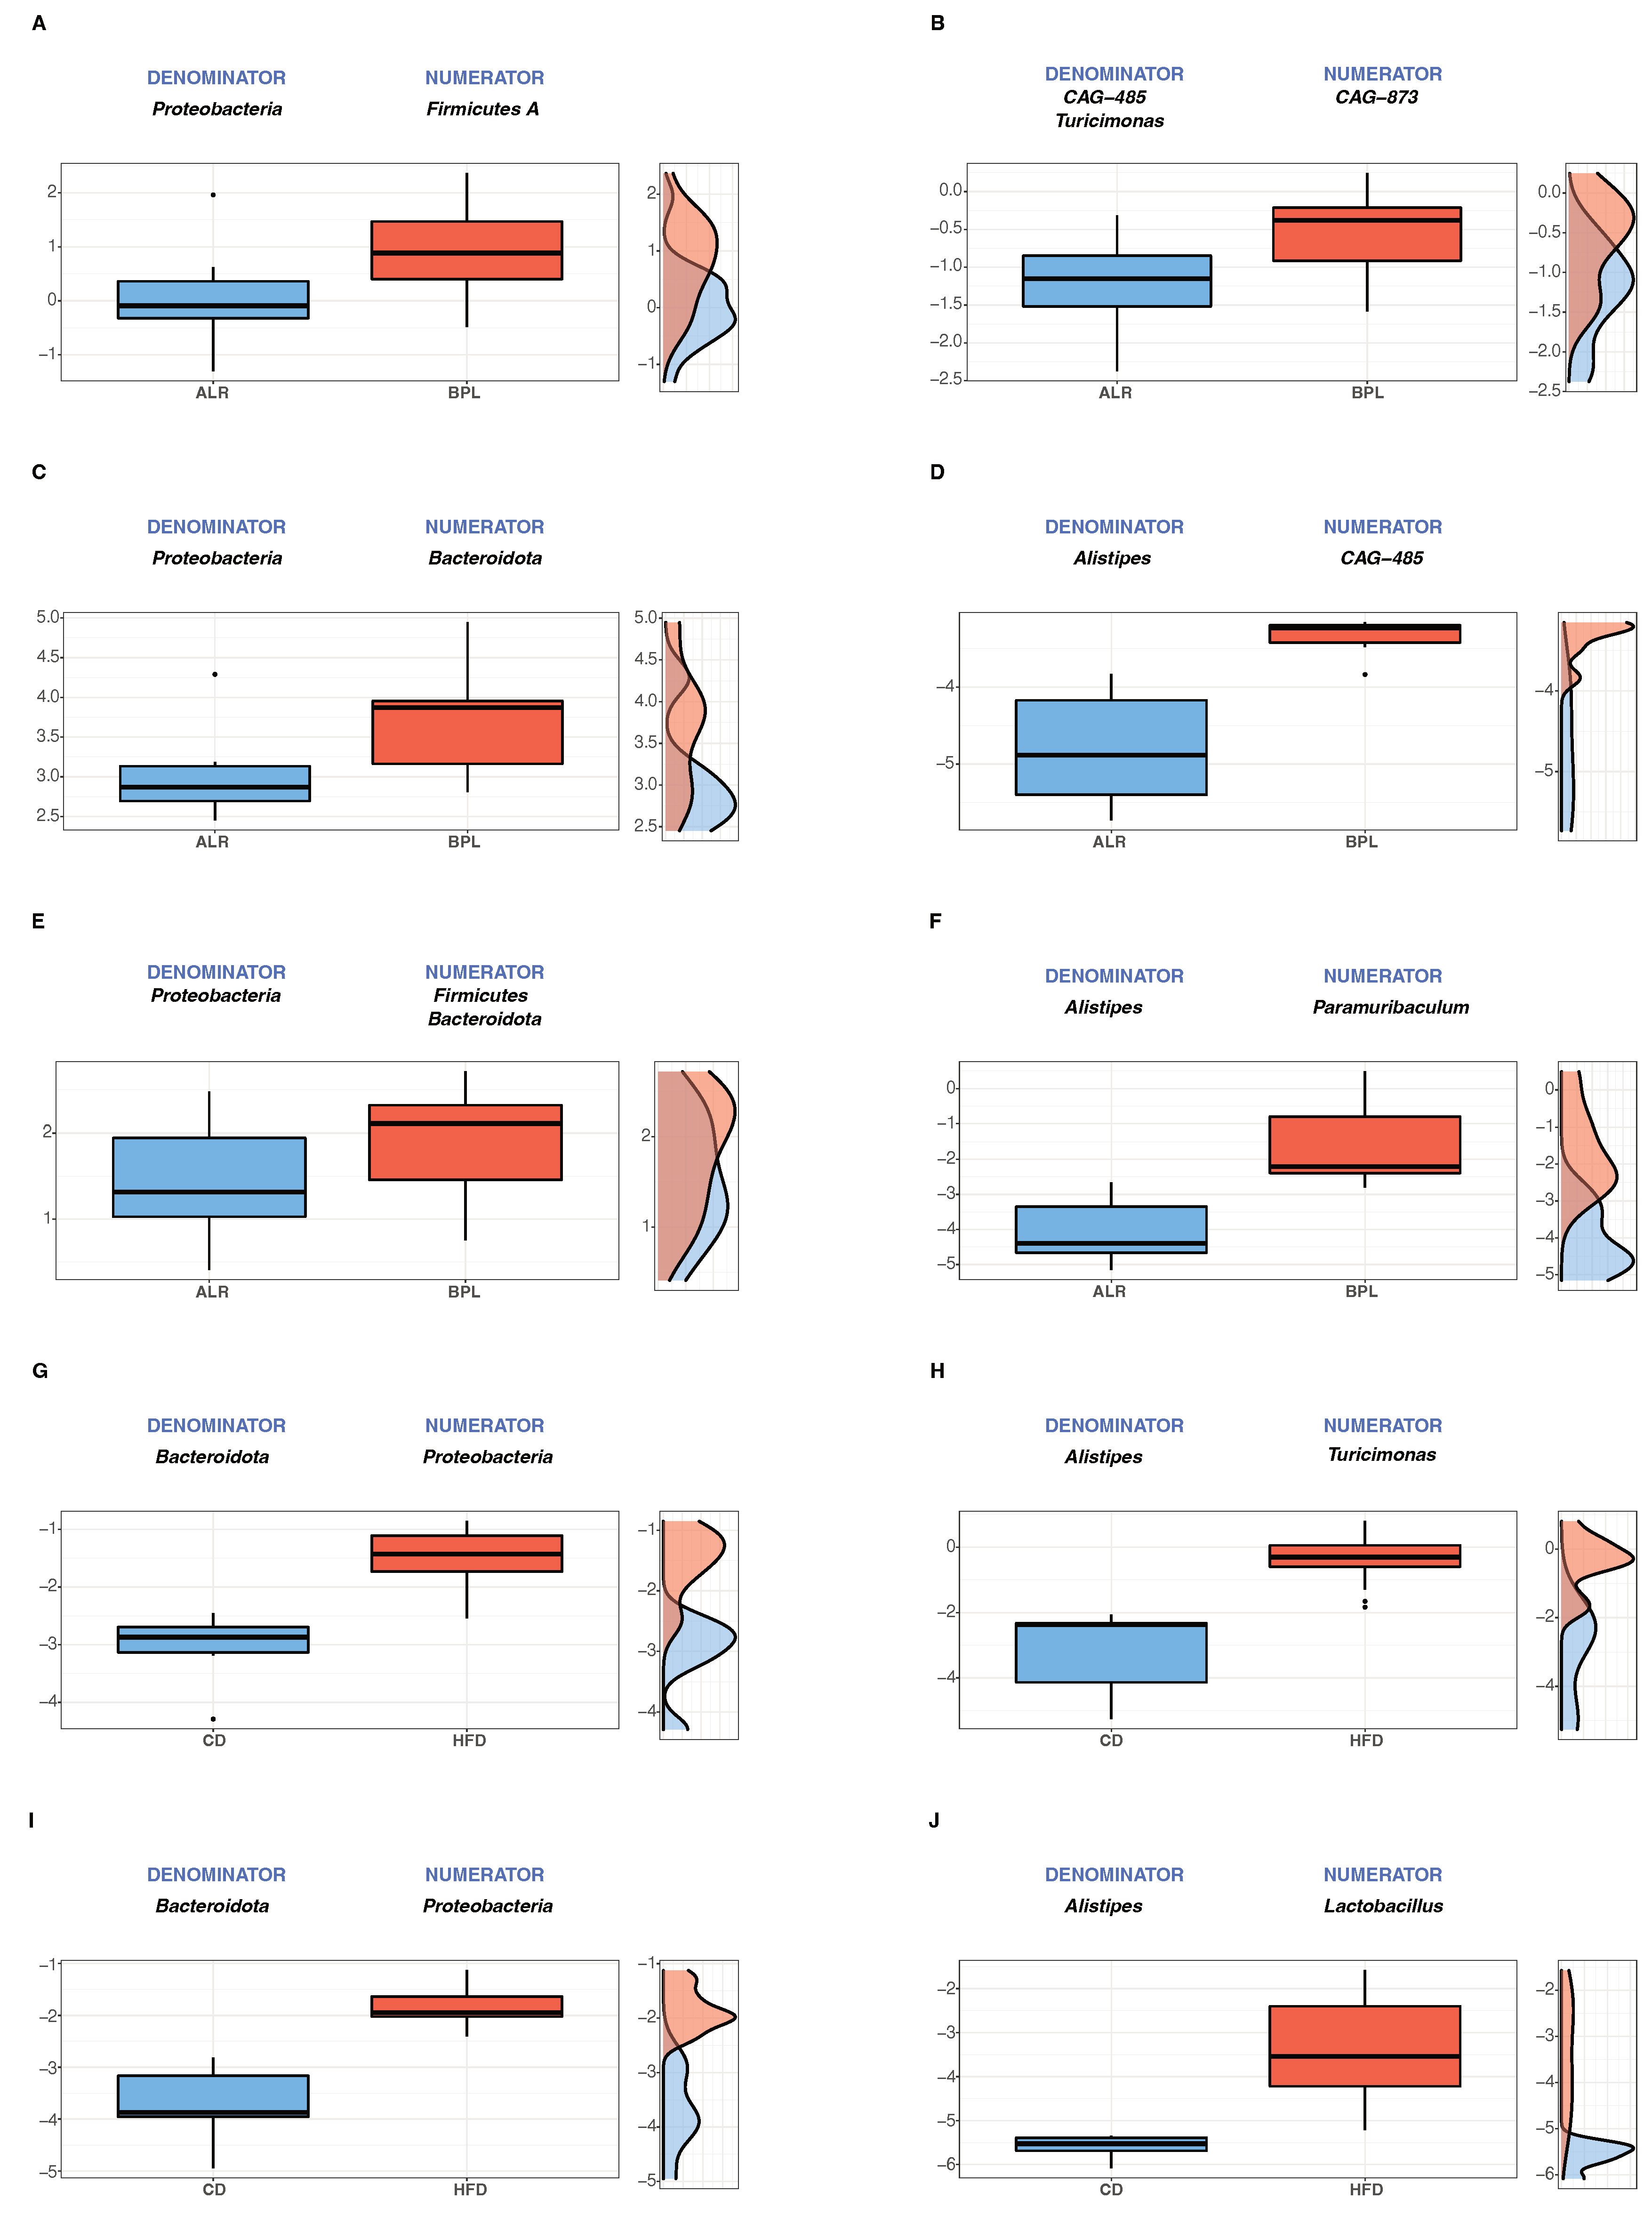
2.1. Proteobacteria, a Marker for Host Health, were Differently Abundant in B6-mtBPL Mice Compared with B6-mtALR Mice

The mouse groups used in this study were summarised in Table S1. A total of 13 mice were fed with high-fat diet (HFD) and 6 mice with control diet (CD) in each of B6-mtBPL and B6-mtALR mice for 8 weeks. Stool samples from these mice were collected before dietary intervention (week 0) and at the end of the experiment (week 8) and on average 10,366 (s.d. ± 3178) contigs were used per sample after processing the data (min: 3899; max: 17,908).
Bacterial DNA isolated from stool samples were analysed for estimated bacterial richness by alpha diversity, and the difference of the gut bacterial community composition was evaluated by beta diversity. No correlation between sequencing depth and species richness was detected (linear regression: p = 0.0756, R2adj = 0.0214). Alpha diversity showed a general trend towards higher species richness of gut bacteria in B6-mtBPL mice compared to B6-mtALR mice; the difference was significant and more prominent when mice were on HFD (p = 0.019; Figure 1A). The same was observed for the Shannon index (week 8 B6-mtBPL vs. B6-mtALR: p = 0.034, Figure S1). Absolute species turnover, a measure of beta diversity, was estimated using an Aitchison distance matrix and showed significant differences between strains (PERMANOVA, p = 0.0007, R2 = 0.0355), and time of sampling (week 0 vs. week 8: p = 1.0 × 10⁻⁵, R2 = 0.3654) (Figure 1B). Additionally, the interaction of strain and diet was found to be significantly different as well (p = 1.0 × 10⁻⁵, R2 = 0.0949).
Next, we compared the taxonomic abundances at the phylum and the genus levels for the two strains and differently diet-fed groups (Figure 2, Figure S2, Table 1). At the phylum level, we found that Proteobacteria phyla were significantly lower in B6-mtBPL compared to that in B6-mtALR in all conditions studied (fdr < 0.05), i.e., before the dietary change (week 0; Figure S2A), after 8 weeks of CD feeding (Figure S2B), and after 8 weeks of HFD feeding (Figure S2C). This phylum was significantly increased by HFD in both strains (Figure S2D,E). Upon the HFD feeding, six bacterial genera, namely Alistipes, Duncaniella, Odoribacter, UMGS1862, CAG-873 and Acutalibacter were all significantly reduced in abundance in both mouse strains (fdr < 0.05; Table 1). In B6-mtBPL mice, regardless the diet type (i.e., both CD and HFD), one bacterial genus called UBA3263 (former Porphyromonadaceae bacterium) was significantly less abundant compared to B6-mtALR mice in the respective diet group (HFD, p = 1.1092 × 10⁻²¹, effect size = −2.0279; CD, p = 1.1536 × 10−08, effect size = −1.1879). At the same time, the abundance of UBA3263 was significantly increased in B6-mtALR mice when they were fed with HFD (p = 1.8992 × 10⁻¹⁰, effect size 1.5843), albeit this phenomenon was absent in B6-mtBPL (Table 1).
To further analyse microbial signatures in relation to phenotypes and to consider the compositional nature of microbiome data, we calculated balances of bacterial taxa, using a greedy stepwise algorithm (selbal) with 5-fold cross validation. This method estimates the optimal number discriminating taxonomic groups and the ratio of these taxonomic groups (named as ’’denominator’’ and ‘’numerator’’), and then defines the balance between the microbial characteristics that best describe the differences of the compared phenotypes. Before dietary change (week 0), the estimated differential balance of bacteria between B6-mtALR and B6-mtBPL mice (Figure 3A) resembled the results of the differential abundance analysis, i.e., B6-mtBPL mice have a higher/lower abundance of Firmicutes A/Proteobacteria than B6-mtALR (Figure S2A). The discrimination value of this comparison (mean area under the ROC curve; AUC) was 0.809, suggesting a high accuracy of the estimate. For mice CD-fed for 8 weeks, the balance between Proteobacteria (assigned as denominator) and Bacteroidota (assigned as numerator) was evaluated between B6-mtBPL and B6-mtALR mice at the phylum level (Figure 3B). An increase in the phylum Proteobacteria in B6-mtALR and a higher abundance of phylum Bacteroidota in B6-mtBPL were observed (AUC = 0.778; Figure 3C). At the genus level, Alistipes and CAG-485 were the most discriminating taxa, in B6-mtALR and B6-mtBPL, respectively (AUC = 1.000 Figure 3D). For the HFD-fed mice at week 8, the global balance of the phylum Proteobacteria (denominator) and a group of phyla consisting of Bacteroidota and Firmicutes (numerator) changed towards a higher balance of Proteobacteria in B6-mtALR mice, while the numerator phylum was higher in B6-mtBPL mice (AUC = 0.751; Figure 3E). At the genus level, Alistipes (B6-mtALR) and Paramuribaculum (B6-mtBLP) showed the best discrimination between strains (AUC = 1.000, Figure 3F). When compared with CD-fed and HFD-fed groups, Bacteroidota and Proteobacteria were the best discriminating phyla for CD-fed group and HFD-fed group, respectively in each strain (B6-mtALR AUC = 1.000, Figure 3G; B6-mtBPL AUC = 1.000, Figure 3I). At the genus level, Alistipes was best discriminating and more abundant compared with respective numerator taxa in CD-fed mice in both B6-mtALR and B6-mtBPL strains. Turicimonas was found to be high B6-mtALR mice on HFD, whereas Lactobacillus was higher abundant in HFD-fed B6-mtBPL (B6-mtALR AUC = 1.000, Figure 3H; B6-mtBPL AUC = 1, Figure 3J).

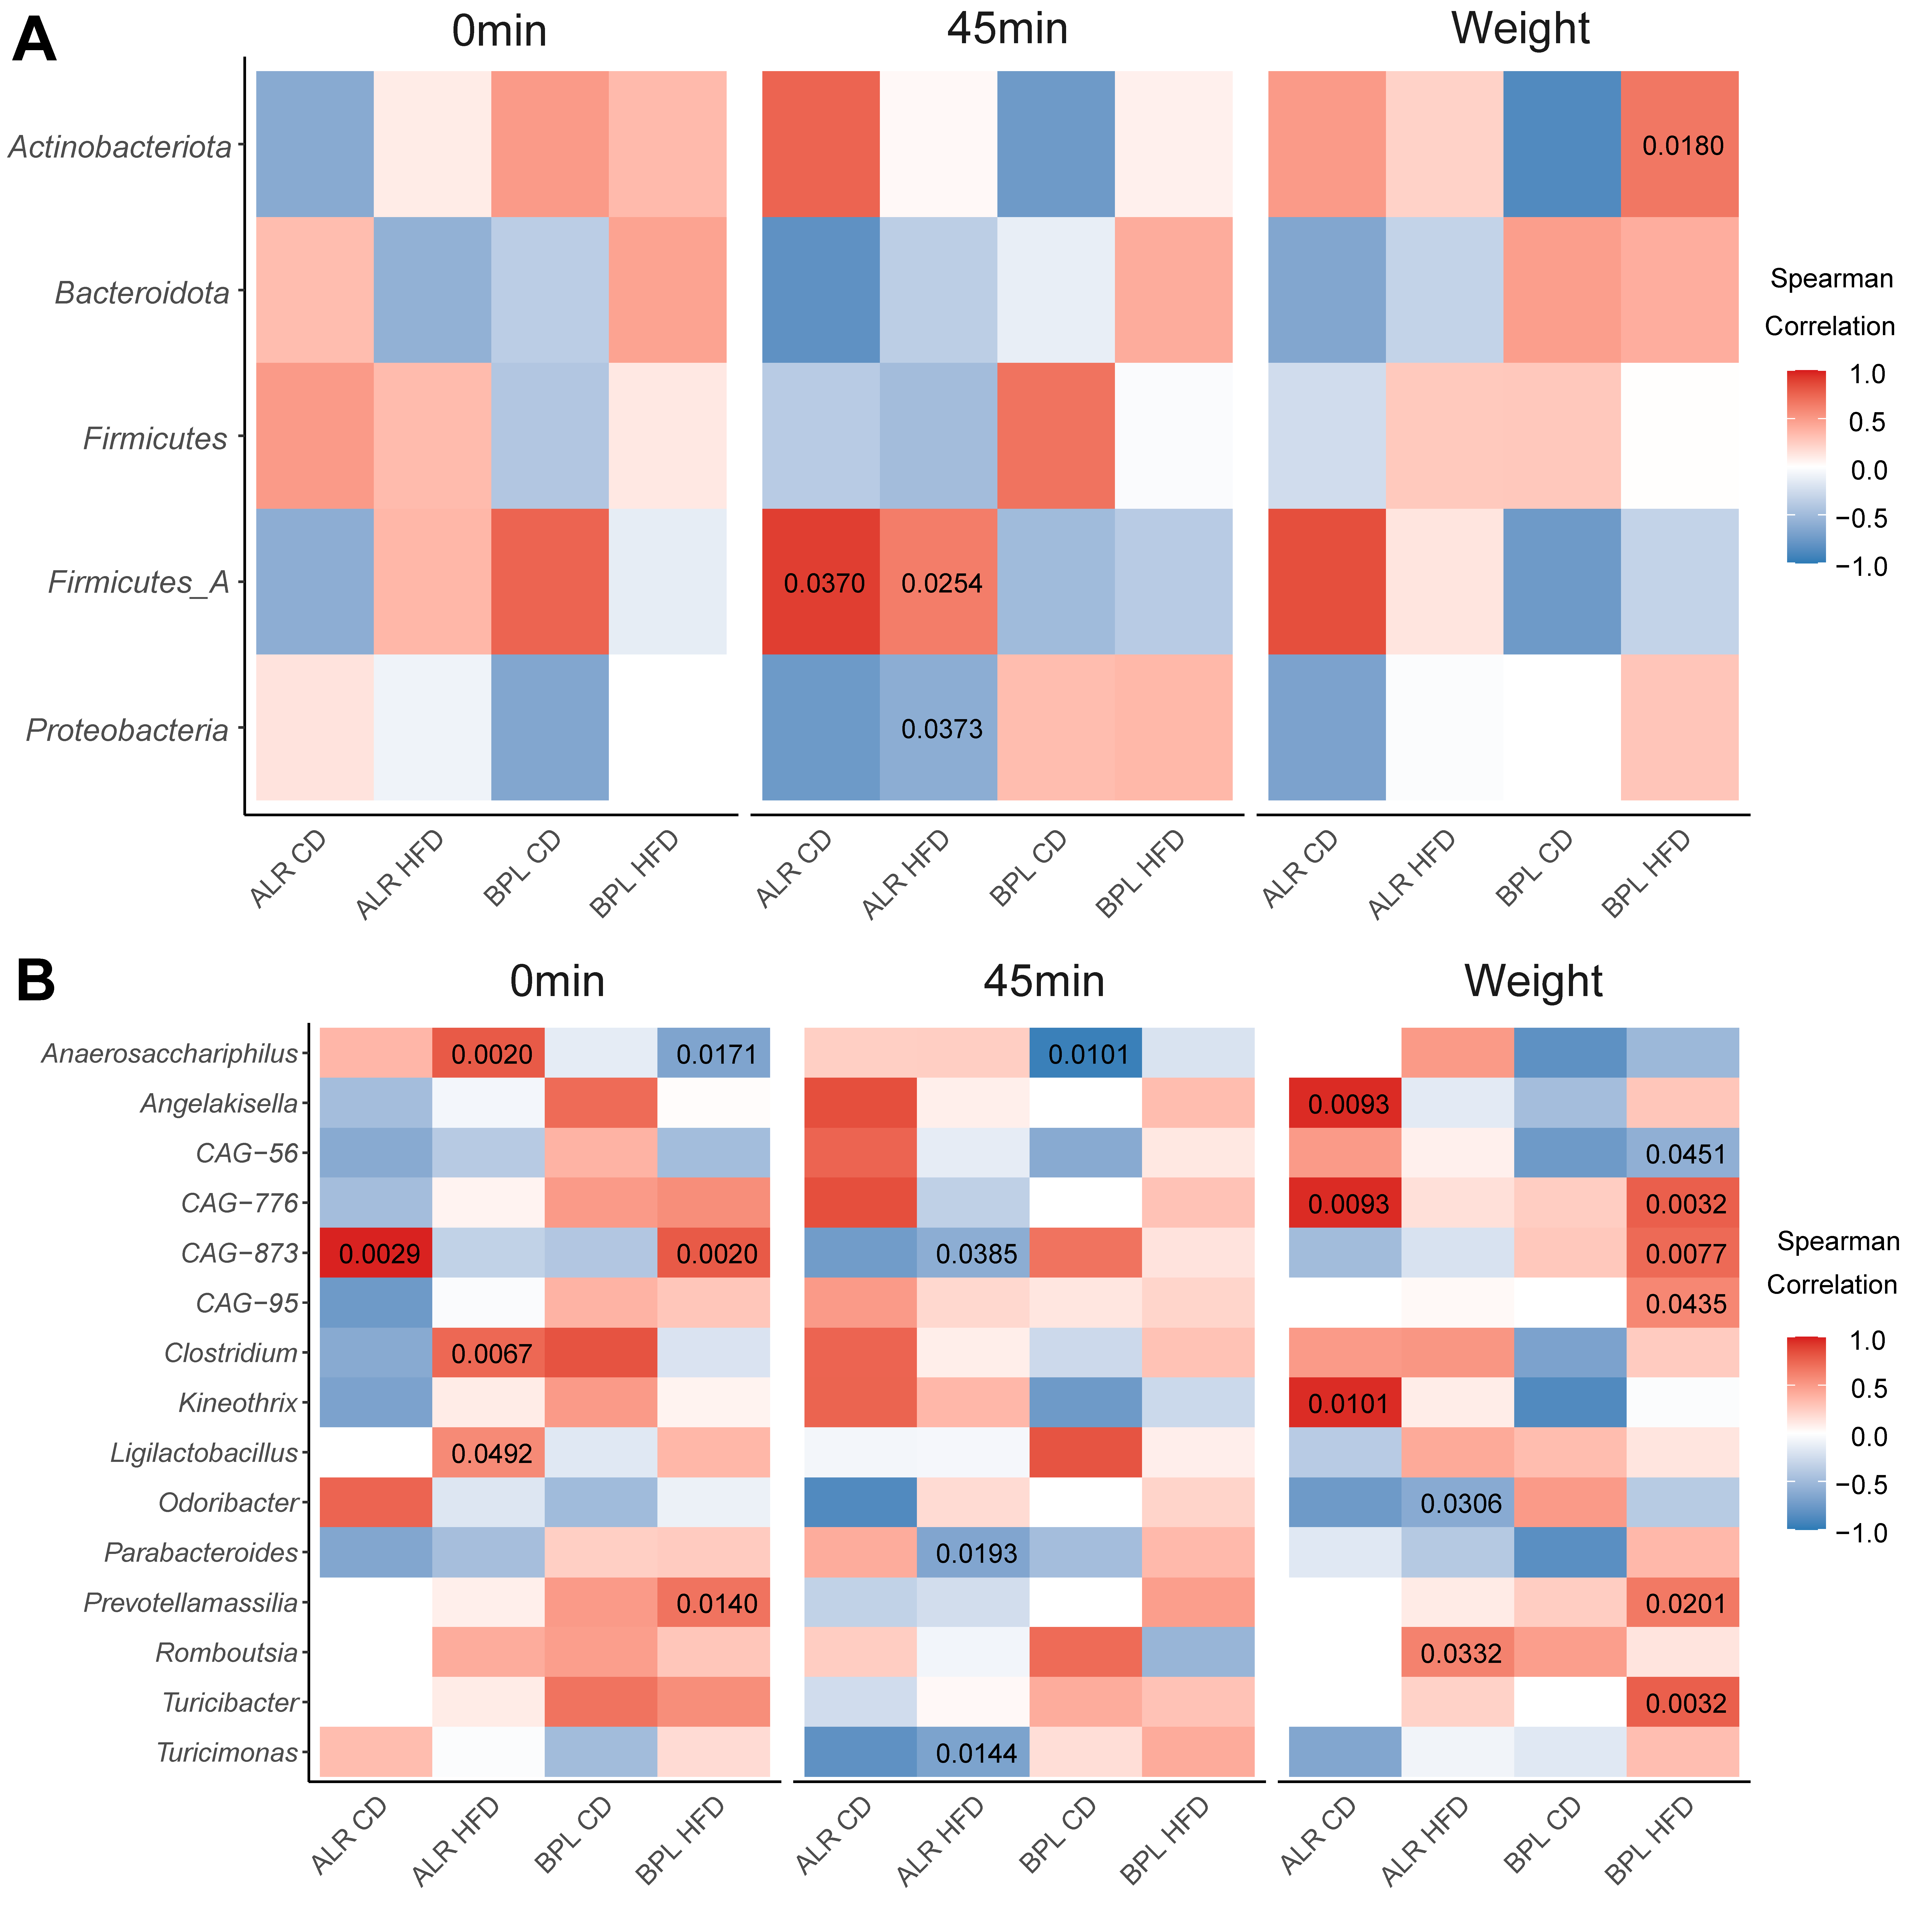
2.2. Correlation between the Abundance of Commensal Bacteria and Alteration in Metabolic Parameters upon the Dietary Metabolic Stress

To evaluate whether identified differences in the abundance of bacteria were associated with metabolic parameters observed in these mice, we conducted a correlation analysis between metabolic parameters and the abundance of gut bacterial taxa in each individual. The summary of the metabolic phenotype data is presented in Figure S3.
After 8 weeks of dietary stress, glucose metabolism was evaluated by intraperitoneal glucose tolerance test (ipGTT) and body weight was measured in the mice. From the collected data, the fasting glucose values (mmol/L), the glucose levels at 45 min of the ipGTT, and body weight were selected for the correlation analysis. The glucose levels at 45 min of ipGTT was selected for the correlation analysis as this was the time point with the most prominent and significant difference between HFD-fed and CD-fed mice groups (Figure S3A,B).
First, to evaluate whether the abundance of specific bacterial phylum and/or genus correlating with respective metabolic phenotype are commonly shared in all mice, we looked for the similar trends of correlation in all four groups, i.e., bacterial abundance correlation with the similar colours within a bacterial genus in each heat map. There were no bacterial phyla and/or genera that had a similar impact (i.e., negative or positive correlations) in fasting glucose (0 min) levels the glucose levels at 45 min after the glucose injection in ipGTT (Figure 4A).
When we looked for strain-specific and/or non-diet-specific correlations, Prevotellamassilia showed significant positive correlations with fasting glucose levels and with body weight in HFD-fed B6-mtBPL mice (Spearman’s rho = 0.6849 and p = 0.0140, rho = 0.6579 and p = 0.0201, respectively) and weak positive correlations in CD-fed B6-mtBPL mice (rho = 0.5000 and p = 0.3910, rho = 0.2500 and p = 0.6850, respectively; Figure 4B). A positive, but non-significant correlation of Prevotellamassilia with glucose levels at 45 min after glucose injection was also observed in B6-mtBPL mice (HFD-fed, rho = 0.4811 and p = 0.1133; CD-fed, rho = 0.0 and p = 0.1; Figure 4B) yet this was absent in both HFD-fed nor CD-fed B6-mtALR mice.
A strong correlation between ipGTT response after 45 min and the phyla Firmicutes A, as well as Proteobacteria, was identified in CD-fed and HFD-fed B6-mtALR mice (Firmicutes A: CD-fed p = 0.0370, HFD-fed p = 0.0254, Proteobacteria: CD-fed p = 0.1417, HFD-fed p = 0.0373). These correlations were inversed, but were not significant in the respective groups of the B6-mtBPL mice.

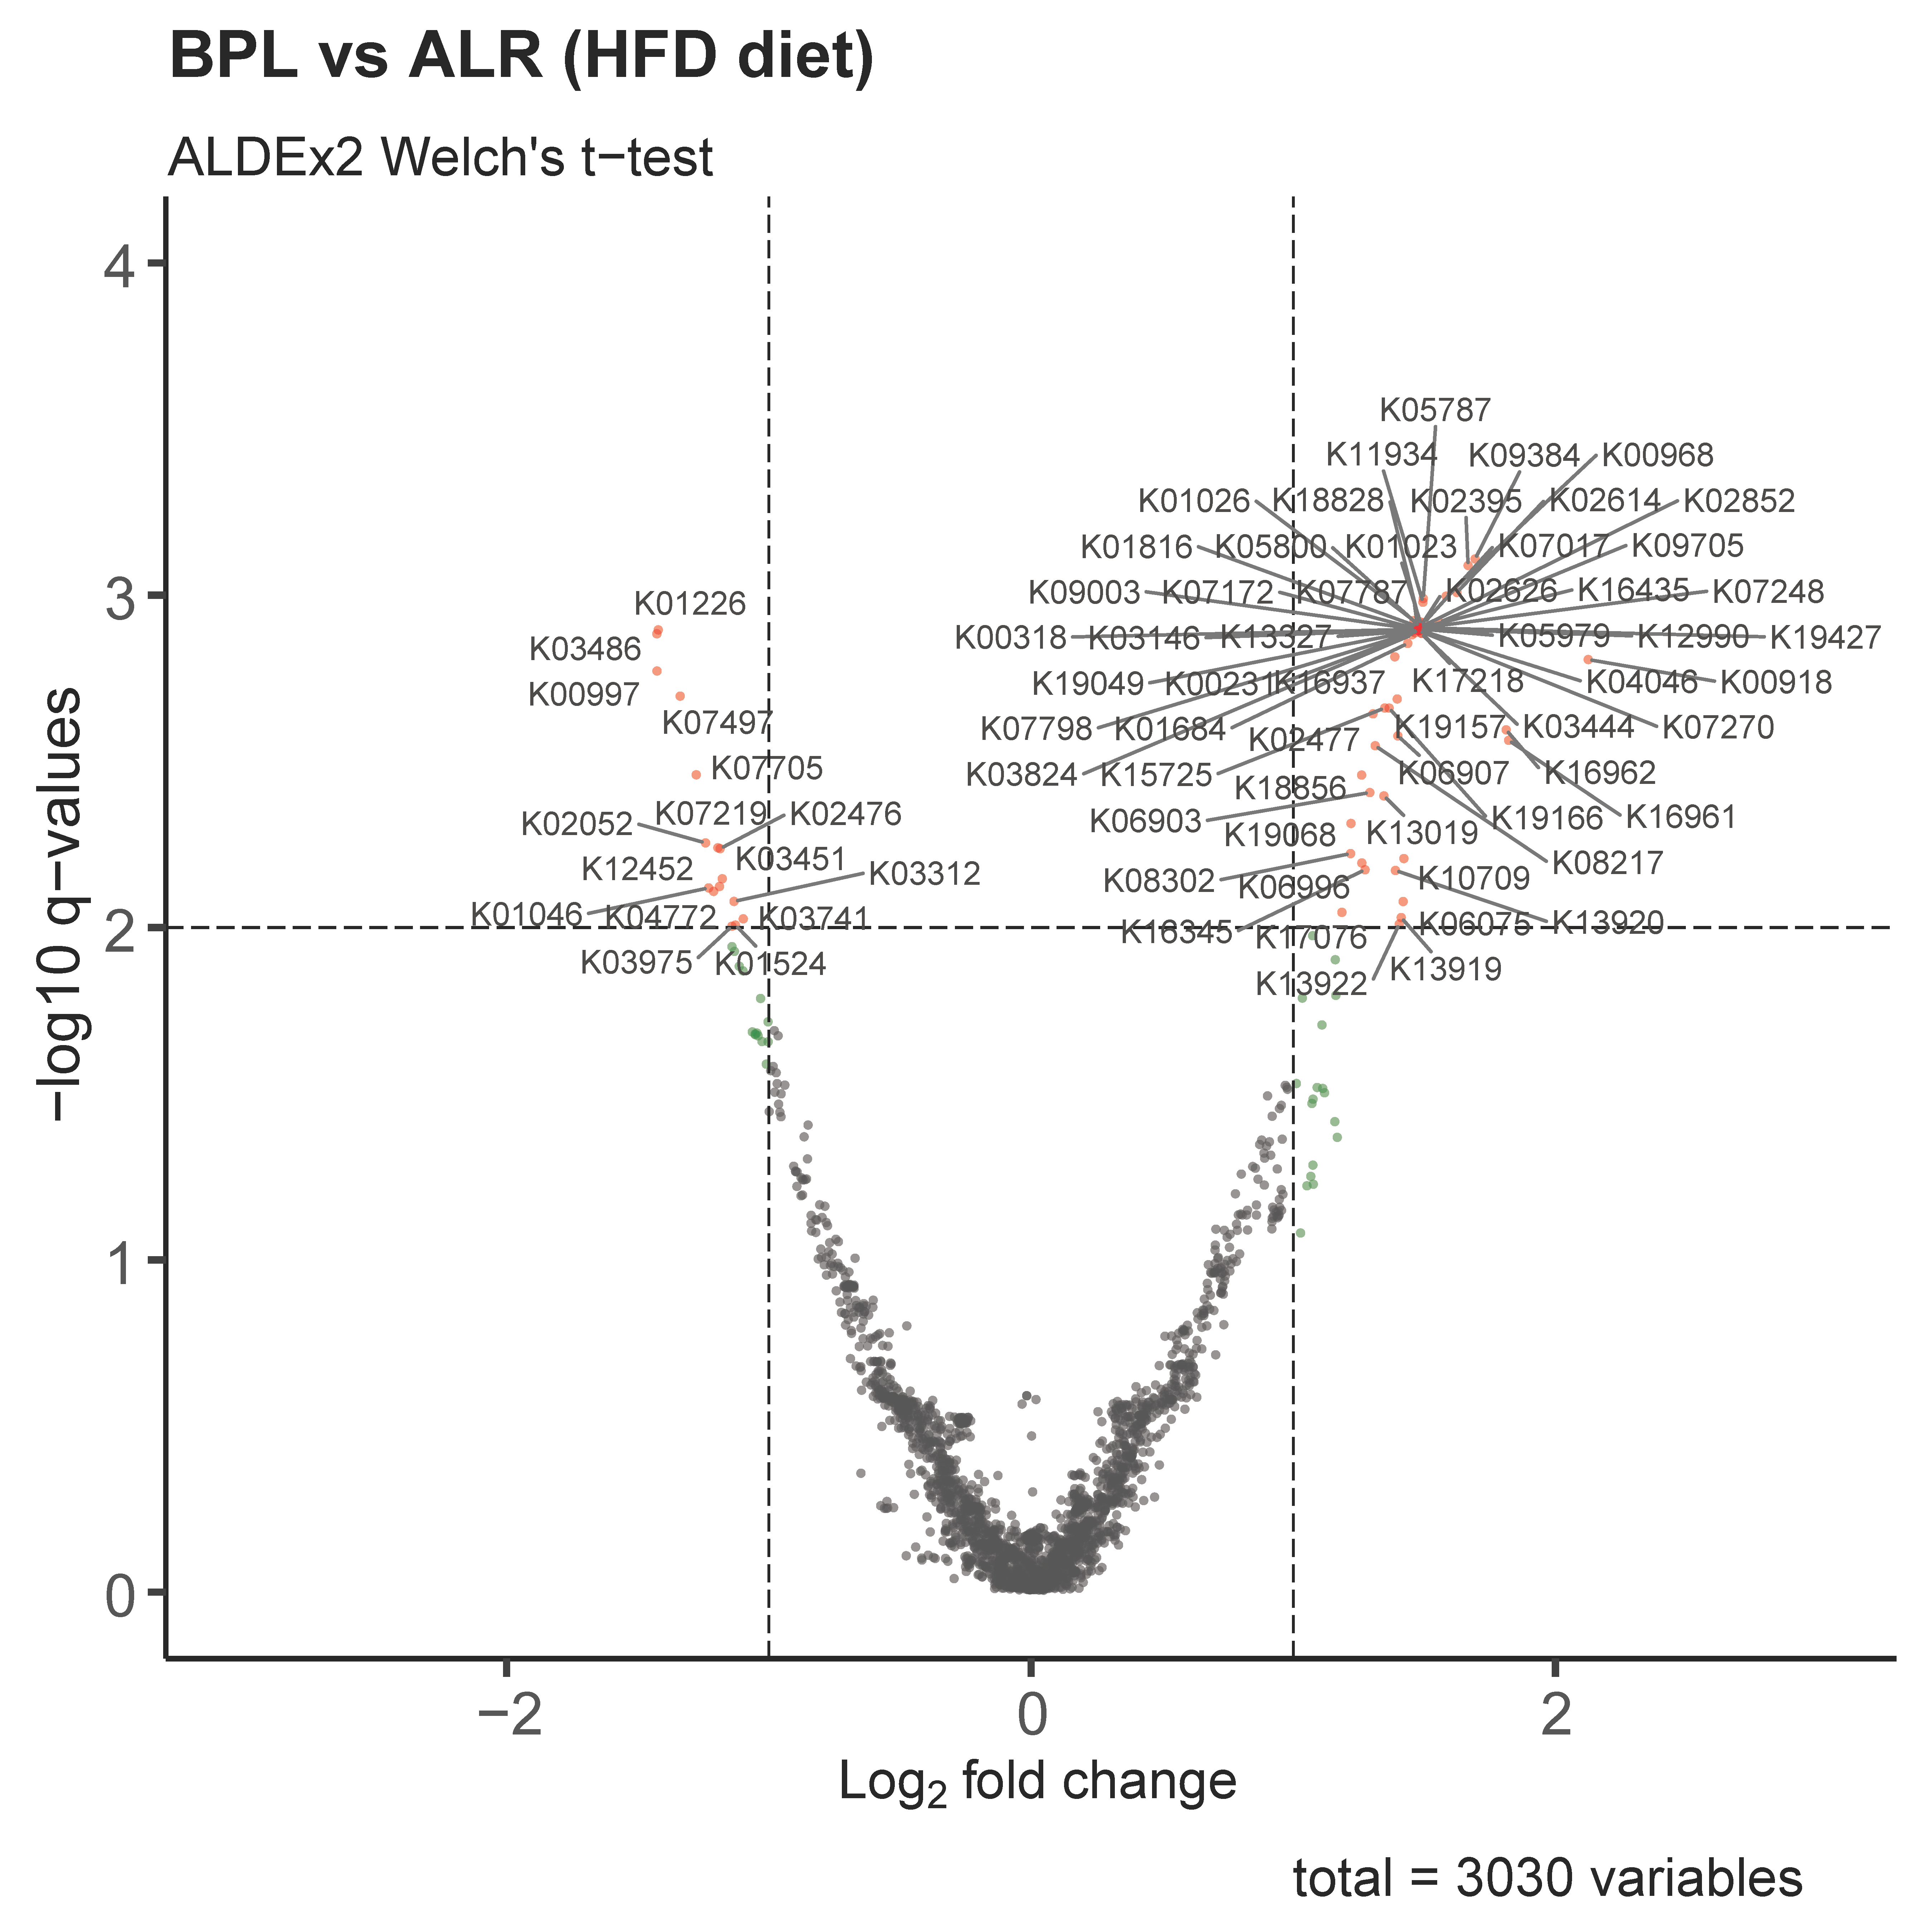
2.3. Functional Profiles of Differentially Abundant Gut Bacteria between HFD-fed B6-mtBPL and B6-mtALR Revealed Significant Involvement of Glucose Metabolism in Gut-Microbially Derived Pathways

To evaluate the functional relevance of the differentially abundant bacterial taxa between the two strains upon dietary intervention, we predicted functional profiles using PICRUSt2 and conducted differential abundance analysis of the identified KEGG gene orthologues of the gut microbiota between B6-mtBPL and B6-mtALR mice fed with HFD over 8 weeks. By this analysis, we observed 16 KEGG gene orthologues (across 9 unique pathways) that were upregulated in HFD-fed B6-mtALR and 58 KEGG terms (across 32 unique pathways) that were found to be upregulated in HFD-fed B6-mtBPL mice (Figure 5, Table S2). Of the latter 58 KEGG gene orthologues, the ADP-dependent phosphofructokinase/glucokinase (K00918) was most positively involved in HFD-fed B6-mtBPL mice (effect size 2.1382; q = 0.0013). Among the 15 KEGG gene orthologues upregulated in HFD-fed B6-mtALR mice, triacylglycerol lipase (K01046), which is involved in glycerolipid metabolism, was significantly altered (effect size −1.2237; q value = 0.0075).
We next revisited our previously published liver transcriptomics data of intact B6-mtBPL and B6-mtALR mice in the search for relevant pathways and cellular processes associated with the differentially abundant bacteria profiles [17]. In B6-mtBPL mice, biological processes, cellular components, and molecular functions, including response to insulin (p = 0.0019), hexose and glucose transmembrane transport (both p value = 0.0050), cellular response to insulin stimulus (p = 0.0086), regulation of insulin secretion involved in cellular response to glucose-to-glucose stimulus (p = 0.0090), and insulin receptor substrate binding (p = 0.0135) were upregulated compared with B6-mtALR mice. Additionally, ATP-binding cassette (ABC) transporter genes, particularly the lipid transporters, i.e., Abca6, and Abca8b, were significantly upregulated in B6-mtBPL compared with B6-mtALR (p = 2.989 × 10⁻⁶ and 0.0016, respectively).

3. Discussion

The impact of natural variations of mtDNA on various health and disease phenotypes, including lifespan and chronic inflammatory disease susceptibility has been explored [8,9,11,17,18]. Regardless of the position of the mtDNA variants, the functional consequences of such variants (e.g., mitochondrial functions, such as ATP production, mitochondrial ROS production, and mitochondrial OXPHOS enzymatic activities) were very mild in steady-state, particularly when compared to the effects of the classical deleterious mtDNA mutations. Despite these facts, mice carrying such natural mtDNA variants consistently showed clear phenotypic differences compared with their respective genetic control/reference strains [8,9,11,17].
One of the potential contributions of such mtDNA variants to the effects on observed phenotypes involves interactions with gut microbiota. Previously, our group and others demonstrated that pathological mutations or natural variants in mtDNA are associated with distinct patterns of the gut microbiota [14,15]. One report demonstrated that the mitochondrial ROS levels correlated with the diversity of the gut microbiota, in other words, mtDNA genotypes, which clearly showed increased mitochondrial ROS levels, were associated with less diversity of the gut microbiota composition [15]. Here, we focused on the analysis of mtDNA variants that cause only mild mitochondrial functional differences.
Recently, we reported that single nucleotide variant differences of mtDNA, natural polymorphisms in mitochondrial complex I, were associated with lifespan differences and differential response to metabolic stress, when comparing B6-mtBPL and B6-mtALR mice. Since mitochondrial functional differences were minor between mice carrying the natural mtDNA variants in unchallenged or unstressed conditions, we induced diet stress and analysed the ensuing gut microbiota composition in the B6-mtBPL and B6-mtALR mice. In B6-mtBPL, the abundance of one bacterial phylum, Proteobacteria, was significantly less compared to B6-mtALR mice, when the mice were fed with CD, as well as with HFD. Upon the HFD feeding, we observed higher abundance of Proteobacteria compared with CD-fed groups in both strains, suggesting that this bacterial phylum may be an indicator for diet-induced obesity. Interestingly, a Proteobacterial load is known to be positively associated with metabolic disorders [19] and ageing [20]. This is in line with our phenotype observation in B6-mtBPL mice, i.e., more resistant to metabolic stress and a longer lifespan, when compared with B6-mtALR mice. We have previously demonstrated that this natural mtDNA variant difference results in lower levels of tryptophan (Trp) in the B6-mtBPL compared to the B6-mtALR variant. Interestingly, Proteobacteria and four other phyla have been predicted to have a higher potential to metabolise Trp [21]. Hence, the single mtDNA variant difference putatively causes a Trp-diminished environment for the gut microbiota. The specific bacteria taxa that rely less on exogenous Trp thus thrive, while taxa that require supplementation of Trp may struggle to maintain their position in the gut microbiota. Yet, experimental confirmation is required to prove this phenomenon.
UBA3263 (Porphyromonadaceae bacterium UBA3263), which was found to be less abundant in B6-mtBPL mice than B6-mtALR mice, regardless of diet type, showed even more increased abundance in B6-mtALR mice under HFD conditions. This taxon is reportedly negatively correlated with glucose metabolism [22].
When we conducted the correlation analysis between bacterial abundance and metabolic parameters, we observed that the abundance of Prevotellamassilia was significantly positively correlated with the fasting glucose levels and body weight exclusively in HFD-fed B6-mtBPL mice. While no significant differences in abundance of Prevotellamassilia was observed between the strains, the selective correlations in HFD-fed B6-mtBPL mice may point towards an interaction of mtDNA variants and gut microbiota affecting the observed changes in metabolic parameters in these mice.
Furthermore, predictive analysis of the functional profiles of the bacteria exhibited differential abundances of microbiota between the two mouse strains. This analysis predicts orthologues gene identifiers (K numbers, e.g., K00918 and K16961) from the differential abundances found in the bacterial sequencing data (ASV). It further allows the prediction of differentially regulated pathways based on the bacterial abundance between the compared groups. In B6-mtBPL mice, 58 bacterially encoded genes and 32 potential pathways were upregulated, while 16 bacterially encoded genes and 9 pathways were downregulated when compared with B6-mtALR mice under HFD stress. Among the identified upregulated genes in B6-mtBPL mice, the ADP-dependent phosphofructokinase/glucokinase gene was the most abundant. Accordingly, glucose metabolism (i.e., glycolysis and gluconeogenesis) was shown to be the most upregulated, hinting at a potential impact on glucose metabolism in the gut of these mice. Meanwhile, we revisited our previously reported whole transcriptomics data of liver samples from intact B6-mtBPL and B6-mtALR mice and found that cellular processes such as insulin response and glucose/hexose metabolism were significantly upregulated in B6-mtBPL mice compared to B6-mtALR mice. Importantly, both intact B6-mtBPL and B6-mtALR mice do not present any metabolic dysfunction and disorders under the normal housing condition, despite their differential profiles in the transcriptomics analysis. Therefore, the secondary metabolic stress, in our case HFD feeding, augmented the host glucose metabolism by modulating the gut microbial composition to become resistant to metabolic stress in B6-mtBPL mice, but not in B6-mtALR mice. This may be the same for ageing stress, i.e., functional changes in gut microbiota in aged B6-mtBPL may have a protective effect on the lifespan of B6-mtBPL mice.
Taken together, we provide the first evidence explaining the impact of a single mtDNA natural variant on both host and their intestinal microbial environment, and how these bi-directional changes synergistically alter susceptibility to metabolic and age-related stress, without inducing major changes in mitochondrial functions, e.g., OXPHOS complex activity or mitochondrial reactive oxygen species production, at steady-state. Further studies to identify bacterial species/communities and related bacterial metabolites in individuals with specific mtDNA variants will be required to strengthen the postulated correlation of mtDNA variant-associated common diseases and develop novel therapeutic interventions.

4. Materials and Methods

4.1. Mice, and Stool Sample Collection

Conplastic mouse strains C57BL-mtALR/LtJ and C57BL/6J-mtBPL/1J were generated previously [23]. The detail of these mouse strains and that of high-fat diet feeding experiment are described elsewhere [17]. The mutations in mtDNA of each conplastic mouse strain are presented in Table S3. Three to five mice were housed together in each strain, i.e., male HFD groups, n = 5/cage; female HFD groups, n = 4/cage; male and female CD groups, n = 3/cage. Faecal samples were collected from before feeding experiment starts (week 0), and after 8 weeks diet feeding (week 8). Collected faecal samples were stored at −80 °C until further analysis.

4.2. Bacterial DNA Isolation and Library Preparation and Sequencing for the Bacterial 16S Ribosomal RNA Gene

Bacterial DNA isolation, library preparation and sequencing for the 16S rRNA gene were conducted as previously described [14]. In brief, bacterial DNA was prepared from the faecal samples using a Power Soil DNA Isolation Kit (Qiagen, Hilden, Germany), according to the manufacturer’s instruction. The hypervariable V1-V2 region of the bacterial 16S rRNA gene was amplified by polymerase chain reaction using the 27F/388R primer combination, employing a dual-index strategy. The PCR products were pooled into equimolar subpools, and followed by purification by magnetic beads. The quality of the final library was determined by Agilent 2100 Bioanalyzer, and the quantity was measured by Qubit. The final library was sequenced on the Illumina MiSeq platform using v3 chemistry (600 cycles, Illumina Inc. San Diego, CA, USA).

4.3. Data Process and Analysis

Raw sequence data in fastq format were de-multiplexed, and processed into amplicon sequence variants (ASVs), using DADA2 (v1.20.0) [24]. In brief, the expected error rate was assigned the value 2 for forward reads and the value 3 for reverse reads, which resulted in the selection of a minimum read length of 200 bp. Merged sequences (contigs) were selected between 300 bp and 342 bp. Additionally, chimeric sequences were removed following the DADA2 recommendations. For taxonomic assignment, IdTaxa (DECIPHER package (v2.18.1) [25] with GTDB r202 [26] was used as the reference database. Potential contaminants (e.g., bacteria which do not exist in the gut) were removed, using the frequency and prevalence method as implemented in the R package decontam (v1.10.0) [27], with the threshold set to 0.3 for the frequency method and to 0.5 for the prevalence method, respectively. Eight ASVs were identified as contaminants by the frequency method and were excluded. No additional contaminants were identified by the prevalence method. ASVs not belonging to the kingdom Bacteria or with unassigned phylum, were excluded from further analysis.

4.4. Statistical Analysis

ASV data and covariates were imported into R (v4.0.3) for further analysis. Alpha diversity was calculated using the species richness estimator as implemented in breakaway (v4.7.3) [28]. Additionally, sample-wise Shannon index was calculated as implemented in the DivNet package (v0.3.7) [29]. Differences in alpha diversity were assessed using nonparametric Kruskal–Wallis test and pairwise Wilcoxon test as a post-hoc test. Beta diversity was estimated using Aitchison distance [30] and permutational multivariate analysis of variance using distance matrices (PERMANOVA) was used to analyse differences in beta diversity (adonis function, vegan package v2.5-7, with 99,999 permutations). To investigate differential abundant taxa, using a beta-binomial regression as implemented in corncob (v0.2.0) [31] with gender in the null model to correct for gender differences. Additionally, balances [32] were calculated using a forward-selection method with 5-fold cross-validation (10 iterations) for the identification of two groups of taxa whose relative abundance (balance) is associated with strains or diet (selbal package v0.1.0). Balances were calculated on the phylum/genus level using only taxa present in at least 25% of the samples and sex was used as a covariate to adjust for sex effects. Partial correlations (Spearman correlation) of clr transformed abundance values were calculated using the R package ppcor v1.1 [33] while controlling for sex effects. On the genus level, only genera found in at least 1/6th of the samples were included to calculate partial correlations.
Functional profiles were predicted for the ASV data using PICRUSt2 v2.4.1 [34] with a NSTI cut-off of 0.3, the minimal number of reads set to 20 and the minimal number of samples set to 5. Differential abundant KEGG terms were identified using ALDEx2 v1.24.0 [35] (Welch’s t-test p-values were corrected for multiple testing using Benjamini–Hochberg correction) and results were visualized using the EnhancedVolcano package v1.10.0.

Supplementary Materials

The following supporting information can be downloaded at: https://www.mdpi.com/article/10.3390/ijms23031056/s1.

Author Contributions

A.K. performed microbial data analysis and wrote the manuscript. P.S. conducted the gut microbiota sequencing and critically edited the manuscript. H.B. conducted the microbiota data analysis, discussion of the work and critically edited the manuscript. S.M.I. provided financial support for the mouse work and contributed to the design of the project, discussed the work, and critically edited the manuscript. M.H. designed the study, conducted mouse experiment, data analysis and wrote the manuscript. All authors have read and agreed to the published version of the manuscript.

Funding

This work was supported by Bundesministerum für Building und Forschung (BMBF, 0315892B) and the Deutsche Forschungsgemeinschaft (DFG, German Research Foundation) under SCHI 1486/2-1, IB 24/12-1 and Germany’s Excellence Strategy EXC 22167-390884018.

Institutional Review Board Statement

Animal use and all protocols used in this study were approved by local authorities of the Animal Care and Use committee (V242-3394/2019 (5-1/16)) and performed in accordance with the relevant guidelines and regulations by certified personnel.

Informed Consent Statement

Not applicable.

Data Availability Statement

16S rRNA gene sequencing data used for this study were submitted to the European Nucleotide Archive (ENA) and are available under accession number PRJEB48909. A repository with all analysis used in this study is available at https://github.com/kunstner/2021_BPLxHFD_paper (accessed on 13 December 2021).

Acknowledgments

The authors thank the computational support from the OMICS compute cluster at the University of Lübeck.

Conflicts of Interest

The authors declare no conflict of interest.

References

  1. Anderson, S.; Bankier, A.T.; Barrell, B.G.; de Bruijn, M.H.; Coulson, A.R.; Drouin, J.; Eperon, I.C.; Nierlich, D.P.; Roe, B.A.; Sanger, F.; et al. Sequence and Organization of the Human Mitochondrial Genome. Nature 1981, 290, 457–465. [Google Scholar] [CrossRef]
  2. Wallace, D.C.; Singh, G.; Lott, M.T.; Hodge, J.A.; Schurr, T.G.; Lezza, A.M.; Elsas, L.J.; Nikoskelainen, E.K. Mitochondrial DNA Mutation Associated with Leber’s Hereditary Optic Neuropathy. Science 1988, 242, 1427–1430. [Google Scholar] [CrossRef] [PubMed]
  3. Brown, M.D.; Trounce, I.A.; Jun, A.S.; Allen, J.C.; Wallace, D.C. Functional Analysis of Lymphoblast and Cybrid Mitochondria Containing the 3460, 11778, or 14484 Leber’s Hereditary Optic Neuropathy Mitochondrial DNA Mutation *. J. Biol. Chem. 2000, 275, 39831–39836. [Google Scholar] [CrossRef] [PubMed] [Green Version]
  4. Lin, C.S.; Sharpley, M.S.; Fan, W.; Waymire, K.G.; Sadun, A.A.; Carelli, V.; Ross-Cisneros, F.N.; Baciu, P.; Sung, E.; McManus, M.J.; et al. Mouse MtDNA Mutant Model of Leber Hereditary Optic Neuropathy. Proc. Natl. Acad. Sci. USA 2012, 109, 20065–20070. [Google Scholar] [CrossRef] [PubMed] [Green Version]
  5. Indo, H.P.; Yen, H.-C.; Nakanishi, I.; Matsumoto, K.-I.; Tamura, M.; Nagano, Y.; Matsui, H.; Gusev, O.; Cornette, R.; Okuda, T.; et al. A Mitochondrial Superoxide Theory for Oxidative Stress Diseases and Aging. J. Clin. Biochem. Nutr. 2015, 56, 1–7. [Google Scholar] [CrossRef] [PubMed] [Green Version]
  6. Yonova-Doing, E.; Calabrese, C.; Gomez-Duran, A.; Schon, K.; Wei, W.; Karthikeyan, S.; Chinnery, P.F.; Howson, J.M.M. An Atlas of Mitochondrial DNA Genotype-Phenotype Associations in the UK Biobank. Nat. Genet. 2021, 53, 982–993. [Google Scholar] [CrossRef]
  7. Latorre-Pellicer, A.; Moreno-Loshuertos, R.; Lechuga-Vieco, A.V.; Sánchez-Cabo, F.; Torroja, C.; Acín-Pérez, R.; Calvo, E.; Aix, E.; González-Guerra, A.; Logan, A.; et al. Mitochondrial and Nuclear DNA Matching Shapes Metabolism and Healthy Ageing. Nature 2016, 535, 561–565. [Google Scholar] [CrossRef] [PubMed]
  8. Hirose, M.; Schilf, P.; Gupta, Y.; Zarse, K.; Künstner, A.; Fähnrich, A.; Busch, H.; Yin, J.; Wright, M.N.; Ziegler, A.; et al. Low-Level Mitochondrial Heteroplasmy Modulates DNA Replication, Glucose Metabolism and Lifespan in Mice. Sci. Rep. 2018, 8, 5872. [Google Scholar] [CrossRef] [Green Version]
  9. Hirose, M.; Künstner, A.; Schilf, P.; Tietjen, A.K.; Jöhren, O.; Huebbe, P.; Rimbach, G.; Rupp, J.; Schwaninger, M.; Busch, H.; et al. A Natural MtDNA Polymorphism in Complex III Is a Modifier of Healthspan in Mice. Int. J. Mol. Sci. 2019, 20, 2359. [Google Scholar] [CrossRef] [PubMed] [Green Version]
  10. McManus, M.J.; Picard, M.; Chen, H.-W.; de Haas, H.J.; Potluri, P.; Leipzig, J.; Towheed, A.; Angelin, A.; Sengupta, P.; Morrow, R.M.; et al. Mitochondrial DNA Variation Dictates Expressivity and Progression of Nuclear DNA Mutations Causing Cardiomyopathy. Cell. Metab. 2019, 29, 78–90. [Google Scholar] [CrossRef] [PubMed] [Green Version]
  11. Schilf, P.; Künstner, A.; Olbrich, M.; Waschina, S.; Fuchs, B.; Galuska, C.E.; Braun, A.; Neuschütz, K.; Seutter, M.; Bieber, K.; et al. A Mitochondrial Polymorphism Alters Immune Cell Metabolism and Protects Mice from Skin Inflammation. Int. J. Mol. Sci. 2021, 22, 1006. [Google Scholar] [CrossRef] [PubMed]
  12. O’Toole, P.W.; Jeffery, I.B. Gut Microbiota and Aging. Science 2015, 350, 1214–1215. [Google Scholar] [CrossRef] [PubMed]
  13. Lynch, S.V.; Pedersen, O. The Human Intestinal Microbiome in Health and Disease. N. Engl. J. Med. 2016, 375, 2369–2379. [Google Scholar] [CrossRef] [Green Version]
  14. Hirose, M.; Künstner, A.; Schilf, P.; Sünderhauf, A.; Rupp, J.; Jöhren, O.; Schwaninger, M.; Sina, C.; Baines, J.F.; Ibrahim, S.M. Mitochondrial Gene Polymorphism Is Associated with Gut Microbial Communities in Mice. Sci. Rep. 2017, 7, 15293. [Google Scholar] [CrossRef] [PubMed] [Green Version]
  15. Yardeni, T.; Tanes, C.E.; Bittinger, K.; Mattei, L.M.; Schaefer, P.M.; Singh, L.N.; Wu, G.D.; Murdock, D.G.; Wallace, D.C. Host Mitochondria Influence Gut Microbiome Diversity: A Role for ROS. Sci. Signal 2019, 12, 588. [Google Scholar] [CrossRef]
  16. Houghton, D.; Stewart, C.J.; Stamp, C.; Nelson, A.; Aj Ami, N.J.; Petrosino, J.F.; Wipat, A.; Trenell, M.I.; Turnbull, D.M.; Greaves, L.C. Impact of Age-Related Mitochondrial Dysfunction and Exercise on Intestinal Microbiota Composition. J. Gerontol. A Biol. Sci. Med. Sci. 2018, 73, 571–578. [Google Scholar] [CrossRef] [Green Version]
  17. Hirose, M.; Schilf, P.; Zarse, K.; Busch, H.; Fuellen, G.; Jöhren, O.; Köhling, R.; König, I.R.; Richer, B.; Rupp, J.; et al. Maternally Inherited Differences within Mitochondrial Complex I Control Murine Healthspan. Genes 2019, 10, 532. [Google Scholar] [CrossRef] [Green Version]
  18. Hirose, M.; Schilf, P.; Gupta, Y.; Wright, M.N.; Wright, M.N.; Jöhren, O.; Wagner, A.E.; Sina, C.; Ziegler, A.; Ristow, M.; et al. Lifespan Effects of Mitochondrial Mutations. Nature 2016, 540, E13–E14. [Google Scholar] [CrossRef]
  19. Shin, N.-R.; Whon, T.W.; Bae, J.-W. Proteobacteria: Microbial Signature of Dysbiosis in Gut Microbiota. Trends Biotechnol. 2015, 33, 496–503. [Google Scholar] [CrossRef] [PubMed]
  20. Badal, V.D.; Vaccariello, E.D.; Murray, E.R.; Yu, K.E.; Knight, R.; Jeste, D.V.; Nguyen, T.T. The Gut Microbiome, Aging, and Longevity: A Systematic Review. Nutrients 2020, 12, E3759. [Google Scholar] [CrossRef]
  21. Kaur, H.; Bose, C.; Mande, S.S. Tryptophan Metabolism by Gut Microbiome and Gut-Brain-Axis: An in Silico Analysis. Front. Neurosci. 2019, 13, 1365. [Google Scholar] [CrossRef]
  22. Zhou, L.; Xiao, X.; Zhang, Q.; Zheng, J.; Li, M.; Yu, M.; Wang, X.; Deng, M.; Zhai, X.; Li, R. Improved Glucose and Lipid Metabolism in the Early Life of Female Offspring by Maternal Dietary Genistein Is Associated With Alterations in the Gut Microbiota. Front. Endocrinol. 2018, 9, 516. [Google Scholar] [CrossRef]
  23. Yu, X.; Gimsa, U.; Wester-Rosenlöf, L.; Kanitz, E.; Otten, W.; Kunz, M.; Ibrahim, S.M. Dissecting the Effects of MtDNA Variations on Complex Traits Using Mouse Conplastic Strains. Genome Res. 2009, 19, 159–165. [Google Scholar] [CrossRef] [Green Version]
  24. Callahan, B.J.; McMurdie, P.J.; Rosen, M.J.; Han, A.W.; Johnson, A.J.A.; Holmes, S.P. DADA2: High-Resolution Sample Inference from Illumina Amplicon Data. Nat. Methods 2016, 13, 581–583. [Google Scholar] [CrossRef] [PubMed] [Green Version]
  25. Murali, A.; Bhargava, A.; Wright, E.S. IDTAXA: A Novel Approach for Accurate Taxonomic Classification of Microbiome Sequences. Microbiome 2018, 6, 140. [Google Scholar] [CrossRef] [PubMed]
  26. Parks, D.H.; Chuvochina, M.; Rinke, C.; Mussig, A.J.; Chaumeil, P.-A.; Hugenholtz, P. GTDB: An Ongoing Census of Bacterial and Archaeal Diversity through a Phylogenetically Consistent, Rank Normalized and Complete Genome-Based Taxonomy. Nucleic Acids Res. 2021, 50, D785–D794. [Google Scholar] [CrossRef]
  27. Davis, N.M.; Proctor, D.M.; Holmes, S.P.; Relman, D.A.; Callahan, B.J. Simple Statistical Identification and Removal of Contaminant Sequences in Marker-Gene and Metagenomics Data. Microbiome 2018, 6, 226. [Google Scholar] [CrossRef] [Green Version]
  28. Willis, A.; Bunge, J. Estimating Diversity via Frequency Ratios. Biometrics 2015, 71, 1042–1049. [Google Scholar] [CrossRef] [Green Version]
  29. Willis, A.D.; Martin, B.D. Estimating Diversity in Networked Ecological Communities. Biostatistics 2020, 23, 207–222. [Google Scholar] [CrossRef] [PubMed]
  30. Aitchison, J. The Statistical Analysis of Compositional Data; Chapman and Hall Ltd.: London, UK, 1986. [Google Scholar]
  31. Martin, B.D.; Witten, D.; Willis, A.D. Modeling Microbial Abundances and Dysbiosis with Beta-Binomial Regression. Ann. Appl. Stat. 2020, 14, 94–115. [Google Scholar] [CrossRef] [PubMed] [Green Version]
  32. Rivera-Pinto, J.; Egozcue, J.J.; Pawlowsky-Glahn, V.; Paredes, R.; Noguera-Julian, M.; Calle, M.L. Balances: A New Perspective for Microbiome Analysis. mSystems 2018, 3, e00053-18. [Google Scholar] [CrossRef] [PubMed] [Green Version]
  33. Kim, S. Ppcor: An R Package for a Fast Calculation to Semi-Partial Correlation Coefficients. Commun. Stat. Appl. Methods 2015, 22, 665–674. [Google Scholar] [CrossRef] [PubMed] [Green Version]
  34. Douglas, G.M.; Maffei, V.J.; Zaneveld, J.R.; Yurgel, S.N.; Brown, J.R.; Taylor, C.M.; Huttenhower, C.; Langille, M.G.I. PICRUSt2 for Prediction of Metagenome Functions. Nat. Biotechnol. 2020, 38, 685–688. [Google Scholar] [CrossRef] [PubMed]
  35. Fernandes, A.D.; Reid, J.N.; Macklaim, J.M.; McMurrough, T.A.; Edgell, D.R.; Gloor, G.B. Unifying the Analysis of High-Throughput Sequencing Datasets: Characterizing RNA-Seq, 16S RRNA Gene Sequencing and Selective Growth Experiments by Compositional Data Analysis. Microbiome 2014, 2, 15. [Google Scholar] [CrossRef] [PubMed] [Green Version]
Figure 1. Alpha diversity and beta diversity of gut microbiota in B6-mtBPL and B6-mtALR mice. (A) Alpha diversity plot depicting the breakaway estimate of species richness. Dots denote individual estimates of species richness and violins show the distribution of the data. (B) Redundancy analysis plot of beta diversity showing Aitchison distances to assess differences in community composition. Grey refers to mice at week 0 (w0), blue to control diet fed (CD) mice at week 8 (w8) and orange to mice on high-fat diet (HFD), respectively. B6-mtALR mice are shown in dots and B6-mtBPL mice are shown in triangles. First principal coordinate (PC1) explains 37.7% of the total variation observed, PC2 explains an additional 6.7%.
Ijms 23 01056 g001
Figure 2. Relative taxonomic abundance comparison between B6-mtBPL and B6-mtALR mice with different diet groups at the phylum level (A) and at the genus level (B) BPL = B6-mtBPL, ALR = B6-mtALR, w0 = week 0, w8 = week 8, CD = control diet, HFD = high fat diet.
Ijms 23 01056 g002
Figure 3. Description of the global balance of bacterial taxa between strains and dietary conditions. The two groups of taxa that form the global balance (defined as denominator and numerator) are specified at the top of the plot. The box plots depict the distribution of the balance score and the density of each distribution is shown next to the box plot for each compared group. The y-axis of the plots indicates the balance score. (A,C,E,G,I) show the analysis at the phylum levels, while (B,D,F,H,J) are at the genus level. Comparison between B6-mtBPL and B6-mtALR mice at week 0 (phylum level A, genus level B), CD-fed for 8 weeks (C,D), HFD-fed for 8 weeks (E,F). Comparison between HFD and CD groups in B6-mtALR (G,H) and B6-mtBPL (I,J).
Ijms 23 01056 g003
Figure 4. Correlation of bacterial phylum and genus with metabolic parameters. (Panel A) shows the correlation with bacterial phyla and (Panel B) are those with a genus. Correlation of bacterial abundance with fasting glucose levels (0 min), that with area glucose levels at 45 min after glucose injection in ipGTT (45 min), and that with body weight (Weight). p-values smaller than 0.05 are presented in the heat maps; only genera were included where the p-value was below 0.05 in at least one comparison.
Ijms 23 01056 g004
Figure 5. Volcano plot illustrating differentially involved KEGG terms based on the differentially abundant bacterial taxa between HFD-fed B6-mtALR and B6-mtBPL mice. Each ID denotes respective KEGG ID. Pathways with the absolute log2 fold change greater than 1 are considered to have sufficiently large positive and negative effect, respectively, and those with an adjusted p-values of minus log10 q-value greater than 2 (q < 0.01) are regarded as significant. BPL = B6-mtBPL, ALR = B6-mtALR.
Ijms 23 01056 g005
Table 1. The list of differential bacterial taxa at the genus levels in comparison between B6-mtBPL and B6-mtALR and those with different diet groups.
ComparisonHFD vs. CD in ALRHFD vs. CD in BPLBPL vs. ALR in CDBPL vs. ALR in HFD
AbundanceTaxaFdrEffectTaxaFdrEffectTaxaFdrEffectTaxaFdrEffect
DecreasedCAG-2690.00005−4.72158Clostridium0.01590−3.29675UBA32630.00000−1.18785UBA32630.00000−2.02792
Duncaniella0.00018−3.28685Duncaniella0.00160−3.22098Duncaniella0.00384−1.02234Emergencia0.00076−1.14646
CAG-8730.00120−2.87259Acutalibacter0.00000−2.29577Romboutsia0.00021−0.75258Ligilactobacillus0.00133−0.89182
Schaedlerella0.01477−2.23013Alistipes0.00000−1.65379 Turicimonas0.00317−0.61016
UMGS18720.00119−1.88033CAG-8730.00000−1.28945
Acutalibacter0.00003−1.44531Odoribacter0.01590−1.23079
Alistipes0.00000−1.27705Anaerosacchariphilus0.00001−1.20352
Odoribacter0.02196−0.91225UMGS18720.00019−1.12353
Romboutsia0.00000−0.53529
IncreasedUBA32630.000001.58432Muribaculum0.022021.00961Acutalibacter0.048020.43005Muribaculum0.031750.82913
Ligilactobacillus0.000002.28024Parabacteroides0.000001.97159Bacteroides0.000000.58530Dysosmobacter0.001331.43358
Emergencia0.048103.84358Turicimonas0.000002.75714Turicibacter0.000730.81148Parabacteroides0.000001.59726
Faecalibaculum0.000013.14495Ligilactobacillus0.045071.08915CAG-8730.041561.98442
CAG-560.001185.71160Faecalibaculum0.014791.12808Paramuribaculum0.005333.61420
CAG-4850.014791.69376
Publisher’s Note: MDPI stays neutral with regard to jurisdictional claims in published maps and institutional affiliations.

