Article

Investigation of Structural Alterations in Inherited Retinal Diseases: A Quantitative SD-OCT-Analysis of Retinal Layer Thicknesses in Light of Underlying Genetic Mutations

1
University Eye Hospital, Hannover Medical School, 30625 Hannover, Germany
2
Clinic for Horses, University Veterinary Medicine Hannover, Foundation, 30559 Hannover, Germany
3
Institute of Human Genetics, University of Regensburg, Franz-Josef-Strauss-Allee 11, 93053 Regensburg, Germany
4
Center for Rare Retinal Diseases, AugenZentrum Siegburg, MVZ Augenärztliches Diagnostik- und Therapiecentrum Siegburg GmbH, Europaplatz 3, 53721 Siegburg, Germany
5
RetinaScience, P.O. Box 301212, 53192 Bonn, Germany
*
Author to whom correspondence should be addressed.
These authors contributed equally to this work.
Int. J. Mol. Sci. 2022, 23(24), 16007; https://doi.org/10.3390/ijms232416007
Submission received: 14 November 2022 / Revised: 8 December 2022 / Accepted: 14 December 2022 / Published: 16 December 2022
(This article belongs to the Section Molecular Pathology, Diagnostics, and Therapeutics)

Abstract

:
Inherited retinal diseases can result from various genetic defects and are one of the leading causes for blindness in the working-age population. The present study aims to provide a comprehensive description of changes in retinal structure associated with phenotypic disease entities and underlying genetic mutations. Full macular spectral domain optical coherence tomography scans were obtained and manually segmented in 16 patients with retinitis pigmentosa, 7 patients with cone–rod dystrophy, and 7 patients with Stargardt disease, as well as 23 age- and sex-matched controls without retinal disease, to assess retinal layer thicknesses. As indicated by generalized least squares models, all IRDs were associated with retinal thinning (p < 0.001), especially of the outer nuclear layer (ONL, p < 0.001). Except for the retinal nerve fiber layer, such thinning was associated with a reduced visual acuity (p < 0.001). These advances in our understanding of ultrastructural retinal changes are important for the development of gene-, cell-, and optogenetic therapy. Longitudinal studies are warranted to describe the temporal component of those changes.

1. Introduction

Inherited retinal diseases (IRD) are one of the leading causes for blindness in the working-age population [1]. In several industrialized countries, they have even superseded diabetic retinopathy as the number one cause of blindness for people of working age [2,3]. They include heterogeneous forms of retinal dystrophies varying in their epidemiological, pathogenetic and clinical features [4,5,6]. Frequent initial symptoms are decreased vision, visual field defects, photophobia or nyctalopia [1,7]. While children often show severe courses, adults sometimes can preserve visual functions up to old age [7,8]. Nevertheless, severe vision loss up to complete blindness can occur in the final stages [1].
Over 270 genes have been linked to IRDs with different kinds of mutations and modes of transmission, potentially resulting in a similar clinical appearance [9]. For example, retinitis pigmentosa (RP), one of the commonest IRDs, is associated with over 130 genes [10]. On the other hand, mutations in the same genes can result in different IRDs. For instance, RP, cone–rod dystrophy (CRD), and Stargardt disease (STGD) may all occur associated with mutations of ABCA4 [10,11].
In general, a complete ophthalmological examination including fundus autofluorescence (FAF) and electroretinography (ERG) should reveal typical patterns of retinal dystrophies [1,12]. However, only molecular genetic analyses can identify the underlying gene mutations [1]. The pathogenesis of IRDs is potentially as variable as the responsible gene mutation. Globally, these defects result in a gradual decay of photoreceptors leading to visual impairment. For a long time, the distribution of lesions on a cellular level was poorly described due to a lack of histopathological material. Indeed, the in vivo analysis of structural changes occurring with retinal diseases has only been possible since the late 1990s, after optical coherence tomography (OCT) was invented in 1991 [13]. Today, OCT software programs provide three-dimensional visualization of the retina and estimations of quantitative parameters such as layer thicknesses. Still, the automatic segmentation of retinal layers becomes impossible in advanced cases of IRD when the continuity of retinal layers is affected [14,15,16]. Because manual segmentation is enormously time-consuming [15,17], many studies have only evaluated qualitative parameters such as the integrity of retinal layers, disruptions, or reflectivity [18,19,20,21,22]. Others have reduced the process of manual segmentation to a minimum by segmenting one or two foveal B-scans only or focussing on a single layer [11,23,24,25,26,27]. These approaches do not fully describe the three-dimensional structure of the retina or the local impact of IRDs, which may differ between the fovea and the periphery.
As a result, the present manuscript aims to provide a more comprehensive depiction of the retinal structure in genetically confirmed RP, CRD, and STGD by comparing manually segmented full macular SD-OCT scans to age and sex-matched controls. Parallel to the phenotypic disease entities, the impact of different genotypes on retinal layer changes was also investigated. Finally, interocular symmetry was assessed.

2. Results

2.1. Alterations of the Retinal Structure in IRDs

Full macular volume scans obtained by SD-OCT were manually segmented and divided into nine subfields using the Early Treatment Diabetic Retinopathy Study (ETDRS) grid. The ETDRS grid consists of a central subfield within a 1 mm diameter from the fovea (C0), an inner ring within a 3 mm diameter from the fovea with four subfields (nasal (N1), temporal (T1), superior (S1) and inferior (I1)), and an outer ring within a 6 mm diameter from the fovea with another four subfields (nasal (N2), temporal (T2), superior (S2) and inferior (I2)). The resulting layer thicknesses were compared between disease groups and matched controls within each subfield using generalized least squares models. The demographic data are shown in Table 1. The genetic characteristics of all patients with an IRD are displayed in Table 2.

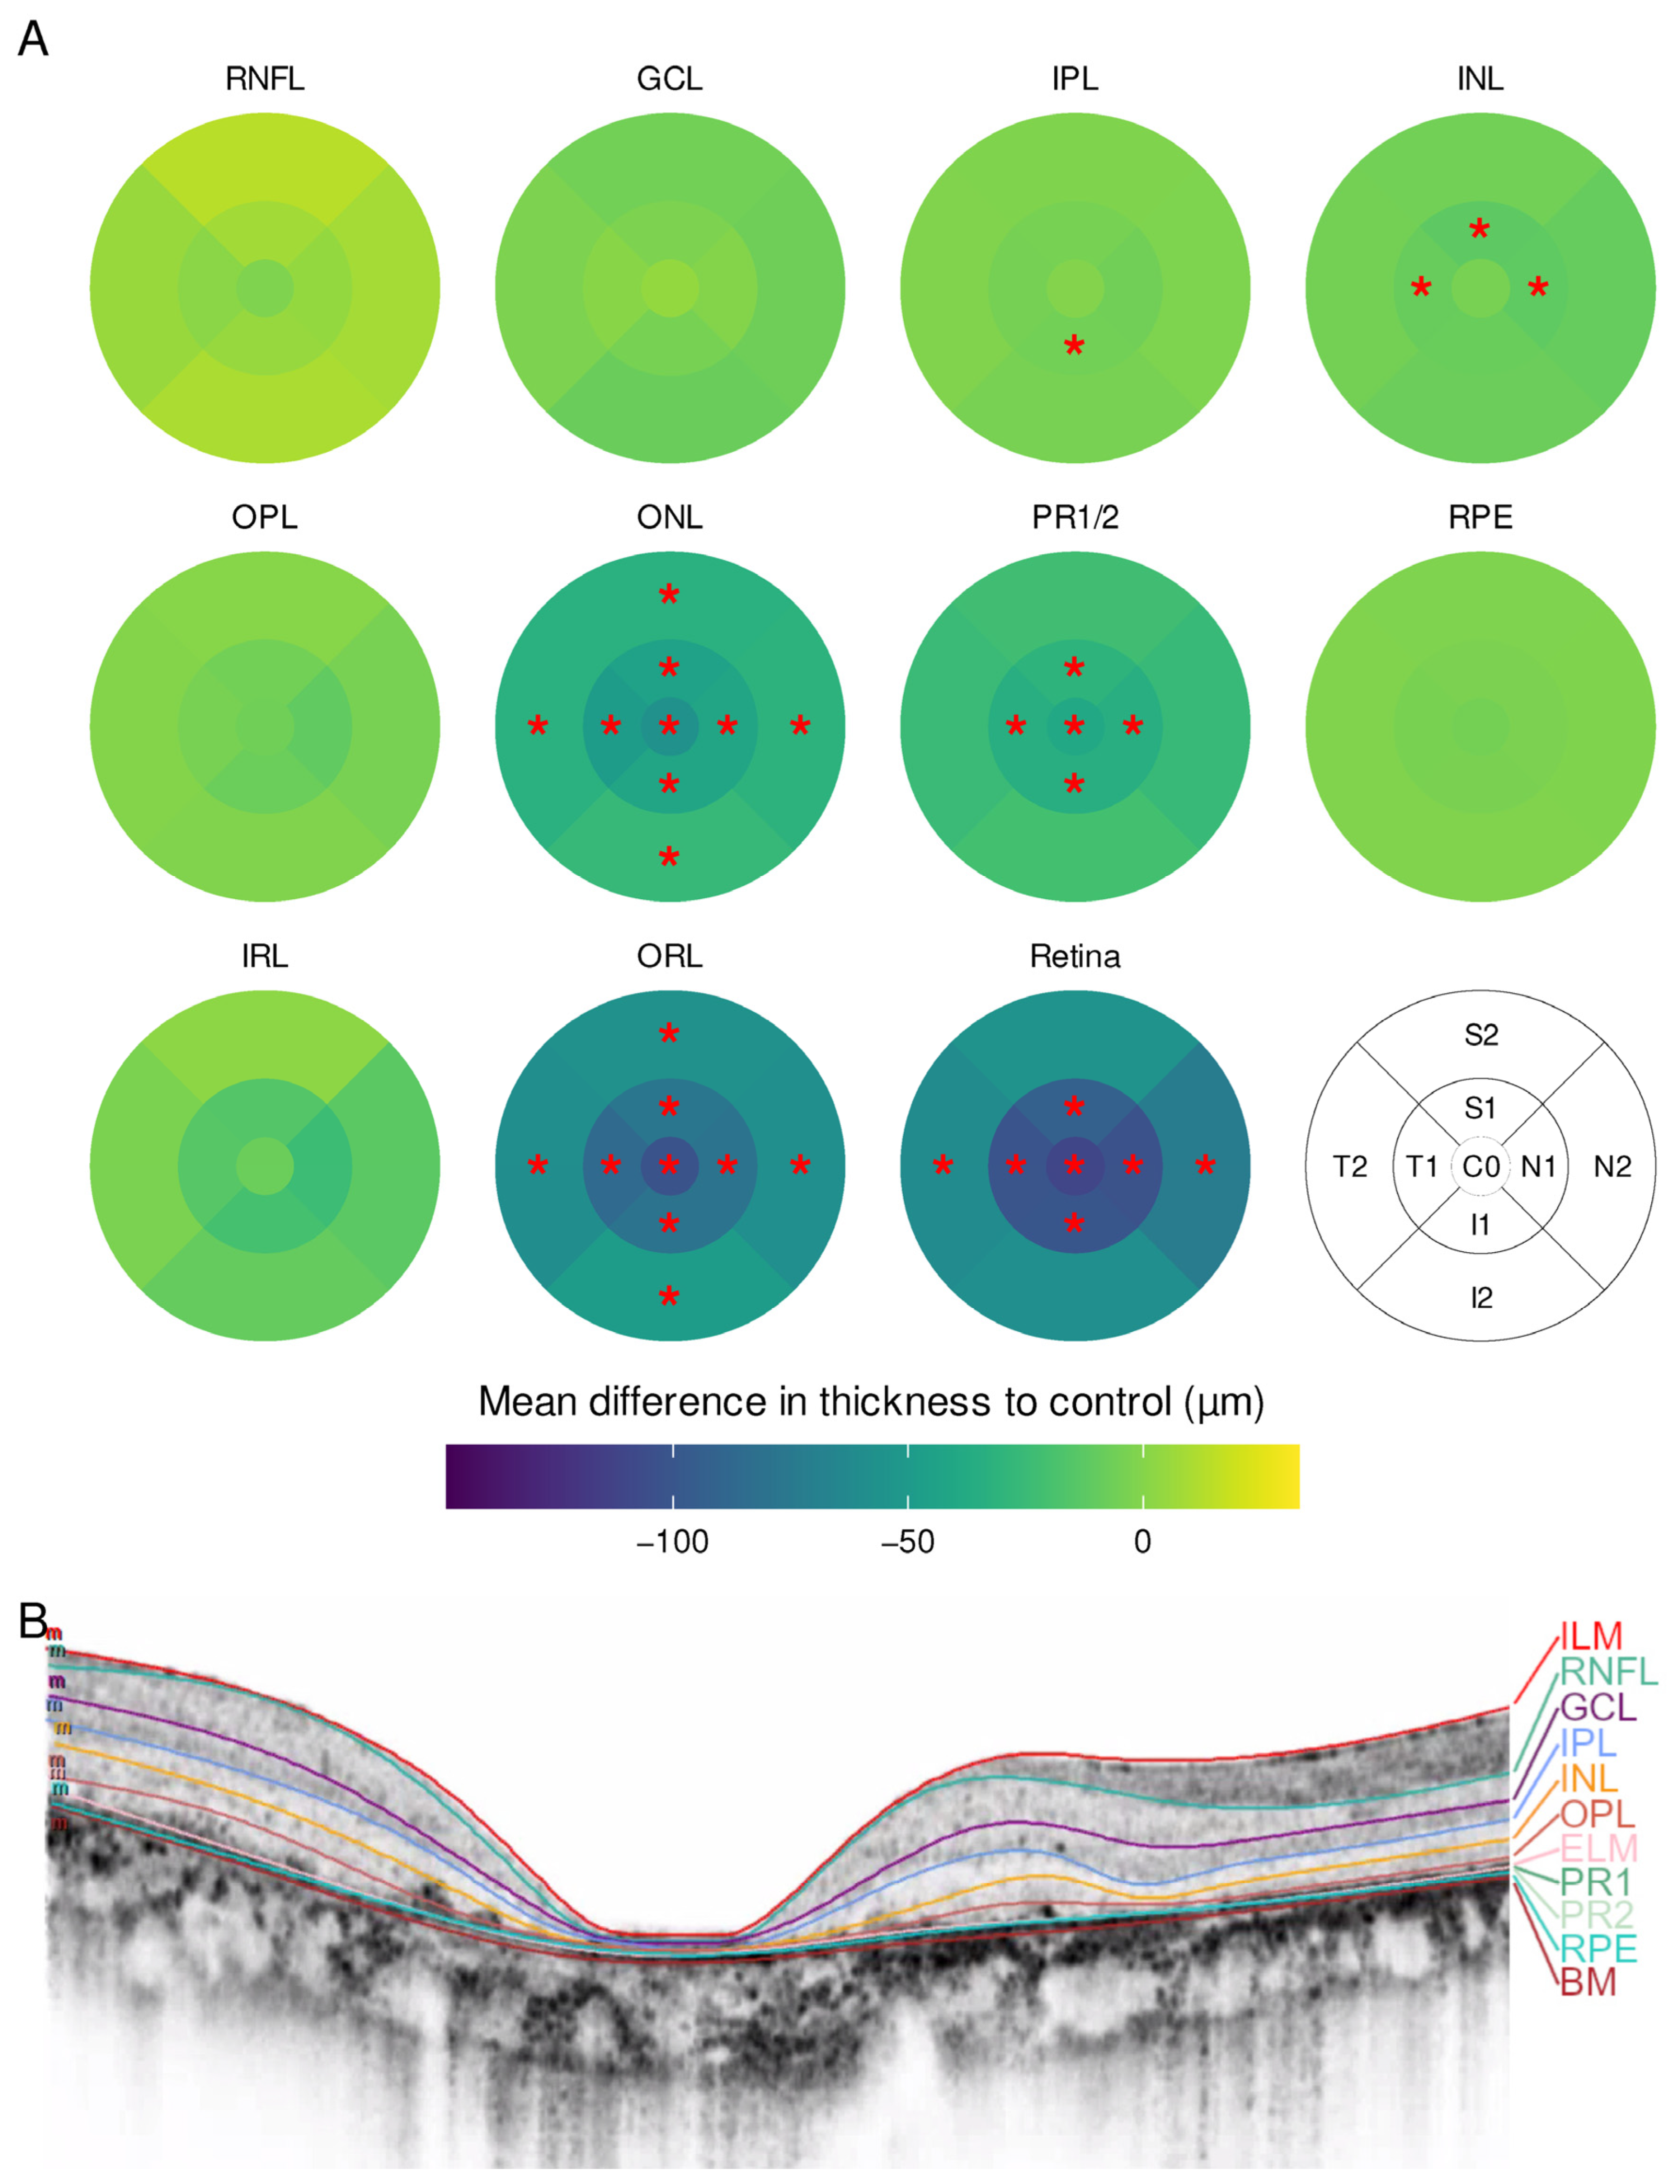
2.1.1. Retinitis Pigmentosa

Thirty-two eyes of sixteen patients with RP were compared to a sex- and age-matched group of individuals without retinal disease. Sixty-five subfields of different layers were significantly divergent between groups after p-value adjustment (Figure 1). Overall, RP resulted in a thinning of the retina while sparing the fovea. This was most obvious in the photoreceptor inner and outer segments (PR1/2) and the outer nuclear layer (ONL), where all subfields including C0 were affected. In contrast, the inner retinal layers (IRL) were thickened, either centrally (ganglion cell layer (GCL), outer plexiform layer (OPL)) or in the outer ring subfields (retinal nerve fiber layer (RNFL), inner plexiform layer (IPL)).

2.1.2. Cone-Rod Dystrophy

Fourteen eyes of seven patients with CRD were included. The sex- and age-matched control group consisted of seven individuals without retinal disease (Table 1). In the CRD group, a thinning of the whole retina was observed. There was no foveal sparing nor thickening of any subfield. In addition, the outer ring subfields were less impaired than the inner and central subfields. Again, ONL and PR1/2 were the most affected layers (Figure 2).

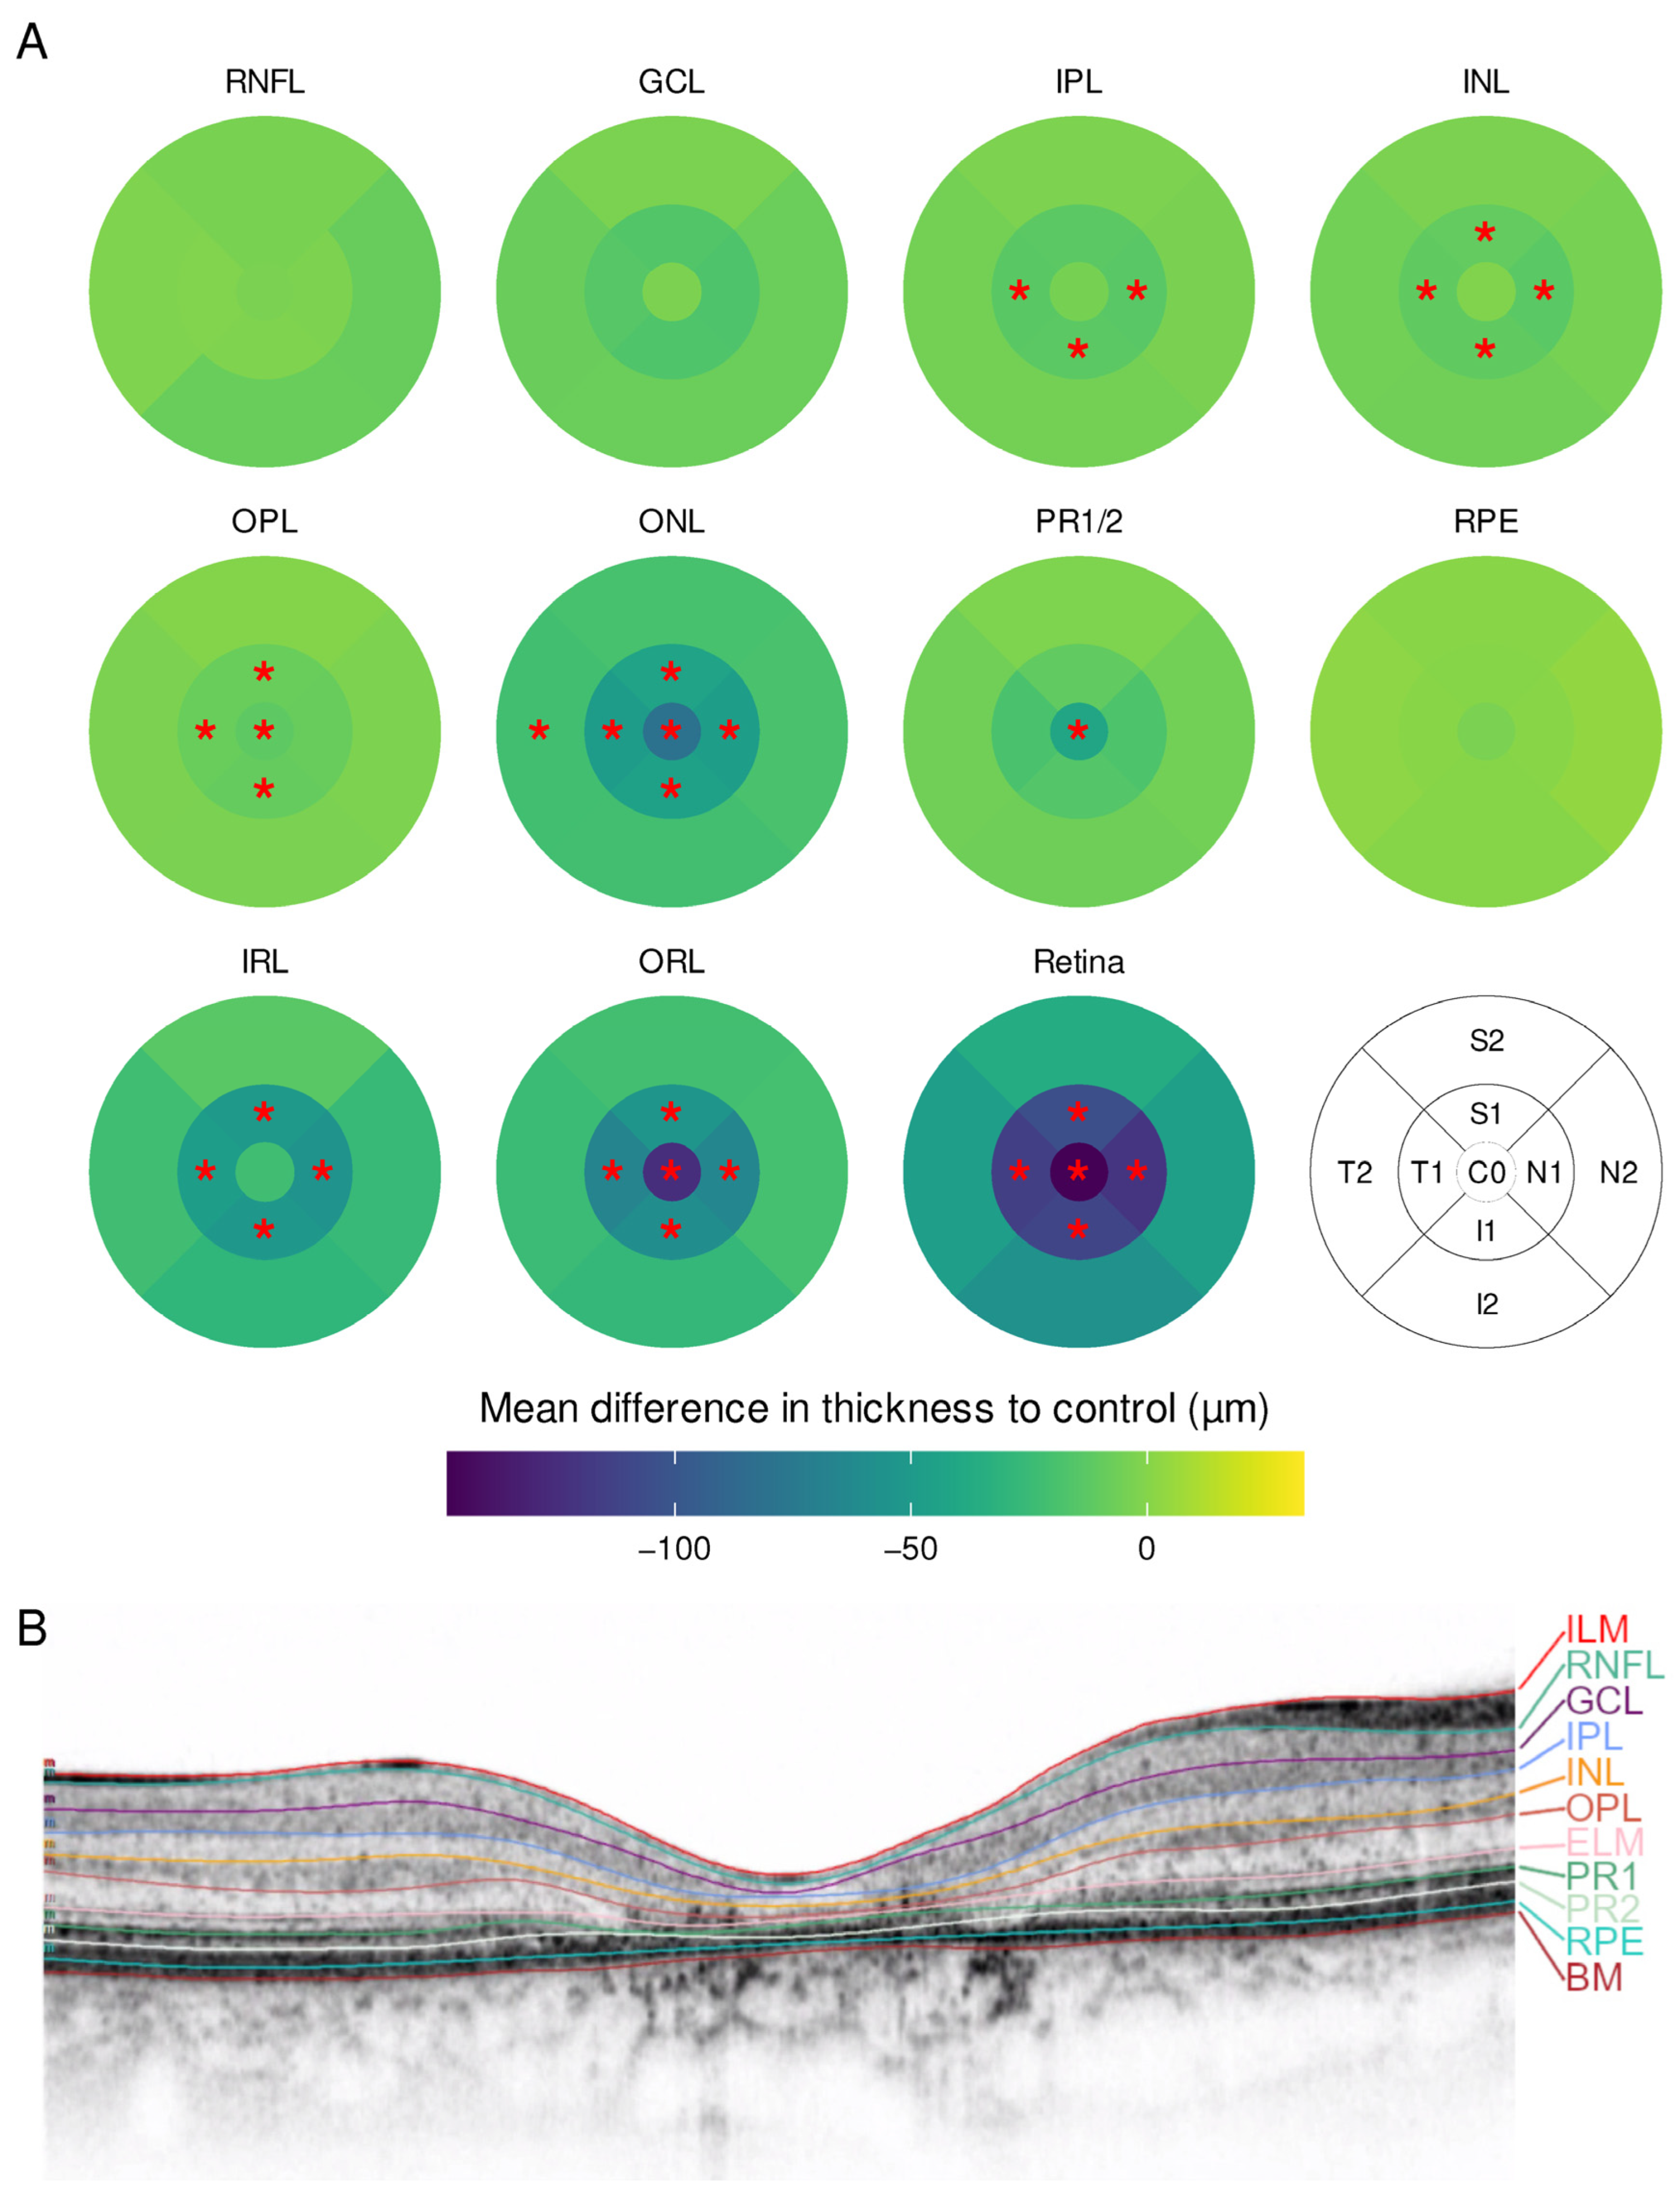
2.1.3. Stargardt Disease

Fourteen eyes of seven patients with Stargardt disease were included. They were compared to a group of seven individuals without retinal disease. The demographic information is summarized in Table 1. Patients with Stargardt disease displayed a similar pattern to CRD, with an overall thinning of the retina without foveal sparing (Figure 3). The thinning was predominantly observed in the ONL and OPL in the central subfield and inner ring as well as in the inner ring in IPL and inner nuclear layer (INL).

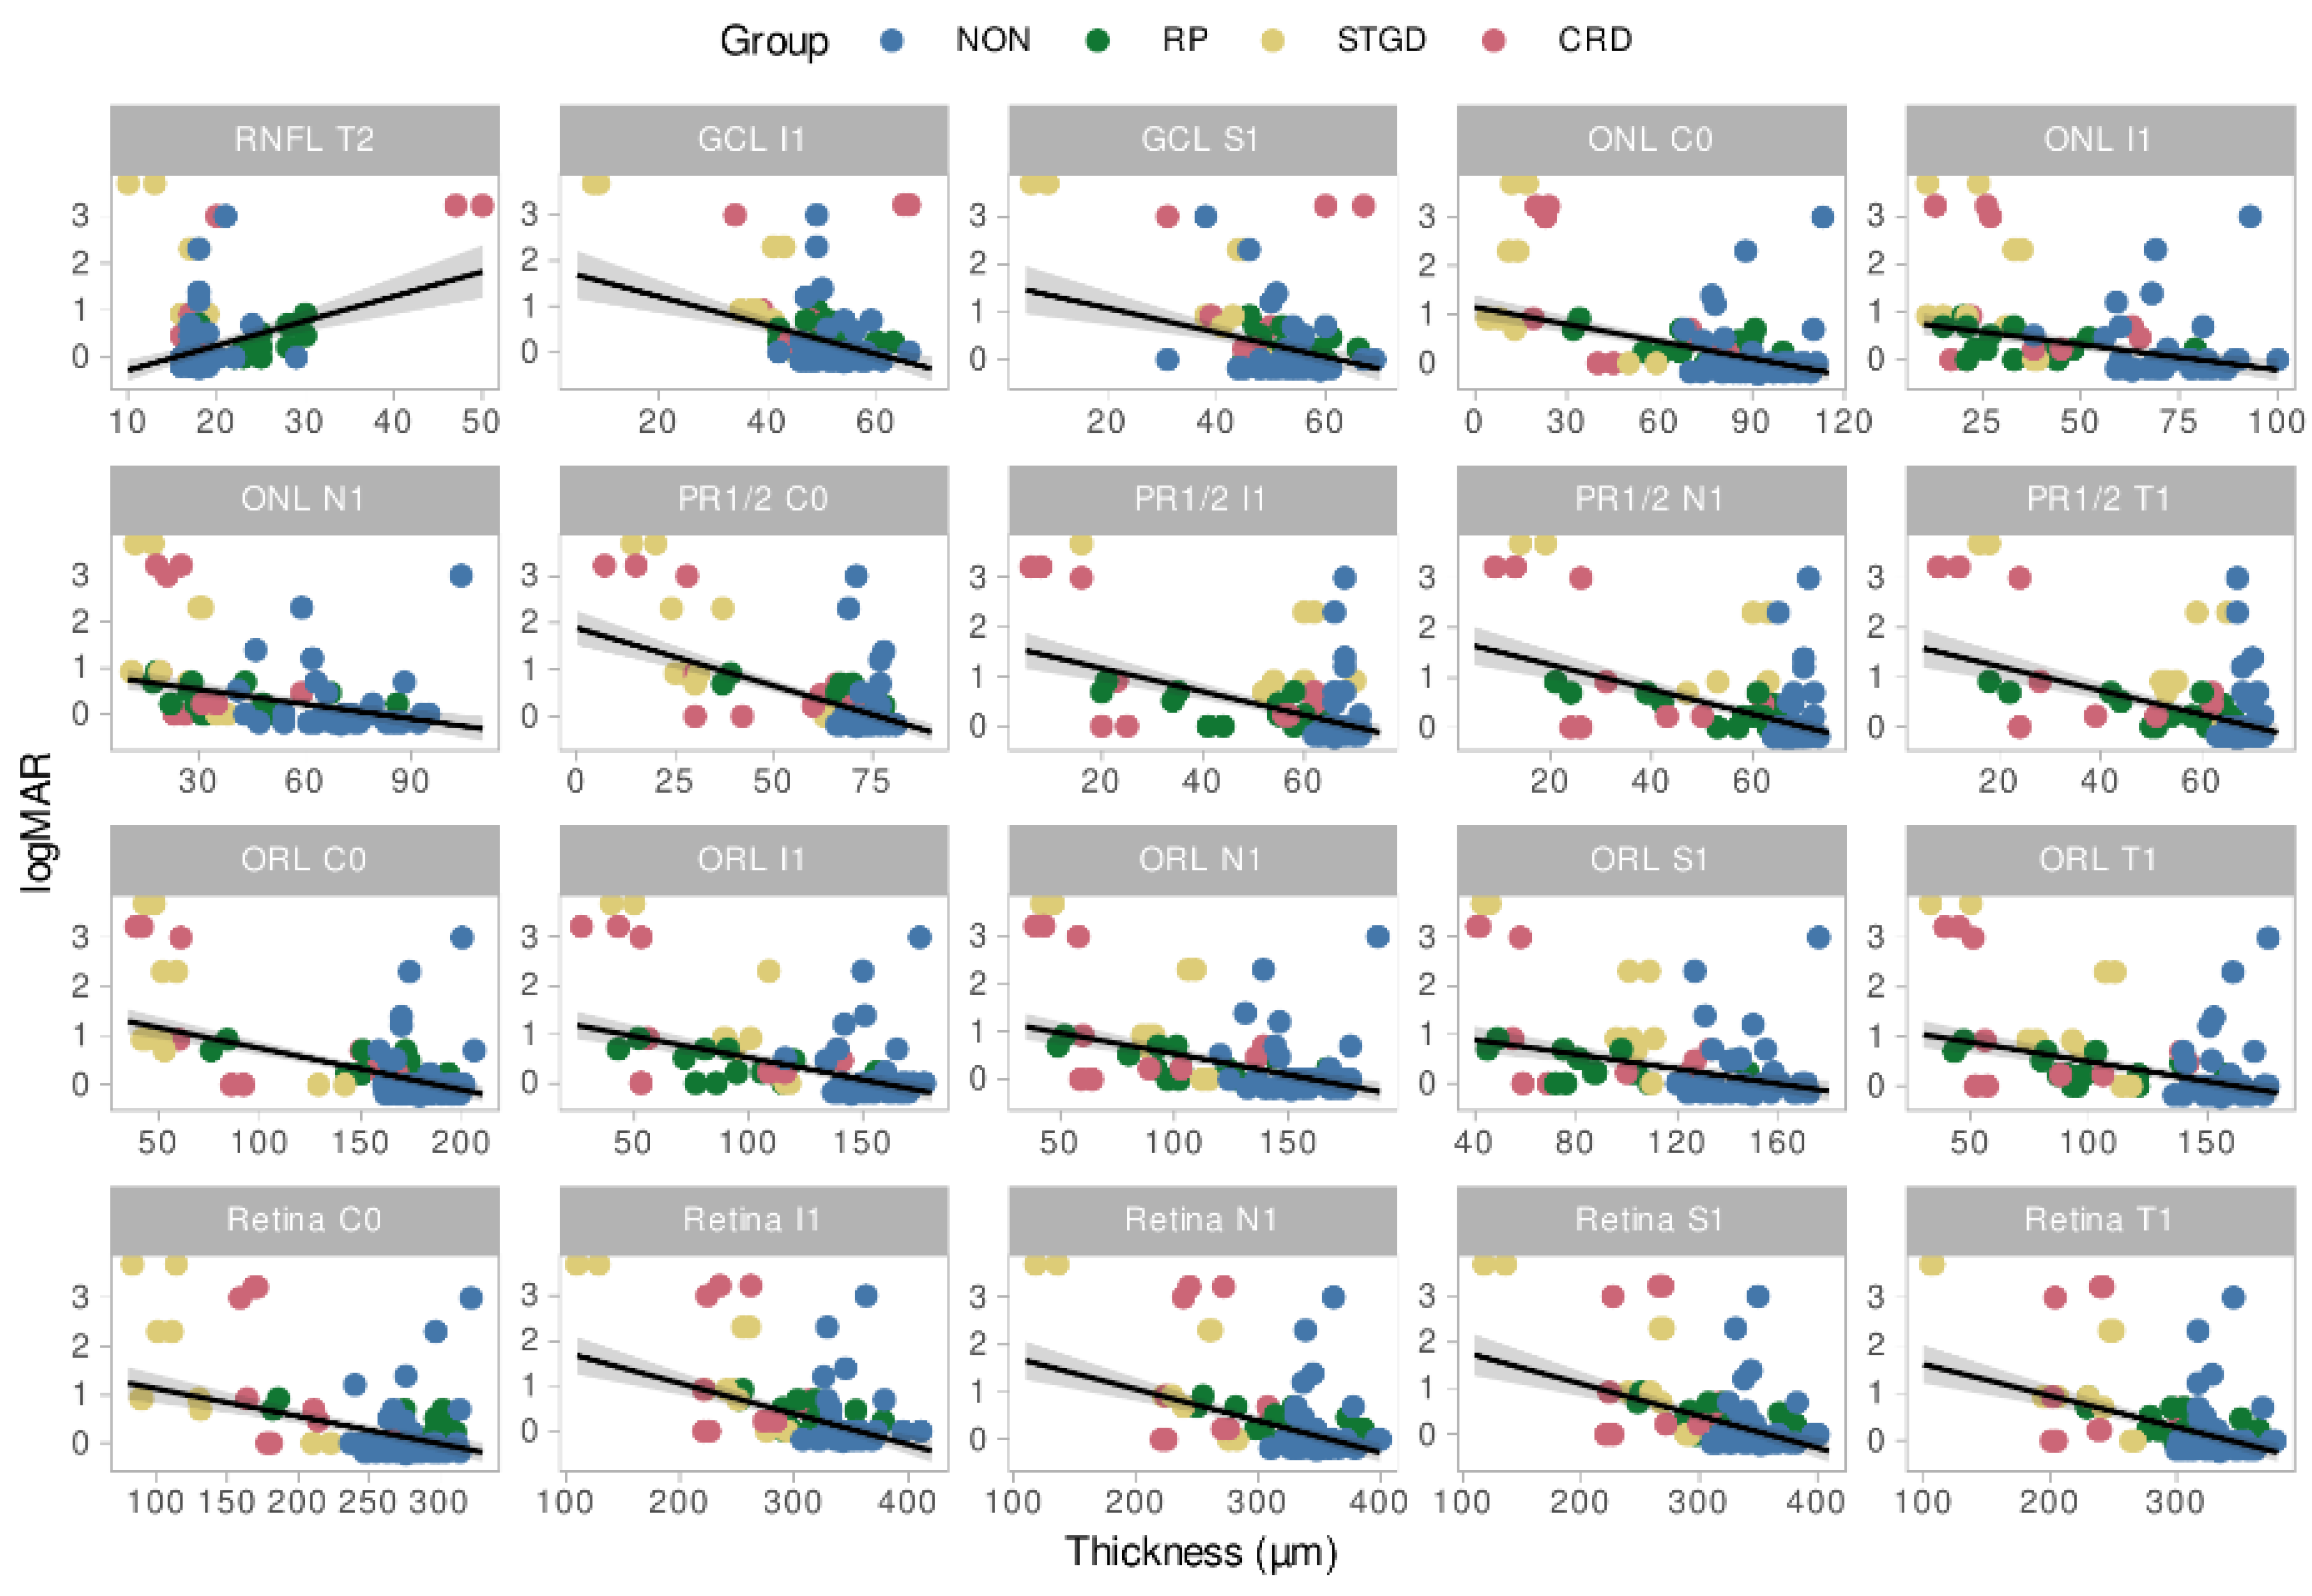
2.2. Association between Subfield Thicknesses and Visual Function

Decimal best-corrected Snellen VA was converted into the logarithm of the minimal angle of resolution (logMAR) for statistical analysis [28]. The logMAR VA was significantly higher in STGD (median: 0.916, z = 2.96, p = 0.009) and CRD (median: 0.693, z = 2.59, p = 0.03) compared to controls (median: 0) but not for RP (median: 0.343, z = 1.88, p = 0.164). Statistically significant relationships between visual acuity and layer thicknesses were observed in 34 subfields based on robust mixed linear models. The relation between logMAR VA and layer thicknesses for the 20 most significant subfields and layers is displayed in Figure 4. Overall, a negative correlation was found between logMAR and layer thickness for inner subfields of the whole retina (C0, I1, N1, T1), the outer retinal layers (in the subfields C0, I1, N1, T1 and S1), ONL (C0, I1, N1) and GCL (I1, S1), while the RNFL showed a positive correlation in T2.

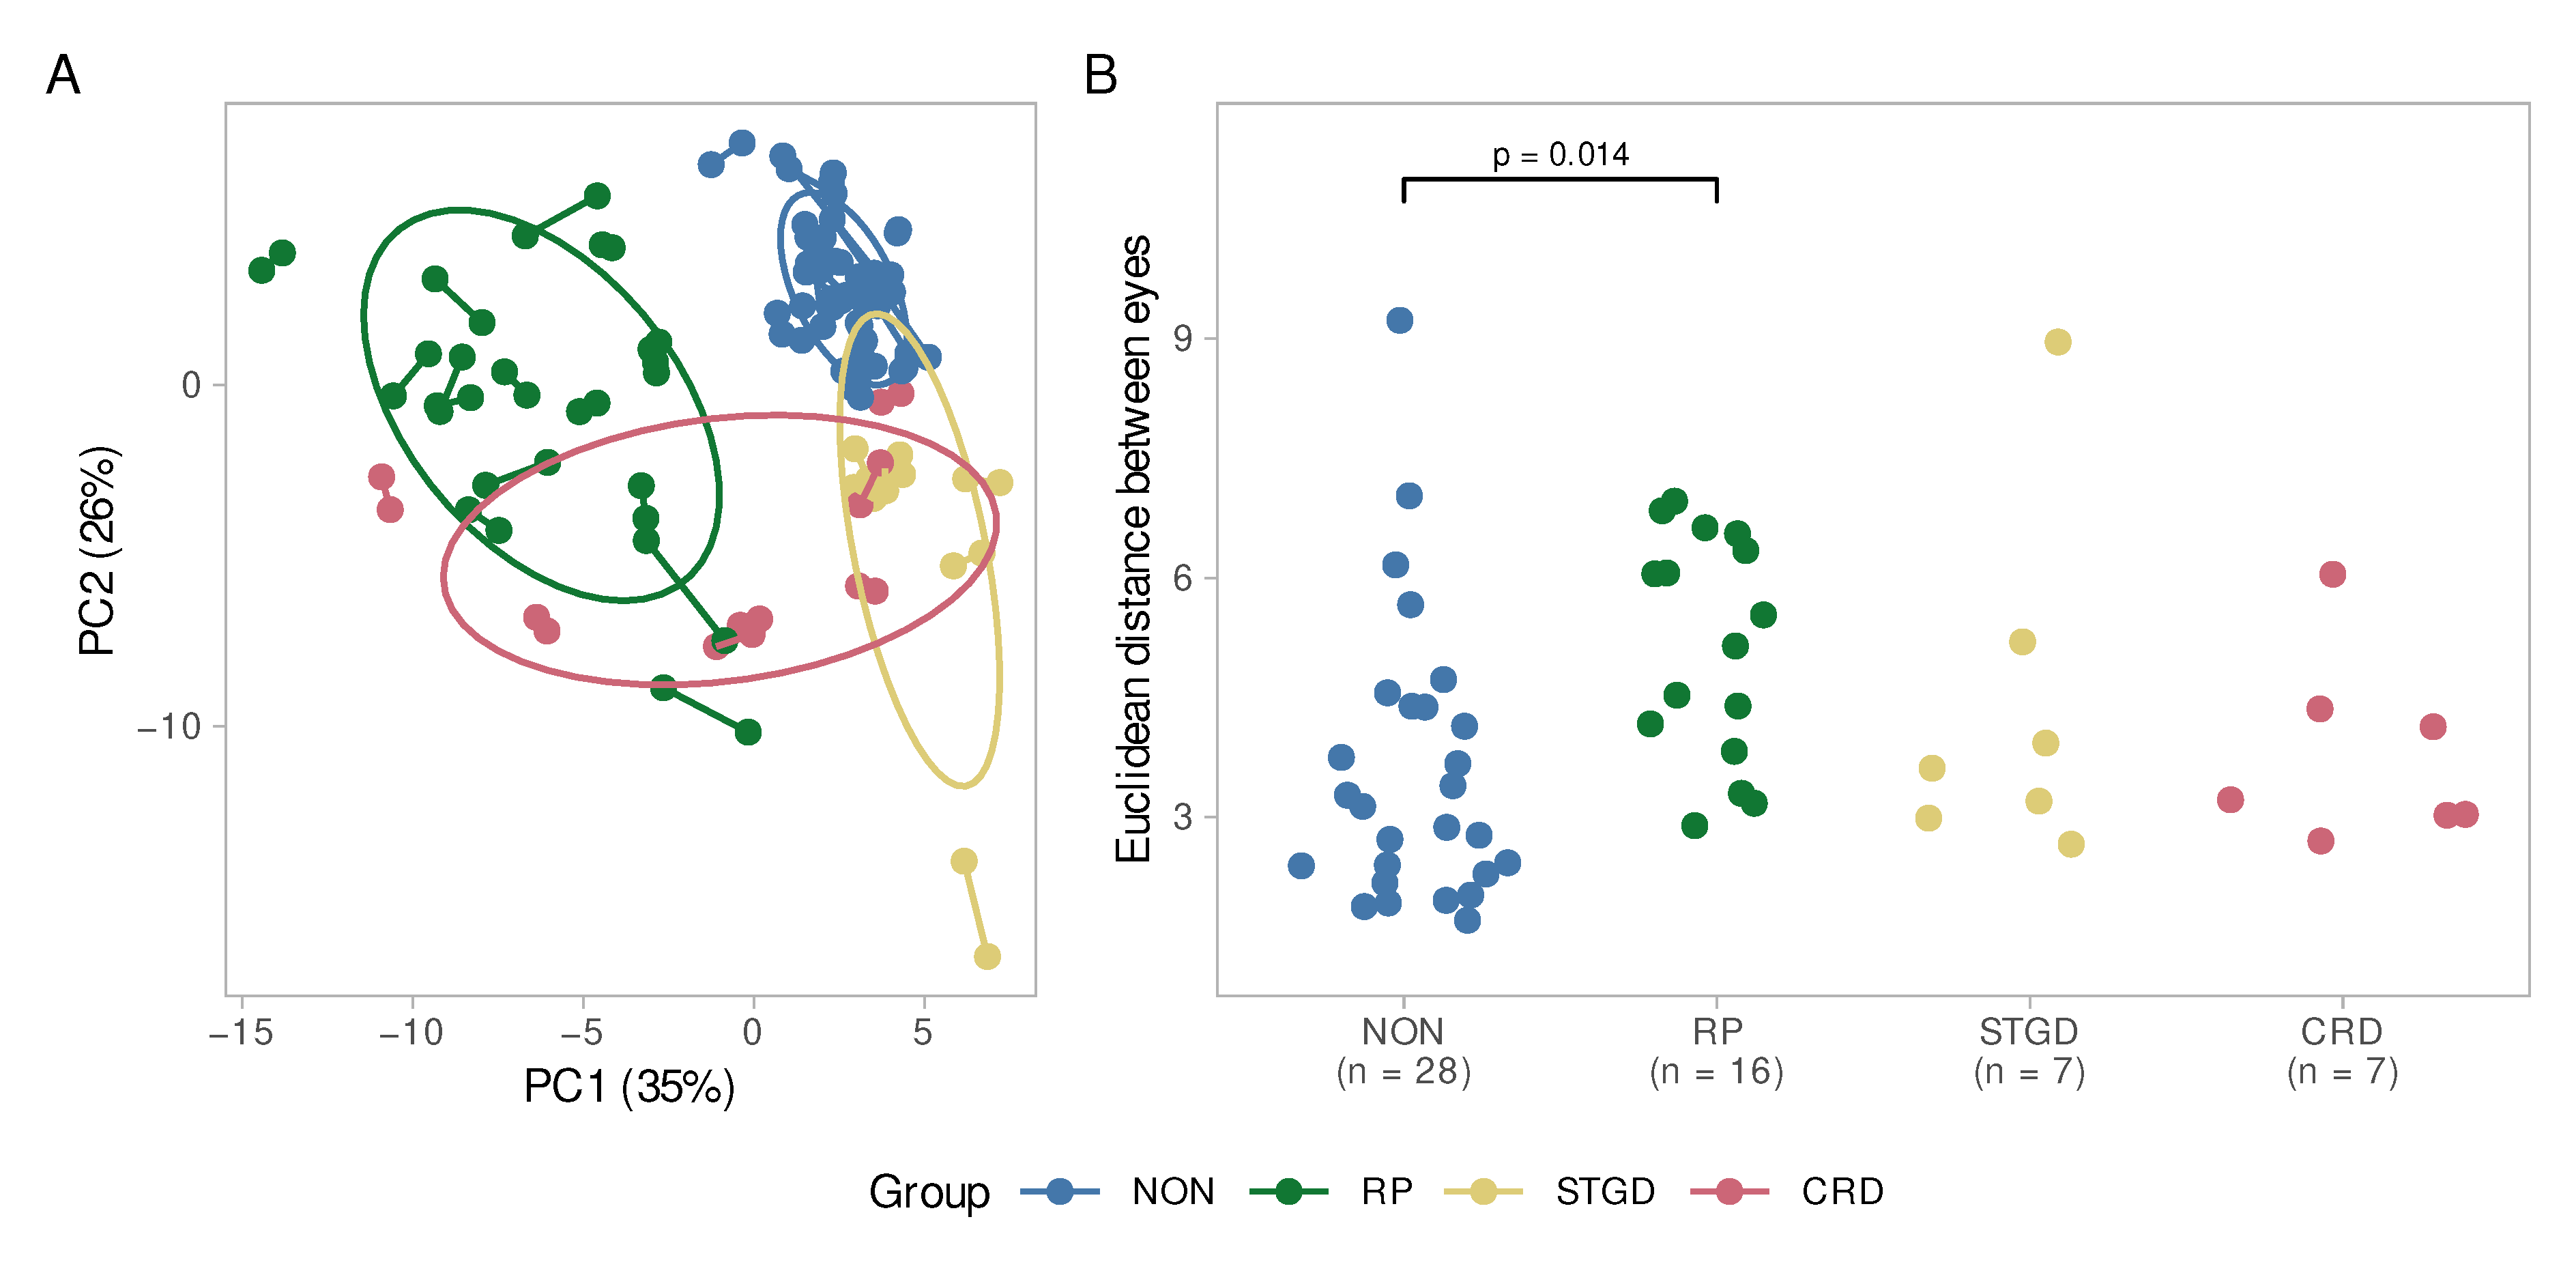
2.3. Interocular Symmetry

In a principal component analysis, we can depict each eye as a point by summarizing all variables into fewer principal components capturing the bulk of the dataset’s variance. The distance between single eyes depends on their similarity. In Figure 5A, both eyes of each individual are linked. In general, the eyes of control individuals or patients with STGD or CRD are closer, indicating a higher level of symmetry than in patients with RP. The controls also appeared to form a dense cluster, while individuals with IRDs were more scattered, indicating a more variable profile of layer and subfield thicknesses. Similarly in Figure 5B, the Euclidean distance between both eyes of each individual was calculated. This value is a direct measure of the eyes’ similarity. The ANOVA indicated that there was an overall difference across groups (F(3, 53) = 3.03, p = 0.037; η2 = 0.15, 95% CI [0.005, 1.00]), which could be attributed to the higher intraindividual heterogeneity in patients with RP (p = 0.014) in the post-hoc test.
Patients with RP had the strongest interocular differences, mainly affecting the ONL (in all subfields), GCL (C0, T2, and I2), RNFL (C0, T1, and S2), OPL (I1 and I2) and retinal pigment epithelium (RPE, I2) with mean differences of 10–20%. However, this did not appear to impact total retina thickness.
It should be noted that the small sample sizes of STGD and CRD could possibly affect the significance of the results. In particular, the ONL seemed to be heterogeneously altered. For both groups, strong changes in the ONL thickness were visible in the inner ETDRS subfields C0, S1, N1 and I1. In STGD patients, a similar pattern was observed regarding the RPE and to some extent in the OPL and RNFL.
The control group was not exempt from significant intraocular differences, for example in subfield C0 for the GCL, OPL and RPE as well as for S1 in the ONL and OPL and for S2 in the RNFL.

3. Discussion

The present study aimed to describe the changes in macular retinal layer thicknesses associated with RP, STGD and CRD. Most notably, we were able to report a diffuse thinning of the outer retinal layers in patients with RP sparing the fovea and partly compensated by an increase of the RNFL thickness. In CRD and STGD, the changes were slightly less pronounced and more symmetrical within patients. It appeared that CRD induces changes more locally in the central subfields, especially in the PR1/2 layer, while STGD predominantly affected the ONL.
As corroborated in this manuscript, retinal thinning was found in all subfields in RP patients. This is an essential feature of RP [29,30,31], which is mainly attributed to an atrophy of the outer retinal layers [30,32].
The ONL is mostly accountable for the ORL thinning. ONL thinning has been found repeatedly in humans and in animal models [23,33,34,35,36]. The degree of thinning is suggested to depend on disease stage and to be correlated with light sensitivity [23,34]. Hood et al. described a specific pattern in the transition zone in severely affected retinae, where a thinning of the photoreceptor outer subfields was followed by ONL thinning [32]. Although we were not able to confirm this order of changes, a strong dependence between these layers can be assumed.
Besides the ONL, the photoreceptor layer (PR1/2) was also strongly impacted in our RP group. The affection of this layer was described to eventually result in a thinning of the RPE [37,38].
Interestingly, we observed a thickening of the RNFL in all subfields with a stronger effect in the nasal, superior, and inferior than in the temporal region. Macular RNFL thickening is a common finding in other SD-OCT studies [30,34,39,40]. Nagasaka and Yoon used two meridian scans crossing the fovea vertically and horizontally. Supporting our results, their respective studies showed that the superior, nasal and inferior RNFL subfields were more thickened than the temporal side. Moreover, we found a slightly thickened RNFL in the superior and inferior subfields compared to the nasal one, which agrees with Nagasaka and Yoon’s data, although this pattern was not described previously. A thickened RNFL was also found peripapillary [41,42] next to thinned or normal RNFL [43,44], whereby the thickened subfield was mainly temporal. It should be noted that the temporal side of the optic nerve head directs to the nasal side of the macula. Thus, the observations of nasal macular and temporal peripapillary RNFL thickening blend perfectly into each other. However, the underlying pathology is still unclear. Possible reasons discussed are neuronal remodelling in response to the atrophic outer retinal layers, oedematous swelling or the proliferation of fibrous astrocytes [45,46]. Another interesting observation was made by Nagasaka et al. who found a relation between atrophic outer retinal layers, thickened inner retinal layers and an increased aqueous flare [30]. Thus, they suspect that inflammatory stimuli cause inner retinal thickening [30]. An interaction between RNFL thickening and GCL thinning was suggested by Hood et al. [40], who assumed a mechanical compensation of GCL loss by RNFL proliferation. In our observations, the patterns of RNFL and GCL fit in well; where the GCL is thinned, the RNFL is most thickened. Similar patterns can be suspected in the STGD and CRD groups. Nevertheless, as the effect is not significant, further investigations are required to prove an interaction between these layers.
It is worth noting that in previous studies the GCL was often measured in combination with the IPL [31,34,40]. Thus, the impact of the single layers remains uncertain. Nagasaka et al. found no changes in the IPL [30], but only within a 2 mm diameter of the fovea. Our measuring field of 6 mm diameter meanwhile revealed a thickening of all outer ring subfields. Consequently, combining the GCL and IPL may result in an underestimation of GCL thinning and overestimation of GCL thickening while concealing the relation to the RNFL.
Latest investigations on a mouse model demonstrated a hypertrophy of the horizontal cells in the INL of the central retina [47]. Under the assumption that hypertrophic processes lead to a thickening of the corresponding layer, our results provide a clinical correlate to this observation with a central INL thickening. However, these alterations remain minimal, providing INL cell types as a therapeutic target.
To our knowledge, this is the first study describing the OPL as a single layer in SD-OCT for IRDs. Interestingly, there is a tendency of thinning in the outer ring areas while the central and inner ring areas are thickened. The loss of connecting fibers due to dendritic retraction, mainly of rod bipolar cells, in the OPL has been described previously and can explain our findings of outer ring thinning [37,47]. In contrast, in an ultrastructural analysis, Stefanov et al. reported hypertrophy of amacrine cell processes in the OPL for the central retina, suggesting that this would cause central retinal thickening [47]. Our findings support this assumption.
In cone–rod dystrophies, cones are primarily affected in a centrifugal way. We could observe retinal thinning in the central and inner ring subfields, particularly affecting the ONL, where it even extended into the outer temporal subfield. This confirms previous OCT and histopathological results [48,49,50].
Altogether, there is a lack of data for retinal layer thicknesses other than the ONL and RNFL. In the outer retinal layers, ONL and PR1/2, the central pattern was similar to the one found in RP patients. This is also consistent with previous findings [22,48,49]. It must be noted that these studies examined layer thicknesses only centrally or in a 2 mm diameter around the fovea centralis. In contrast, although we could not find significant differences in thinning or thickening in the RPE, other authors described both effects [48,49]. Although larger cohorts of respectively fifteen and sixteen patients were examined by Cho and Zahlava, they segmented fewer B-scans (one foveal B-scan and six B-scans), which was shown to be a potential source of bias [15].
We found a tendency for a slightly thicker RNFL in the superior and inferior outer subfields. In contrast to our findings, another study described peripapillary RNFL thinning in the temporal, macula-directing quadrant [40]. The precisely opposite patterns of RNFL and GCL in CRD would fit Hood and colleagues’ assumption in RP patients. However, these changes were not significant, which could result from the small sample size.
Overall, the inner retinal layers appeared to be more preserved than the outer retinal layers as it occurs in RP. It is unclear whether these layers may become affected in later disease stages.
As described previously [26], STGD was associated with a centrifugal thinning in all sublayers. As in our study, the ONL was most severely affected.
In the present cohort, the RNFL showed a significant central thinning. Previous studies reported controversial findings regarding RNFL thickness changes in STGD. While some authors found a thinned macular or peripapillary RNFL [26,51,52], the most extensive study to date revealed thickening of the RNFL [53]. Interestingly, Genead and colleagues found a thinned peripapillary RNFL in half of their patients, while a few (18.5%) showed thickening [54]. In summary, the RNFL may be variably affected by STGD, and this effect also depends on disease progression.
LogMAR visual acuity was significantly associated with the thicknesses of retinal layers in various subfields. As described previously, these associations were generally positive, meaning that thicker retinal layers were associated with better visual acuity. This is consistent with previously reported studies [26,31,34,55,56]. However, a negative correlation was found for the RNFL, which corroborates Yoon et al.’s observations in patients with RP [39]. The most affected subfield was C0, representing the foveal region. Thus, we can confirm a significant relationship between visual acuity and the integrity of retinal structures.
Macular dystrophies are often described as bilateral diseases [57,58,59], but there are only a few studies investigating for interocular symmetry. In the STGD and CRD groups, we found a high degree of interocular symmetry which corroborates former results based mainly on BCVA, ERG, FAF or perimetry [24,60,61]. In contrast, the RP group showed a more pronounced asymmetry which contradicts results obtained by ERG, perimetry and FAF [62,63]. Even with SD-OCT, Tee et al. found no difference in the rate of ONL thinning between eyes [64]. One possible explanation for these differences may be that the lesions induced by RP are distributed more randomly on the retina than in other retinal dystrophies. This would result in interocular asymmetry with similar functional impairment, which is more readily assessed with ERG. We may speculate that the changes in retinal layer morphology, although large enough to indicate statistically significant asymmetry, are too small to result in clinical differences in ERG, perimetry or FAF. Moreover, various studies investigated different biomarkers concerning symmetry and, to our knowledge, this study was the first to include different retinal layer thicknesses. However, asymmetry was only obvious when facing single retinal layers in contrast to the total retina thickness which, considered alone, would have suggested a high rate of interocular symmetry.
In light of the present findings, the bilateral assessment of retinal lesions is especially important in patients with RP.

4. Materials and Methods

4.1. Participants

This is a retrospective study conducted in adherence to the tenets of the Declaration of Helsinki. The study protocol was approved by the Ethics committee of Hannover Medical School (Nr. 9426_BO_S_2020). Written consent was obtained from all patients or a legal guardian.
Patients with genetically confirmed RP, STGD, or CRD presenting at the department of ophthalmology from Hannover Medical School between 2014 and 2019 were included in the study. Age- and sex-matched controls without retinal pathologies were selected alongside. Age matching was performed within age groups spanning five years (i.e., 10–15 years of age; 15–20 years of age, etc.). Some control patients were matched to several patients with different inherited retinal diseases. All participants underwent a complete ophthalmological examination, including refraction, best corrected Snellen visual acuity converted to the logarithm of the minimum angle of resolution (logMAR), slit lamp biomicroscopy, applanation tonometry, fundus examination, SD-OCT, fundus autofluorescence, multifocal and full-field electroretinogram, as well as genetic testing.

4.2. Molecular Genetic Analysis

Blood samples of all included patients were taken for DNA extraction after informed consent had been signed according to the German Genetic Diagnostics Act. Molecular genetic testing was done by Next Generation Sequencing (NGS) using targeted gene panels [65,66]. Classification of variants followed the recommendations by the American College of Medical Genetics and Genomics (ACMG) standards and guidelines and the Association for Molecular Pathology (AMP) Clinical Practice Guidelines [67].

4.3. Imaging and Segmentation Using SD-OCT

Macular volume scans were captured using SD-OCT (Spectralis OCT, Heidelberg Engineering, Heidelberg, Germany) by qualified photographers. The full macular scans consisted of 49 horizontal, equidistant (124 µm) linear B-scans in a 20 × 20° area centered on the fovea. Scans of poor quality were excluded due to insufficient fixation or opacity of the optical axis (lens, cornea, or vitreous body). The macula scans were divided into nine subfields using the Early Treatment Diabetic Retinopathy Study (ETDRS) grid with three rings at 1, 3 and 6 mm diameter and four radial lines (C0, N1, N2, I1, I2, T1, T2, S1 and S2). The ETDRS grid was manually centered on the anatomic fovea centralis. In four cases, single peripheral subfields were outside the detected OCT scan area after centering due to poor fixation of the patients. An example is displayed in the Supplementary Figure S3B, where the I2 subfield could not be measured.
Automated segmentation from the Heidelberg Eye Explorer software (version 6.7.13.0, Heidelberg Engineering GmbH, Heidelberg, Germany) was confirmed or corrected manually by an experienced grader and then reviewed by another experienced grader. It consisted of the identification of the internal limiting membrane (ILM), the border between the RNFL and the GCL, the border between the GCL and the IPL, the border between the IPL and the INL, the border between the INL and the OPL, the border between the OPL and the ONL, the external limiting membrane (ELM), the border between the PR1/2 and the RPE, and of Bruch’s membrane (BM).
At least 45 out of 49 B-scans were manually segmented when automated segmentation failed. The process of manual segmentation took one to four hours per eye. If the image quality of single scans was too poor to distinguish single layers, their boundaries were set based on the adjacent B-scans. In atrophic zones, the layers were superimposed right upon each other. Examples for segmented SD-OCT B-scans are shown in Figure 1B, Figure 2B and Figure 3B. Additional SD-OCT data for exemplary patients as well as for one control is displayed in the Supplementary Figures S1–S4.
From these borders, the mean thickness (in µm) of the RNFL (as distance between ILM and RNFL border), GCL (as distance between RNFL and GCL borders), IPL (distance between GCL and IPL borders), INL (distance between IPL and INL borders), OPL (distance between INL and OPL borders), ONL (distance between OPL and ONL borders), ELM (distance between ONL border and ELM), PR1/2 (distance between ELM and RPE border) and RPE (distance between RPE and BM), the IRL (as the distance between ILM and OPL/ONL border), the ORL (as the distance between OPL/ONL border and BM) and the total retina (as the distance between ILM and BM) could be obtained for each ETDRS subfield and exported to a spreadsheet for statistical analysis.

4.4. Statistical Analyses

The statistical analysis was performed with R version 4.2.1 [68]. For each disease, the thickness of every subfield within each layer was compared to matched controls using generalized least squares models accounting for repeated measures (correlation within each patient) and heteroscedasticity (disease-specific constant variance) using the ‘nlme’ R-package [69,70]. The regression coefficients corresponding to the mean difference in layer thickness between patients and controls were depicted as heatmaps reproducing the ETDRS grid. The color scales of the heatmaps were harmonized to allow for comparison between figures.
Using the ‘robustlmm’ R-package [71], robust mixed linear models with patient as a random variable were fitted to assess the relationship of vision (logMAR) and layer thickness.
In both cases, the p-values were computed using a Wald t-distribution approximation as implemented in the ‘parameters’ R-package [72] and adjusted for multiple comparisons using the Holm procedure [73].
As logMAR did not satisfy distributional assumptions for a parametric test, it was compared across groups using the Kruskal–Wallis tests. For significant results, Dunn-tests were used subsequently to compare the individual IRDs to the control group. The p-values were adjusted based on a multivariate normal distribution as implemented in the ‘PMCMRplus’ R-package [74].
To assess interocular symmetry, the Euclidean distance between both eyes of each individual were computed using the scaled subfield thicknesses, so that thicker subfields do not overshadow thinner ones. These values were compared across groups with a one-way ANOVA. Post-hoc comparisons were performed using the ‘emmeans’ R-package and Dunnett-type contrasts with the corresponding p-value adjustment [75]. Since each control was matched to one or more patients with retinal disease, there are more controls than patients within each group but fewer controls than patients overall. Therefore, the groups in the symmetry analysis were of unequal size.
Additionally, interocular symmetry was depicted in a principal component analysis computed using the ‘prcomp’ R-function on the scaled and centered data after removal of summary values (i.e., the IRL, ORL, and retina thickness) and imputation of missing values (109/12177, 0.9%) using the k-nearest neighbors algorithm, as implemented in the ‘impute’ R-package [76]. In addition, the percent difference between the thickness of each subfield and layer was calculated and analyzed using a one-sided Wilcoxon signed rank test of the null that the difference between sides is smaller than 5%. The p-values were adjusted using the Holm procedure within group and layer. The results are presented as a heatmap of mean relative differences between sides.
In every case, model residuals were inspected visually, and statistical significance was accepted at p ≤ 0.05 (after correction for multiplicity).

5. Conclusions

Despite the low prevalence of IRDs resulting in small cohorts, the present study aimed to provide an overview of the retinal changes induced by RP, STGD, and CRD in a comparative approach backed by extensive manual segmentation of SD-OCT scans. These revealed thinned outer subfields for RP and thinned central subfields for CRD and STGD. The ONL and photoreceptor layers were most affected and may provide biomarkers for IRDs. We could demonstrate that, although bilateral, RP is less symmetric than CRD or STGD. Young or strongly visually impaired patients remain a challenge in OCT studies due to poor fixation. Overall, this study confirms assumptions about retinal remodeling in IRDs previously based on single cross-sectional SD-OCT images of the fovea using a more comprehensive characterization of the whole retina. These results are relevant for the development of specific therapeutic approaches. Moreover, the suggested structural biomarkers may enable to distinguish between disease entities early on. Longitudinal studies are warranted to describe the temporal component of those changes and better assess disease progression.

Supplementary Materials

The following supporting information can be downloaded at: https://www.mdpi.com/article/10.3390/ijms232416007/s1.

Author Contributions

Conceptualization, K.H. (Katerina Hufendiek) and K.H. (Karsten Hufendiek); methodology, J.G., K.H. (Katerina Hufendiek) and J.D.; software, J.D.; validation, K.H. (Katerina Hufendiek) and K.H. (Karsten Hufendiek); formal analysis, J.D.; investigation, C.J., H.S. and K.H. (Karsten Hufendiek); resources, H.S. and C.F.; data curation, C.J., H.S. and K.H. (Karsten Hufendiek), J.G. and J.D.; writing—original draft preparation, J.G., K.H. (Katerina Hufendiek) and J.D.; writing—review and editing, K.H. (Karsten Hufendiek), U.K., H.S. and C.F.; visualization, J.D.; supervision, K.H. (Katerina Hufendiek); project administration, K.H. (Katerina Hufendiek) and K.H. (Karsten Hufendiek); funding acquisition, C.F. All authors have read and agreed to the published version of the manuscript.

Funding

This research received no external funding.

Institutional Review Board Statement

The study was conducted in accordance with the Declaration of Helsinki, and approved by the Ethics Committee of Medical School Hanover (protocol code Nr. 9426_BO_S_2020, approved 23 November 2020).

Informed Consent Statement

Informed consent was obtained from all subjects involved in the study.

Data Availability Statement

The datasets used and/or analyzed during the current study are available from the corresponding author on reasonable request.

Acknowledgments

The authors would like to thank the German Ministry of Lower Saxony for its scientific and cultural organization to support our retinal imaging studies in the Ophthalmology Department of Hannover Medical School financed by the “Niedersachsen Vorab”.

Conflicts of Interest

The authors declare no conflict of interest.

References

  1. Birtel, J.; Yusuf, I.H.; Priglinger, C.; Rudolph, G.; Charbel Issa, P. Diagnosis of Inherited Retinal Diseases. Klin. Mon. Für Augenheilkd. 2021, 238, 249–259. [Google Scholar] [CrossRef]
  2. Heath Jeffery, R.C.; Mukhtar, S.A.; McAllister, I.L.; Morgan, W.H.; Mackey, D.A.; Chen, F.K. Inherited Retinal Diseases Are the Most Common Cause of Blindness in the Working-Age Population in Australia. Ophthalmic Genet. 2021, 42, 431. [Google Scholar] [CrossRef]
  3. Liew, G.; Michaelides, M.; Bunce, C. A Comparison of the Causes of Blindness Certifications in England and Wales in Working Age Adults (16–64 Years), 1999–2000 with 2009–2010. BMJ Open 2014, 4, 4015. [Google Scholar] [CrossRef]
  4. Strauss, R.W.; Ho, A.; Muñoz, B.; Cideciyan, A.V.; Sahel, J.A.; Sunness, J.S.; Birch, D.G.; Bernstein, P.S.; Michaelides, M.; Traboulsi, E.I.; et al. The Natural History of the Progression of Atrophy Secondary to Stargardt Disease (ProgStar) Studies: Design and Baseline Characteristics: ProgStar Report No. 1. Ophthalmology 2016, 123, 817–828. [Google Scholar] [CrossRef]
  5. Hamel, C. Retinitis Pigmentosa. Orphanet J. Rare Dis. 2006, 1, 40. [Google Scholar] [CrossRef]
  6. Birtel, J.; Eisenberger, T.; Gliem, M.; Müller, P.L.; Herrmann, P.; Betz, C.; Zahnleiter, D.; Neuhaus, C.; Lenzner, S.; Holz, F.G.; et al. Clinical and Genetic Characteristics of 251 Consecutive Patients with Macular and Cone/Cone-Rod Dystrophy. Sci. Rep. 2018, 8, 4824. [Google Scholar] [CrossRef] [Green Version]
  7. Verbakel, S.K.; van Huet, R.A.C.; Boon, C.J.F.; den Hollander, A.I.; Collin, R.W.J.; Klaver, C.C.W.; Hoyng, C.B.; Roepman, R.; Klevering, B.J. Non-Syndromic Retinitis Pigmentosa. Prog. Retin. Eye Res. 2018, 66, 157–186. [Google Scholar] [CrossRef]
  8. Fujinami, K.; Zernant, J.; Chana, R.K.; Wright, G.A.; Tsunoda, K.; Ozawa, Y.; Tsubota, K.; Robson, A.G.; Holder, G.E.; Allikmets, R.; et al. Clinical and Molecular Characteristics of Childhood-Onset Stargardt Disease. Ophthalmology 2015, 122, 326–334. [Google Scholar] [CrossRef] [Green Version]
  9. Schneider, N.; Sundaresan, Y.; Gopalakrishnan, P.; Beryozkin, A.; Hanany, M.; Levanon, E.Y.; Banin, E.; Ben-Aroya, S.; Sharon, D. Inherited Retinal Diseases: Linking Genes, Disease-Causing Variants, and Relevant Therapeutic Modalities. Prog. Retin. Eye Res. 2021, 2021, 101029. [Google Scholar] [CrossRef]
  10. Lee, K.; Garg, S. Navigating the Current Landscape of Clinical Genetic Testing for Inherited Retinal Dystrophies. Genet. Med. 2015, 17, 245–252. [Google Scholar] [CrossRef]
  11. Duncker, T.; Stein, G.E.; Lee, W.; Tsang, S.H.; Zernant, J.; Bearelly, S.; Hood, D.C.; Greenstein, V.C.; Delori, F.C.; Allikmets, R.; et al. Quantitative Fundus Autofluorescence and Optical Coherence Tomography in ABCA4 Carriers. Investig. Ophthalmol. Vis. Sci. 2015, 56, 7274–7285. [Google Scholar] [CrossRef] [PubMed] [Green Version]
  12. Gill, J.S.; Georgiou, M.; Kalitzeos, A.; Moore, A.T.; Michaelides, M. Progressive Cone and Cone-Rod Dystrophies: Clinical Features, Molecular Genetics and Prospects for Therapy. Br. J. Ophthalmol. 2019, 103, 711–720. [Google Scholar] [CrossRef] [PubMed] [Green Version]
  13. Huang, D.; Swanson, E.A.; Lin, C.P.; Schuman, J.S.; Stinson, W.G.; Chang, W.; Hee, M.R.; Flotte, T.; Gregory, K.; Puliafito, C.A.; et al. Optical Coherence Tomography. Science 1991, 254, 1178–1181. [Google Scholar] [CrossRef] [Green Version]
  14. McLellan, G.J.; Rasmussen, C.A. Optical Coherence Tomography for the Evaluation of Retinal and Optic Nerve Morphology in Animal Subjects: Practical Considerations. Vet. Ophthalmol. 2012, 15 (Suppl. 2), 13–28. [Google Scholar] [CrossRef] [Green Version]
  15. Velaga, S.B.; Nittala, M.G.; Jenkins, D.; Melendez, J.; Ho, A.; Strauss, R.W.; Scholl, H.P.; Sadda, S.V.R. Impact of Segmentation Density on Spectral Domain Optical Coherence Tomography Assessment in Stargardt Disease. Graefes Arch. Clin. Exp. Ophthalmol. 2019, 257, 549–556. [Google Scholar] [CrossRef]
  16. Kim, M.; Lee, S.; Han, J.; Yu, S.Y.; Kwak, H. Segmentation Error and Macular Thickness Measurements Obtained with Spectral-Domain Optical Coherence Tomography Devices in Neovascular Age-Related Macular Degeneration. Indian J. Ophthalmol. 2013, 61, 213. [Google Scholar] [CrossRef]
  17. Yang, Q.; Reisman, C.A.; Chan, K.; Ramachandran, R.; Raza, A.; Hood, D.C. Automated Segmentation of Outer Retinal Layers in Macular OCT Images of Patients with Retinitis Pigmentosa. Biomed. Opt. Express 2011, 2, 2493. [Google Scholar] [CrossRef] [Green Version]
  18. Gomes, N.L.; Greenstein, V.C.; Carlson, J.N.; Tsang, S.H.; Theodore Smith, R.; Carr, R.E.; Hood, D.C.; Chang, S. A Comparison of Fundus Autofluorescence and Retinal Structure in Patients with Stargardt Disease. Investig. Ophthalmol. Vis. Sci. 2009, 50, 3953. [Google Scholar] [CrossRef] [Green Version]
  19. Park, J.C.; Collison, F.T.; Fishman, G.A.; Allikmets, R.; Zernant, J.; Liu, M.; Jason McAnany, J. Objective Analysis of Hyperreflective Outer Retinal Bands Imaged by Optical Coherence Tomography in Patients with Stargardt Disease. Investig. Ophthalmol. Vis. Sci. 2015, 56, 4662. [Google Scholar] [CrossRef] [Green Version]
  20. Park, S.P.; Chang, S.; Allikmets, R.; Smith, R.T.; Burke, T.R.; Gregory-Roberts, E.; Tsang, S.H. Disruption in Bruch Membrane in Patients with Stargardt Disease. Ophthalmic Genet. 2012, 33, 49. [Google Scholar] [CrossRef]
  21. Battaglia Parodi, M.; la Spina, C.; Triolo, G.; Riccieri, F.; Pierro, L.; Gagliardi, M.; Bandello, F. Correlation of SD-OCT Findings and Visual Function in Patients with Retinitis Pigmentosa. Graefes Arch. Clin. Exp. Ophthalmol. 2016, 254, 1275–1279. [Google Scholar] [CrossRef]
  22. Lima, L.H.; Sallum, J.M.; Spaide, R.F. Outer Retina Analysis by Optical Coherence Tomography in Cone-Rod Dystrophy Patients. Retina 2013, 33, 1877–1880. [Google Scholar] [CrossRef] [PubMed]
  23. Aleman, T.S.; Cideciyan, A.V.; Sumaroka, A.; Schwartz, S.B.; Roman, A.J.; Windsor, E.A.M.; Steinberg, J.D.; Branham, K.; Othman, M.; Swaroop, A.; et al. Inner Retinal Abnormalities in X-Linked Retinitis Pigmentosa with RPGR Mutations. Investig. Ophthalmol. Vis. Sci. 2007, 48, 4759. [Google Scholar] [CrossRef] [Green Version]
  24. Tanna, P.; Georgiou, M.; Strauss, R.W.; Ali, N.; Kumaran, N.; Kalitzeos, A.; Fujinami, K.; Michaelides, M. Cross-Sectional and Longitudinal Assessment of the Ellipsoid Zone in Childhood-Onset Stargardt Disease. Transl. Vis. Sci. Technol. 2019, 8, 1. [Google Scholar] [CrossRef] [Green Version]
  25. Ergun, E.; Hermann, B.; Wirtitsch, M.; Unterhuber, A.; Ko, T.H.; Sattmann, H.; Scholda, C.; Fujimoto, J.G.; Stur, M.; Drexler, W. Assessment of Central Visual Function in Stargardt’s Disease/Fundus Flavimaculatus with Ultrahigh-Resolution Optical Coherence Tomography. Investig. Ophthalmol. Vis. Sci. 2005, 46, 310–316. [Google Scholar] [CrossRef]
  26. Arrigo, A.; Romano, F.; Aragona, E.; Nunzio, C.D.; Sperti, A.; Bandello, F.; Parodi, M.B. OCTA-Based Identification of Different Vascular Patterns in Stargardt Disease. Transl. Vis. Sci. Technol. 2019, 8, 26. [Google Scholar] [CrossRef] [Green Version]
  27. Burke, T.R.; Rhee, D.W.; Theodore Smith, R.; Tsang, S.H.; Allikmets, R.; Chang, S.; Lazow, M.A.; Hood, D.C.; Greenstein, V.C. Quantification of Peripapillary Sparing and Macular Involvement in Stargardt Disease (STGD1). Investig. Ophthalmol. Vis. Sci. 2011, 52, 8006. [Google Scholar] [CrossRef] [Green Version]
  28. Holladay, J.T. Visual Acuity Measurements. J. Cataract. Refract. Surg. 2004, 30, 287–290. [Google Scholar] [CrossRef]
  29. Li, G.; de La Garza, B.; Shih, Y.Y.I.; Muir, E.R.; Duong, T.Q. Layer-Specific Blood-Flow MRI of Retinitis Pigmentosa in RCS Rats. Exp. Eye Res. 2012, 101, 90. [Google Scholar] [CrossRef] [Green Version]
  30. Nagasaka, Y.; Ito, Y.; Ueno, S.; Terasaki, H. Increased Aqueous Flare Is Associated with Thickening of Inner Retinal Layers in Eyes with Retinitis Pigmentosa. Sci. Rep. 2016, 6, 33921. [Google Scholar] [CrossRef]
  31. Liu, G.; Li, H.; Liu, X.; Xu, D.; Wang, F. Structural Analysis of Retinal Photoreceptor Ellipsoid Zone and Postreceptor Retinal Layer Associated with Visual Acuity in Patients with Retinitis Pigmentosa by Ganglion Cell Analysis Combined with OCT Imaging. Medicine 2016, 95, e5785. [Google Scholar] [CrossRef] [PubMed]
  32. Hood, D.C.; Lazow, M.A.; Locke, K.G.; Greenstein, V.C.; Birch, D.G. The Transition Zone between Healthy and Diseased Retina in Patients with Retinitis Pigmentosa. Investig. Ophthalmol. Vis. Sci. 2011, 52, 101. [Google Scholar] [CrossRef] [PubMed] [Green Version]
  33. Sousa, K.; Fernandes, T.; Gentil, R.; Mendonça, L.; Falcão, M. Outer Retinal Layers as Predictors of Visual Acuity in Retinitis Pigmentosa: A Cross-Sectional Study. Graefe’s Arch. Clin. Exp. Ophthalmol. 2019, 257, 265–271. [Google Scholar] [CrossRef] [Green Version]
  34. Vámos, R.; Tátrai, E.; Németh, J.; Holder, G.E.; DeBuc, D.C.; Somfai, G.M. The Structure and Function of the Macula in Patients with Advanced Retinitis Pigmentosa. Investig. Ophthalmol. Vis. Sci. 2011, 52, 8425–8432. [Google Scholar] [CrossRef] [PubMed] [Green Version]
  35. Nakazawa, M.; Hara, A.; Ishiguro, S.I. Optical Coherence Tomography of Animal Models of Retinitis Pigmentosa: From Animal Studies to Clinical Applications. Biomed. Res. Int. 2019, 2019, 8276140. [Google Scholar] [CrossRef] [PubMed] [Green Version]
  36. Aleman, T.S.; Cideciyan, A.V.; Sumaroka, A.; Windsor, E.A.M.; Herrera, W.; White, D.A.; Kaushal, S.; Naidu, A.; Roman, A.J.; Schwartz, S.B.; et al. Retinal Laminar Architecture in Human Retinitis Pigmentosa Caused by Rhodopsin Gene Mutations. Investig. Ophthalmol. Vis. Sci. 2008, 49, 1580. [Google Scholar] [CrossRef] [PubMed] [Green Version]
  37. Gartner, S.; Henkind, P. Pathology of Retinitis Pigmentosa. Ophthalmology 1982, 89, 1425–1432. [Google Scholar] [CrossRef]
  38. Milam, A.H.; Li, Z.Y.; Fariss, R.N. Histopathology of the Human Retina in Retinitis Pigmentosa. Prog. Retin. Eye Res. 1998, 17, 175–205. [Google Scholar] [CrossRef]
  39. Yoon, C.K.; Yu, H.G. Ganglion Cell-Inner Plexiform Layer and Retinal Nerve Fibre Layer Changes within the Macula in Retinitis Pigmentosa: A Spectral Domain Optical Coherence Tomography Study. Acta Ophthalmol. 2018, 96, e180–e188. [Google Scholar] [CrossRef] [Green Version]
  40. Hood, D.C.; Lin, C.E.; Lazow, M.A.; Locke, K.G.; Zhang, X.; Birch, D.G. Thickness of Receptor and Post-Receptor Retinal Layers in Patients with Retinitis Pigmentosa Measured with Frequency-Domain Optical Coherence Tomography. Investig. Ophthalmol. Vis. Sci. 2009, 50, 2328. [Google Scholar] [CrossRef]
  41. Ilhan, C.; Citirik, M. Glial Proliferation and Atrophy: Two Poles of Optic Disc in Patients with Retinitis Pigmentosa. J. Curr. Ophthalmol. 2019, 31, 416. [Google Scholar] [CrossRef]
  42. Birtel, T.H.; Birtel, J.; Hess, K.; Clemens, A.C.; Lindner, M.; Herrmann, P.; Holz, F.G.; Gliem, M. Analysis of Imaging Biomarkers and Retinal Nerve Fiber Layer Thickness in RPGR-Associated Retinitis Pigmentosa. Graefes Arch. Clin. Exp. Ophthalmol. 2021, 259, 3597–3604. [Google Scholar] [CrossRef]
  43. Sobaci, G.; Özge, G.; Gündoǧan, F.Ç. Cone Dysfunctions in Retinitis Pigmentosa with Retinal Nerve Fiber Layer Thickening. Clin. Ophthalmol. 2012, 6, 473. [Google Scholar] [CrossRef] [PubMed] [Green Version]
  44. Anastasakis, A.; Genead, M.A.; McAnany, J.J.; Fishman, G.A. Evaluation of Retinal Nerve Fiber Layer Thickness in Retinitis Pigmentosa Patients Using Spectral-Domain OCT. Retina 2012, 32, 358. [Google Scholar] [CrossRef] [PubMed]
  45. Liu, G.; Liu, X.; Li, H.; Du, Q.; Wang, F. Optical Coherence Tomographic Analysis of Retina in Retinitis Pigmentosa Patients. Ophthalmic Res. 2016, 56, 111–122. [Google Scholar] [CrossRef] [PubMed]
  46. Friesacher, A.; Lopez Torres, L.T.; Valmaggia, C.; Rüesch, R.; Todorova, M.G. Linking the Presence of Macular Oedema to Structural and Functional Alterations in Retinitis Pigmentosa. Klin. Mon. Für Augenheilkd. 2021, 238, 418–427. [Google Scholar] [CrossRef]
  47. Stefanov, A.; Novelli, E.; Strettoi, E. Inner Retinal Preservation in the Photoinducible I307N Rhodopsin Mutant Mouse, a Model of Autosomal Dominant Retinitis Pigmentosa. J. Comp. Neurol. 2020, 528, 1502. [Google Scholar] [CrossRef]
  48. Zahlava, J.; Lestak, J.; Karel, I. Optical Coherence Tomography in Progressive Cone Dystrophy. Biomed. Pap. Med. Fac. Palacky Univ. Olomouc 2014, 158, 628–634. [Google Scholar] [CrossRef] [Green Version]
  49. Cho, S.C.; Woo, S.J.; Park, K.H.; Hwang, J.M. Morphologic Characteristics of the Outer Retina in Cone Dystrophy on Spectral-Domain Optical Coherence Tomography. Korean J. Ophthalmol. 2013, 27, 19–27. [Google Scholar] [CrossRef] [Green Version]
  50. Turney, C.; Chong, N.H.V.; Alexander, R.A.; Hogg, C.R.; Fleming, L.; Flack, D.; Barnett, K.C.; Bird, A.C.; Holder, G.E.; Luthert, P.J. Pathological and Electrophysiological Features of a Canine Cone–Rod Dystrophy in the Miniature Longhaired Dachshund. Investig. Ophthalmol. Vis. Sci. 2007, 48, 4240–4249. [Google Scholar] [CrossRef]
  51. Reich, M.; Lübke, J.; Joachimsen, L.; Stifter, J.; Küchlin, S.; Böhringer, D.; Lange, C.; Lagrèze, W.A. Thinner Temporal Peripapillary Retinal Nerve Fibre Layer in Stargardt Disease Detected by Optical Coherence Tomography. Graefes Arch. Clin. Exp. Ophthalmol. 2021, 259, 1521–1528. [Google Scholar] [CrossRef]
  52. Bojinova, R.I.; Türksever, C.; Schötzau, A.; Valmaggia, C.; Schorderet, D.F.; Todorova, M.G. Reduced Metabolic Function and Structural Alterations in Inherited Retinal Dystrophies: Investigating the Effect of Peripapillary Vessel Oxygen Saturation and Vascular Diameter on the Retinal Nerve Fibre Layer Thickness. Acta Ophthalmol. 2017, 95, 252–261. [Google Scholar] [CrossRef] [PubMed] [Green Version]
  53. Whitmore, S.S.; Fortenbach, C.R.; Cheng, J.L.; DeLuca, A.P.; Critser, D.B.; Geary, E.L.; Hoffmann, J.M.; Stone, E.M.; Han, I.C. Analysis of Retinal Sublayer Thicknesses and Rates of Change in ABCA4-Associated Stargardt Disease. Sci. Rep. 2020, 10, 16576. [Google Scholar] [CrossRef] [PubMed]
  54. Genead, M.A.; Fishman, G.A.; Anastasakis, A. Spectral-Domain OCT Peripapillary Retinal Nerve Fibre Layer Thickness Measurements in Patients with Stargardt Disease. Br. J. Ophthalmol. 2011, 95, 689–693. [Google Scholar] [CrossRef] [PubMed]
  55. Hara, A.; Nakazawa, M.; Saito, M.; Suzuki, Y. The Qualitative Assessment of Optical Coherence Tomography and the Central Retinal Sensitivity in Patients with Retinitis Pigmentosa. PLoS ONE 2020, 15, e0232700. [Google Scholar] [CrossRef]
  56. Mucciolo, D.P.; Lippera, M.; Giorgio, D.; Sodi, A.; Passerini, I.; Cipollini, F.; Virgili, G.; Giansanti, F.; Murro, V. Outer Nuclear Layer Relevance in Visual Function Correlated to Quantitative Enface OCT Parameters in Stargardt Disease. Eur. J. Ophthalmol. 2021, 31, 3248–3258. [Google Scholar] [CrossRef]
  57. Tanna, P.; Strauss, R.W.; Fujinami, K.; Michaelides, M. Stargardt Disease: Clinical Features, Molecular Genetics, Animal Models and Therapeutic Options. Br. J. Ophthalmol. 2017, 101, 25. [Google Scholar] [CrossRef] [Green Version]
  58. Heath Jeffery MChD, R.C.; Chen, F.K.; Fred Chen, C.K. Stargardt Disease: Multimodal Imaging: A Review. Clin. Exp. Ophthalmol. 2021, 49, 498–515. [Google Scholar] [CrossRef]
  59. Dias, M.F.; Joo, K.; Kemp, J.A.; Fialho, S.L.; da Silva Cunha, A.; Woo, S.J.; Kwon, Y.J. Molecular Genetics and Emerging Therapies for Retinitis Pigmentosa: Basic Research and Clinical Perspectives. Prog. Retin. Eye Res. 2018, 63, 107–131. [Google Scholar] [CrossRef]
  60. Galli-Resta, L.; Falsini, B.; Rossi, G.; Piccardi, M.; Ziccardi, L.; Fadda, A.; Minnella, A.; Marangoni, D.; Placidi, G.; Campagna, F.; et al. Bilateral Symmetry of Visual Function Loss in Cone–Rod Dystrophies. Investig. Ophthalmol. Vis. Sci. 2016, 57, 3759–3768. [Google Scholar] [CrossRef]
  61. Georgiou, M.; Kane, T.; Tanna, P.; Bouzia, Z.; Singh, N.; Kalitzeos, A.; Strauss, R.W.; Fujinami, K.; Michaelides, M. Prospective Cohort Study of Childhood-Onset Stargardt Disease: Fundus Autofluorescence Imaging, Progression, Comparison with Adult-Onset Disease, and Disease Symmetry. Am. J. Ophthalmol. 2020, 211, 159–175. [Google Scholar] [CrossRef] [PubMed] [Green Version]
  62. Massof, R.W.; Finkelstein, D.; Starr, S.J.; Kenyon, K.R.; Fleischman, J.A.; Maumenee, I.H. Bilateral Symmetry of Vision Disorders in Typical Retinitis Pigmentosa. Br. J. Ophthalmol. 1979, 63, 90. [Google Scholar] [CrossRef] [PubMed] [Green Version]
  63. Fakin, A.; Jarc-Vidmar, M.; Glavač, D.; Bonnet, C.; Petit, C.; Hawlina, M. Fundus Autofluorescence and Optical Coherence Tomography in Relation to Visual Function in Usher Syndrome Type 1 and 2. Vis. Res. 2012, 75, 60–70. [Google Scholar] [CrossRef] [PubMed] [Green Version]
  64. Tee, J.J.L.; Carroll, J.; Webster, A.R.; Michaelides, M. Quantitative Analysis of Retinal Structure Using Spectral-Domain Optical Coherence Tomography in RPGR-Associated Retinopathy. Am. J. Ophthalmol. 2017, 178, 18. [Google Scholar] [CrossRef] [Green Version]
  65. Marquardt, A.; Stöhr, H.; Passmore, L.A.; Krämer, F.; Rivera, A.; Weber, B.H.F. Mutations in a Novel Gene, VMD2, Encoding a Protein of Unknown Properties Cause Juvenile-Onset Vitelliform Macular Dystrophy (Best’s Disease). Hum. Mol. Genet. 1998, 7, 1517–1525. [Google Scholar] [CrossRef] [Green Version]
  66. Schulz, H.L.; Grassmann, F.; Kellner, U.; Spital, G.; Rüther, K.; Jägle, H.; Hufendiek, K.; Rating, P.; Huchzermeyer, C.; Baier, M.J.; et al. Mutation Spectrum of the ABCA4 Gene in 335 Stargardt Disease Patients from a Multicenter German Cohort—Impact of Selected Deep Intronic Variants and Common SNPs. Investig. Ophthalmol. Vis. Sci. 2017, 58, 394. [Google Scholar] [CrossRef] [Green Version]
  67. Richards, S.; Aziz, N.; Bale, S.; Bick, D.; Das, S.; Gastier-Foster, J.; Grody, W.W.; Hegde, M.; Lyon, E.; Spector, E.; et al. Standards and Guidelines for the Interpretation of Sequence Variants: A Joint Consensus Recommendation of the American College of Medical Genetics and Genomics and the Association for Molecular Pathology. Genet. Med. 2015, 17, 405. [Google Scholar] [CrossRef] [Green Version]
  68. R Core Team. R: A Language and Environment for Statistical Computing. Available online: https://www.r-project.org/ (accessed on 17 August 2022).
  69. Pinheiro, J.; Bates, D. Nlme: Linear and Nonlinear Mixed Effects Models. Available online: https://cran.r-project.org/web/packages/nlme/index.html (accessed on 17 August 2022).
  70. Pinheiro, J.; Bates, D. Mixed-Effects Models in S and S-PLUS; Springer: New York, NY, USA, 2000; ISBN 978-0-387-98957-0. [Google Scholar]
  71. Koller, M. Robustlmm: An R Package for Robust Estimation of Linear Mixed-Effects Models. J. Stat. Softw. 2016, 75, 1–24. [Google Scholar] [CrossRef] [Green Version]
  72. Lüdecke, D.; Ben-Shachar, M.; Patil, I.; Makowski, D. Extracting, Computing and Exploring the Parameters of Statistical Models Using R. J. Open Source Softw. 2020, 5, 2445. [Google Scholar] [CrossRef]
  73. Holm, S. A Simple Sequentially Rejective Multiple Test Procedure. Scand. J. Stat. 1979, 6, 65–70. [Google Scholar]
  74. Pohlert, T. PMCMRplus: Calculate Pairwise Multiple Comparisons of Mean Rank Sums Extended. Available online: https://cran.r-project.org/web/packages/PMCMRplus/index.html (accessed on 17 August 2022).
  75. Lenth, R. Emmeans: Estimated Marginal Means, Aka Least-Squares Means. Available online: https://cran.r-project.org/web/packages/emmeans/index.html (accessed on 17 August 2022).
  76. Hastie, T.; Tibshirani, R.; Narasimhan, B.; Chu, G. Impute: Imputation for Microarray Data. Available online: http://www.bioconductor.org/packages/release/bioc/html/impute.html (accessed on 17 August 2022).
Figure 1. (A) Mean difference in layer thickness for Retinitis pigmentosa (RP) compared to controls represented as a heatmap on the ETDRS grid. Significant differences are marked with a red star (*) in the particular subfield. RNFL = retinal nerve fiber layer, GCL = ganglion cell layer, IPL = inner plexiform layer, INL = inner nuclear layer, OPL = outer plexiform layer, ONL = outer nuclear layer, PR1/2 = photoreceptor layer 1 and 2, RPE = retinal pigment epithelium, IRL = inner retinal layers (including RNFL, GCL, IPL, INL and OPL), ORL = outer retinal layers (including ONL, PR1/2, RPE); (B) example for a manually segmented SD-OCT scan from the fovea from RP patient 24.
Ijms 23 16007 g001
Figure 2. (A) Mean difference in layer thickness for cone–rod dystrophy (CRD) compared to controls represented as a heatmap on the ETDRS grid. Significant differences are marked with a red star (*) in the particular subfield; (B) example for a manually segmented SD-OCT scan from the fovea from CRD patient 5.
Ijms 23 16007 g002
Figure 3. (A) Mean difference in layer thickness for Stargardt disease (STGD) compared to controls represented as a heatmap on the ETDRS grid. Significant differences are marked with a red star (*) in the particular subfield; (B) example for a manually segmented SD-OCT scan from the fovea from STGD patient 12.
Ijms 23 16007 g003
Figure 4. Relation between LogMAR VA and layer thickness for the 20 most significant subfields and layers. NON = Controls, STGD = Stargardt disease, RP = Retinitis pigmentosa, CRD = Cone rod dystrophy, Retina = Total retina thickness, RNFL = Retinal nerve fiber layer, ONL = Outer nuclear layer, PR1/2 = photoreceptor layer 1 and 2, GCL = ganglion cell layer, ORL = Outer retinal layers.
Ijms 23 16007 g004
Figure 5. (A) Principal component analysis. The difference between both eyes of each patient is displayed. Each eye pair is connected by a line. The greater the distance between two points, the greater is the difference between the eyes of a patient. The ellipses represent the diseases as clusters. The controls (NON) and STGD group seem to be very homogeneously according to their small ellipses and short inter-eye distances. For the CRD group, there is a high interocular symmetry, while the intragroup variability is higher than in controls and STGD. The RP group reveals interocular as well as intragroup heterogeneity; (B) Euclidean distance between the eyes of the patients. Here, as well, the RP group shows a wider spread than the other diseases and the control group. The difference is significant compared to the control group (p = 0.014). NON = Controls, STGD = Stargardt disease, RP = Retinitis pigmentosa, CRD = cone–rod dystrophy.
Ijms 23 16007 g005
Table 1. Demographic information for RP, STGD, and CRD patients and controls.
Retinitis PigmentosaStargardt DiseaseCone-Rod Dystrophy
Controls
(n = 16)
RP
(n = 16)
Controls
(n = 7)
STGD
(n = 7)
Controls
(n = 7)
CRD
(n = 7)
Age
Mean (SD)37.0 (15.2)36.7 (15.7)40.0 (18.4)40.3 (17.2)34.7 (11.8)33.4 (10.8)
Median39.339.237.537.236.236.0
[Min, Max][8.09, 59.0][7.95, 60.0][10.8, 70.2][14.1, 69.8][17.7, 52.3][18.4, 49.5]
Sex (n)
Female885533
Male882244
Table 2. Genetic data of all IRD patients.
DiseasePatient IDFamily IDAgeSexGeneSequence VariantStatus
CRD1149.5mABCA4c.4615_4625del,
c.5603A>T
heterozygous
2218.4fABCA4c.5917delhomozygous
3324fABCA4c.1903C>T
c.5882G>A
heterozygous
4440.1fCACNA2D4c.2854C>Theterozygous
5526.9mABCA4c.5917delhomozygous
6636mRPGRc.3070G>Themizygous
7738.9mABCA4c.[1622T>C(;)3113C>T],
c.5714+5G>A
heterozygous
STGD8837.2fABCA4c.5882G>A,
c.5381C>A
heterozygous
9869.8fABCA4c.5381C>Ahomozygous
10935.3fABCA4c.5582G>A,
c.1609C>T
heterozygous
111050.6mABCA4c.5882G>Ahomozygous
121142.4mABCA4c.67-1G>C,
c.2804T>C
heterozygous
131232.6fABCA4c.4849-2A>G,
c.5882G>A
heterozygous
141314.1fABCA4c.[1609C>T;5881G>A]homozygous
RP151435.6fPRPH2c.646C>Theterozygous
161530mRP1c.662delhomozygous
171660mNR2E3c.166G>Aheterozygous
181748.1fUSH2Ac.3551T>A,
c.14131C>T
heterozygous
191841mEYSdeletion Exon 12homozygous
201937.4mPRPF31c.1060C>Theterozygous
212052.2mUSH2Ac.[2299del(;)4714C>T],
c.2276G>T
heterozygous
222124fPCAREc.1541delhomozygous
232248.6fRP1c.2332A>Theterozygous
242356.2fFLVCR1c.1092+5G>Ahomozygous
252443.8fPCAREc.1541delhomozygous
26258.34fUSH2Ac.2299delheterozygous
27267.95mCDH23c.2206C>T,
c.6000C>A
heterozygous
282735mUSH2Ac.1876C>T,
c.11864G>A
heterozygous
292818.2fNPHP1deletion Exon 1-20homozygous
302941.2mUSH2Ac.2276G>T,
c.10010G>T
heterozygous
Publisher’s Note: MDPI stays neutral with regard to jurisdictional claims in published maps and institutional affiliations.

