CTLA-4 Expression Is a Promising Biomarker of Idiopathic Pulmonary Arterial Hypertension and Allows Differentiation of the Type of Pulmonary Hypertension
Abstract
1. Introduction
2. Results
3. Discussion
Limitations of the Study
4. Material and Methods
4.1. Cytometric Analysis
4.2. Statistical Analysis
5. Conclusions
Author Contributions
Funding
Institutional Review Board Statement
Informed Consent Statement
Data Availability Statement
Conflicts of Interest
References
- Humbert, M.; Kovacs, G.; Hoeper, M.M.; Badagliacca, R.; Berger, R.M.; Brida, M.; Carlsen, J.; Coats, A.J.; Escribano-Subias, P.; Ferrari, P.; et al. 2022 ESC/ERS Guidelines for the diagnosis and treatment of pulmonary hypertension. Eur. Respir. J. 2022, 30, 2200879. [Google Scholar] [CrossRef]
- Zelt, J.G.; Sugarman, J.; Weatherald, J.; Partridge, A.C.; Liang, J.; Swiston, J.; Brunner, N.; Chandy, G.; Stewart, D.J.; Contreras-Dominguez, V.; et al. Mortality trends in pulmonary arterial hypertension in Canada: A temporal analysis of survival per ESC/ERS guideline era. Eur. Respir. J. 2021, 59, 2101552. [Google Scholar] [CrossRef]
- Ruaro, B.; Salton, F.; Baratella, E.; Confalonieri, P.; Geri, P.; Pozzan, R.; Torregiani, C.; Bulla, R.; Confalonieri, M.; Matucci-Cerinic, M.; et al. An Overview of Different Techniques for Improving the Treatment of Pulmonary Hypertension Secondary in Systemic Sclerosis Patients. Diagnostics 2022, 12, 616. [Google Scholar] [CrossRef]
- Ruaro, B.; Baratella, E.; Caforio, G.; Confalonieri, P.; Wade, B.; Marrocchio, C.; Geri, P.; Pozzan, R.; Andrisano, A.G.; Cova, M.A.; et al. Chronic Thromboembolic Pulmonary Hypertension: An Update. Diagnostics 2022, 12, 235. [Google Scholar] [CrossRef]
- Tomaszewski, M.; Bębnowska, D.; Hrynkiewicz, R.; Dworzyński, J.; Niedźwiedzka-Rystwej, P.; Kopeć, G.; Grywalska, E. Role of the Immune System Elements in PulmonaryArterialHypertension. J. Clin. Med. 2021, 10, 3757. [Google Scholar] [CrossRef]
- Abramiuk, M.; Bębnowska, D.; Hrynkiewicz, R.; Niedźwiedzka-Rystwej, P.; Polak, G.; Kotarski, J.; Roliński, J.; Grywalska, E. CLTA-4 Expression Is Associated with the Maintenance of Chronic Inflammation in Endometriosis and Infertility. Cells 2021, 10, 487. [Google Scholar] [CrossRef]
- Pentcheva-Hoang, T.; Corse, E.; Allison, J.P. Negative regulators of T-cell activation: Potential targets for therapeutic intervention in cancer, autoimmune disease, and persistent infections. Immunol. Rev. 2009, 229, 67–87. [Google Scholar] [CrossRef]
- Kong, K.-F.; Fu, G.; Zhang, Y.; Yokosuka, T.; Casas, J.; Canonigo-Balancio, A.J.; Bécart, S.; Kim, G.; Yates, J.R.; Kronenberg, M.; et al. Protein kinase C-η controls CTLA-4–mediated regulatory T cell function. Nat. Immunol. 2014, 15, 465–472. [Google Scholar] [CrossRef]
- Grywalska, E.; Smarz-Widelska, I.; Mertowski, S.; Gosik, K.; Mielnik, M.; Podgajna, M.; Abramiuk, M.; Drop, B.; Roliński, J.; Załuska, W. CTLA-4 Expression Inversely Correlates with Kidney Function and Serum Immunoglobulin Concentration in Patients with Primary Glomerulonephritides. Arch. Immunol. Et Ther. Exp. 2019, 67, 335–349. [Google Scholar] [CrossRef]
- Grywalska, E.; Mielnik, M.; Podgajna, M.; Hymos, A.; Ludian, J.; Rolińska, A.; Gosik, K.; Kwaśniewski, W.; Sosnowska-Pasiarska, B.; Smok-Kalwat, J.; et al. Expression of CTLA-4 and CD86 Antigens and Epstein-Barr Virus Reactivation in Chronic Lymphocytic Leukemia—Any Link with Known Prognostic Factors? Cancers 2022, 14, 672. [Google Scholar] [CrossRef]
- Pascall, E.; Tulloh, R. Pulmonary hypertension in congenital heart disease. Future Cardiol. 2018, 14, 343–353. [Google Scholar] [CrossRef] [PubMed]
- Zanatta, E.; Polito, P.; Famoso, G.; Larosa, M.; De Zorzi, E.; Scarpieri, E.; Cozzi, F.; Doria, A. Pulmonary arterial hypertension in connective tissue disorders: Pathophysiology and treatment. Exp. Biol. Med. 2019, 244, 120–131. [Google Scholar] [CrossRef] [PubMed]
- Kazimierczyk, R.; Kamiński, K.A. Przewlekłe zakrzepowo-zatorowe nadciśnienie płucne—Diagnostyka i nowe możliwości terapii farmakologicznej w świetle wytycznych ESC/ERS 2015. Folia Cardiol. 2016, 11, 394–400. [Google Scholar] [CrossRef]
- Hou, T.Z.; Qureshi, O.S.; Wang, C.J.; Baker, J.; Young, S.P.; Walker, L.S.K.; Sansom, D.M. A Transendocytosis Model of CTLA-4 Function Predicts Its Suppressive Behavior on Regulatory T Cells. J. Immunol. 2015, 194, 2148–2159. [Google Scholar] [CrossRef]
- Von Euw, E.; Chodon, T.; Attar, N.; Jalil, J.; Koya, R.C.; Comin-Anduix, B.; Ribas, A. CTLA4 blockade increases Th17 cells in patients with metastatic melanoma. J. Transl. Med. 2009, 7, 35. [Google Scholar] [CrossRef] [PubMed]
- Marsh, L.M.; Jandl, K.; Grünig, G.; Foris, V.; Bashir, M.; Ghanim, B.; Klepetko, W.; Olschewski, H.; Olschewski, A.; Kwapiszewska, G. The inflammatory cell landscape in the lungs of patients with idiopathic pulmonary arterial hypertension. Eur. Respir. J. 2018, 51, 1701214. [Google Scholar] [CrossRef] [PubMed]
- Savai, R.; Pullamsetti, S.S.; Kolbe, J.; Bieniek, E.; Voswinckel, R.; Fink, L.; Scheed, A.; Ritter, C.; Dahal, B.K.; Vater, A.; et al. Immune and Inflammatory Cell Involvement in the Pathology of Idiopathic Pulmonary Arterial Hypertension. Am. J. Respir. Crit. Care Med. 2012, 186, 897–908. [Google Scholar] [CrossRef] [PubMed]
- Qiu, H.; He, Y.; Ouyang, F.; Jiang, P.; Guo, S.; Guo, Y. The Role of Regulatory T Cells in Pulmonary Arterial Hypertension. J. Am. Heart Assoc. 2019, 8, e014201. [Google Scholar] [CrossRef]
- Van Uden, D.; Van Nimwegen, M.; Koudstaal, T.; Heukels, P.; Van Hulst, J.; Boomars, K.; Hendriks, R.; Kool, M. Alterations in circulating helper T-cells in idiopathic pulmonary arterial hypertension. Eur. Respir. J. 2019, 54, PA5051. [Google Scholar] [CrossRef]
- Heukels, P.; Corneth, O.B.J.; van Uden, D.; Hulst, J.A.C.V.; Toorn, L.M.V.D.; Bosch, A.E.V.D.; Wijsenbeek, M.S.; Boomars, K.A.; Kool, M.; Hendriks, R.W. Loss of immune homeostasis in patients with idiopathic pulmonary arterial hypertension. Thorax 2021, 76, 1209–1218. [Google Scholar] [CrossRef]
- Maston, L.D.; Jones, D.T.; Giermakowska, W.; Howard, T.A.; Cannon, J.L.; Wang, W.; Wei, Y.; Xuan, W.; Resta, T.C.; Bosc, L.V.G. Central role of T helper 17 cells in chronic hypoxia-induced pulmonary hypertension. Am. J. Physiol. Cell. Mol. Physiol. 2017, 312, L609–L624. [Google Scholar] [CrossRef]
- Hautefort, A.; Girerd, B.; Montani, D.; Cohen-Kaminsky, S.; Price, L.; Lambrecht, B.N.; Humbert, M.; Perros, F. T-Helper 17 Cell Polarization in Pulmonary Arterial Hypertension. Chest 2015, 147, 1610–1620. [Google Scholar] [CrossRef] [PubMed]
- Ulrich, S.; Nicolls, M.R.; Taraseviciene, L.; Speich, R.; Voelkel, N. Increased Regulatory and Decreased CD8+ Cytotoxic T Cells in the Blood of Patients with Idiopathic Pulmonary Arterial Hypertension. Respiration 2007, 75, 272–280. [Google Scholar] [CrossRef] [PubMed]
- Austin, E.; Rock, M.; Mosse, C.; Vnencak-Jones, C.; Yoder, S.; Robbins, I.; Loyd, J.; Meyrick, B. T lymphocyte subset abnormalities in the blood and lung in pulmonary arterial hypertension. Respir. Med. 2010, 104, 454–462. [Google Scholar] [CrossRef]
- Sada, Y.; Dohi, Y.; Uga, S.; Higashi, A.; Kinoshita, H.; Kihara, Y. Non-suppressive regulatory T cell subset expansion in pulmonary arterial hypertension. Heart Vessel. 2015, 31, 1319–1326. [Google Scholar] [CrossRef]
- Montani, D.; Günther, S.; Dorfmüller, P.; Perros, F.; Girerd, B.; Garcia, G.; Jaïs, X.; Savale, L.; Artaud-Macari, E.; Price, L.C.; et al. Pulmonary arterial hypertension. Orphanet J. Rare Dis. 2013, 8, 97. [Google Scholar] [CrossRef]
- Zou, H.-X.; Qiu, B.-Q.; Lai, S.-Q.; Zhou, X.-L.; Gong, C.-W.; Wang, L.-J.; Yuan, M.-M.; He, A.-D.; Liu, J.-C.; Huang, H. Iron Metabolism and Idiopathic Pulmonary Arterial Hypertension: New Insights from Bioinformatic Analysis. BioMed Res. Int. 2021, 2021, 1–27. [Google Scholar] [CrossRef]
- Ars, C.; Thurion, P.; Delos, M.; Sibille, Y.; Pilette, C. Small airway obstruction in severe pulmonary arterial hypertension correlates with increased airway CD8+ T-cells and fractalkine expression. Eur. Respir. J. 2009, 34, 1494–1496. [Google Scholar] [CrossRef]
- Pioli, C.; Gatta, L.; Ubaldi, V.; Doria, G. Inhibition of IgG1 and IgE production by stimulation of the B cell CTLA-4 receptor. J. Immunol. 2000, 165, 5530–5536. [Google Scholar] [CrossRef]
- Kuiper, H.M.; Brouwer, M.; Linsley, P.S.; Van Lier, R.A. Activated T cells can induce high levels of CTLA-4 expression on B cells. J. Immunol. 1995, 155, 1776–1783. [Google Scholar]
- van Uden, D.; Koudstaal, T.; van Hulst, J.A.C.; Vink, M.; van Nimwegen, M.; Toorn, L.M.V.D.; Chandoesing, P.P.; Bosch, A.E.V.D.; Kool, M.; Hendriks, R.W.; et al. Peripheral Blood T Cells of Patients with IPAH Have a Reduced Cytokine-Producing Capacity. Int. J. Mol. Sci. 2022, 23, 6508. [Google Scholar] [CrossRef] [PubMed]
- Galiè, N.; Humbert, M.; Vachiery, J.; Gibbs, S.; Lang, I.; Torbicki, A.; Simmonneau, G.; Peacock, A.; VonkNoordegraaf, A.; Beghetti, M.; et al. Guidelines for the diagnosis and treatment of pulmonary hypertension: The Joint Task Force for the Diagnosis and Treatment of Pulmonary Hypertension of the European Society of Cardiology (ESC) and the European Respiratory Society (ERS), endorsed by: Association for European Paediatric and Congenital Cardiology (AEPC), International Society for Heart and Lung Transplantation (ISHLT). Eur. Heart J. 2016, 37, 67–119. [Google Scholar] [CrossRef] [PubMed]

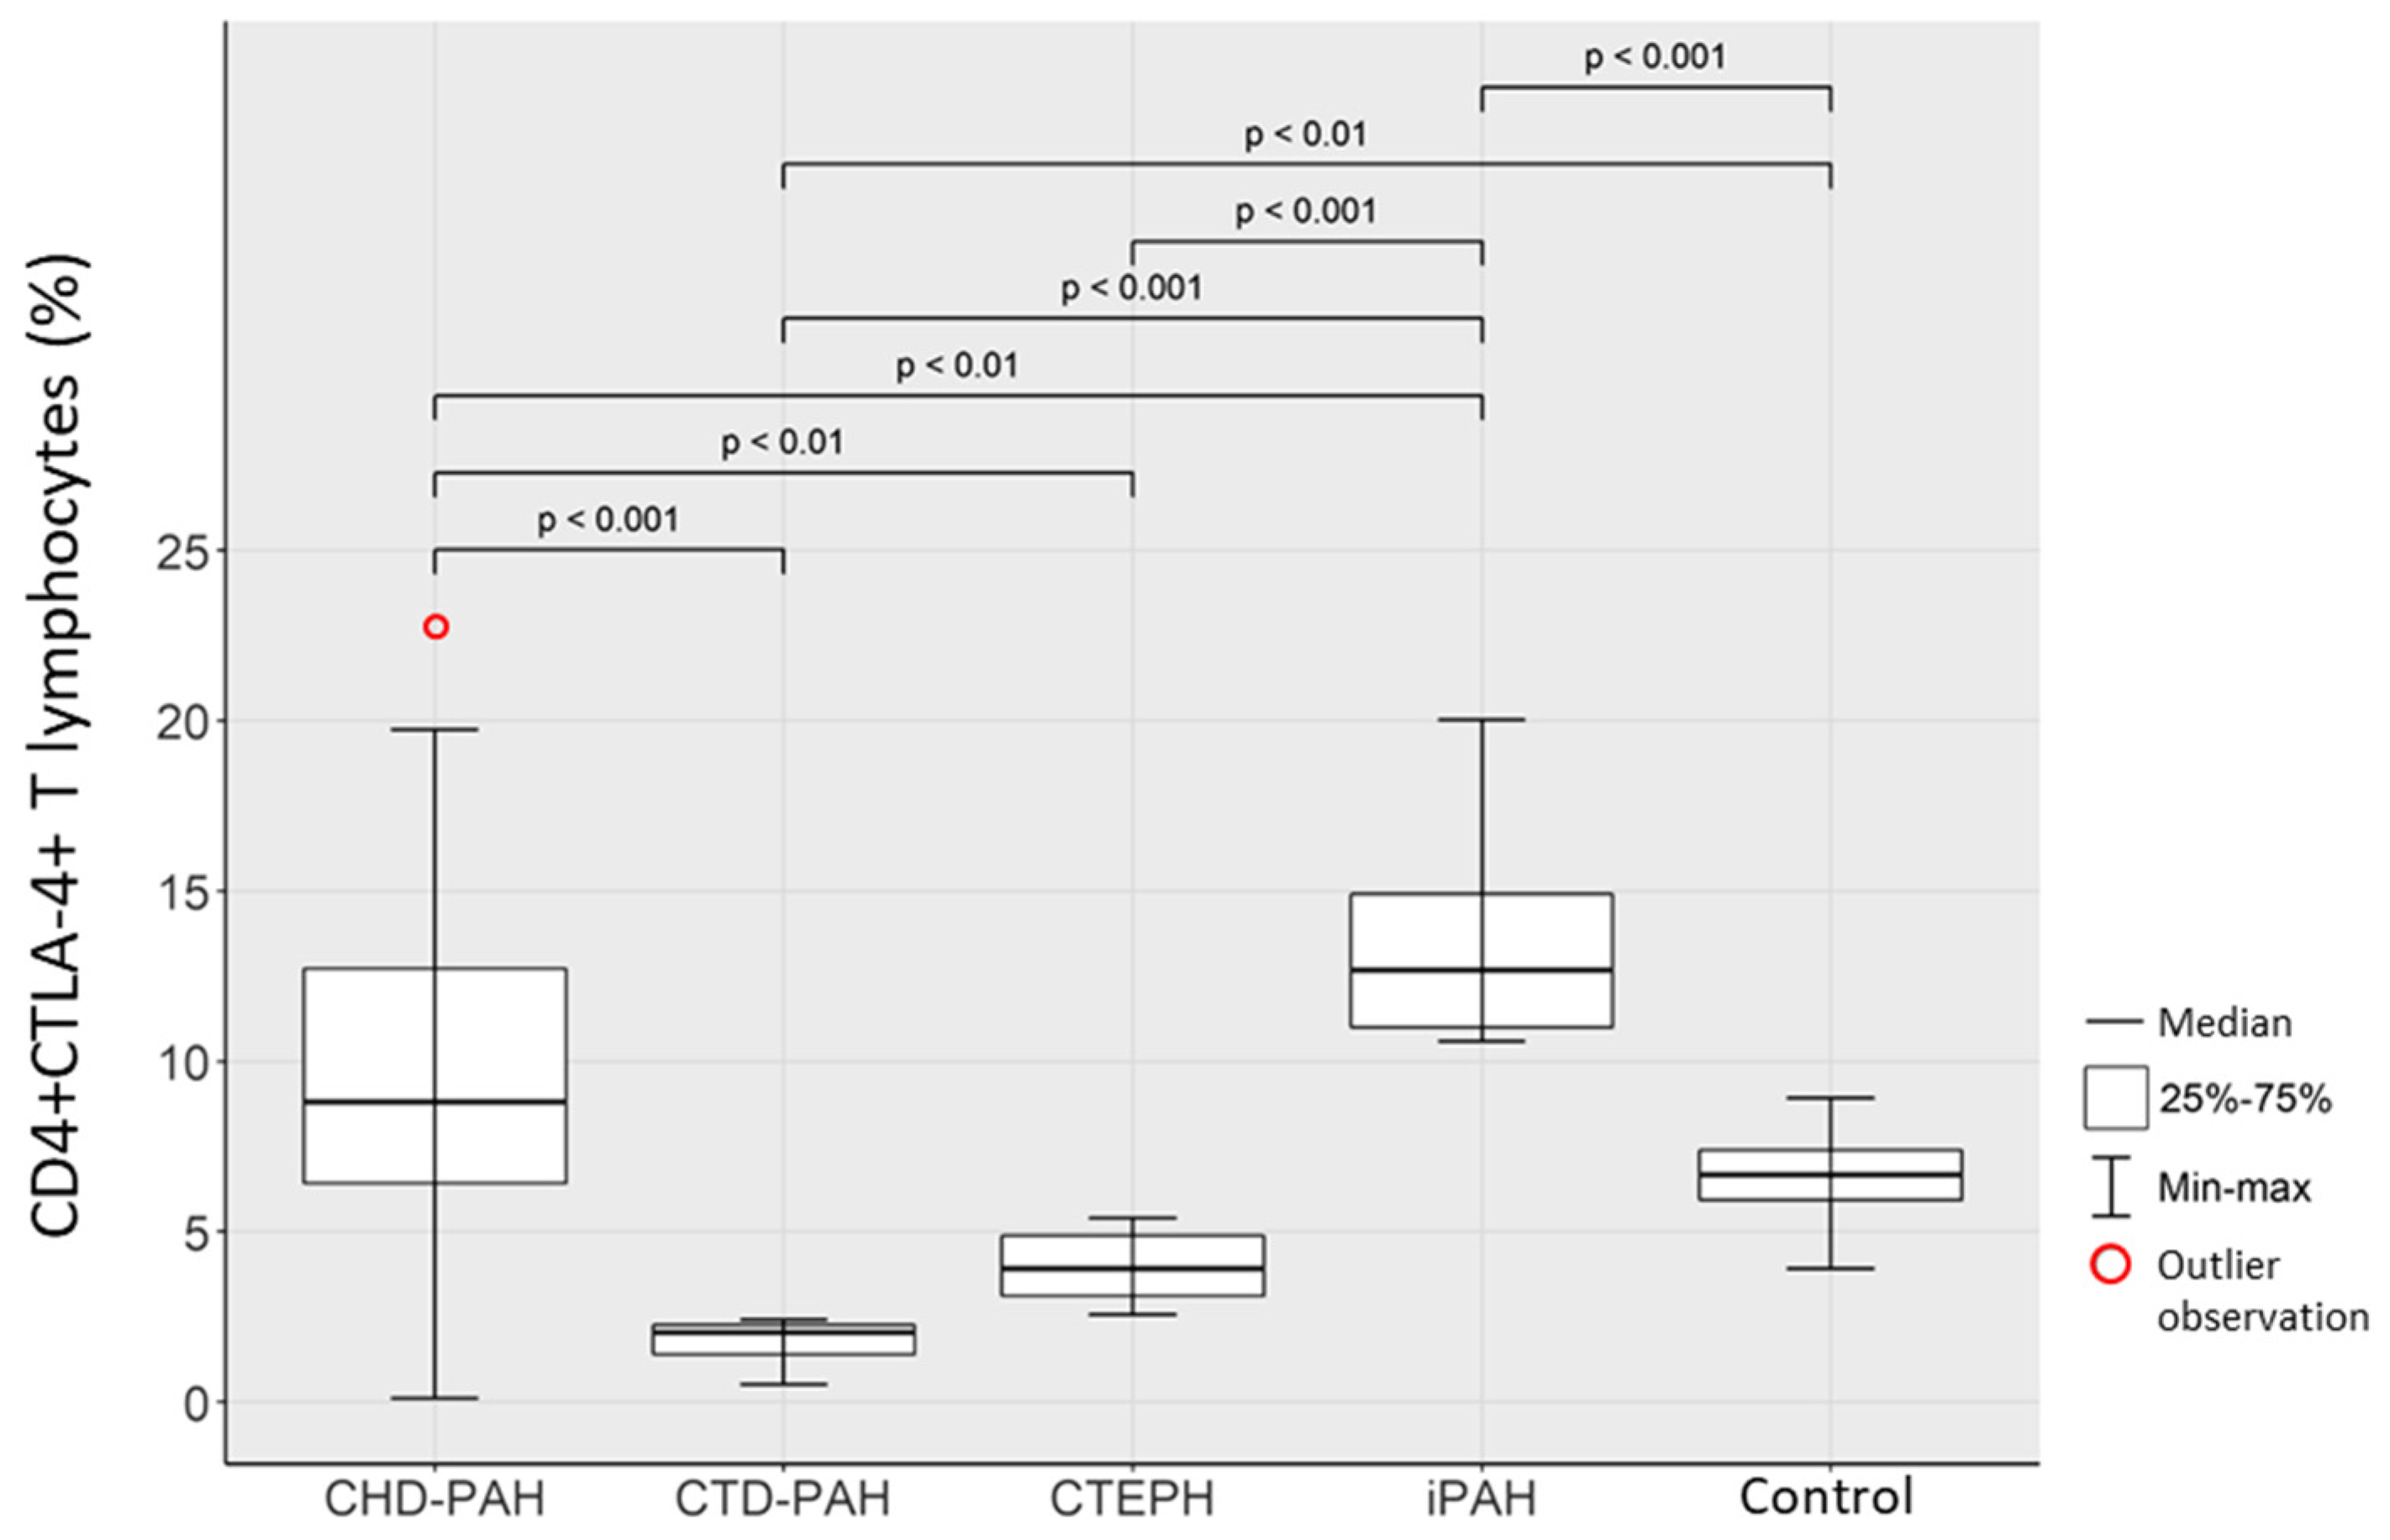
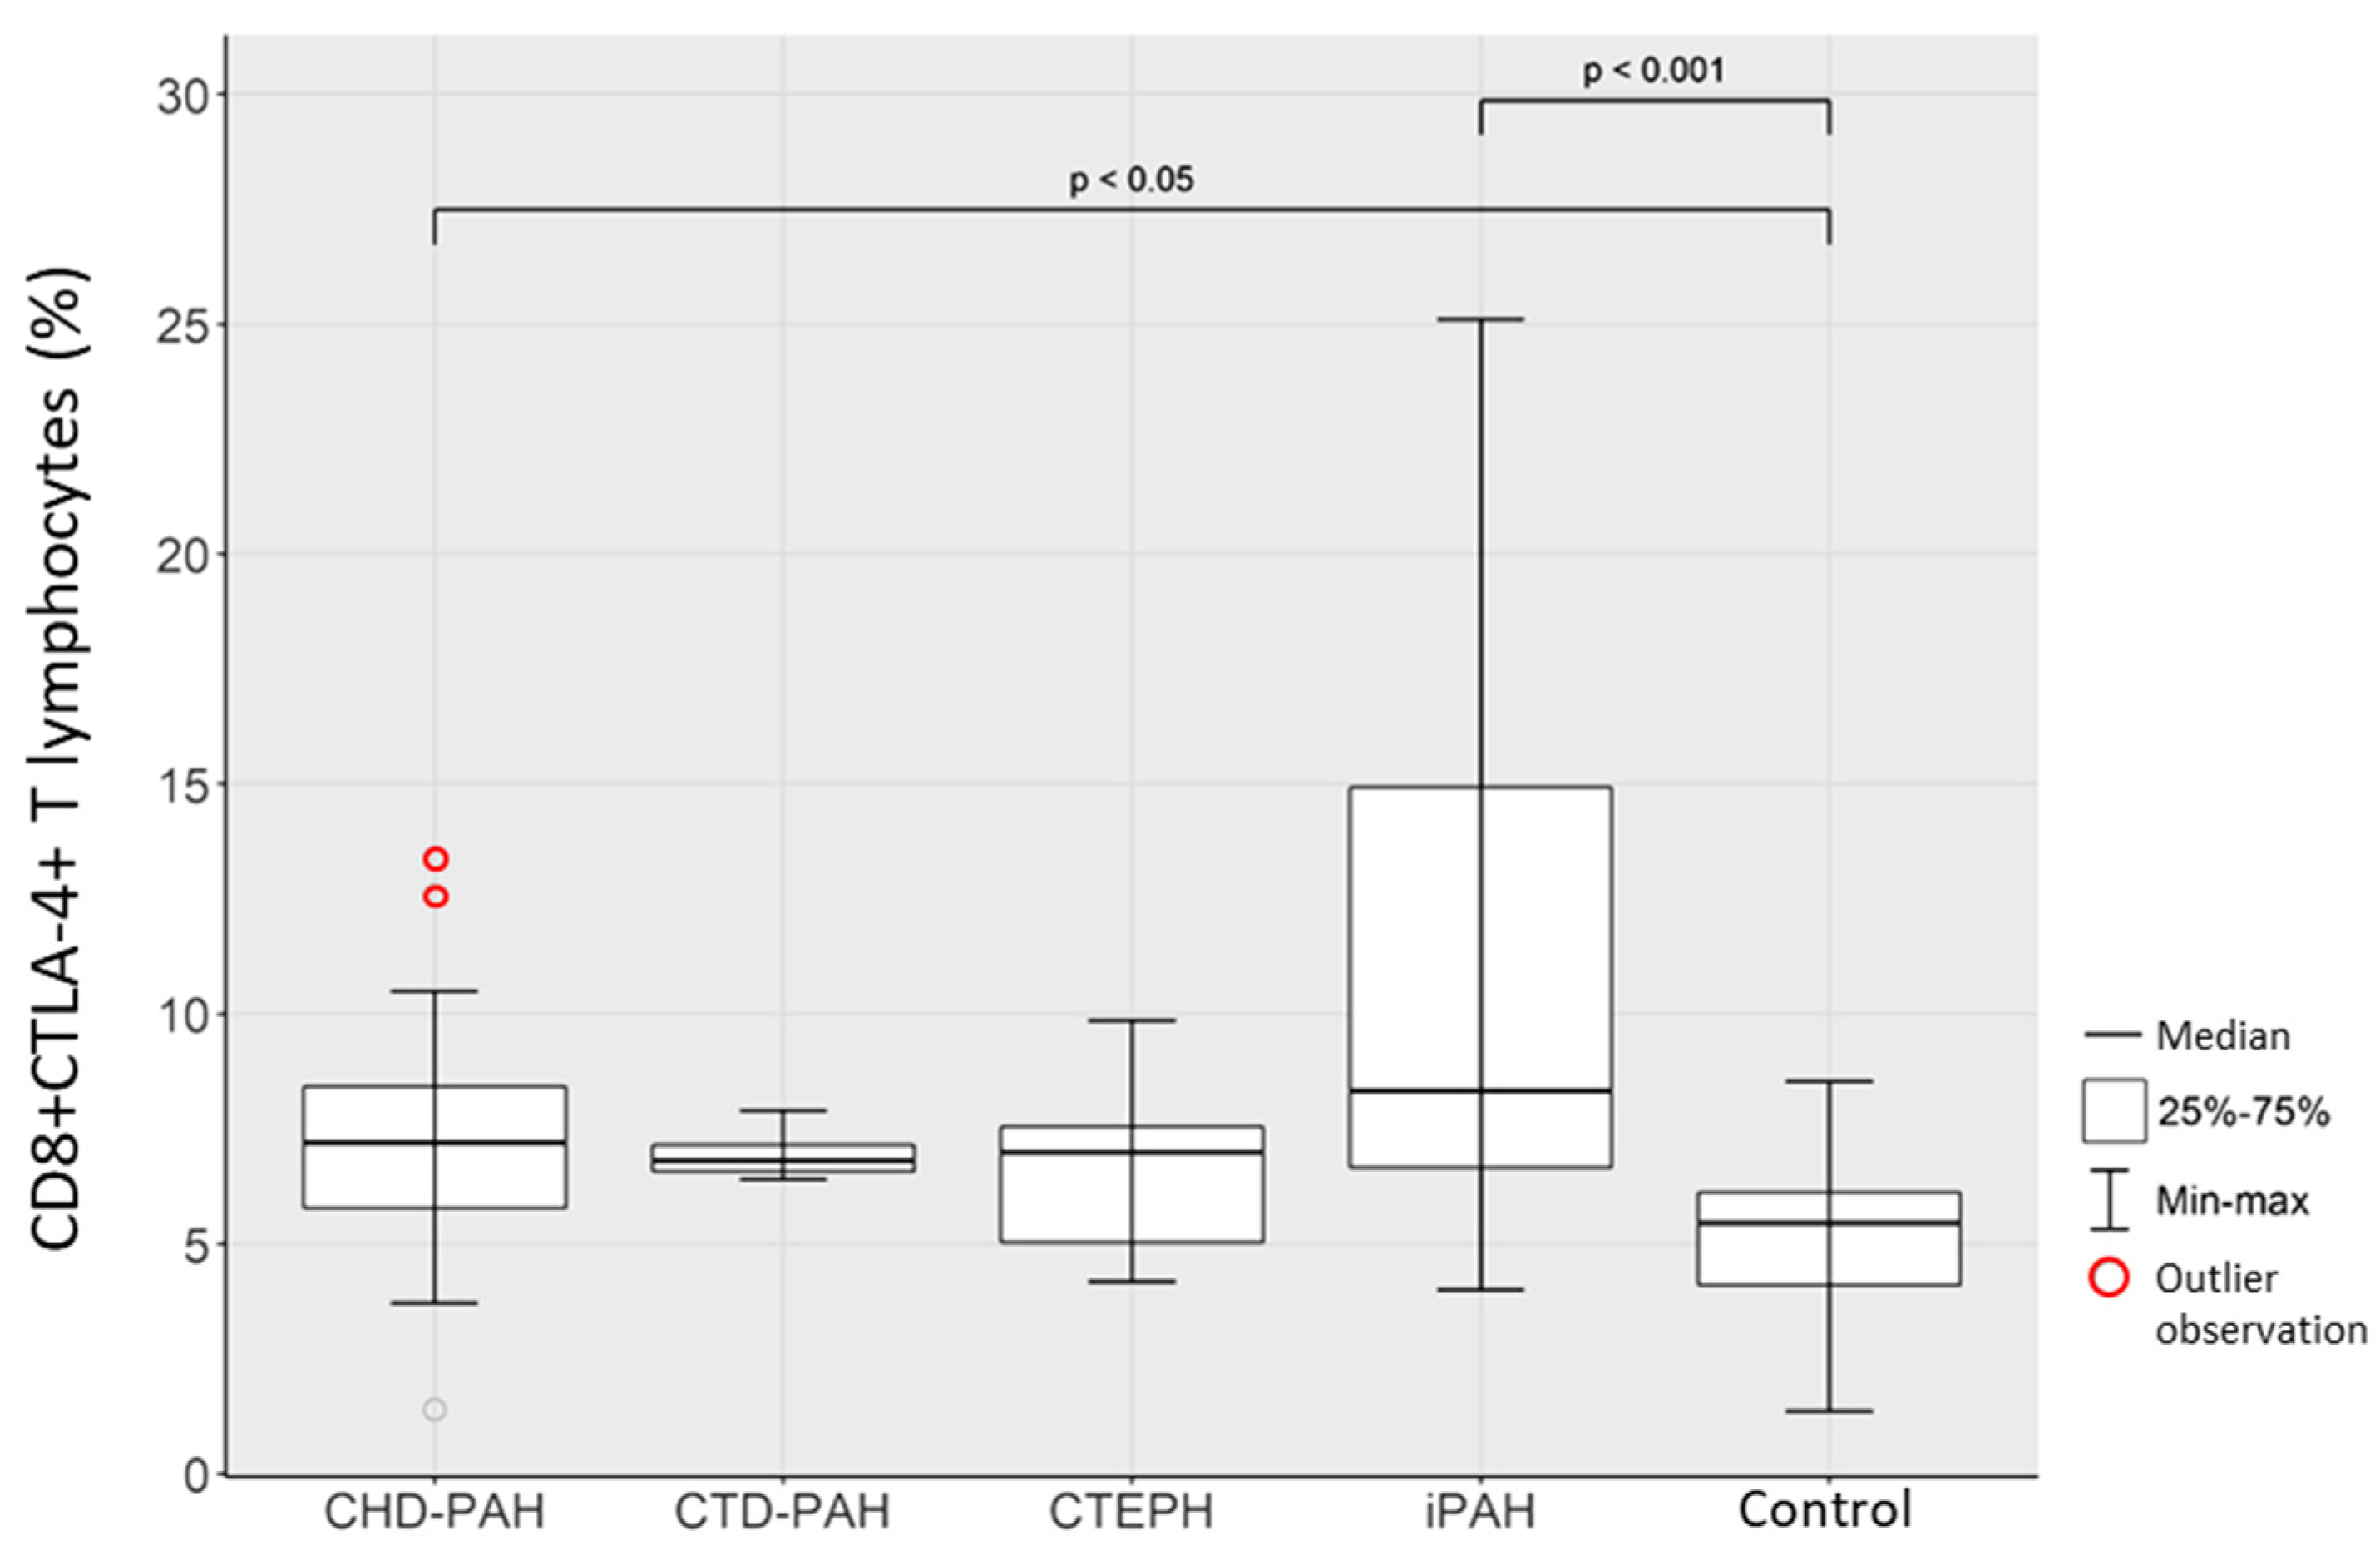
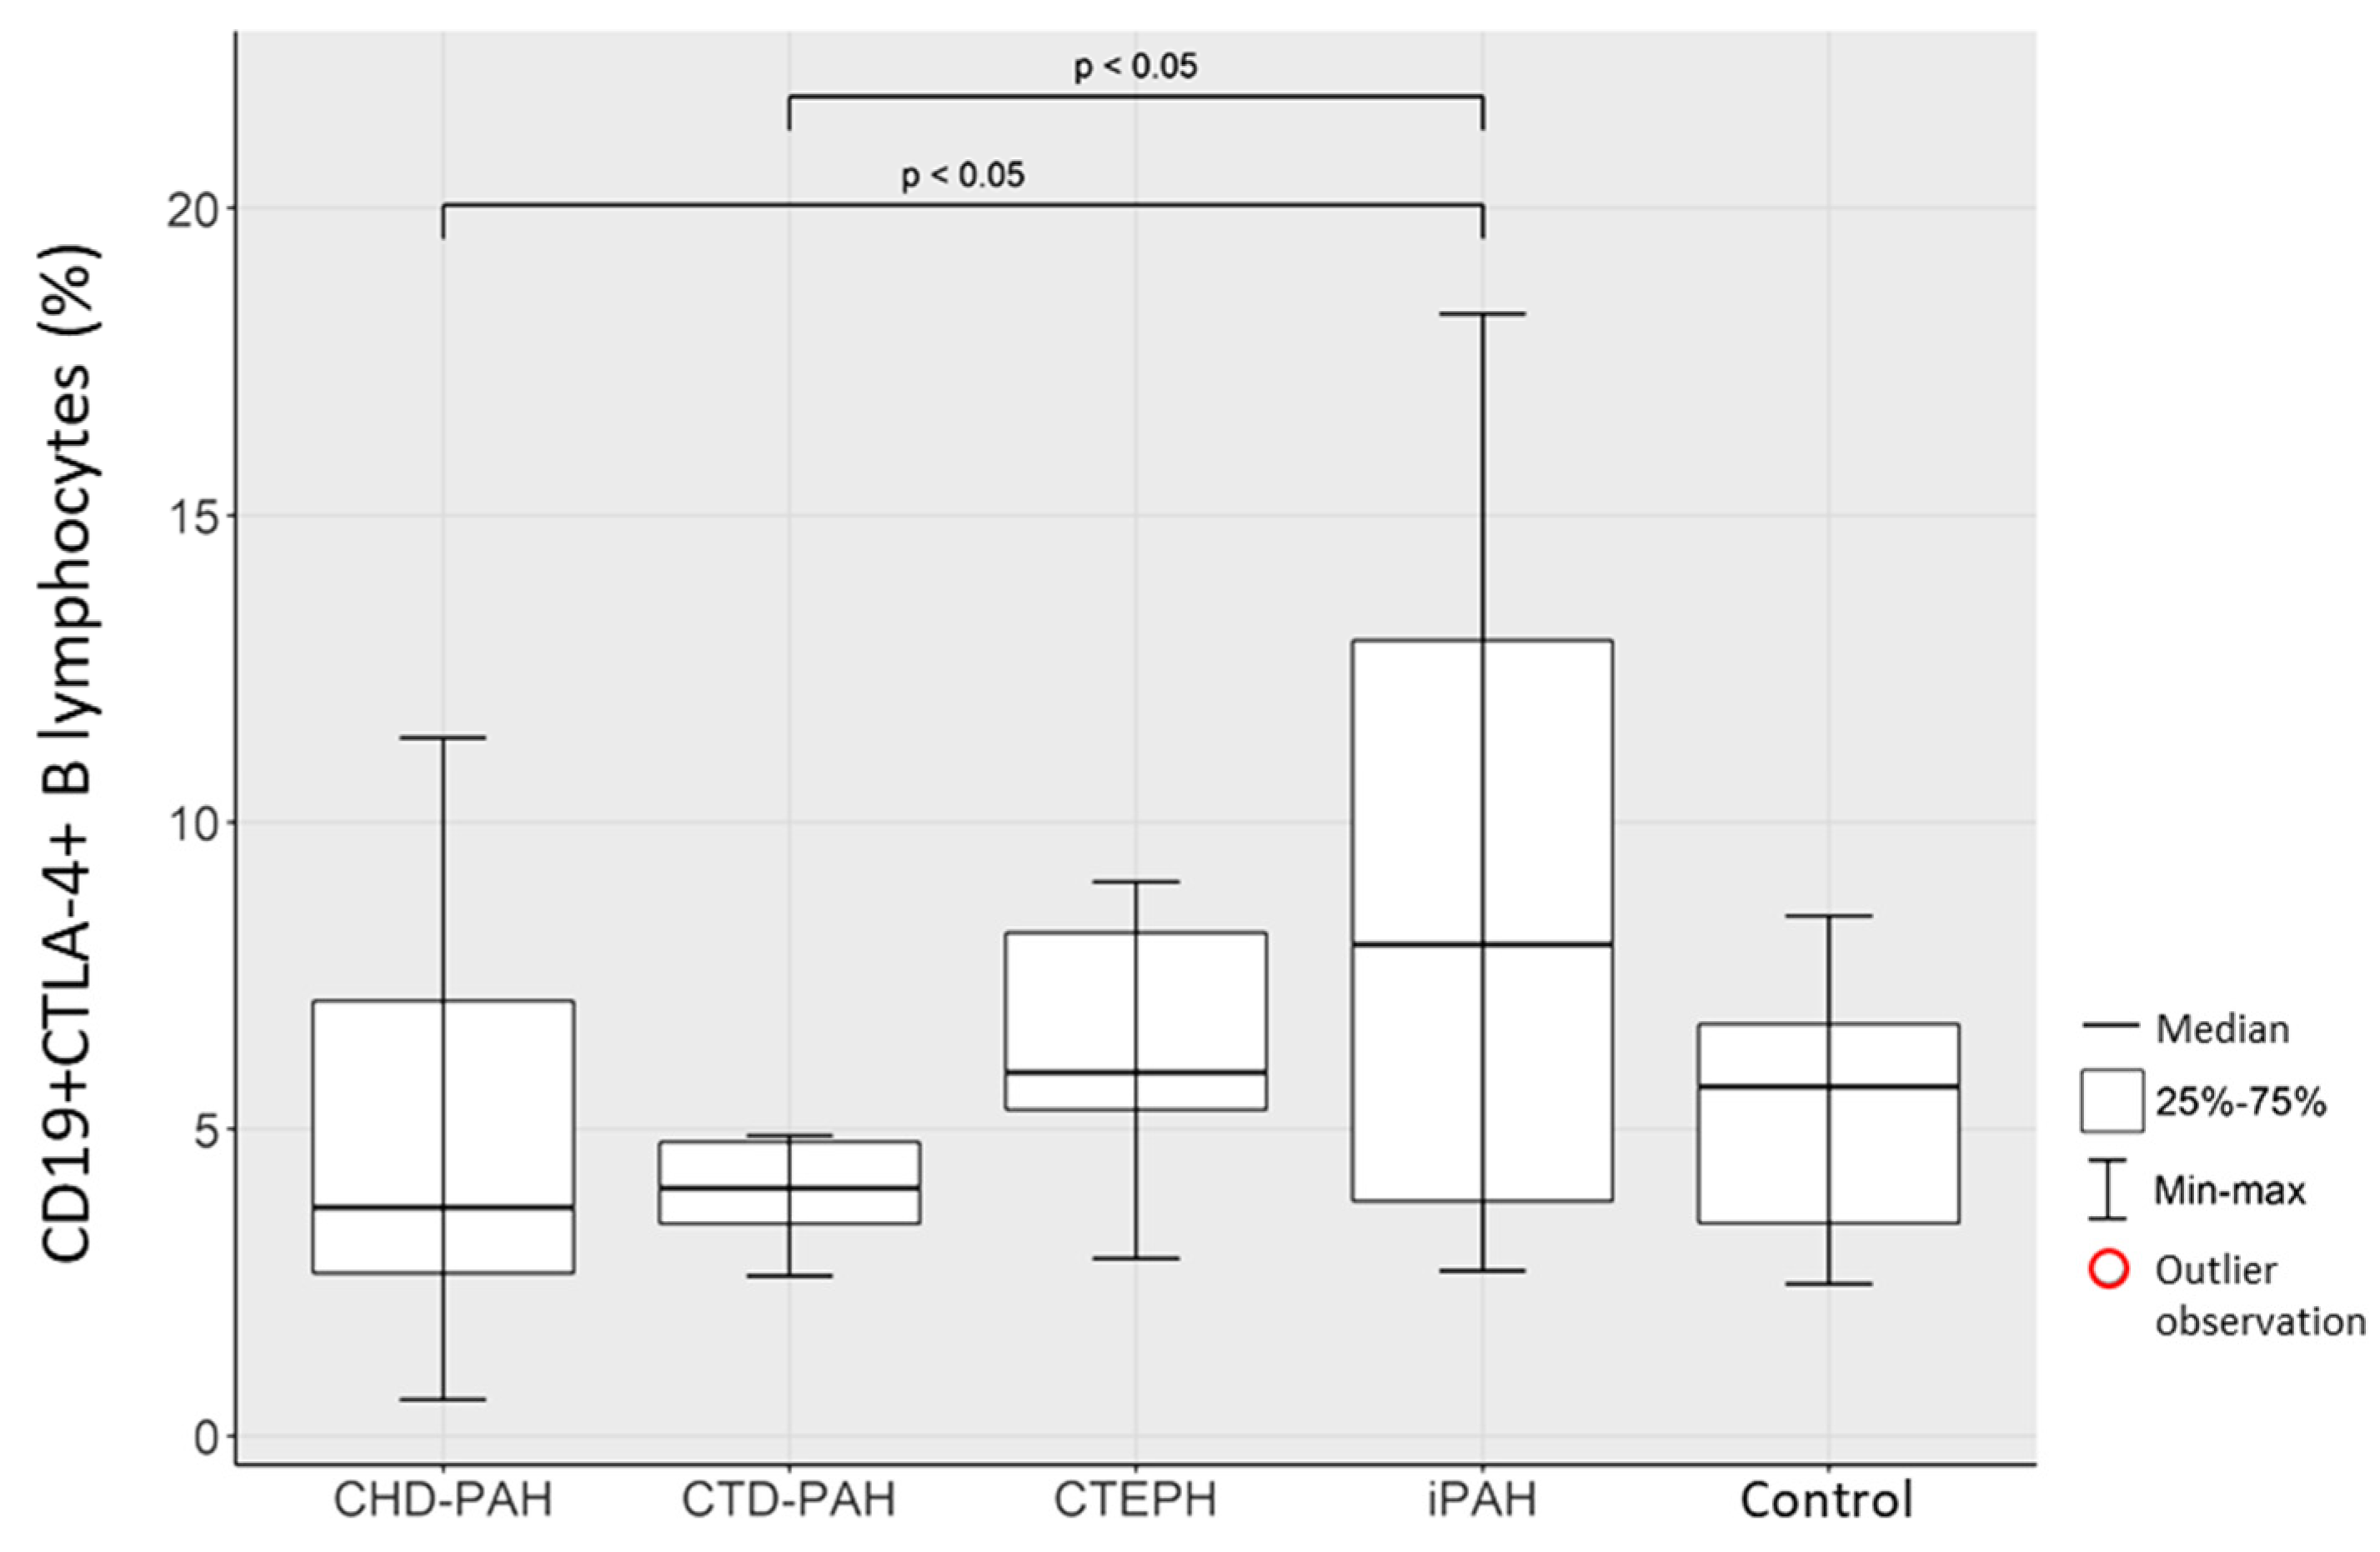
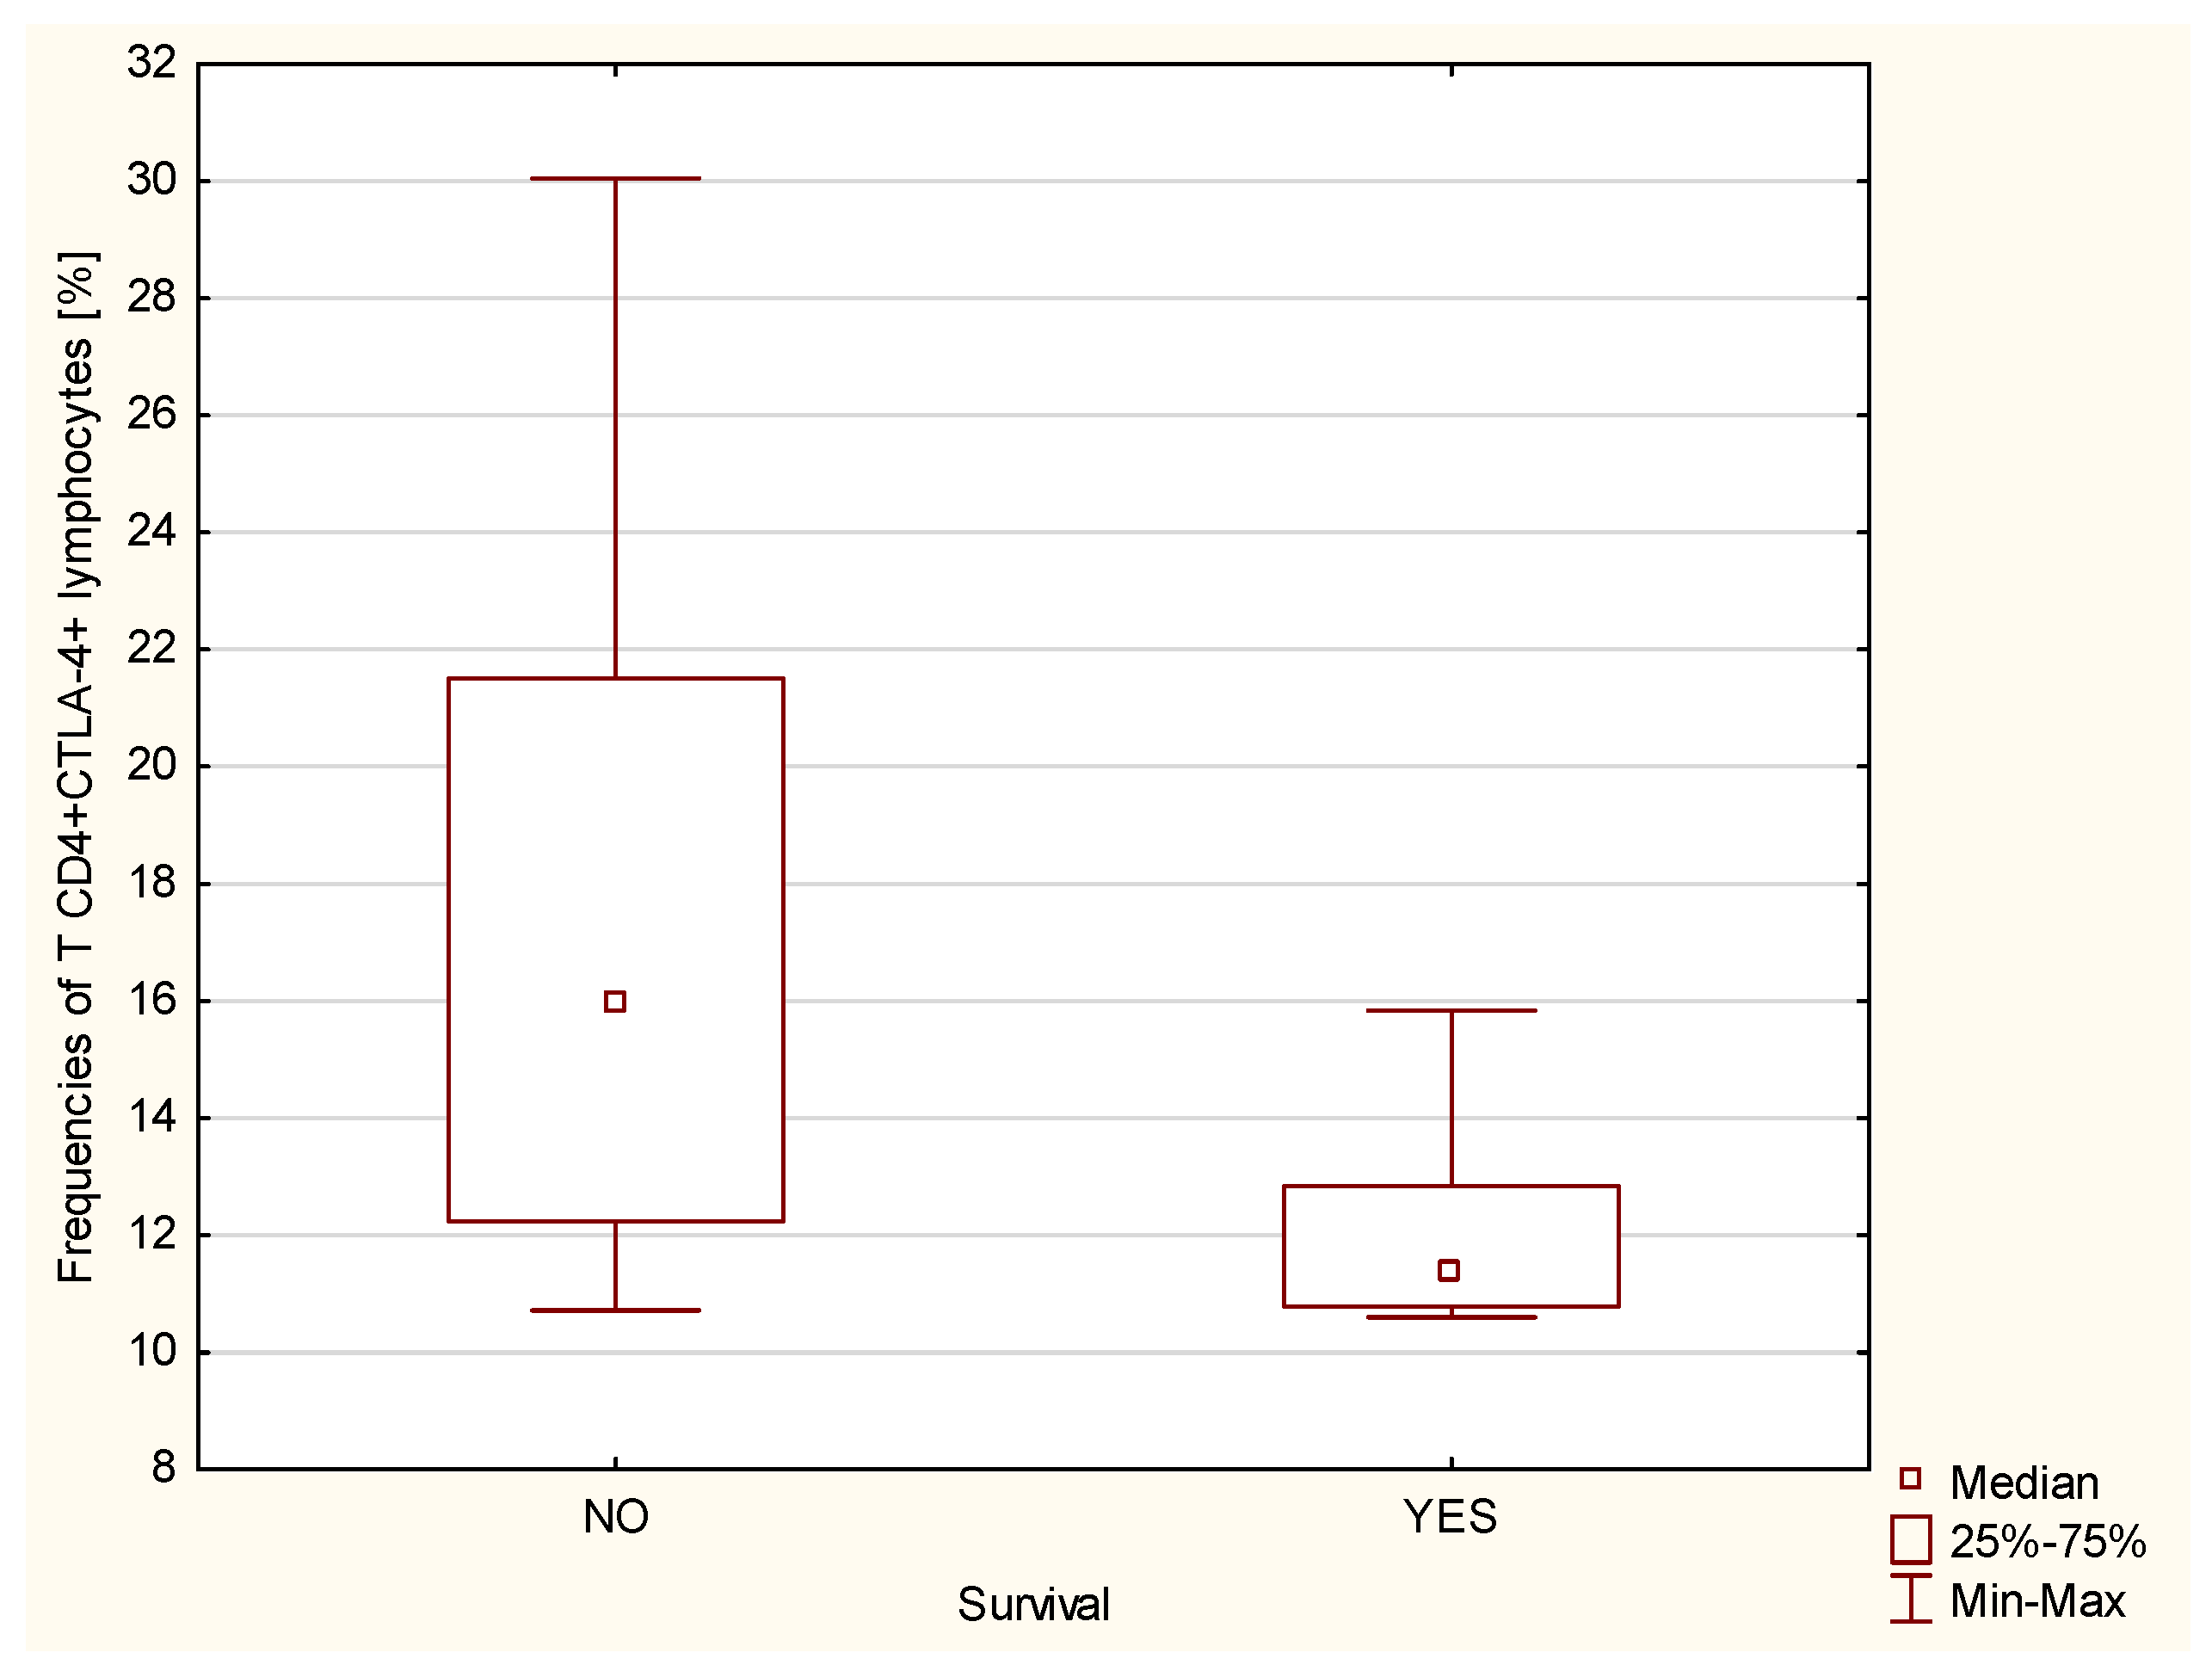
| Variable | Group | Median | Minimum | Maximum | Arithmetic Mean | SD | p |
|---|---|---|---|---|---|---|---|
| T-cells CD4+CTLA-4+ [%] | CHD-PAH | 9.42 | 0.11 | 24.84 | 10.17 | 6.03 | CHD-PAH vs. CTD-PAH (p ≤ 0.001), Control vs. CTD-PAH (p < 0.01), CHD-PAH vs. CTEPH (p < 0.01), CHD-PAH vs. iPAH (p < 0.01), Control vs. iPAH (p ≤ 0.001), CTD-PAH vs. iPAH (p ≤ 0.001), CTEPH vs. iPAH (p ≤ 0.001) |
| CTD-PAH | 2.04 | 0.53 | 2.4 | 1.8 | 0.6 | ||
| CTEPH | 3.91 | 2.57 | 5.4 | 3.98 | 1.02 | ||
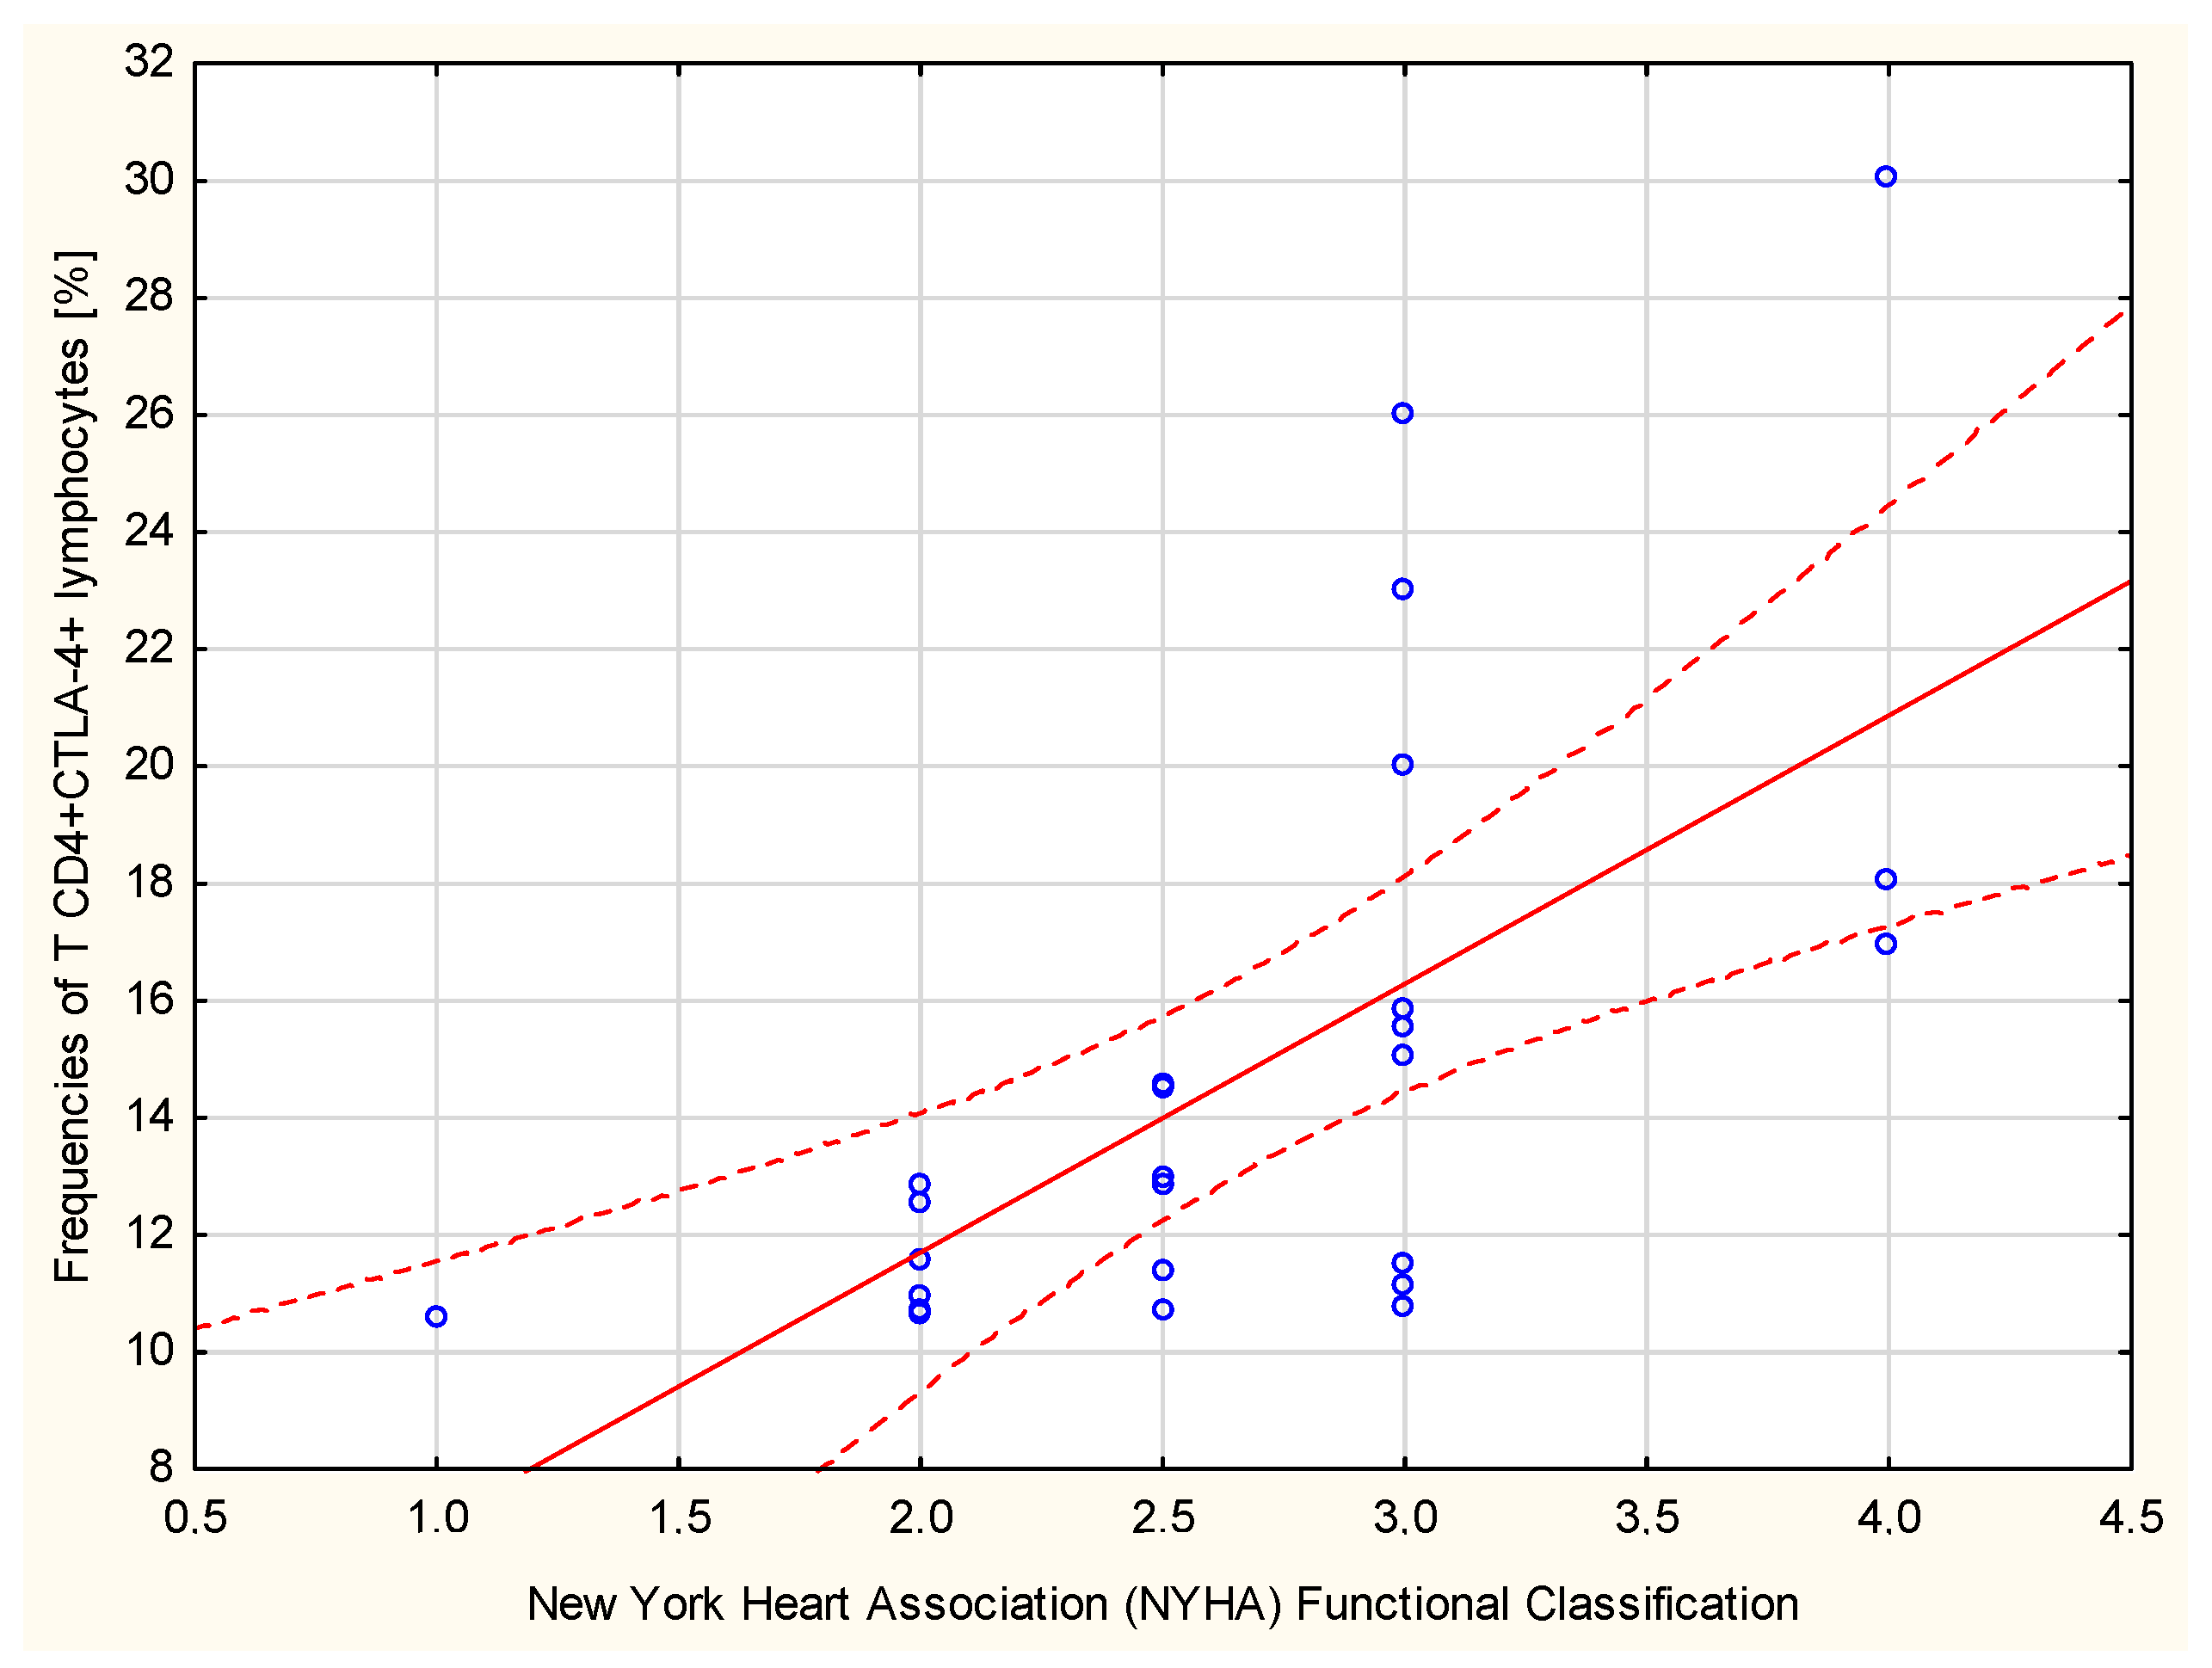
| iPAH | 12.84 | 10.6 | 30.05 | 14.82 | 5.13 | ||
| control | 6.66 | 3.91 | 8.91 | 6.73 | 1.26 | ||
| T-cells CD8+CTLA-4+ [%] | CHD-PAH | 7.49 | 1.4 | 16.32 | 8.18 | 3.85 | CHD-PAH vs. control (p < 0.05), Control vs. iPAH (p ≤ 0.001) |
| CTD-PAH | 7.01 | 6.41 | 10.05 | 7.29 | 1.14 | ||
| CTEPH | 6.98 | 4.18 | 9.85 | 6.66 | 1.95 | ||
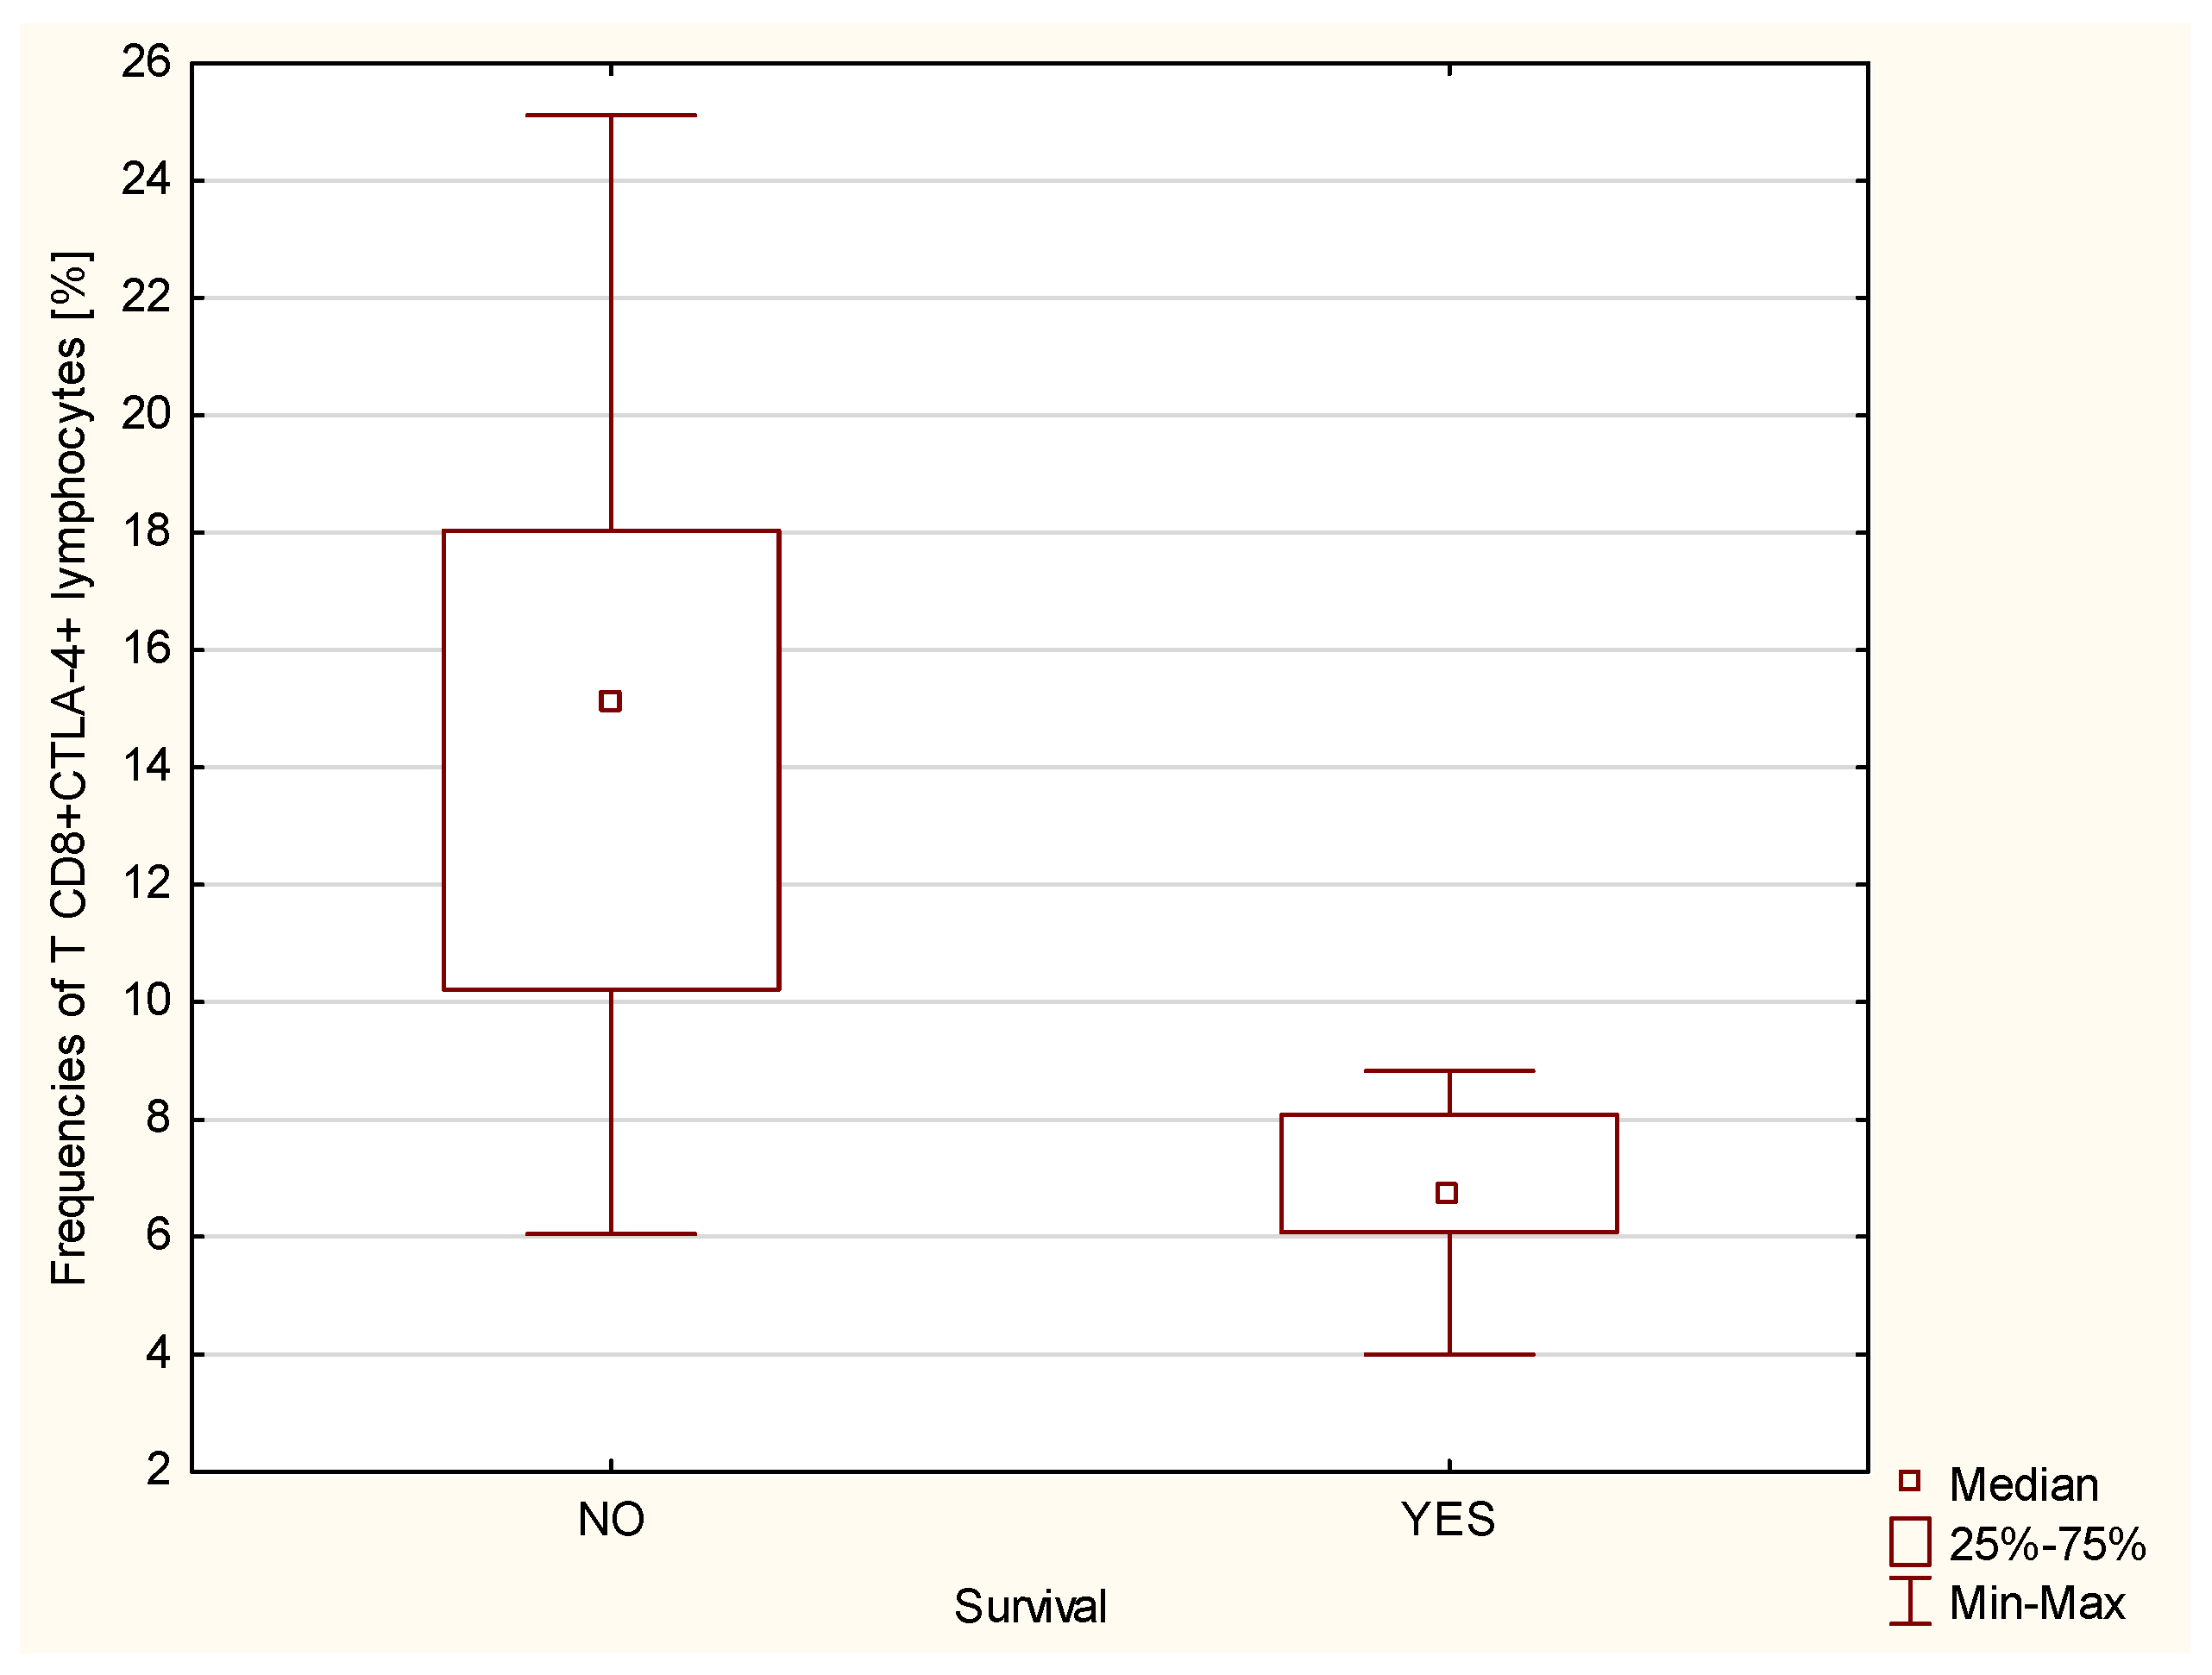
| iPAH | 8.33 | 4 | 25.11 | 10.58 | 6 | ||
| control | 5.46 | 1.36 | 8.54 | 5.19 | 1.87 | ||
| B-cells CD19+CTLA-4+ [%] | CHD-PAH | 3.72 | 0.59 | 11.37 | 4.88 | 2.91 | CHD-PAH vs. iPAH (p < 0.05), CTD-PAH vs. iPAH (p < 0.05), |
| CTD-PAH | 4.04 | 2.61 | 4.89 | 3.92 | 0.88 | ||
| CTEPH | 5.92 | 2.89 | 9.03 | 6.19 | 2.2 | ||
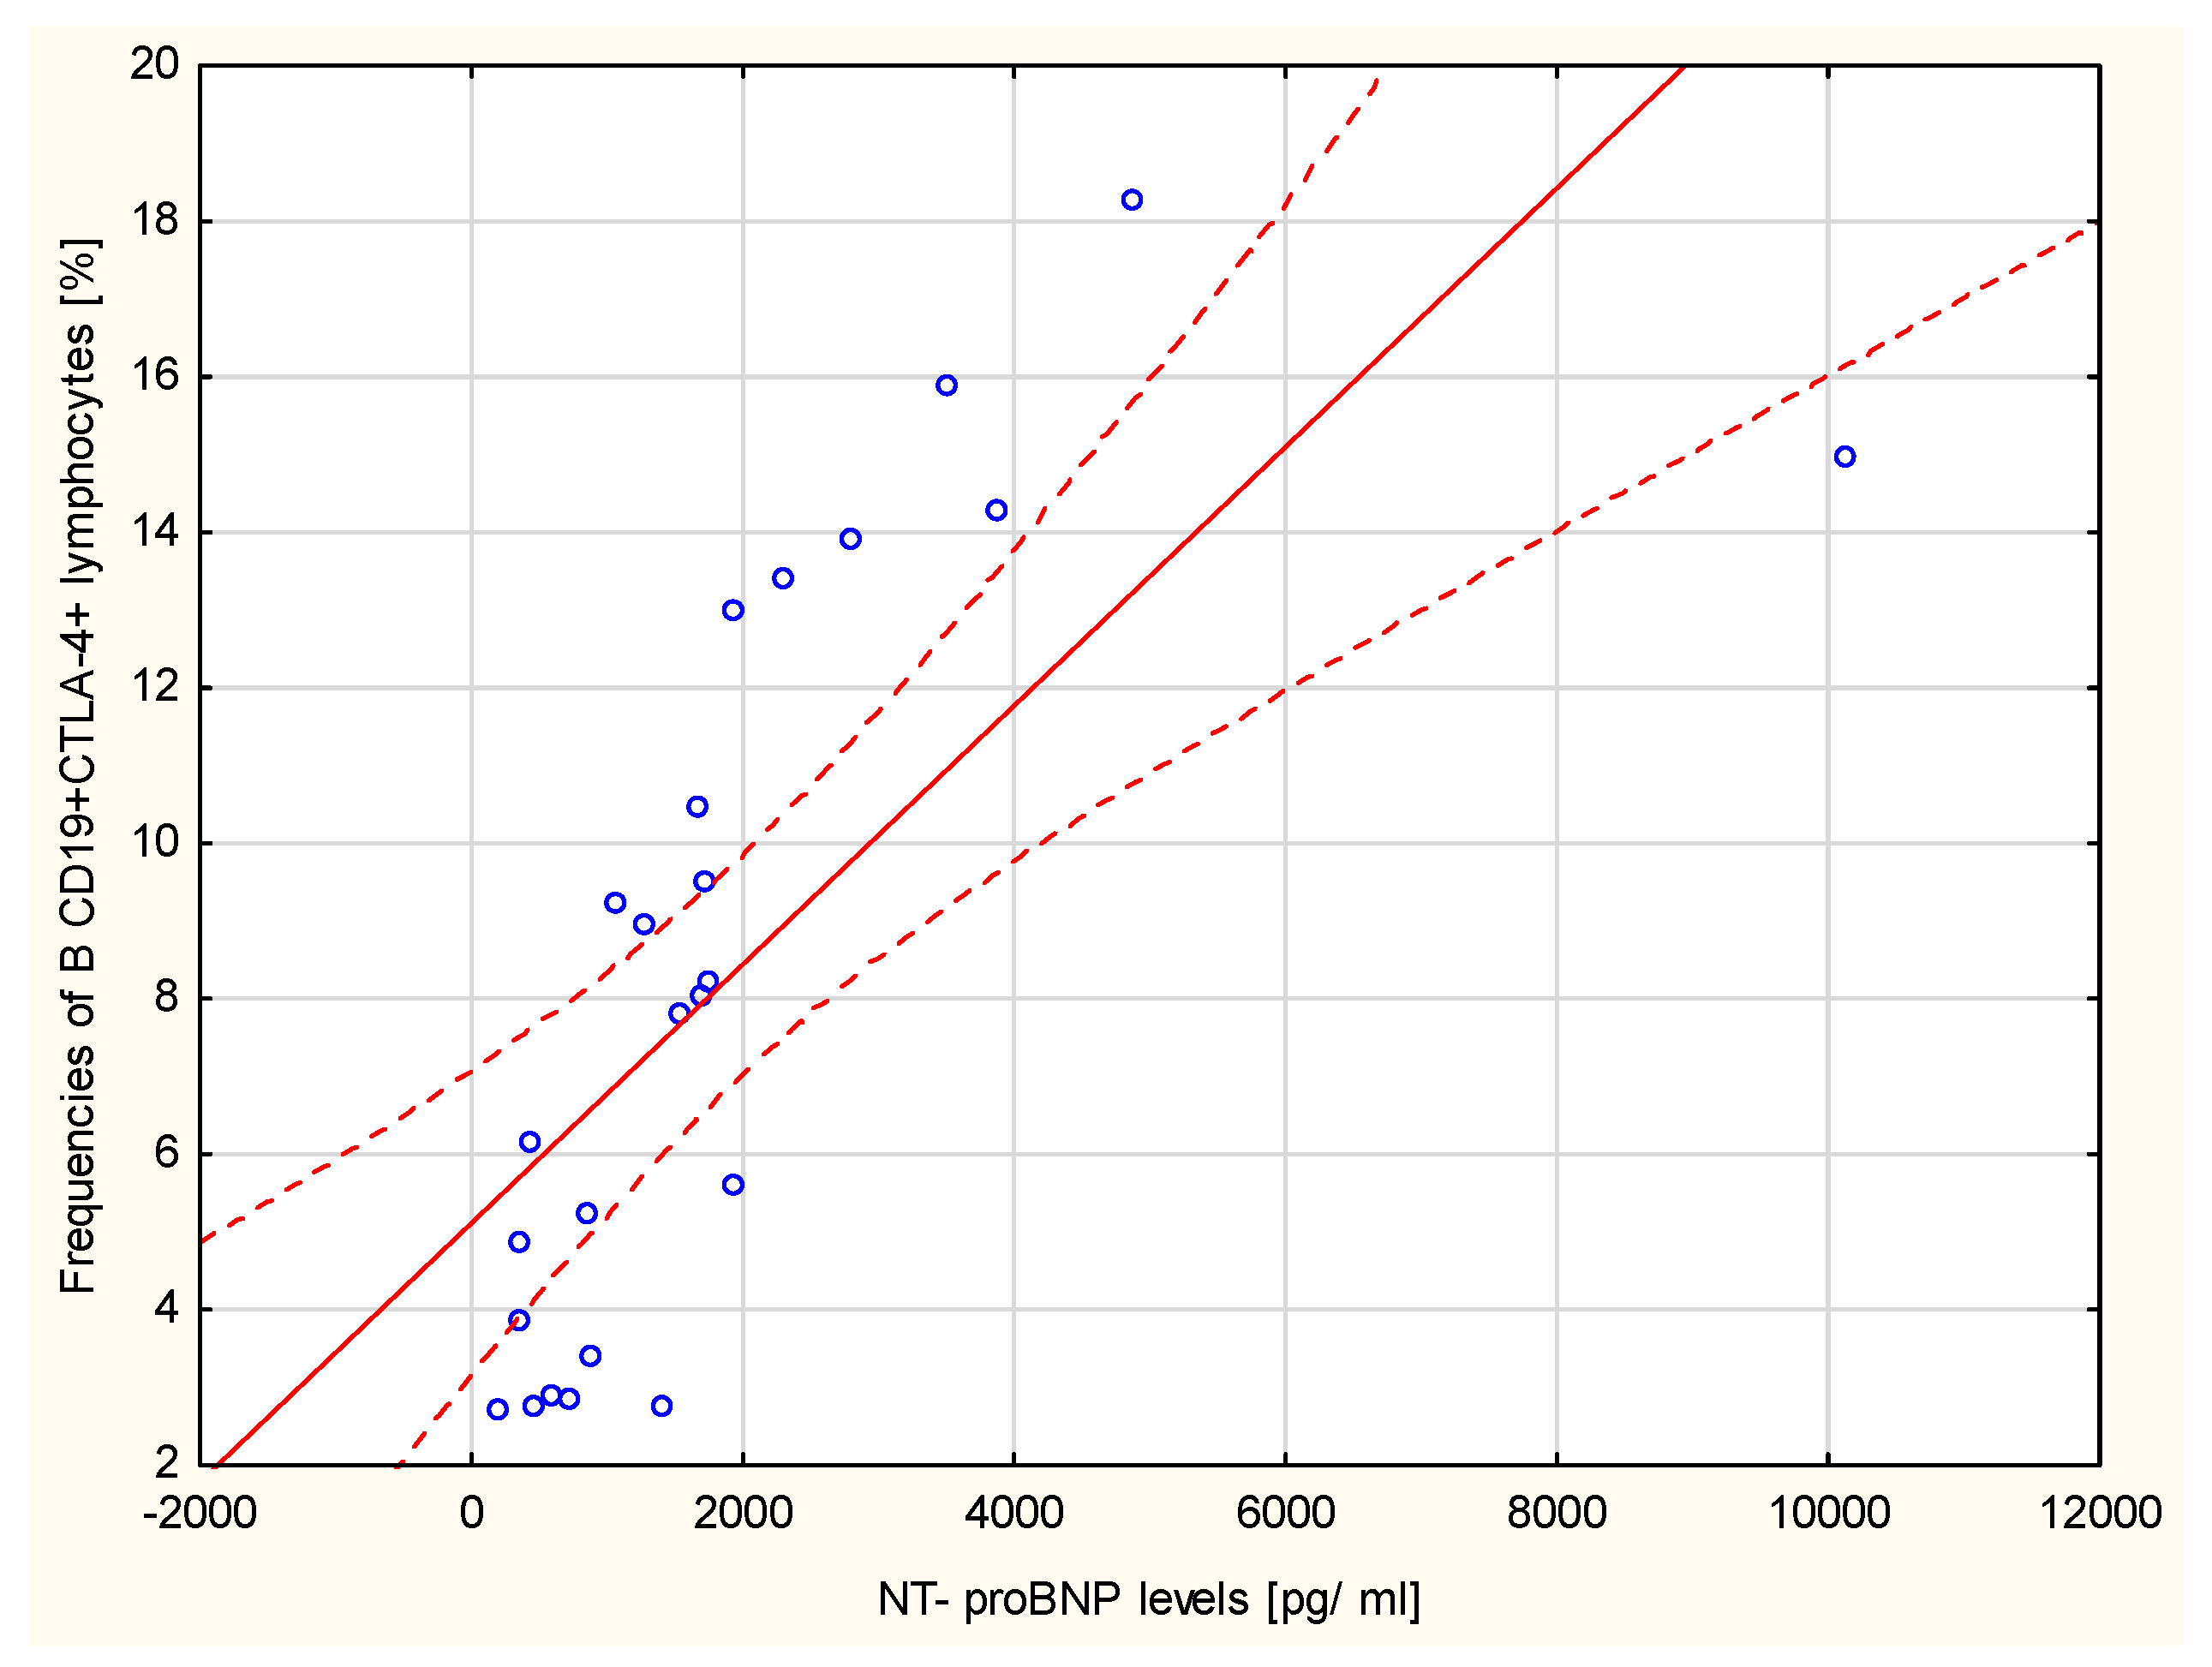
| iPAH | 8.01 | 2.69 | 18.28 | 8.34 | 4.8 | ||
| control | 5.68 | 2.48 | 8.47 | 5.35 | 1.92 |
| Parameter | Group | Median | Minimum | Maximum | Mean | SD | p |
|---|---|---|---|---|---|---|---|
| Age | CHD-PAH | 57.5 | 23 | 81 | 55.69 | 17.34 | CTEPH vs. CHD-PAH (p < 0.05), CTEPH vs. Control group (p < 0.05), CTEPH vs. CTD-PAH (p < 0.05), iPAH vs. CTEPH (p < 0.05), |
| CTD-PAH | 54 | 28 | 77 | 52.22 | 18.69 | ||
| CTEPH | 72.5 | 54 | 81 | 71.1 | 8.85 | ||
| iPAH | 62 | 23 | 81 | 56.52 | 17.23 | ||
| Control group | 56 | 39 | 77 | 58.05 | 11.12 | ||
| BMI | CHD-PAH | 24.91 | 19.5 | 38.15 | 25.54 | 4.18 | - |
| CTD-PAH | 22 | 20.32 | 27.98 | 23.79 | 2.96 | ||
| CTEPH | 23.67 | 20.44 | 35.04 | 24.74 | 4.18 | ||
| iPAH | 26 | 17.1 | 40.52 | 27.53 | 5.78 | ||
| Control group | - | - | - | - | - | ||
| 6MWT [m] | CHD-PAH | 378 | 50 | 578 | 323.15 | 149.64 | - |
| CTD-PAH | 420 | 80 | 577.5 | 382.17 | 149.99 | ||
| CTEPH | 358.5 | 190 | 561 | 356.1 | 110.94 | ||
| iPAH | 374 | 136 | 556 | 377.84 | 99.38 | ||
| Control group | - | - | - | - | - | ||
| Neutrophilscount [103/mm3] | CHD-PAH | 4.55 | 2.3 | 9.69 | 4.64 | 1.82 | - |
| CTD-PAH | 4.29 | 2.14 | 7.91 | 4.8 | 1.7 | ||
| CTEPH | 4.64 | 1.74 | 9.01 | 5.01 | 2.24 | ||
| iPAH | 5.11 | 2.08 | 8.43 | 5.16 | 1.64 | ||
| Control group | 3.94 | 2.71 | 6.03 | 4.32 | 1.03 | ||
| Lymphocytes count [103/mm3] | CHD-PAH | 1.68 | 1.1 | 2.77 | 1.72 | 0.46 | Control group vs. CHD-PAH (p ≤ 0.001), CTD-PAH vs. CHD-PAH (p ≤ 0.001), iPAH vs. CHD-PAH (p < 0.05), iPAH vs. CTD-PAH (p < 0.05) |
| CTD-PAH | 2.6 | 1.67 | 3.04 | 2.47 | 0.4 | ||
| CTEPH | 2.42 | 1.3 | 3.83 | 2.51 | 0.96 | ||
| iPAH | 2.01 | 1.2 | 3.14 | 2.15 | 0.56 | ||
| Control group | 2.54 | 1.53 | 3.07 | 2.44 | 0.45 | ||
| Hemoglobin concentration [g/dL] | CHD-PAH | 15.1 | 7.4 | 22.1 | 15.4 | 4.38 | - |
| CTD-PAH | 13.5 | 11.3 | 19.4 | 13.76 | 2.42 | ||
| CTEPH | 13.75 | 8.5 | 16.7 | 13.24 | 2.65 | ||
| iPAH | 13.6 | 9.5 | 18.5 | 13.69 | 2.04 | ||
| Control group | 14.35 | 12.5 | 15.6 | 14.31 | 0.86 | ||
| Platelets count [mm3] | CHD-PAH | 156,500 | 62,000 | 299,000 | 164,115 | 64,380 | Control group vs. CHD-PAH (p ≤ 0.001), CTD-PAH vs. CHD-PAH (p < 0.05), iPAH vs. CHD-PAH (p < 0.05), CTD-PAH vs. Control group (p ≤ 0.001), CTEPH vs. Control group (p < 0.01), iPAH vs. Control group (p < 0.01), CTEPH vs. CTD-PAH (p < 0.05), iPAH vs. CTD-PAH (p ≤ 0.001) |
| CTD-PAH | 114,000 | 55,000 | 309,000 | 147,889 | 92,369 | ||
| CTEPH | 182,500 | 93,000 | 348,000 | 189,000 | 73,138 | ||
| iPAH | 213,000 | 78,000 | 474,000 | 213,800 | 80,647 | ||
| Control group | 262,500 | 186,000 | 344,000 | 263,950 | 52,744 | ||
| AspAT [U/L] | CHD-PAH | 20 | 12 | 68 | 25.46 | 13.95 | - |
| CTD-PAH | 32 | 17 | 38 | 27.67 | 7.79 | ||
| CTEPH | 27 | 19 | 127 | 36.4 | 32.22 | ||
| iPAH | 22 | 10 | 49 | 23.12 | 9.18 | ||
| Control group | 22.5 | 13 | 34 | 22.6 | 6.1 | ||
| ALAT [U/L] | CHD-PAH | 16 | 26 | 22 | 22 | 16.87 | Control group vs. CHD-PAH (p < 0.05), CTEPH vs. CHD-PAH (p < 0.01), CTEPH vs. CTD-PAH (p < 0.05), iPAH vs. CTEPH (p < 0.05) |
| CTD-PAH | 18 | 9 | 25.78 | 25.78 | 21.72 | ||
| CTEPH | 22.5 | 10 | 29.8 | 29.8 | 22.05 | ||
| iPAH | 18 | 25 | 20.04 | 20.04 | 10.41 | ||
| Control group | 18.5 | 20 | 19.75 | 19.75 | 7.49 | ||
| T CD3+ lymphocytes [%] | CHD-PAH | 71.3 | 60.29 | 80.9 | 70.68 | 6.31 | - |
| CTD-PAH | 70.53 | 57.31 | 80.45 | 70.29 | 6.85 | ||
| CTEPH | 69.8 | 63.1 | 81.62 | 71.07 | 6.3 | ||
| iPAH | 70.82 | 59.21 | 89.16 | 71.11 | 6.84 | ||
| Control group | 68.08 | 60.63 | 74.49 | 68.26 | 3.84 | ||
| B CD19+ lymphocytes [%] | CHD-PAH | 9.36 | 2.46 | 26.25 | 9.76 | 4.89 | |
| CTD-PAH | 9.05 | 2.79 | 21.99 | 10.18 | 6.29 | ||
| CTEPH | 11.25 | 5.36 | 16.91 | 11.01 | 4.14 | ||
| iPAH | 11.9 | 3.5 | 20.67 | 11.36 | 4.97 | ||
| Control group | 11.39 | 6.04 | 16.9 | 11.25 | 2.5 | ||
| NK cells (CD3-/CD16+CD56+) [%] | CHD-PAH | 22.37 | 6.63 | 37.5 | 20.88 | 7.97 | Control group vs. CHD-PAH (p < 0.05). CTD-PAH vs. CHD-PAH (p ≤ 0.001). CTEPH vs. CHD-PAH (p ≤ 0.001). iPAH vs. CHD-PAH (p ≤ 0.001). CTD-PAH vs. Control group (p ≤ 0.001). CTEPH vs. Control group (p < 0.05). iPAH vs. Control group (p ≤ 0.001) |
| CTD-PAH | 10.9 | 2.34 | 19.77 | 10.82 | 5.76 | ||
| CTEPH | 8.93 | 4.32 | 17.41 | 9.65 | 4.6 | ||
| iPAH | 11.23 | 3.99 | 20.43 | 11.1 | 4.22 | ||
| Control group | 14.43 | 12.16 | 19.34 | 15.35 | 2.25 | ||
| NKT-like cells CD3+CD16+CD56+ [%] | CHD-PAH | 1.58 | 0.24 | 8.47 | 2.62 | 2.31 | CHD-PAH vs. iPAH (p < 0.01) |
| CTD-PAH | 1.04 | 0.21 | 8.2 | 2.97 | 3.08 | ||
| CTEPH | 3.17 | 0.77 | 11.26 | 4.1 | 3.68 | ||
| iPAH | 5.23 | 0.67 | 10.94 | 5.26 | 2.67 | ||
| Control group | 3.27 | 1.15 | 4.92 | 3.02 | 1.02 | ||
| T CD4+/CD3+ lymphocytes [%] | CHD-PAH | 42.16 | 21.58 | 57.43 | 41.25 | 10 | CTD-PAH vs. Control group (p < 0.01). CTEPH vs. CTD-PAH (p < 0.01) |
| CTD-PAH | 35.54 | 28.43 | 59.88 | 39.84 | 10.22 | ||
| CTEPH | 45.37 | 39.14 | 51.33 | 45.42 | 4.47 | ||
| iPAH | 36.91 | 19.73 | 62.92 | 38.68 | 13.42 | ||
| Control group | 44.16 | 40.71 | 48.84 | 44.46 | 2.5 | ||
| T CD8+/CD3+ lymphocytes [%] | CHD-PAH | 27.21 | 12.78 | 47.16 | 26.94 | 8.2 | Control group vs. CHD-PAH (p ≤ 0.001). CTEPH vs. Control group (p < 0.01). iPAH vs. Control group (p ≤ 0.001) |
| CTD-PAH | 30.62 | 10.18 | 39.87 | 28 | 10.82 | ||
| CTEPH | 20.29 | 11.17 | 36.94 | 23.02 | 7.67 | ||
| iPAH | 28.3 | 9.19 | 59.29 | 29.46 | 14.17 | ||
| Control group | 34.73 | 29.33 | 39.6 | 34.36 | 3.29 | ||
| T CD4+: T CD8+ lymphocytes ratio | CHD-PAH | 1.62 | 0.46 | 4.49 | 1.78 | 0.95 | Control group vs. CTEPH (p < 0.05), CTD-PAH vs. CTEPH (p < 0.05) |
| CTD-PAH | 1.31 | 0.87 | 4.86 | 1.84 | 1.38 | ||
| CTEPH | 2.09 | 1.09 | 4.5 | 2.24 | 0.97 | ||
| iPAH | 1.25 | 0.34 | 6.85 | 1.95 | 1.78 | ||
| Control group | 1.29 | 1.03 | 1.57 | 1.31 | 0.16 | ||
| T regulatory cells [%] | CHD-PAH | 7.43 | 4.67 | 15.59 | 8.43 | 2.87 | CHD-PAH vs. CTEPH (p < 0.01), Control group vs. CTEPH (p < 0.05), CTD-PAH vs. CTEPH (p < 0.05), CHD-PAH vs. iPAH (p < 0.01), Control group vs. iPAH (p ≤ 0.001), CTD-PAH vs. iPAH (p < 0.05), TEPH vs. iPAH (p ≤ 0.001) |
| CTD-PAH | 7.25 | 4.73 | 11.59 | 8.11 | 2.39 | ||
| CTEPH | 4.13 | 1.79 | 10.33 | 4.65 | 2.55 | ||
| iPAH | 11.21 | 5.94 | 23.81 | 11.98 | 3.97 | ||
| Control group | 7.37 | 3.15 | 10.15 | 7.1 | 1.94 | ||
| NT-proBNP [pg/mL] | CHD-PAH | 836 | 106.8 | 9350 | 1597.66 | 1930.48 | - |
| CTD-PAH | 1279 | 429 | 4015 | 1530 | 1384.07 | ||
| CTEPH | 1756.5 | 53 | 5991 | 2071.52 | 1617.33 | ||
| iPAH | 1546 | 210 | 10,144 | 1940.22 | 2072.29 | ||
| Control group | - | - | - | - | - |
| Parameter | Group | Median | Minimum | Maximum | Mean | SD | p |
|---|---|---|---|---|---|---|---|
| Pulmonary vascular resistance (PVR) [dyne/s/cm−5 | CHD-PAH | 838.62 | 134 | 2803 | 1066.32 | 696.02 | CHD-PAH vs. CTD-PAH (p ≤ 0.001). CTD-PAH vs. CTEPH (p < 0.05). CTD-PAH vs. iPAH (p < 0.05) |
| CTD-PAH | 355 | 139 | 1292 | 424.53 | 369.55 | ||
| CTEPH | 715.5 | 305.51 | 1125.8 | 720.4 | 234.12 | ||
| iPAH | 651 | 158 | 1599 | 697.6 | 314.62 | ||
| Control group | - | - | - | - | - | ||
| Cardiac index (CI) [L/min/m2] | CHD-PAH | 2.27 | 1.65 | 7.32 | 2.52 | 1.08 | CTEPH vs. CHD-PAH (p < 0.05). CTEPH vs. CTD-PAH (p < 0.05). iPAH vs. CTEPH (p < 0.01) |
| CTD-PAH | 3.21 | 1.83 | 4.67 | 3.16 | 0.83 | ||
| CTEPH | 2.05 | 1.75 | 5.8 | 2.53 | 1.25 | ||
| iPAH | 2.6 | 1.43 | 3.75 | 2.54 | 0.65 | ||
| Control group | - | - | - | - | - | ||
| Cardiac output (CO) [L/min] | CHD-PAH | 3.84 | 2.29 | 13.9 | 4.2 | 2.11 | CTD-PAH vs. CHD-PAH (p ≤ 0.001). iPAH vs. CHD-PAH (p < 0.01). CTEPH vs. CTD-PAH (p < 0.01). iPAH vs. CTEPH (p < 0.05) |
| CTD-PAH | 5.75 | 3.02 | 8.47 | 5.37 | 1.57 | ||
| CTEPH | 3.56 | 2.48 | 9.51 | 4.19 | 2.17 | ||
| iPAH | 4.46 | 2.11 | 6.42 | 4.64 | 1.15 | ||
| Control group | - | - | - | - | - | ||
| Mean right atrial pressure (mRAP) [mmHg] | CHD-PAH | 8 | 1 | 16 | 7.88 | 3.25 | - |
| CTD-PAH | 8 | 3 | 15 | 8.56 | 4.03 | ||
| CTEPH | 9 | 3 | 18 | 9.5 | 5.02 | ||
| iPAH | 9 | 2 | 23 | 8.8 | 5.69 | ||
| Control group | - | - | - | - | - | ||
| Mean pulmonary artery pressure (mPAP) [mmHg] | CHD-PAH | 48.5 | 26 | 106 | 53.61 | 22.76 | CHD-PAH vs. CTD-PAH (p < 0.01). CTD-PAH vs. CTEPH (p < 0.05). CTD-PAH vs. iPAH (p < 0.05) |
| CTD-PAH | 34 | 25 | 68 | 35.3 | 13.25 | ||
| CTEPH | 46 | 25.6 | 56 | 45.66 | 8.75 | ||
| iPAH | 48 | 25 | 66 | 45.56 | 12.03 | ||
| Control group | - | - | - | - | - | ||
| Mean pulmonary artery pressure by echocardiography (PASP) [mmHg] | CHD-PAH | 76.5 | 41 | 150 | 82.15 | 29.02 | CTD-PAH vs. CHD-PAH (p < 0.01). CTEPH vs. CTD-PAH (p < 0.05). iPAH vs. CTD-PAH (p < 0.05) |
| CTD-PAH | 57 | 35 | 110 | 58.22 | 21.68 | ||
| CTEPH | 78.5 | 39 | 110 | 80.4 | 21.57 | ||
| iPAH | 77 | 37 | 105 | 72.2 | 18.92 | ||
| Control group | - | - | - | - | - | ||
| Mean pressure in the right ventricle on echocardiography [mmHg] | CHD-PAH | 72 | 40 | 150 | 81.19 | 29.69 | CHD-PAH vs. CTD-PAH (p < 0.05). CTD-PAH vs. CTEPH (p < 0.05). |
| CTD-PAH | 56 | 36 | 115 | 58.67 | 24.07 | ||
| CTEPH | 76.5 | 50 | 110 | 79.7 | 18.54 | ||
| iPAH | 76 | 42 | 96 | 68.84 | 17.66 | ||
| Control group | - | - | - | - | - |
| Structure | Antibody | Fluorochrome |
|---|---|---|
| T-cells | anty–CD4 | FITC |
| T-cells | anty–CD8 | FITC |
| B-cells | anty–CD19 | FITC |
| CTLA-4 | anty–CTLA-4 | PE-Cy5 |
Publisher’s Note: MDPI stays neutral with regard to jurisdictional claims in published maps and institutional affiliations. |
© 2022 by the authors. Licensee MDPI, Basel, Switzerland. This article is an open access article distributed under the terms and conditions of the Creative Commons Attribution (CC BY) license (https://creativecommons.org/licenses/by/4.0/).
Share and Cite
Tomaszewski, M.; Małkowska, P.; Sierawska, O.; Hrynkiewicz, R.; Mroczek, E.; Darocha, S.; Hymos, A.; Błaszczak, P.; Grywalska, E.; Niedźwiedzka-Rystwej, P. CTLA-4 Expression Is a Promising Biomarker of Idiopathic Pulmonary Arterial Hypertension and Allows Differentiation of the Type of Pulmonary Hypertension. Int. J. Mol. Sci. 2022, 23, 15910. https://doi.org/10.3390/ijms232415910
Tomaszewski M, Małkowska P, Sierawska O, Hrynkiewicz R, Mroczek E, Darocha S, Hymos A, Błaszczak P, Grywalska E, Niedźwiedzka-Rystwej P. CTLA-4 Expression Is a Promising Biomarker of Idiopathic Pulmonary Arterial Hypertension and Allows Differentiation of the Type of Pulmonary Hypertension. International Journal of Molecular Sciences. 2022; 23(24):15910. https://doi.org/10.3390/ijms232415910
Chicago/Turabian StyleTomaszewski, Michał, Paulina Małkowska, Olga Sierawska, Rafał Hrynkiewicz, Ewa Mroczek, Szymon Darocha, Anna Hymos, Piotr Błaszczak, Ewelina Grywalska, and Paulina Niedźwiedzka-Rystwej. 2022. "CTLA-4 Expression Is a Promising Biomarker of Idiopathic Pulmonary Arterial Hypertension and Allows Differentiation of the Type of Pulmonary Hypertension" International Journal of Molecular Sciences 23, no. 24: 15910. https://doi.org/10.3390/ijms232415910
APA StyleTomaszewski, M., Małkowska, P., Sierawska, O., Hrynkiewicz, R., Mroczek, E., Darocha, S., Hymos, A., Błaszczak, P., Grywalska, E., & Niedźwiedzka-Rystwej, P. (2022). CTLA-4 Expression Is a Promising Biomarker of Idiopathic Pulmonary Arterial Hypertension and Allows Differentiation of the Type of Pulmonary Hypertension. International Journal of Molecular Sciences, 23(24), 15910. https://doi.org/10.3390/ijms232415910


