
Susceptibility of Human Plasma N-glycome to Low-Calorie and Different Weight-Maintenance Diets

 , ,
, ,
Abstract
1. Introduction
2. Results
3. Discussion
4. Material Methods
4.1. Subjects
4.2. Sample Preparation
4.3. Hydrophilic Interaction Chromatography—Ultra-High-Performance Liquid Chromatography with Fluorescence Detection (HILIC-UHPLC-FLR) N-glycan Analysis
4.4. Data Analysis
4.4.1. Normalization and Batch Correction
4.4.2. Derived Traits
4.4.3. Longitudinal Analysis
Supplementary Materials
Author Contributions
Funding
Institutional Review Board Statement
Informed Consent Statement
Data Availability Statement
Acknowledgments
Conflicts of Interest
Abbreviations
References
- World Health Organization. Obesity and Overweight. 2019. Available online: https://www.who.int/en/news-room/fact-sheets/detail/obesity-and-overweight (accessed on 25 August 2022).
- Di Angelantonio, E.; Bhupathiraju, S.N.; Wormser, D.; Gao, P.; Kaptoge, S.; de Gonzalez, A.B.; Cairns, B.J.; Huxley, R.; Jackson, C.L.; Joshy, G.; et al. Body-mass index and all-cause mortality: Individual-participant-data meta-analysis of 239 prospective studies in four continents. Lancet 2016, 388, 776–786. [Google Scholar] [CrossRef] [PubMed]
- Khan, S.S.; Ning, H.; Wilkins, J.T.; Allen, N.; Carnethon, M.; Berry, J.D.; Sweis, R.N.; Lloyd-Jones, D.M. Association of body mass index with lifetime risk of cardiovascular disease and compression of morbidity. JAMA Cardiol. 2018, 3, 280–287. [Google Scholar] [CrossRef] [PubMed]
- Turpie, A.G.G.; Bauer, K.A.; Eriksson, B.I.; Lassen, M.R. Overweight and obesity as determinants of cardiovascular risk: The Framingham experience. Arch. Intern. Med. 2002, 162, 1867–1872. [Google Scholar] [CrossRef]
- Bays, H.E.; Chapman, R.H.; Grandy, S. The relationship of body mass index to diabetes mellitus, hypertension and dyslipidaemia: Comparison of data from two national surveys. Int. J. Clin. Pract. 2007, 61, 737–747. [Google Scholar] [CrossRef] [PubMed]
- Narayan, K.M.V.; Boyle, J.P.; Thompson, T.J.; Gregg, E.W.; Williamson, D.F. Effect of BMI on lifetime risk for diabetes in the U.S. Diabetes Care 2007, 30, 1562–1566. [Google Scholar] [CrossRef]
- Barberio, A.M.; Alareeki, A.; Viner, B.; Pader, J.; Vena, J.E.; Arora, P.; Friedenreich, C.M.; Brenner, D.R. Central body fatness is a stronger predictor of cancer risk than overall body size. Nat. Commun. 2019, 10, 383. [Google Scholar] [CrossRef]
- Casanova, F.; O’Loughlin, J.; Martin, S.; Beaumont, R.N.; Wood, A.R.; Watkins, E.R.; Freathy, R.M.; Hagenaars, S.P.; Frayling, T.M.; Yaghootkar, H.; et al. Higher adiposity and mental health: Causal inference using Mendelian randomization. Hum. Mol. Genet. 2021, 30, 2371–2382. [Google Scholar] [CrossRef]
- Harrington, M.; Gibson, S.; Cottrell, R.C. A review and meta-analysis of the effect of weight loss on all-cause mortality risk. Nutr. Res. Rev. 2009, 22, 93–108. [Google Scholar] [CrossRef]
- Clifton, P.M.; Keogh, J.B. Effects of different weight loss approaches on CVD risk. Curr. Atheroscler. Rep. 2018, 20, 27. [Google Scholar] [CrossRef]
- Diabetes Prevention Program Research Group. Reduction in the incidence of type 2 diabetes with lifestyle intervention or metformin. N. Engl. J. Med. 2002, 346, 393–403. [Google Scholar] [CrossRef]
- Diabetes Prevention Program Research Group. 10-year follow-up of diabetes incidence and weight loss in the diabetes prevention program outcomes study. Lancet 2009, 374, 1677–1686. [Google Scholar] [CrossRef] [PubMed]
- Strelitz, J.; Sharp, S.J.; Khunti, K.; Vos, R.C.; Rutten, G.E.H.M.; Webb, D.R.; Witte, D.R.; Sandbæk, A.; Wareham, N.J.; Griffin, S.J. Association of weight loss and weight loss maintenance following diabetes diagnosis by screening and incidence of cardiovascular disease and all-cause mortality: An observational analysis of the ADDITION-Europe trial. Diabetes Obes. Metab. 2021, 23, 730–741. [Google Scholar] [CrossRef] [PubMed]
- Aucott, L.S.; Philip, S.; Avenell, A.; Afolabi, E.; Sattar, N.; Wild, S. Patterns of weight change after the diagnosis of type 2 diabetes in Scotland and their relationship with glycaemic control, mortality and cardiovascular outcomes: A retrospective cohort study. BMJ Open 2016, 6, e010836. [Google Scholar] [CrossRef]
- Wing, R.R.; Phelan, S. Long-term weight loss maintenance. Am. J. Clin. Nutr. 2005, 82, 222S–225S. [Google Scholar] [CrossRef] [PubMed]
- Wing, R.R.; Hill, J.O. Successful weight loss maintenance. Annu. Rev. Nutr. 2001, 21, 323–341. [Google Scholar] [CrossRef]
- Hall, K.D.; Kahan, S. Maintenance of lost weight and long-term management of obesity. Med. Clin. North Am. 2018, 102, 183–197. [Google Scholar] [CrossRef] [PubMed]
- Paixão, C.; Dias, C.M.; Jorge, R.; Carraça, E.V.; Yannakoulia, M.; De Zwaan, M.; Soini, S.; Hill, J.O.; Teixeira, P.J.; Santos, I. Successful weight loss maintenance: A systematic review of weight control registries. Obes. Rev. 2020, 21, 2008–2011. [Google Scholar] [CrossRef] [PubMed]
- Lee, M.B.; Hill, C.M.; Bitto, A.; Kaeberlein, M. Antiaging diets: Separating fact from fiction. Science 2021, 374, eabe7365. [Google Scholar] [CrossRef] [PubMed]
- Hamm, P.; Shekelle, R.B.; Stamler, J. Large fluctuations in body weight during young adulthood and twenty-fwe-year risk of coronary death in men. Am. J. Epidemiol. 1989, 129, 312–318. [Google Scholar] [CrossRef]
- Olson, M.B.; Kelsey, S.F.; Bittner, V.; Reis, S.; Reichek, N.; Handberg, E.; Merz, C.N.B. Weight cycling and high-density lipoprotein cholesterol in women: Evidence of an adverse effect: A report from the NHLBI-sponsored WISE study. J. Am. Coll. Cardiol. 2000, 36, 1565–1571. [Google Scholar] [CrossRef]
- Varki, A.; Cummings, R.D.; Esko, J.D.; Stanley, P.; Hart, G.W.; Aebi, M.; Darvill, A.G.; Kinoshita, T.; Packer, N.H.; Prestegard, J.H.; et al. Essentials of Glycobiology; Cold Spring Harbor Laboratory Press: Cold Spring Harbor, NY, USA, 2022. [Google Scholar] [CrossRef]
- Ohtsubo, K.; Marth, J.D. Glycosylation in cellular mechanisms of health and disease. Cell 2006, 126, 855–867. [Google Scholar] [CrossRef] [PubMed]
- Hennig, R.; Cajic, S.; Borowiak, M.; Hoffmann, M.; Kottler, R.; Reichl, U.; Rapp, E. Towards personalized diagnostics via longitudinal study of the human plasma N-glycome. Biochim. Biophys. Acta Gen. Subj. 2016, 1860, 1728–1738. [Google Scholar] [CrossRef] [PubMed]
- Gornik, O.; Wagner, J.; Pučić, M.; Knežević, A.; Redžić, I.; Lauc, G. Stability of N-glycan profiles in human plasma. Glycobiology 2009, 19, 1547–1553. [Google Scholar] [CrossRef] [PubMed]
- Knežević, A.; Gornik, O.; Polašek, O.; Pučić, M.; Redžić, I.; Novokmet, M.; Rudd, P.M.; Wright, A.F.; Campbell, H.; Rudan, I.; et al. Effects of aging, body mass index, plasma lipid profiles, and smoking on human plasma N-glycans. Glycobiology 2010, 20, 959–969. [Google Scholar] [CrossRef] [PubMed]
- Krištić, J.; Vučković, F.; Menni, C.; Klarić, L.; Keser, T.; Beceheli, I.; Pučić-Baković, M.; Novokmet, M.; Mangino, M.; Thaqi, K.; et al. Glycans are a novel biomarker of chronological and biological ages. J. Gerontol. Ser. A Biol. Sci. Med. Sci. 2014, 69, 779–789. [Google Scholar] [CrossRef]
- Arnold, J.N.; Saldova, R.; Hamid, U.M.A.; Rudd, P.M. Evaluation of the serum N-linked glycome for the diagnosis of cancer and chronic inflammation. Proteomics 2008, 8, 3284–3293. [Google Scholar] [CrossRef]
- Novokmet, M.; Lukić, E.; Vučković, F.; Durić, Ž.; Keser, T.; Rajšl, K.; Remondini, D.; Castellani, G.; Gašparović, H.; Gornik, O.; et al. Changes in IgG and total plasma protein glycomes in acute systemic inflammation. Sci. Rep. 2014, 4, 4347. [Google Scholar] [CrossRef]
- Akmačić, I.T.; Ventham, N.T.; Theodoratou, E.; Vučković, F.; Kennedy, N.A.; Krištić, J.; Nimmo, E.R.; Kalla, R.; Drummond, H.; Štambuk, J.; et al. Inflammatory bowel disease associates with proinflammatory potential of the immunoglobulin G glycome. Inflamm. Bowel Dis. 2015, 21, 1237–1247. [Google Scholar] [CrossRef]
- Thanabalasingham, G.; Huffman, J.E.; Kattla, J.J.; Novokmet, M.; Rudan, I.; Gloyn, A.L.; Hayward, C.; Adamczyk, B.; Reynolds, R.M.; Muzinic, A.; et al. Mutations in HNF1A result in marked alterations of plasma glycan profile. Diabetes 2013, 62, 1329–1337. [Google Scholar] [CrossRef]
- Vučković, F.; Krištić, J.; Gudelj, I.; Teruel, M.; Keser, T.; Pezer, M.; Pučić-Baković, M.; Štambuk, J.; Trbojević-Akmačić, I.; Barrios, C.; et al. Association of systemic lupus erythematosus with decreased immunosuppressive potential of the IgG glycome. Arthritis Rheumatol. 2015, 67, 2978–2989. [Google Scholar] [CrossRef]
- Clerc, F.; Reiding, K.R.; Jansen, B.C.; Kammeijer, G.S.M.; Bondt, A.; Wuhrer, M. Human plasma protein N-glycosylation. Glycoconj. J. 2015, 33, 309–343. [Google Scholar] [CrossRef] [PubMed]
- der Linden, E.C.M.B.; de Haan, P.F.; Havenaar, E.C.; van Dijk, W. Inflammation-induced expression of sialyl Lewis(x) is not restricted to α1-acid glycoprotein but also occurs to a lesser extent on α1- antichymotrypsin and haptoglobin. Glycoconj. J. 1998, 15, 177–182. [Google Scholar] [CrossRef] [PubMed]
- Keser, T.; Gornik, I.; Vučković, F.; Selak, N.; Pavić, T.; Lukić, E.; Gudelj, I.; Gašparović, H.; Biočina, B.; Tilin, T.; et al. Increased plasma N-glycome complexity is associated with higher risk of type 2 diabetes. Diabetologia 2017, 60, 2352–2360. [Google Scholar] [CrossRef] [PubMed]
- Cvetko, A.; Mangino, M.; Tijardović, M.; Kifer, D.; Falchi, M.; Keser, T.; Perola, M.; Spector, T.D.; Lauc, G.; Menni, C.; et al. Plasma N-glycome shows continuous deterioration as the diagnosis of insulin resistance approaches. BMJ Open Diabetes Res. Care 2021, 9, e002263. [Google Scholar] [CrossRef] [PubMed]
- Demus, D.; Jansen, B.C.; Gardner, R.A.; Urbanowicz, P.A.; Wu, H.; Štambuk, T.; Juszczak, A.; Medvidović, E.P.; Juge, N.; Gornik, O.; et al. Interlaboratory evaluation of plasma N-glycan antennary fucosylation as a clinical biomarker for HNF1A-MODY using liquid chromatography methods. Glycoconj. J. 2021, 38, 375. [Google Scholar] [CrossRef]
- Juszczak, A.; Pavić, T.; Vučković, F.; Bennett, A.J.; Shah, N.; Medvidović, E.P.; Groves, C.J.; Šekerija, M.; Chandler, K.; Burrows, C.; et al. Plasma fucosylated glycans and C-reactive protein as biomarkers of HNF1A-MODY in young adult–onset nonautoimmune diabetes. Diabetes Care 2019, 42, 17–26. [Google Scholar] [CrossRef]
- Gudelj, I.; Lauc, G.; Pezer, M. Immunoglobulin G glycosylation in aging and diseases. Cell. Immunol. 2018, 333, 65–79. [Google Scholar] [CrossRef]
- Perkovic, M.N.; Bakovic, M.P.; Kristic, J.; Novokmet, M.; Huffman, J.E.; Vitart, V.; Hayward, C.; Rudan, I.; Wilson, J.F.; Campbell, H.; et al. The association between galactosylation of immunoglobulin G and body mass index. Prog. Neuro-Psychopharmacol. Biol. Psychiatry 2014, 48, 20–25. [Google Scholar] [CrossRef]
- Kim, T.; Xie, Y.; Li, Q.; Artegoitia, V.M.; Lebrilla, C.B.; Keim, N.L.; Adams, S.H.; Krishnan, S. Diet affects glycosylation of serum proteins in women at risk for cardiometabolic disease. Eur. J. Nutr. 2021, 60, 3727–3741. [Google Scholar] [CrossRef]
- Greto, V.L.; Cvetko, A.; Štambuk, T.; Dempster, N.J.; Kifer, D.; Deriš, H.; Cindrić, A.; Vučković, F.; Falchi, M.; Gillies, R.S.; et al. Extensive weight loss reduces glycan age by altering IgG N-glycosylation. Int. J. Obes. 2021, 45, 1521–1531. [Google Scholar] [CrossRef]
- Larsen, T.M.; Dalskov, S.; Van Baak, M.; Jebb, S.; Kafatos, A.; Pfeiffer, A.; Martinez, J.A.; Handjieva-Darlenska, T.; Kuneå¡ovã¡, M.; Holst, C.; et al. The diet, obesity and genes (diogenes) dietary study in eight European countries—A comprehensive design for long-term intervention. Obes. Rev. 2010, 11, 76–91. [Google Scholar] [CrossRef]
- Gögebakan, Ö.; Kohl, A.; Osterhoff, M.A.; van Baak, M.A.; Jebb, S.A.; Papadaki, A.; Martinez, J.A.; Handjieva-Darlenska, T.; Hlavaty, P.; Weickert, M.O.; et al. Effects of weight loss and long-term weight maintenance with diets varying in protein and glycemic index on cardiovascular risk factors: The diet, obesity, and genes (diogenes) study: A randomized, controlled trial. Circulation 2011, 124, 2829–2838. [Google Scholar] [CrossRef] [PubMed]
- Khanna, D.; Khanna, S.; Khanna, P.; Kahar, P.; Patel, B.M. Obesity: A chronic low-grade inflammation and its markers. Cureus 2022, 14, e22711. [Google Scholar] [CrossRef] [PubMed]
- Lau, D.C.W.; Dhillon, B.; Yan, H.; Szmitko, P.E.; Verma, S. Adipokines: Molecular links between obesity and atheroslcerosis. Am. J. Physiol. Heart Circ. Physiol. 2005, 288, H2031–H2041. [Google Scholar] [CrossRef]
- Giordano, P.; Del Vecchio, G.C.; Cecinati, V.; Delvecchio, M.; Altomare, M.; De Palma, F.; De Mattia, D.; Cavallo, L.; Faienza, M.F. Metabolic, inflammatory, endothelial and haemostatic markers in a group of Italian obese children and adolescents. Eur. J. Pediatr. 2011, 170, 845–850. [Google Scholar] [CrossRef] [PubMed]
- Montero, D.; Walther, G.; Perez-Martin, A.; Roche, E.; Vinet, A. Endothelial dysfunction, inflammation, and oxidative stress in obese children and adolescents: Markers and effect of lifestyle intervention. Obes. Rev. 2012, 13, 441–455. [Google Scholar] [CrossRef]
- Benedek, I.; Fiske, W.D., 3rd; Griffen, W.; Bell, R.; Blouin, R.; McNamara, P. Serum alpha 1-acid glycoprotein and the binding of drugs in obesity. Br. J. Clin. Pharmacol. 1983, 16, 751. [Google Scholar] [CrossRef]
- Kim, S.W.; Choi, J.-W.; Yun, J.W.; Chung, I.-S.; Cho, H.C.; Song, S.-E.; Im, S.-S.; Song, D.-K. Proteomics approach to identify serum biomarkers associated with the progression of diabetes in Korean patients with abdominal obesity. PLoS ONE 2019, 14, e0222032. [Google Scholar] [CrossRef]
- de Pergola, G.; di Roma, P.; Paoli, G.; Guida, P.; Pannacciulli, N.; Giorgino, R. Haptoglobin serum levels are independently associated with insulinemia in overweight and obese women. J. Endocrinol. Investig. 2007, 30, 399–403. [Google Scholar] [CrossRef] [PubMed]
- Whicher, J.T. Abnormalities of plasma proteins. In Scientific Foundations of Biochemistry in Clinical Practice, 2nd ed.; Butterworth-Heinemann: Oxford, UK, 1994; pp. 464–494. [Google Scholar] [CrossRef]
- Gulhar, R.; Ashraf, M.A.; Jialal, I. Physiology, Acute Phase Reactants; StatPearls: Treasure Island, FL, USA, 2022. Available online: https://www.ncbi.nlm.nih.gov/books/NBK519570/ (accessed on 31 August 2022).
- Gabay, C.; Kushner, I. Acute-phase proteins and other systemic responses to inflammation. N. Engl. J. Med. 1999, 340, 448–454. [Google Scholar] [CrossRef] [PubMed]
- Gornik, O.; Lauc, G. Glycosylation of serum proteins in inflammatory diseases. Dis. Markers 2008, 25, 267–278. [Google Scholar] [CrossRef] [PubMed]
- Pavić, T.; Dilber, D.; Kifer, D.; Selak, N.; Keser, T.; Ljubičić, Đ.; Dugac, A.V.; Lauc, G.; Rumora, L.; Gornik, O. N-glycosylation patterns of plasma proteins and immunoglobulin G in chronic obstructive pulmonary disease 11 Medical and Health Sciences 1102 Cardiorespiratory Medicine and Haematology. J. Transl. Med. 2018, 16, 323. [Google Scholar] [CrossRef] [PubMed]
- Trbojević-Akmačić, I.; Vučković, F.; Vilaj, M.; Skelin, A.; Karssen, L.C.; Krištić, J.; Jurić, J.; Momčilović, A.; Šimunović, J.; Mangino, M.; et al. Plasma N-glycome composition associates with chronic low back pain. Biochim. Biophys. Acta Gen. Subj. 2018, 1862, 2124–2133. [Google Scholar] [CrossRef] [PubMed]
- Saldova, R.; Royle, L.; Radcliffe, C.M.; Hamid, U.M.A.; Evans, R.; Arnold, J.N.; Banks, R.E.; Hutson, R.; Harvey, D.J.; Antrobus, R.; et al. Ovarian cancer is associated with changes in glycosylation in both acute-phase proteins and IgG. Glycobiology 2007, 17, 1344–1356. [Google Scholar] [CrossRef]
- Feelders, R.A.; Vreugdenhil, G.; de Jong, G.; Swaak, A.J.G.; van Eijk, H.G. Transferrin microheterogeneity in rheumatoid arthritis. Relation with disease activity and anemia of chronic disease. Rheumatol. Int. 1992, 12, 195–199. [Google Scholar] [CrossRef][Green Version]
- Grzymisławski, M.; Derc, K.; Sobieska, M.; Wiktorowicz, K. Microheterogeneity of acute phase proteins in patients with ulcerative colitis. World J. Gastroenterol. 2006, 12, 5191. [Google Scholar] [CrossRef]
- Zhang, S.; Shang, S.; Li, W.; Qin, X.; Liu, Y. Insights on N-glycosylation of human haptoglobin and its association with cancers. Glycobiology 2016, 26, 684–692. [Google Scholar] [CrossRef]
- Kataoka, H.; Seguchi, K.; Inoue, T.; Koono, M. Properties of α1-antitrypsin secreted by human adenocarcinoma cell lines. FEBS Lett. 1993, 328, 291–295. [Google Scholar] [CrossRef][Green Version]
- Čaval, T.; Lin, Y.-H.; Varkila, M.; Reiding, K.R.; Bonten, M.J.M.; Cremer, O.L.; Franc, V.; Heck, A.J.R. Glycoproteoform profiles of individual patients’ plasma alpha-1-antichymotrypsin are unique and extensively remodeled following a septic episode. Front. Immunol. 2021, 11, 3413. [Google Scholar] [CrossRef]
- Keser, T.; Tijardović, M.; Gornik, I.; Lukić, E.; Lauc, G.; Gornik, O.; Novokmet, M. High-throughput and site-specific N-Glycosylation analysis of human alpha-1-acid glycoprotein offers a great potential for new biomarker discovery. Mol. Cell. Proteom. 2021, 20, 100044. [Google Scholar] [CrossRef]
- Doherty, M.; Theodoratou, E.; Walsh, I.; Adamczyk, B.; Stöckmann, H.; Agakov, F.; Timofeeva, M.; Trbojević-Akmačić, I.; Vučković, F.; Duffy, F.; et al. Plasma N-glycans in colorectal cancer risk. Sci. Rep. 2018, 8, 8655. [Google Scholar] [CrossRef] [PubMed]
- Brown, W.; Garcia, M.; Mamedova, L.; Christman, K.; Zenobi, M.; Staples, C.; Leno, B.; Overton, T.; Whitlock, B.; Daniel, J.; et al. Acute-phase protein α-1-acid glycoprotein is negatively associated with feed intake in postpartum dairy cows. J. Dairy Sci. 2021, 104, 806–817. [Google Scholar] [CrossRef] [PubMed]
- Maraj, M.; Hetwer, P.; Kuśnierz-Cabala, B.; Maziarz, B.; Dumnicka, P.; Kuźniewski, M.; Ceranowicz, P. α 1-acid glycoprotein and dietary intake in end-stage renal disease patients. Nutrients 2021, 13, 3671. [Google Scholar] [CrossRef] [PubMed]
- Sun, Y.; Yang, Y.; Qin, Z.; Cai, J.; Guo, X.; Tang, Y.; Wan, J.; Su, D.-F.; Liu, X. The acute-phase protein orosomucoid regulates food intake and energy homeostasis via leptin receptor signaling pathway. Diabetes 2016, 65, 1630–1641. [Google Scholar] [CrossRef] [PubMed]
- Lee, Y.S.; Choi, J.W.; Hwang, I.; Lee, J.W.; Lee, J.H.; Kim, A.Y.; Huh, J.Y.; Koh, Y.J.; Koh, G.Y.; Son, H.J.; et al. Adipocytokine orosomucoid integrates inflammatory and metabolic signals to preserve energy homeostasis by resolving immoderate inflammation. J. Biol. Chem. 2010, 285, 22174–22185. [Google Scholar] [CrossRef] [PubMed]
- Van Dijk, W.; Havenaar, E.C.; Der Linden, E.C.M.B.-V. α1-Acid glycoprotein (orosomucoid): Pathophysiological changes in glycosylation in relation to its function. Glycoconj. J. 1995, 12, 227–233. [Google Scholar] [CrossRef]
- Huffman, K.M.; Parker, D.C.; Bhapkar, M.; Racette, S.B.; Martin, C.K.; Redman, L.M.; Das, S.K.; Connelly, M.A.; Pieper, C.F.; Orenduff, M.; et al. Calorie restriction improves lipid-related emerging cardiometabolic risk factors in healthy adults without obesity: Distinct influences of BMI and sex from CALERIETM a multicentre, phase 2, randomised controlled trial. eClinicalMedicine 2022, 43, 101261. [Google Scholar] [CrossRef]
- Deriš, H.; Tominac, P.; Vučković, F.; Briški, N.; Astrup, A.; Blaak, E.E.; Lauc, G.; Gudelj, I. Effects of low-calorie and different weight-maintenance diets on IgG glycome composition. Front. Immunol. 2022, 13, 995186. [Google Scholar] [CrossRef]
- Vattepu, R.; Sneed, S.L.; Anthony, R.M. Sialylation as an important regulator of antibody function. Front. Immunol. 2022, 13, 1571. [Google Scholar] [CrossRef]
- Kaneko, Y.; Nimmerjahn, F.; Ravetch, J.V. Anti-inflammatory activity of immunoglobulin G resulting from Fc sialylation. Science 2006, 313, 670–673. [Google Scholar] [CrossRef]
- Moore, C.S.; Lindroos, A.K.; Kreutzer, M.; Larsen, T.M.; Astrup, A.; Van Baak, M.A.; Handjieva-Darlenska, T.; Hlavaty, P.; Kafatos, A.; Kohl, A.; et al. Dietary strategy to manipulate ad libitum macronutrient intake, and glycaemic index, across eight European countries in the Diogenes Study. Obes. Rev. 2010, 11, 67–75. [Google Scholar] [CrossRef] [PubMed]
- Larsen, T.M.; Dalskov, S.-M.; van Baak, M.; Jebb, S.A.; Papadaki, A.; Pfeiffer, A.F.; Martinez, J.A.; Handjieva-Darlenska, T.; Kunešová, M.; Pihlsgård, M.; et al. Diets with high or low protein content and glycemic index for weight-loss maintenance. N. Engl. J. Med. 2010, 363, 2102–2113. [Google Scholar] [CrossRef] [PubMed]
- Akmačić, I.T.; Ugrina, I.; Štambuk, J.; Gudelj, I.; Vučković, F.; Lauc, G.; Pučić-Baković, M. High-throughput glycomics: Optimization of sample preparation. Biochemistry 2015, 80, 934–942. [Google Scholar] [CrossRef]
- Leek, J.T.; Johnson, W.E.; Parker, H.S.; Jaffe, A.E.; Storey, J.D. The sva package for removing batch effects and other unwanted variation in high-throughput experiments. Bioinformatics 2012, 28, 882–883. [Google Scholar] [CrossRef] [PubMed]
- Bates, D.; Mächler, M.; Bolker, B.; Walker, S. Fitting linear mixed-effects models using lme4. J. Stat. Softw. 2015, 67, 48. [Google Scholar] [CrossRef]
- Schwarzer, G.; Carpenter, J.R.; Rücker, G. Meta-Analysis with R; Springer: Cham, Switzerland, 2015. [Google Scholar] [CrossRef]
- Aulchenko, Y.S.; Ripke, S.; Isaacs, A.; van Duijn, C.M. GenABEL: An R library for genome-wide association analysis. Bioinformatics 2007, 23, 1294–1296. [Google Scholar] [CrossRef] [PubMed]


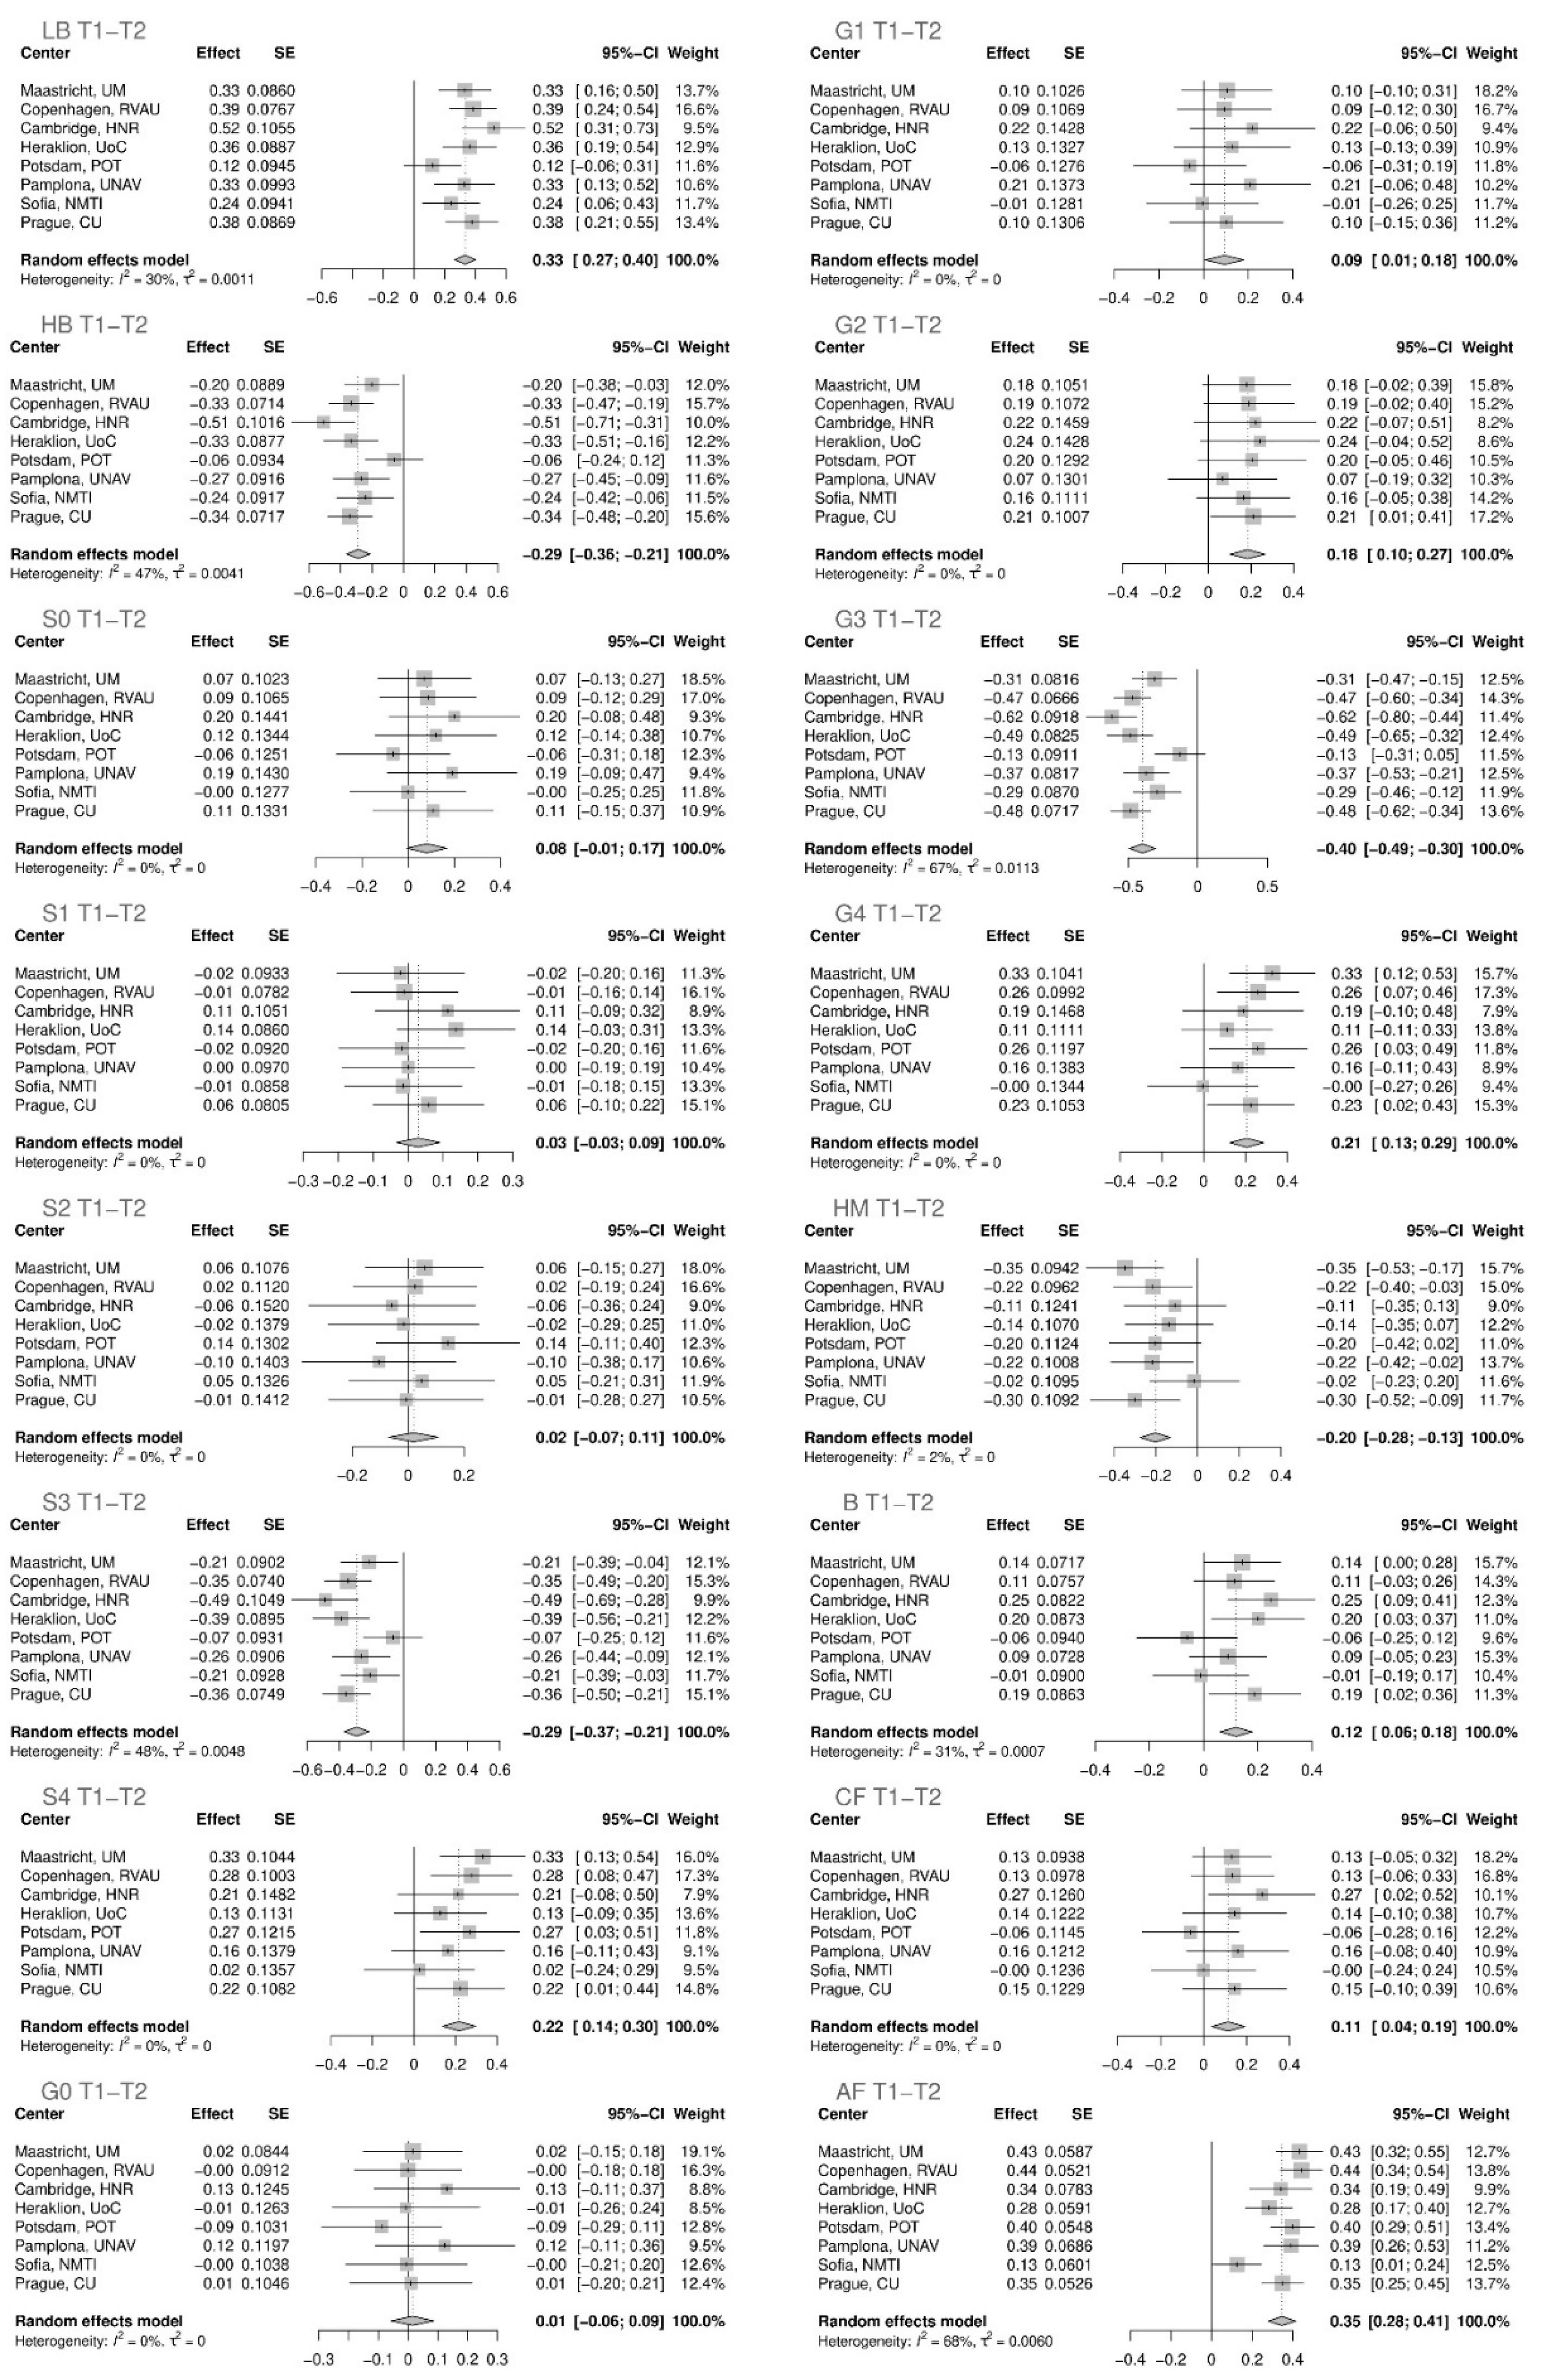
| T1–T2 | ||||
|---|---|---|---|---|
| Glycan | Effect | Standard Error | p Value | Adjusted p Value |
| AF total | 0.34665 | 0.03467 | 1.54 × 10⁻²³ | 4.93 × 10⁻²² |
| LB total | 0.33330 | 0.03409 | 1.41 × 10⁻²² | 2.26 × 10⁻²¹ |
| G3 total | −0.39682 | 0.04733 | 5.12 × 10⁻¹⁷ | 4.10 × 10⁻¹⁶ |
| HB total | −0.28782 | 0.03800 | 3.63 × 10⁻¹⁴ | 2.32 × 10⁻¹³ |
| S3 total | −0.29167 | 0.03965 | 1.89 × 10⁻¹³ | 1.01 × 10⁻¹² |
| HM total | −0.20367 | 0.03733 | 4.86 × 10⁻⁸ | 2.22 × 10⁻⁷ |
| S4 total | 0.21731 | 0.04171 | 1.88 × 10⁻⁷ | 7.54 × 10⁻⁷ |
| G4 total | 0.20656 | 0.04120 | 5.34 × 10⁻⁷ | 1.90 × 10⁻⁶ |
| G2 total | 0.18442 | 0.04181 | 1.03 × 10⁻⁵ | 3.29 × 10⁻⁵ |
| B total | 0.11955 | 0.03034 | 8.13 × 10⁻⁵ | 2.36 × 10⁻⁴ |
| CF total | 0.11460 | 0.04003 | 0.00419 | 0.00959 |
| G1 total | 0.09387 | 0.04375 | 0.03190 | 0.05373 |
| S0 total | 0.08067 | 0.04394 | 0.06639 | 0.09657 |
| S1 total | 0.02901 | 0.03133 | 0.35451 | 0.45377 |
| S2 total | 0.01949 | 0.04570 | 0.66983 | 0.71448 |
| G0 total | 0.01454 | 0.03687 | 0.69331 | 0.71567 |
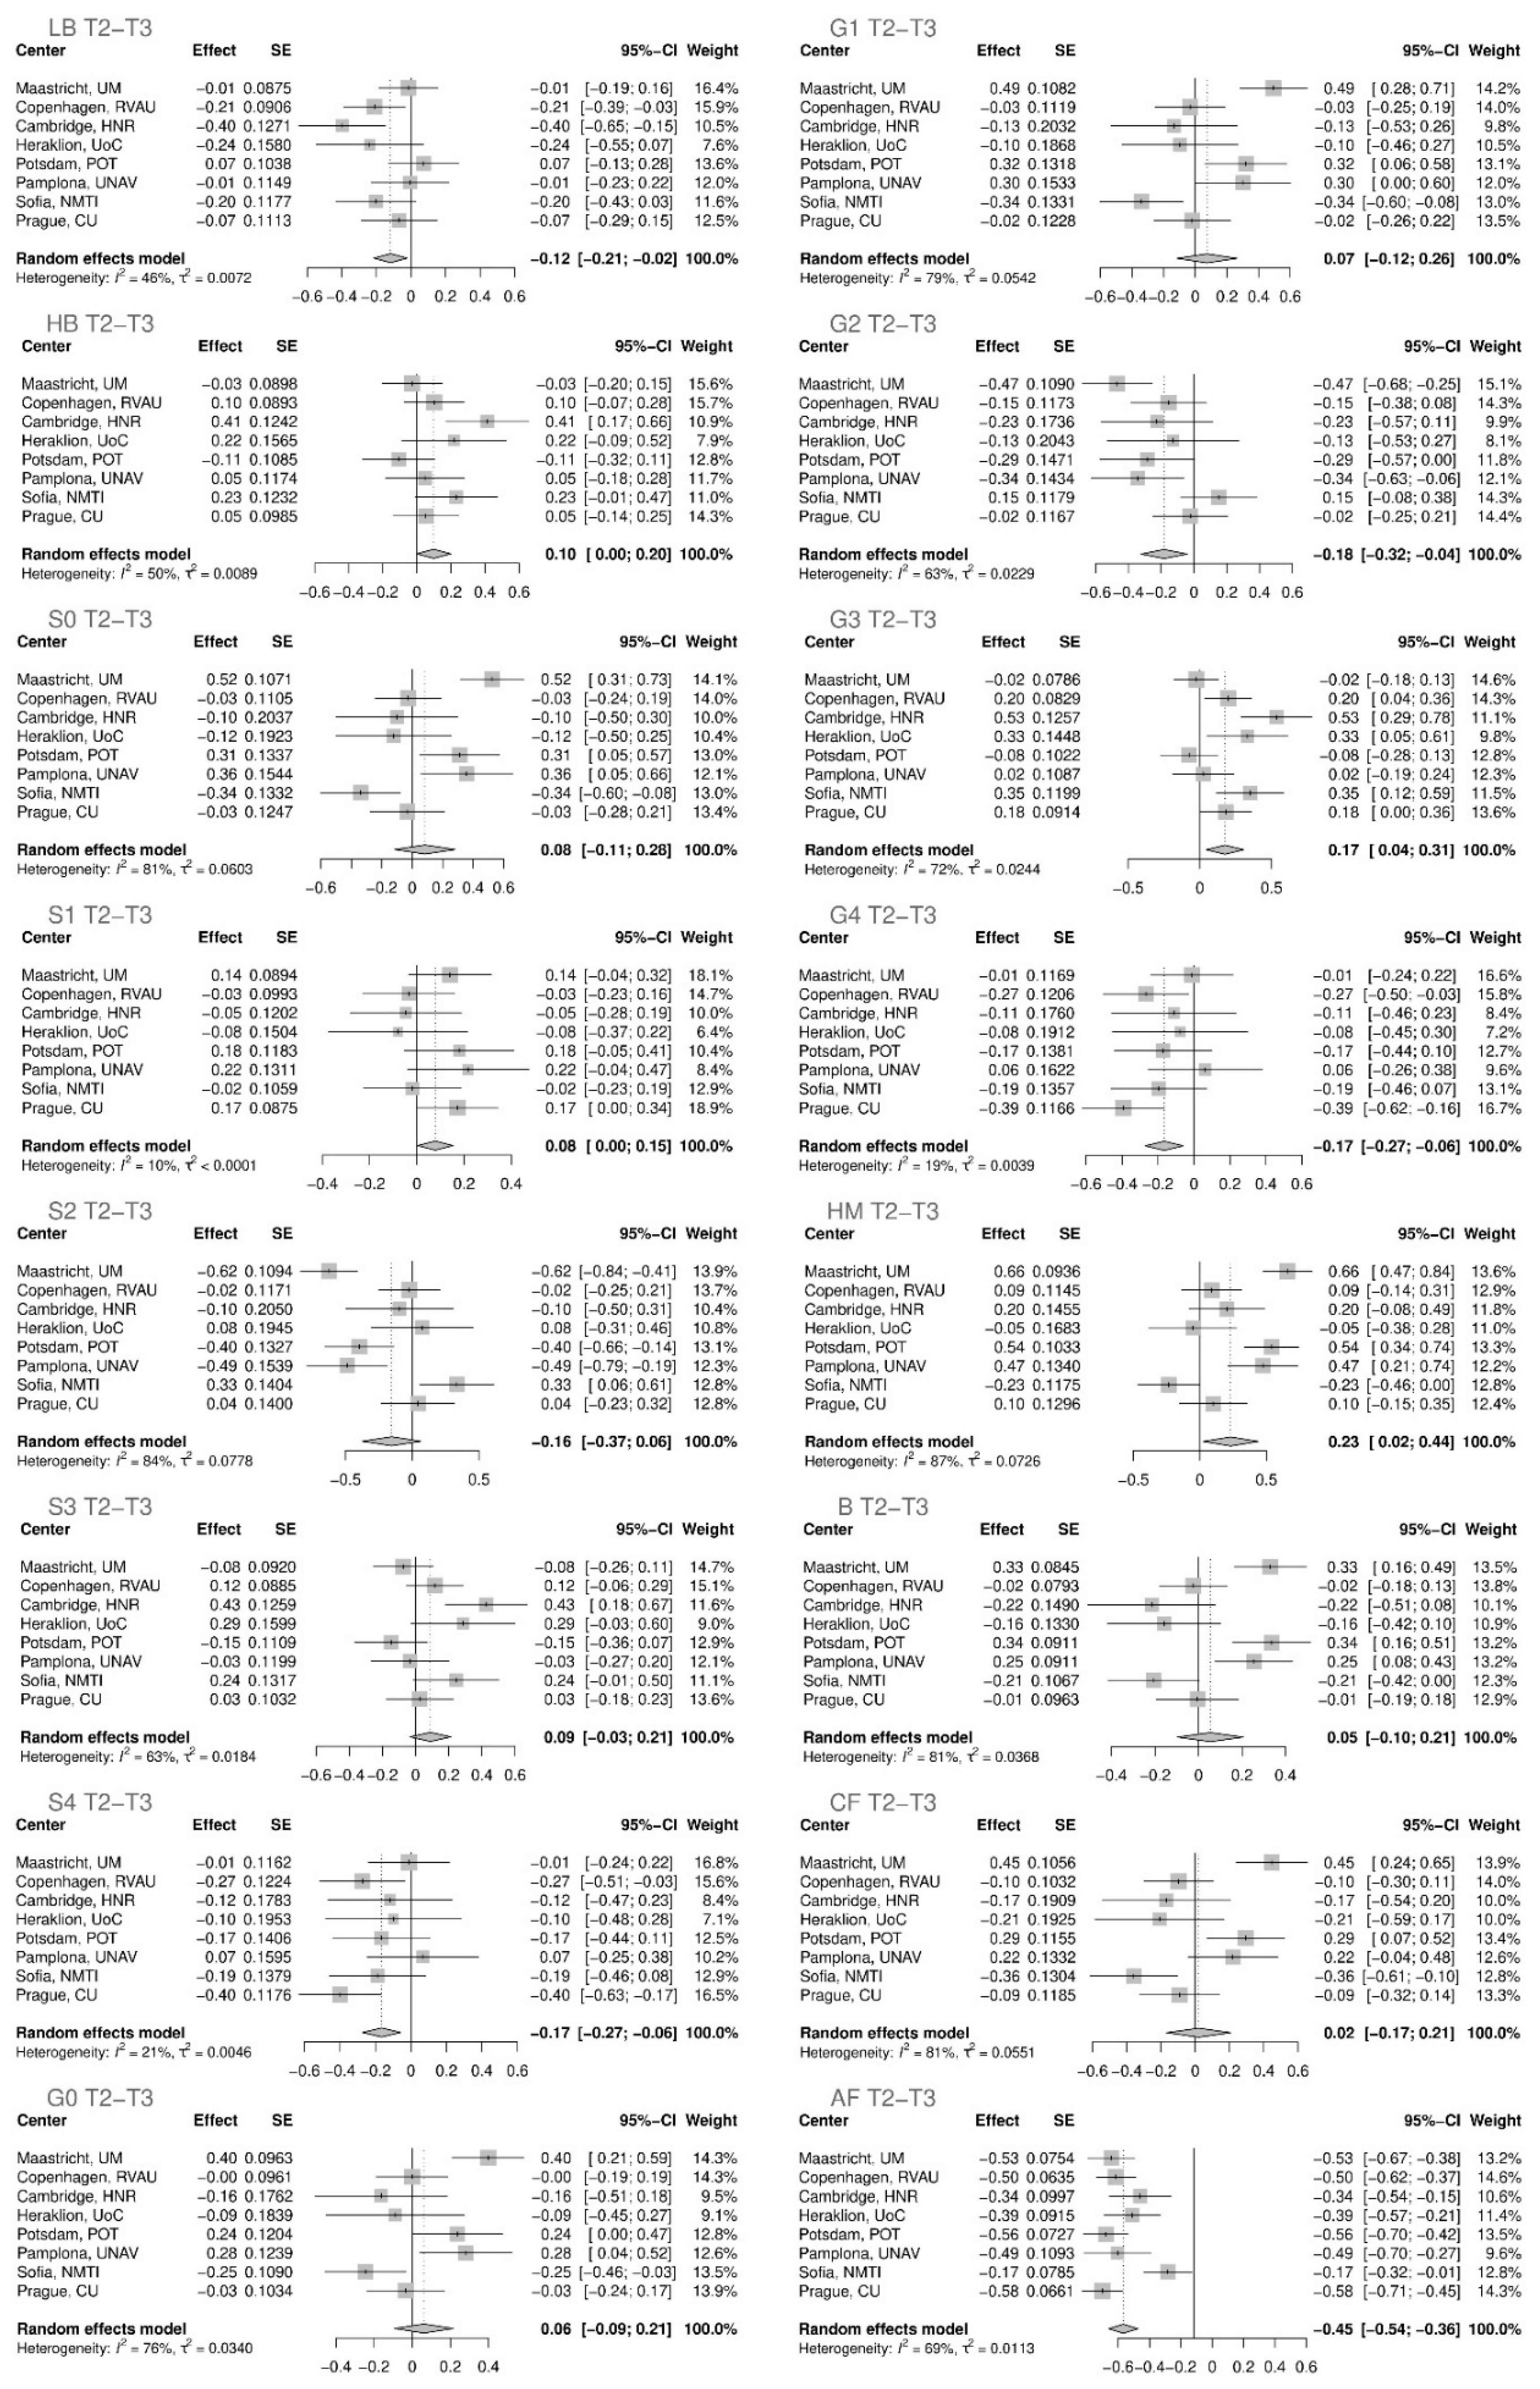
| T2–T3 | ||||
|---|---|---|---|---|
| Glycan | Effect | Standard Error | p Value | Adjusted p Value |
| AF total | −0.45084 | 0.04737 | 1.79 × 10⁻²¹ | 1.905 × 10⁻²⁰ |
| G4 total | −0.16539 | 0.05396 | 0.00218 | 0.00580 |
| S4 total | −0.16587 | 0.05526 | 0.00269 | 0.00661 |
| G3 total | 0.17495 | 0.06677 | 0.00878 | 0.01873 |
| G2 total | −0.18253 | 0.07246 | 0.01176 | 0.02353 |
| LB total | −0.11801 | 0.04941 | 0.01693 | 0.03186 |
| HM total | 0.23105 | 0.10521 | 0.02809 | 0.04994 |
| S1 total | 0.07768 | 0.03809 | 0.04144 | 0.06630 |
| HB total | 0.09861 | 0.05152 | 0.05560 | 0.08472 |
| S3 total | 0.08903 | 0.06291 | 0.15702 | 0.21847 |
| S2 total | −0.15549 | 0.11186 | 0.16449 | 0.21932 |
| S0 total | 0.08276 | 0.10077 | 0.41152 | 0.50649 |
| G1 total | 0.07344 | 0.09667 | 0.44741 | 0.51133 |
| G0 total | 0.06073 | 0.07868 | 0.44021 | 0.51133 |
| B total | 0.05390 | 0.07715 | 0.48477 | 0.53492 |
| CF total | 0.01978 | 0.09589 | 0.83656 | 0.83656 |
Publisher’s Note: MDPI stays neutral with regard to jurisdictional claims in published maps and institutional affiliations. |
© 2022 by the authors. Licensee MDPI, Basel, Switzerland. This article is an open access article distributed under the terms and conditions of the Creative Commons Attribution (CC BY) license (https://creativecommons.org/licenses/by/4.0/).
Share and Cite
Deriš, H.; Tominac, P.; Vučković, F.; Astrup, A.; Blaak, E.E.; Lauc, G.; Gudelj, I. Susceptibility of Human Plasma N-glycome to Low-Calorie and Different Weight-Maintenance Diets. Int. J. Mol. Sci. 2022, 23, 15772. https://doi.org/10.3390/ijms232415772
Deriš H, Tominac P, Vučković F, Astrup A, Blaak EE, Lauc G, Gudelj I. Susceptibility of Human Plasma N-glycome to Low-Calorie and Different Weight-Maintenance Diets. International Journal of Molecular Sciences. 2022; 23(24):15772. https://doi.org/10.3390/ijms232415772
Chicago/Turabian StyleDeriš, Helena, Petra Tominac, Frano Vučković, Arne Astrup, Ellen E. Blaak, Gordan Lauc, and Ivan Gudelj. 2022. "Susceptibility of Human Plasma N-glycome to Low-Calorie and Different Weight-Maintenance Diets" International Journal of Molecular Sciences 23, no. 24: 15772. https://doi.org/10.3390/ijms232415772
APA StyleDeriš, H., Tominac, P., Vučković, F., Astrup, A., Blaak, E. E., Lauc, G., & Gudelj, I. (2022). Susceptibility of Human Plasma N-glycome to Low-Calorie and Different Weight-Maintenance Diets. International Journal of Molecular Sciences, 23(24), 15772. https://doi.org/10.3390/ijms232415772