Article

Degradation of the Selected Antibiotic in an Aqueous Solution by the Fenton Process: Kinetics, Products and Ecotoxicity

Department of General and Analytical Chemistry, Medical University of Silesia, Jagiellońska 4, 41-200 Sosnowiec, Poland
*
Author to whom correspondence should be addressed.
Int. J. Mol. Sci. 2022, 23(24), 15676; https://doi.org/10.3390/ijms232415676
Submission received: 14 November 2022 / Revised: 29 November 2022 / Accepted: 7 December 2022 / Published: 10 December 2022
(This article belongs to the Section Molecular Toxicology)

Abstract

:
Sulfonamides used in veterinary medicine can be degraded via the Fenton processes. In the premise, the process should also remove the antimicrobial activity of wastewater containing antibiotics. The kinetics of sulfathiazole degradation and identification of the degradation products were investigated in the experiments. In addition, their toxicity against Vibrio fischeri, the MARA® assay, and unselected microorganisms from a wastewater treatment plant and the river was evaluated. It was found that in the Fenton process, the sulfathiazole degradation was described by the following kinetic equation: r0 = k CSTZ−1 or 0 CFe(II)3 CH2O20 or 1 CTOC−2, where r0 is the initial reaction rate, k is the reaction rate constant, C is the concentration of sulfathiazole, Fe(II) ions, hydrogen peroxide and total organic carbon, respectively. The reaction efficiency and the useful pH range (up to pH 5) could be increased by UVa irradiation of the reaction mixture. Eighteen organic degradation products of sulfathiazole were detected and identified, and a possible degradation mechanism was proposed. An increase in the H2O2 dose, to obtain a high degree of mineralization of sulfonamide, resulted in an increase in the ecotoxicity of the post-reaction mixture.

Graphical Abstract

1. Introduction

Sulfonamides (SNs), sulfanilamide derivatives, belong to the most commonly used antibiotics in industrial animal husbandry [1,2,3]. They are chemically stable and are not prone to abiotic hydrolysis, except sulfacetamide [4]. Therefore, when SN residues enter unadopted ecosystems, they can remain there for a long time [2]. Trace amounts of SNs have been detected even in water samples taken from the Arctic regions [5].
Even when in low concentrations (below 0.14 µg/kg of soil), SNs are known to disturb the microbial community in the micro-biosphere [6]. This phenomenon can contribute to the development of antibiotic-resistant microorganisms and, potentially, to their transfer and spread to bacterial pathogens [2,3,7,8].
Advanced oxidation processes (AOPs) are regarded as effective methods of removing pharmaceutical residues and, simultaneously, hazardous biological materials (including viruses) from wastewater [9,10,11,12,13]. However, a high degree of complexity and a relatively high cost are the major barriers preventing their widespread application [14,15].
Many researchers have recognized Fenton and photo-Fenton reactions as one of the most cost-effective AOPs [16,17,18,19,20,21]. Hydroxyl radicals (HO•), being extremely reactive species with a high oxidation potential (E°) of 2.80 V, are generated in these processes [14,15,22,23,24,25,26,27] (Equation (1)):
Fe2+ + H2O2 → Fe3+ + HO• + OH
The supply of HO• radicals can be improved by sunlight irradiation of the reactant solutions [28,29] (Equations (2) and (3)):
Fe3+ + H2O + hν → Fe2+ + HO• + H+
H2O2 + hν → HO• + H+
During Fenton and photo-Fenton reactions, HO• radicals can react non-selectively with organic compounds [24,26,27,30,31,32,33] (Equations (4)–(6)):
HO• + RH → R• + H2O
HO• + R• → ROH
HO• + RH → RHOH
Another known mechanism is the transfer of an electron from an organic compound to the HO• radical, resulting in the formation of a radical cation (RH•+) (Equation (7)):
HO• + RH → RH•+ + OH
The resulting organic radicals and organic cation radicals can undergo subsequent reactions (Equation (8)) leading to their complete mineralization:
R H 2 O 2 ;   HO ;   O 2 CO 2 + H 2 O + inorganic   ions
Reactions in which Fe2+ ions are restored can take place simultaneously (Equations (9)–(12)):
Fe3+ + H2O2 ↔ [Fe(HO2)]2+ + H+
[Fe(HO2)]2+ + H2O2 → Fe2+ + HO2
Fe3+ + HO2• → Fe2+ + O2 + H+
Fe3+ + R• → Fe2+ + R+
The formed HO• radical can also participate in reactions which are unfavorable when considering the efficiency of organic compound degradation, e.g., (Equations (13) and (14)) [27]:
Fe2+ + HO• → Fe3+ + OH
H2O2 + HO• → H2O + HO2
The anions (Xn−) coordinated with Fe2+ ions can actively participate in reactions with HO• [29] (Equation (15)):
HO• + Xn− → X•(n−1)− + OH
These anions may either act as the process activators or inhibitors, depending on the activity of the X•(n−1)− radical [29,34,35,36].
The pH value is one of the most important parameters influencing the rate of the Fenton process conducted under homogeneous conditions. The optimal pH falls within the range between 2 and 4 [12,14,15,24,25,37,38,39,40,41,42]. An increase in pH causes the hydrolysis of Fe2+ ions, their binding in form of stable complex compounds and increases their oxidation rate in parallel reactions (e.g., with O2 dissolved) without the generation of HO• radicals [33]. However, the Fenton process can also be operated at pH > 4, predominantly in the presence of heterogeneous catalysts [15,22,25,38,43]. Some authors have argued that the photo-Fenton process [23,44] or the electron transfer process involving organic ligands and reactive complexes with Fe(IV) [27,45] can effectively occur at a higher pH value.
Other important parameters affecting the efficiency of the Fenton reaction are the reactant concentrations, reaction time, type of oxidized compounds as well as the qualitative composition and charge of pollutants. Even minor deviations from the optimal composition of the reagent concentration may significantly decrease the efficiency of the process [30,44].
Another problem during Fenton and photo-Fenton processes is that a high degree of mineralization of organic pollutants requires the use of high doses of reactants. As a result, significant amounts of solid waste will be generated which can be highly ecotoxic. This was confirmed in experiments with Staphylococcus aureus, Escherichia coli, Vibrio fischeri and activated sludge [46,47,48,49].
Therefore, if the wastewater treatment process increases the wastewater toxicity, this process should be considered inappropriate and inadequate.
The literature offers abundant information on the application of Fenton and photo-Fenton processes for the degradation of SNs. The researchers have mostly reported reactions carried out in the presence of FeSO4 that led to almost 100% drug degradation [15,31,50]. Intermediates most frequently described during these processes include compounds formed as a result of amide hydrolysis and SN derivatives with a hydroxyl group attached to a benzene or heterocyclic ring [24,26,43,51].
The aim of the present study was (1) to determine the empirical kinetic equation of antibiotic degradation in the presence of FeSO4/H2O2 mixture, (2) to compare the efficiency of Fenton and photo-Fenton processes, (3) to identify the degradation products (DPs) of the selected antibiotic by Fenton reagents and (4) to determine the cumulative acute and chronic toxicity of DPs using the commercial tests and microorganisms from the river and effluent (treatment wastewater) from a biological wastewater treatment plant (WWTP). Sulfathiazole (STZ) was chosen as the model antibiotic in the experiments. Explanation of these assumptions is essential from the point of view of Fenton process optimization and estimation of the potential environmental impact of DPs. In our opinion, the experimentally determined kinetic equation may be more universal rather than detailed optimization studies, e.g., due to the variable composition of wastewater.

2. Results and Discussion

2.1. Kinetics of STZ Degradation and H2O2 Decomposition

Dynamics of STZ (0.1 mmol/L) concentration changes in the presence of FeSO4 (0.15 mmol/L) and/or H2O2 (2.0 mmol/L) at pH 3.35 ± 0.05 are shown in Figure 1a. Dynamics of H2O2 concentration change in the mixture with STZ and FeSO4 were inserted in the same figure.
In the presence of FeSO4 alone or H2O2 alone and in the absence of light, no changes were observed in the STZ concentration. On the other hand, in a mixture of both reactants, the STZ concentration decreased, indicating the degradation process. For this process, the function of 1/C = f(t) was found to be a straight line with a high correlation coefficient (R2 > 0.99) (Figure 1b). This result indicates that the changes in STZ concentration during the Fenton process followed second-order kinetics. Similarly, second-order kinetics for the degradation of organic compounds during the Fenton process have also been described by other authors [41,45,52,53,54].
Initially, the H2O2 concentration decreased rapidly when a significant excess of H2O2 with respect to STZ was used in the experiment. Then, the H2O2 decomposition was inhibited and approximately 40% of this reactant still remained in the mixture after the reaction. The function of Ln(C0/C) = f(t) for H2O2 had a linear trend within the first 2 min (Figure 1c). This result indicates that the H2O2 decomposition followed pseudo-first-order kinetics within this time range. Inhibition of H2O2 conversion after a longer reaction time may be associated with the oxidation of Fe2+ to Fe3+.

2.2. Effect of the Initial STZ Concentration

The effect of the initial STZ concentration on the dynamics, efficiency and kinetics of degradation is shown in Figure S1 (Supplementary Materials). The kinetic data were determined experimentally and are shown in Table S1, Supplementary Materials.
At the lowest STZ concentration (0.05 and 0.1 mmol/L) and after 10 min of the Fenton reaction, its degradation degree was > 90%. The increase in the initial STZ concentration to 1.0 mmol/L led to a lower degree of degradation. The prolongation of the reaction time to 30 min caused an increase in STZ degradation, approximately to 20% (Figure S1b, Supplementary Materials).
The investigated process showed that an increase in the initial STZ concentration to 0.2 mmol/L caused a proportional decrease in its degradation rate. A further increase in the sulfa-drug concentration (up to 0.2 mmol/L) did not have a significant impact on the reaction rate. Most likely, when the concentration of STZ is higher than that of FeSO4, with the excess of H2O2, the degradation rate is limited by Fe2+ ions only.
Based on the known mechanism of the Fenton reaction, it was expected that the degradation rate would increase as the STZ concentration increased [53]. However, the opposite effect was observed. Other researchers have also described a reduction in the degradation rate of organic compounds linked to an increase in their concentration in the Fenton process [40]. This phenomenon may be associated with a relatively stable binding of Fe2+ ions to STZ or its DPs.
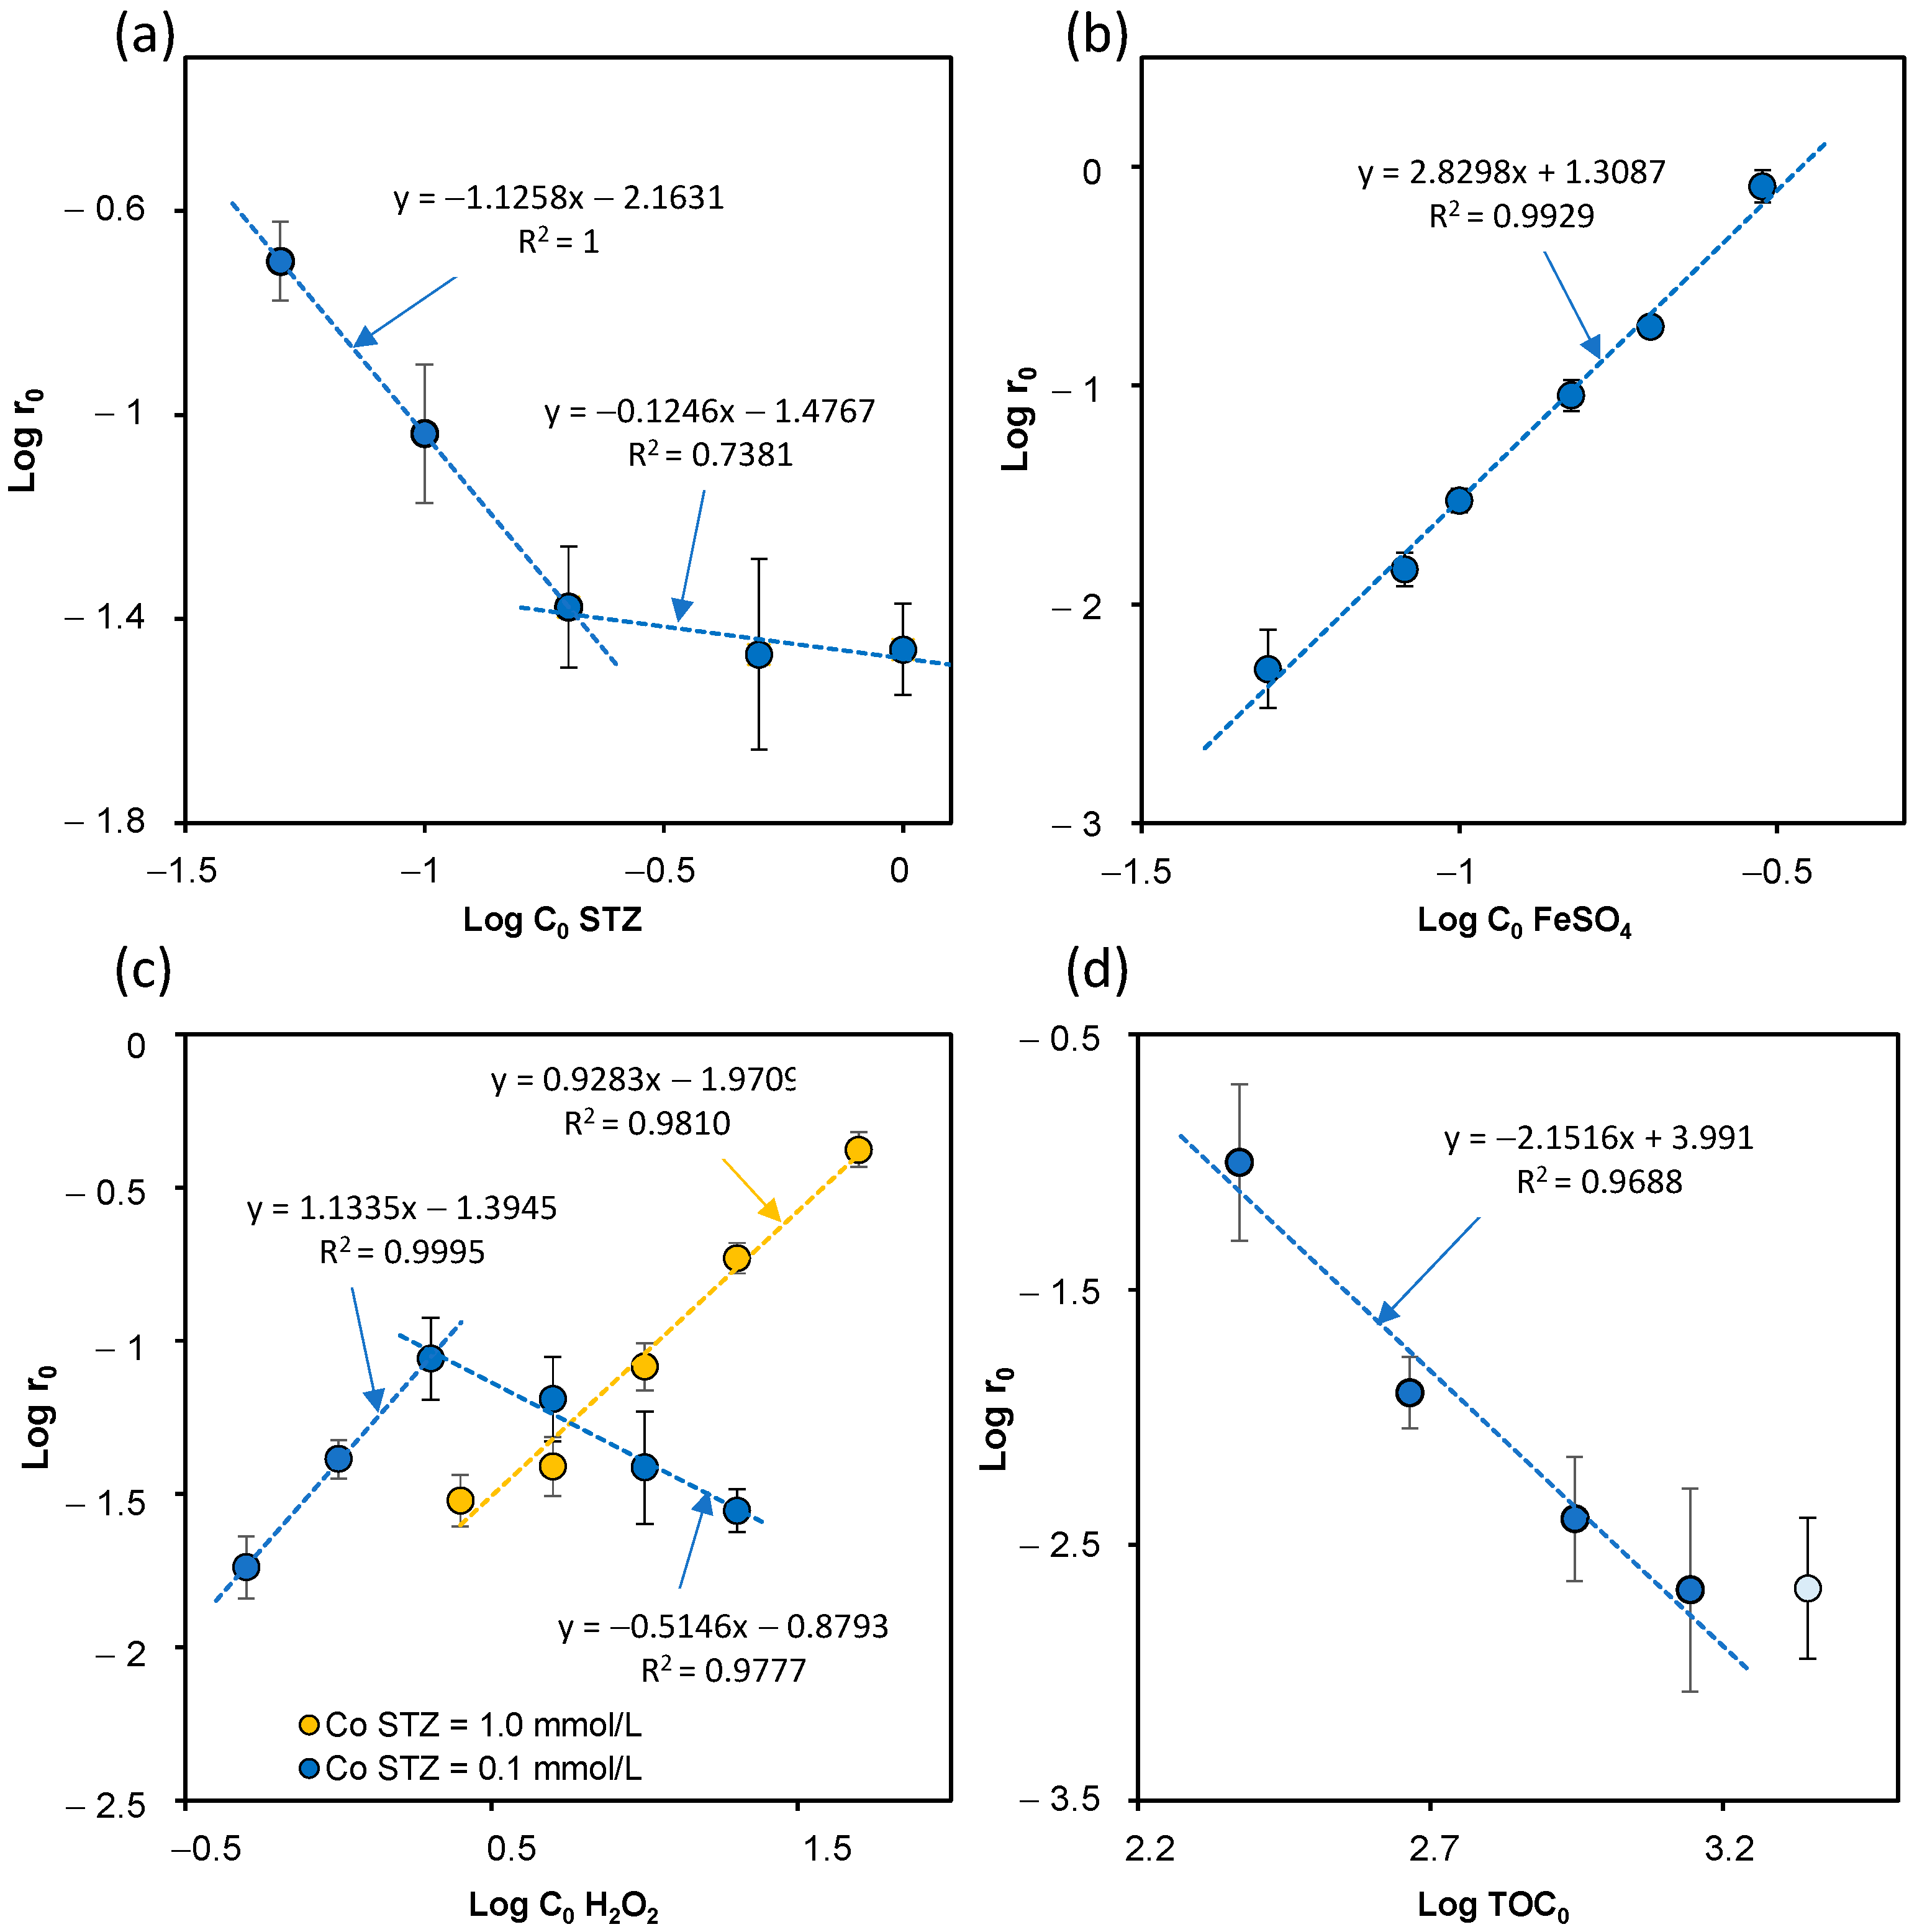
To determine the reaction order with respect to the initial STZ concentration, a Log r0 vs. Log C0 plot was constructed for the experimental data (Figure 2a).
It was found that when C0 STZ < C0 FeSO4, a linear function with a slope of approximately −1 was obtained. When C0 STZ > C0 FeSO4, the reaction order with respect to STZ was close to 0.
Fe3+-containing compounds are the most often detected among DPs of Fenton reaction (Equation (8)). These compounds can affect the degradation of SNs in an acidic environment, in the presence of light, microwaves or dissolved oxygen [55]. Additionally, H2O2 itself can initiate the degradation of SNs and other antibiotics during UV irradiation [29,56]. Our results indicate that under the conditions used, in the absence of light and microwaves, the STZ degradation in the presence of H2O2 was initiated by Fe2+-compounds only. It was not excluded that, in the presence of excess H2O2, Fe3+ ions can be reduced to restore Fe2+ ions (Equations (9)–(12)). However, the experimental results indicate that these reactions did not have a significant effect on the rate of STZ degradation.

2.3. Effect of the Initial FeSO4 Concentration

The results showing the effect of the initial FeSO4 concentration (from 0.05 to 0.3 mmol/L) on the kinetics and degradation efficiency of STZ (0.1 mmol/L) in the presence of H2O2 (2.0 mmol/L) are summarized in Figure S3 and Table S1 (Supplementary Materials). Under the investigated conditions (with a large excess of H2O2), the increase in FeSO4 concentration resulted in a systematic increase in the rate of STZ degradation.
After only 10 min of reaction, it was possible to achieve almost 100% degradation of STZ (Figure S2b), but a minimum of 50% excess of FeSO4 with respect to STZ was required in the experiment. However, the prolongation of reaction time to 30 min increased the degree of STZ degradation only by a maximum of 10%. This indicates that organic DPs may effectively compete with STZ molecules and influence the reaction course.
The described results clearly suggest that the application of a large excess of Fe2+ salts can lead to complete drug degradation after a short reaction time. However, this is at the expense of substantial amounts of waste containing Fe3+- compounds (mainly hydrated Fe(OH)3) formed after the reaction. Strong sorption properties of the hydroxide can improve the total treatment efficiency; nevertheless, with the impurities absorbed, a troublesome and ecotoxic waste is generated.
Figure 2b shows the plot of Log r0 and Log C0Fe2+ function for the results obtained. In the studied range of FeSO4 concentration, the function plot was a straight line with a slope of approximately 3. This result indicates that under the experimental conditions, the initial rate of STZ degradation with respect to the concentration of Fe2+ ions could be described by a third-degree equation. However, only some authors have reported such an unusually high order value of the Fenton reaction with respect to the concentration of Fe2+ ions [52].
The above results show a high influence of the initial FeSO4 concentration on the rate and efficiency of the degradation of organic compounds. They also explain the strong inhibition of the Fenton reaction observed when the concentration of Fe2+ ions was decreased.

2.4. Effect of the Initial H2O2 Concentration

The effect of the initial H2O2 concentration on the kinetics and efficiency of STZ degradation was studied at two initial STZ concentrations of 0.1 and 1.0 mmol/L. (Figures S3 and S4, and Table S1, Supplementary Materials).
At a lower STZ concentration (0.1 mmol/L), an increase in H2O2 concentration initially resulted in an increase, and subsequently in a reduction in the degree of drug degradation (Figure S3b, Supplementary Materials). An optimal H2O2 concentration was 2.0 mmol/L; that was when a 20-fold excess of H2O2 with respect to STZ was used in the experiment (Figure S5, Supplementary Materials). After 30 min, the reaction mixture still contained approximately 10% of STZ and 38% (more than 0.76 mmol/L) of undecomposed H2O2. Most authors have pointed to 50-fold excess of H2O2 as an optimal to achieve the complete degradation in the Fenton reaction [53]. However, in our experiment with the solution containing a 100-fold excess of H2O2, 80% of this reactant was not converted and remained after 30 min of reaction. Additionally, the efficiency of STZ degradation in a 100-fold excess of H2O2 was much lower. One of the causes of this phenomenon may be a competitive reaction between HO• radicals and H2O2 [29] (Equation (14)).
In solutions with a higher initial STZ concentration (1.0 mmol/L), the increase in the H2O2 concentration resulted exclusively in an increase in the degradation rate (Table S1, Figure S5, Supplementary Materials), an asymptotic increase in the degree of drug degradation, but a decrease in H2O2 conversion (Figure S4b, Supplementary Materials). Similarly, as observed for the lower STZ concentration, the increase in H2O2 dose resulted in a lower conversion of this reactant. When a 50-fold excess of H2O2 to STZ was used, approximately 50% of unreacted H2O2 remained in the solution after 30 min of reaction. Details on H2O2 conversion are described in Section 2.8.
The plot of Log r0 STZ vs. Log C0 H2O2 functions for low and high concentration of STZ is presented in Figure 2c.
Based on the established equations it was found that when [STZ]0 = 0.1 mmol/L and [H2O2]0 ≤ 2 mmol/L and when [STZ]0 = 1.0 mmol/L in the entire range of H2O2 concentration, the initial rate of STZ degradation followed first-order kinetics with respect to H2O2. When [H2O2]0 > 2 mmol/L, its influence on STZ degradation could be determined at the order of approximately −0.5. Many researchers have used the H2O2:Fe2+ molar ratio to characterize the degradation of the reactant during the Fenton process [23,37]. When the molar ratio of H2O2 varied from 1:1 to 50:1, the degradation rate was proportional to the H2O concentration. In turn, when the excess of H2O2 to Fe2+ was >500, the reaction order was (−1) [27]. According to Batista and Nogueira [31], the adverse effect of a significant excess of H2O2 is also true for the photo-Fenton process.

2.5. Effect of the Initial TOC Value

Livestock wastewater mainly contains large amounts of partially decomposed organic matter. These substances react with HO• and iron compounds and may inhibit the Fenton process [12,15,18,23,37,39,57]. Therefore, the dynamics of STZ degradation during the Fenton process were assessed in peptone solutions, simulating wastewater. The organic matter content in these solutions was determined as the TOC value and the results are shown in Figure S6 and Table S1, Supplementary Materials.
As expected, the increase in the TOC value led to a decrease in the efficiency of STZ degradation. However, even for the highest TOC content (approximately 2200 mg C/L) the degree of STZ degradation was almost 50% (Figure S6b, Supplementary Materials). It was observed that the prolonged reaction time of 10 to 30 min did not significantly improve the efficiency of STZ degradation. The TOC value can also be included in the kinetic equation of STZ degradation. Under the experimental conditions of Fenton process, the reaction order was approximately (−2) (Figure 2d).
It was also confirmed that the removal of TOC from the solution was simultaneous with the STZ degradation during the Fenton process. However, the process efficiency at [TOC]0 > 100 mg C/L was lower than that caused by the coagulation and sedimentation of iron compounds (Figure S7, Supplementary Materials).

2.6. Effect of pH

As has already been pointed above, in the homogeneous Fenton process carried out in the presence of Fe2+ salts, the optimal pH ranged from 2 to 4. At the higher pH of the solution, Fe2+ ions underwent gradual hydrolysis. This result indicates the necessity of acidifying the treated wastewater before adding the Fenton reagents. On the other hand, there are opinions that organic ligands forming coordination compounds with iron ions may also be oxidized at a pH close to neutral [27,45]. SNs form coordination compounds with Fe2+ ions [58]. Therefore, it was assumed that the STZ degradation would also be possible at pH values > 4.
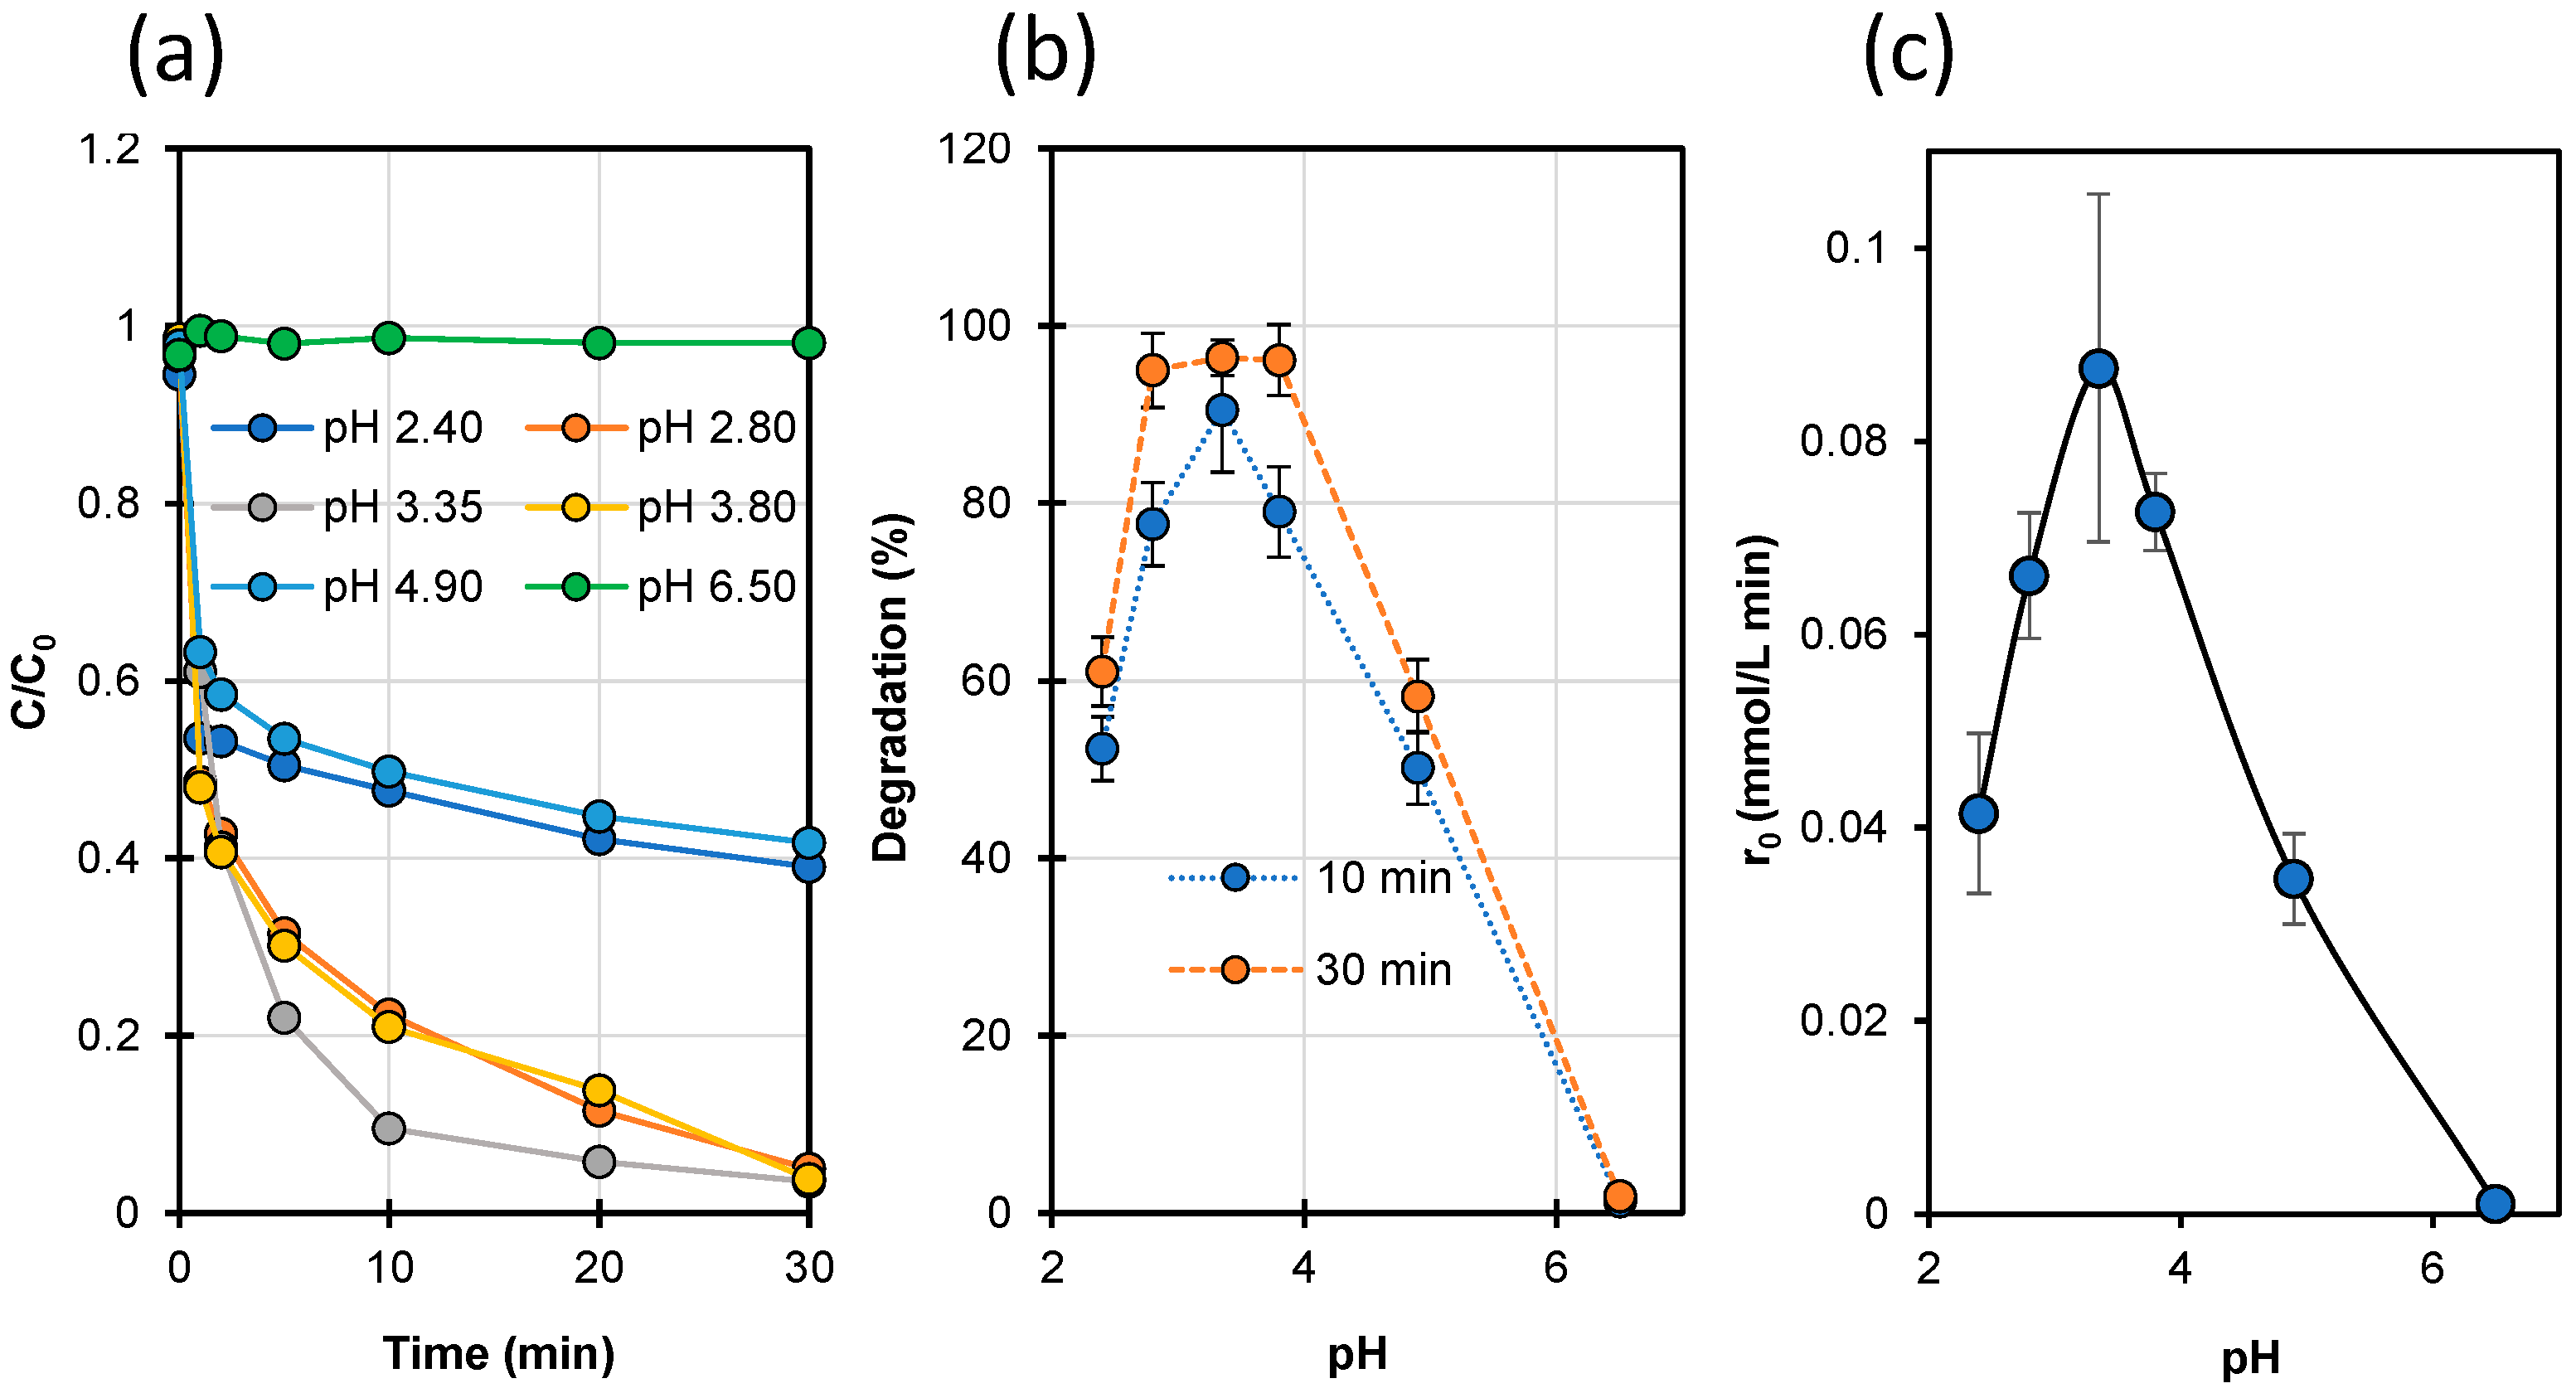
The effect of pH on the efficiency of STZ degradation in the Fenton process is illustrated with the data in Table S1, Supplementary Materials and in Figure 3.
It was confirmed that the homogeneous Fenton process was more effective with a pH ranging from 3 to 4. Unfortunately, the STZ degradation was completely inhibited in solutions at pH 6.5 (Figure 3). This may indicate that at a higher pH of solution, complex compounds of Fe2+ ions with STZ do not catalyze the conversion of H2O2 to HO• radicals.

2.7. Photo-Fenton Process

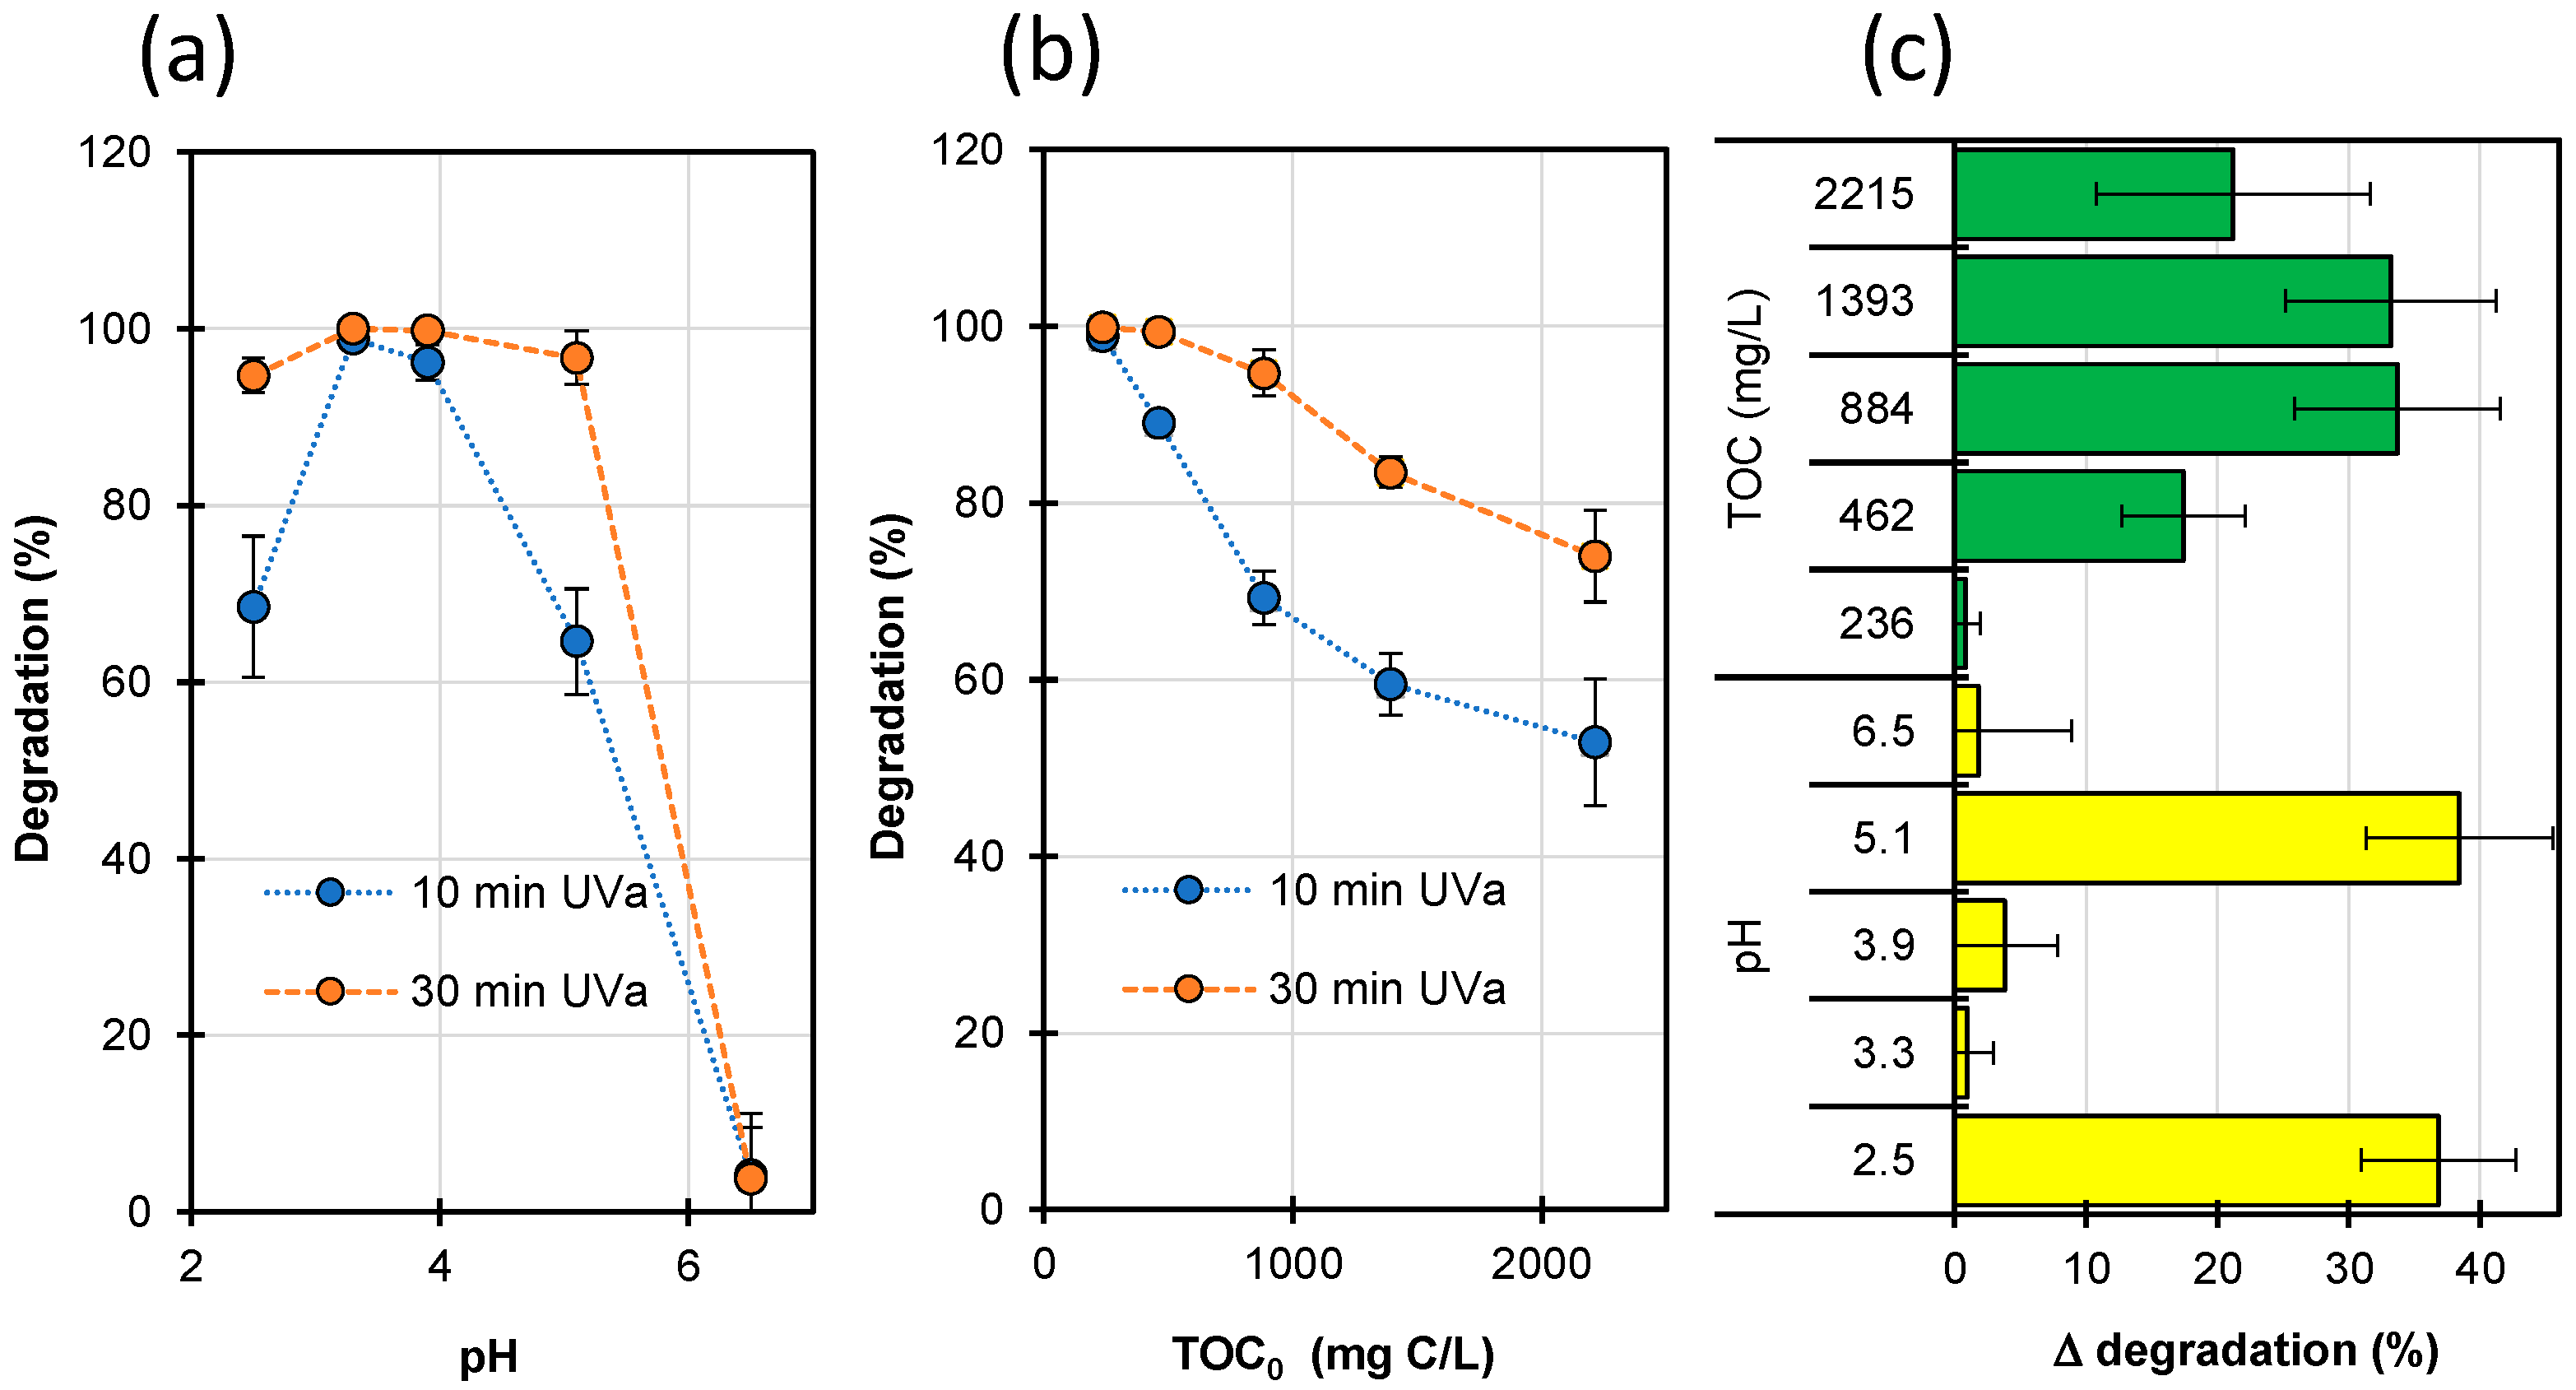
The efficiency of the Fenton process can be increased by irradiating the reaction mixture with UV light (a photo-Fenton process) [23,44]. Therefore, we conducted a series of additional experiments in which the Fenton process was assisted by UVa irradiation. The effect of pH (Figure 4a) and TOC content (Figure 4b) on the efficiency of this process was also studied. Figure 4c shows a comparison of the efficiency for the photo-Fenton and Fenton processes presented as a difference in the degradation degree of after 30 min.
The STZ degradation between 2 and 30 min at pH 2.5 and 5.1 followed zero-order kinetics (Figure S8, Supplementary Materials). This result indicates that under the experimental conditions, the STZ degradation process was light-limited. Moreover, the prolongation of the reaction time resulted in a considerable improvement in the efficiency of the photo-Fenton process (Figure 4a). The effect may be due to the reactions of photoactive Fe3+ complexes in the presence of the UVa irradiation [31,33,45,59]. As a result, additional amounts of HO• radicals may be generated, or a charge-transfer process and an oxidation of organic compounds may occur (Equations (16) and (17)):
Fe(HO)2+ + hν → Fe2+ + HO•
Fe(R)2+ + hν → Fe2+ + R•
If aliphatic organic acids are present in the solution, they can form complexes with iron ions and H2O2. In the presence of light, these compounds may also undergo decarboxylation and CO2 may be released [60,61]. In the absence of light, the process efficiency depends mainly on Fe2+ concentration. As already mentioned (Section 2.1), oxidation of these ions to Fe3+ completely inhibits STZ degradation in the Fenton process.
Use of UVa irradiation allows for a significant increase in photo-Fenton process efficiency in solutions characterized by high TOC content, even by 35% (Figure 4b,c and Figure S9). The degradation efficiency can be even higher when the irradiation time is prolonged. Unfortunately, the cost of wastewater treatment using the photo-Fenton process can be much higher than with application of the Fenton process [14].

2.8. Antimicrobial Activity and Ecotoxicity Evaluation

The potential environmental impact of effluent is a key parameter in assessing the efficiency of processes used for wastewater treatment. Liquid waste generated during Fenton and photo-Fenton reactions, which are used to remove antibiotics from wastewater, can contain many substances potentially dangerous to organisms inhabiting a given environment. These compounds could be toxic not only to S. aureus and E. coli, but also to Artemia salina, Vibrio phosphoreum, Dafnia magna and V. fischeri [47,48,49,62,63,64,65].
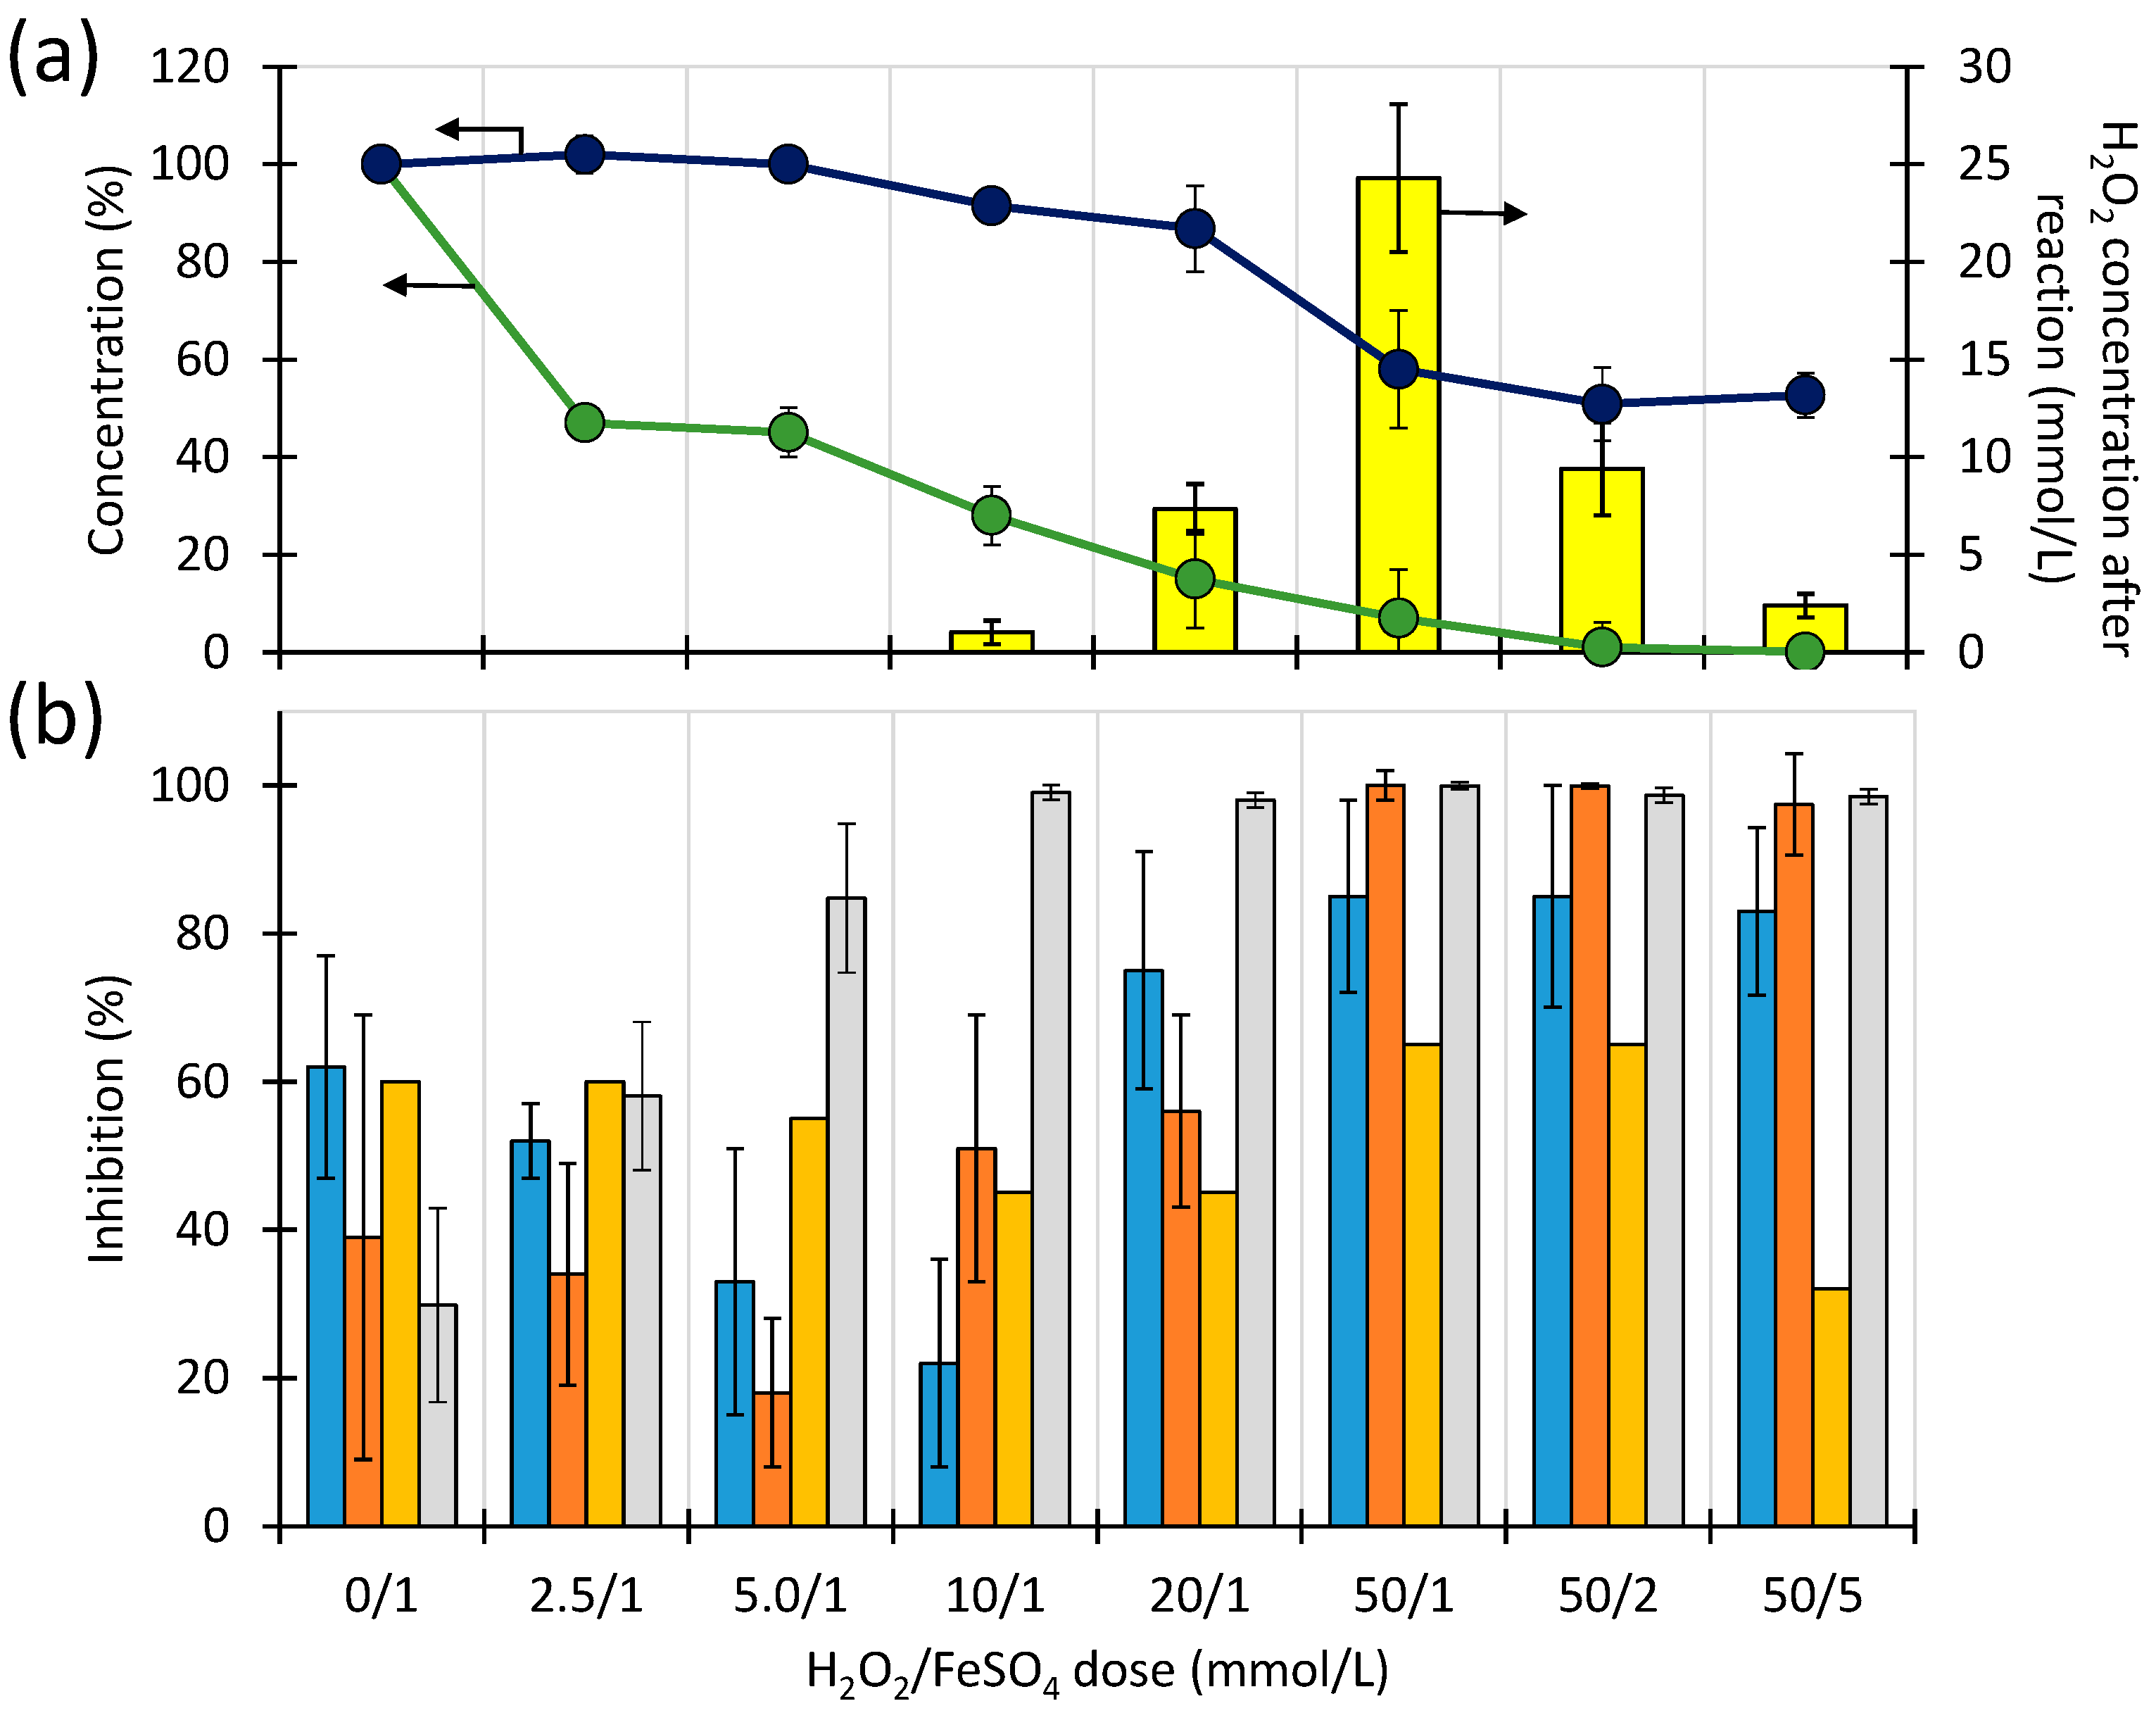
The effect of DPs of STZ (C0 = 1.0 mmol/L) on the inhibition of V. fischeri (Microtox® assay), B. diminuta, D. acidovorans and P. aurantiaca (MARA® assay), unselected microorganisms from the Brynica River (Poland) and from the WWTP effluent is shown in Figure 5b.
The high initial STZ concentration used in the experiment resulted from a low sensitivity of the studied microorganisms to the antibiotic (Table S4, Supplementary Materials). The results were correlated with the relative concentration of STZ, TOC and with the concentration of H2O2 remaining in the solution after 30 min of the Fenton process.
Under the experimental conditions, the increase in H2O2 and FeSO4 dose caused a decrease in the STZ concentration (from 0 to 93%) in solutions after 30 min of the Fenton process. The TOC content decreased by a maximum of 50% indicating that DPs of STZ remained in the solution. Simultaneously, the H2O2 concentration in the post-reaction solutions increased with increasing the initial dose of this reactant. At a dose of 50 mmol/L, the degree of conversion of H2O2 was only about 50%. When the FeSO4 dose increased from 1 to 5 mmol/L, the degree of H2O2 conversion increased to 95% (Figure 5a).
In each of the experiments, the components of the post-reaction solutions were more toxic to V. fischeri than the initial STZ solution. The observed inhibition increased to 100% when the remaining H2O2 concentration increased to approximately 2.5 mmol/L. Therefore, we assume that the inhibitory effect was mainly due to unreacted H2O2. The toxic effect to river-derived or WWTP-derived microorganisms resulted, on one hand, from STZ itself and, on the other hand, from unreacted H2O2. As a consequence, the optimal dose range of H2O2 was between 5 and 10 mmol/L. Changes in STZ-sensitive microorganism inhibition (B. diminuta, D. acidovorans and P. aurantiaca) may be considered as indicators of changes in antibacterial activity resulting from the Fenton process. The reduced STZ concentration caused a decrease in the inhibitory effect against these strains of bacteria. Nevertheless, the unreacted H2O2 resulted in a toxic effect but weaker than the one discussed above. An increase in FeSO4 dose (at constant H2O2 concentration) decreased inhibition exclusively against B. diminuta, D. acidovorans and P. aurantiaca. The results discussed above indicate that once the Fenton process is applied for wastewater treatment, excess H2O2 should be avoided. In turn, a higher dose of iron salts will generate significantly higher amounts of waste, e.g., precipitates after neutralization of Fe compounds. Therefore, one main goal should be chosen either to achieve a high degree of mineralization of organic pollutants or to remove their potential ecotoxicity.

2.9. Identification of STZ Degradation Products

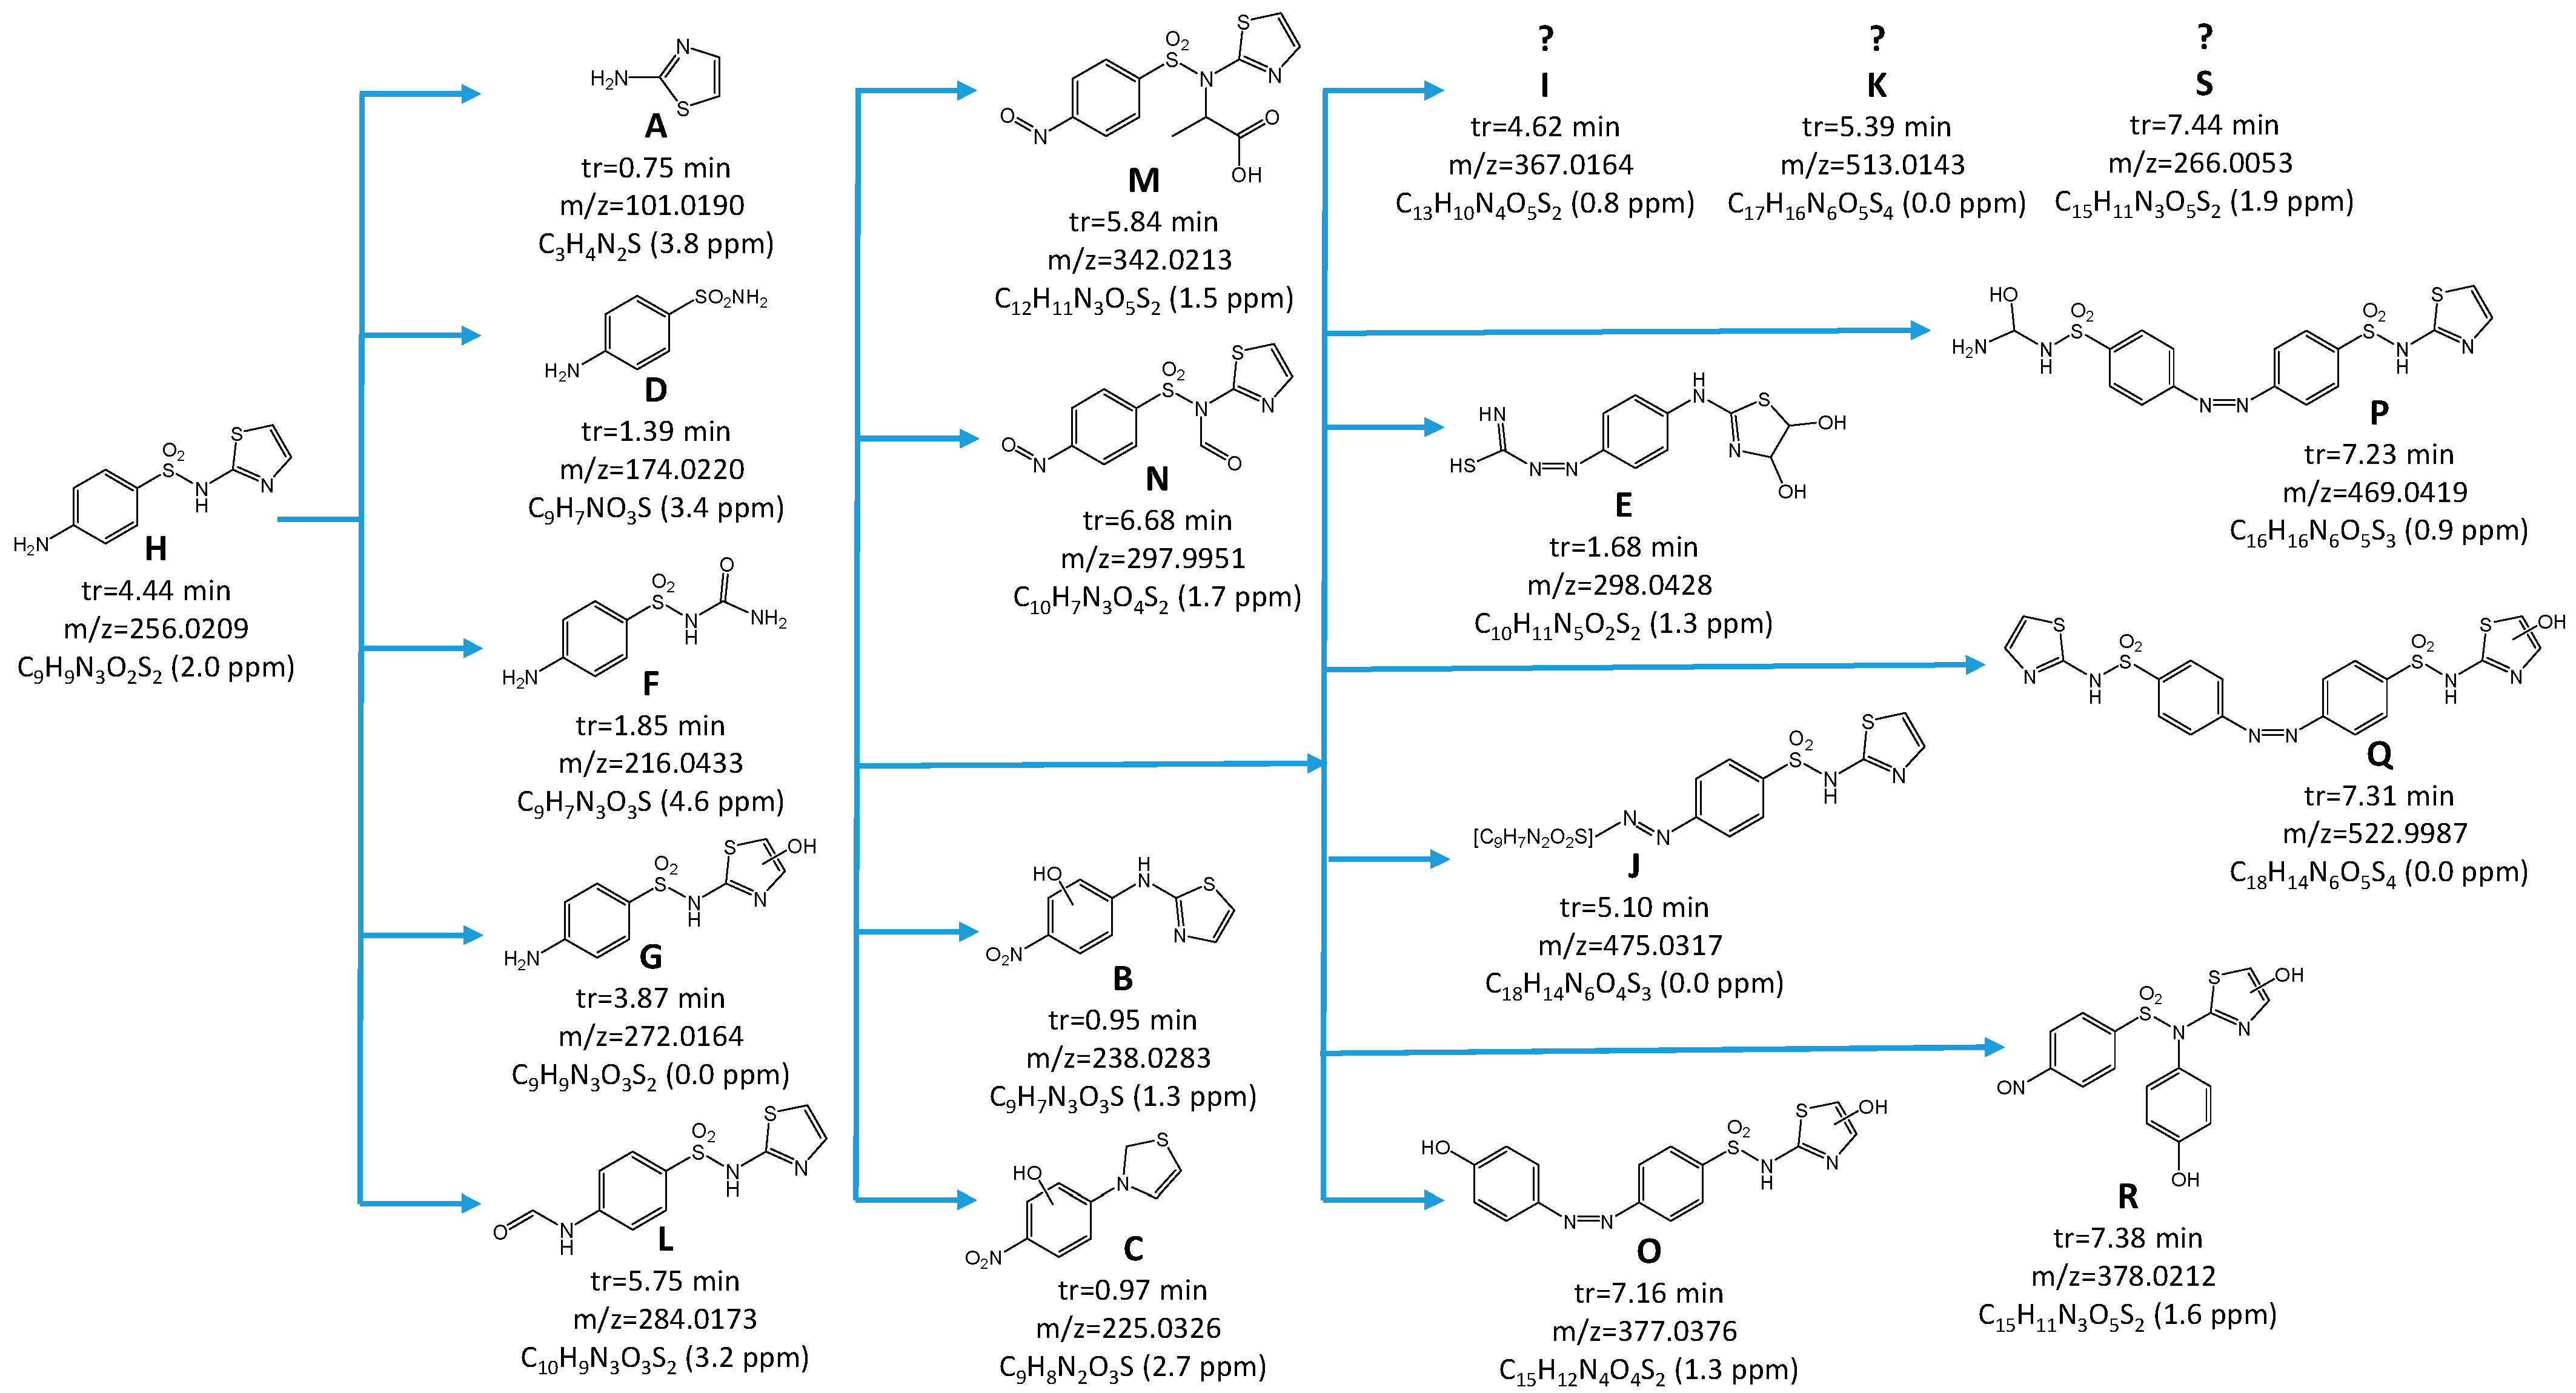
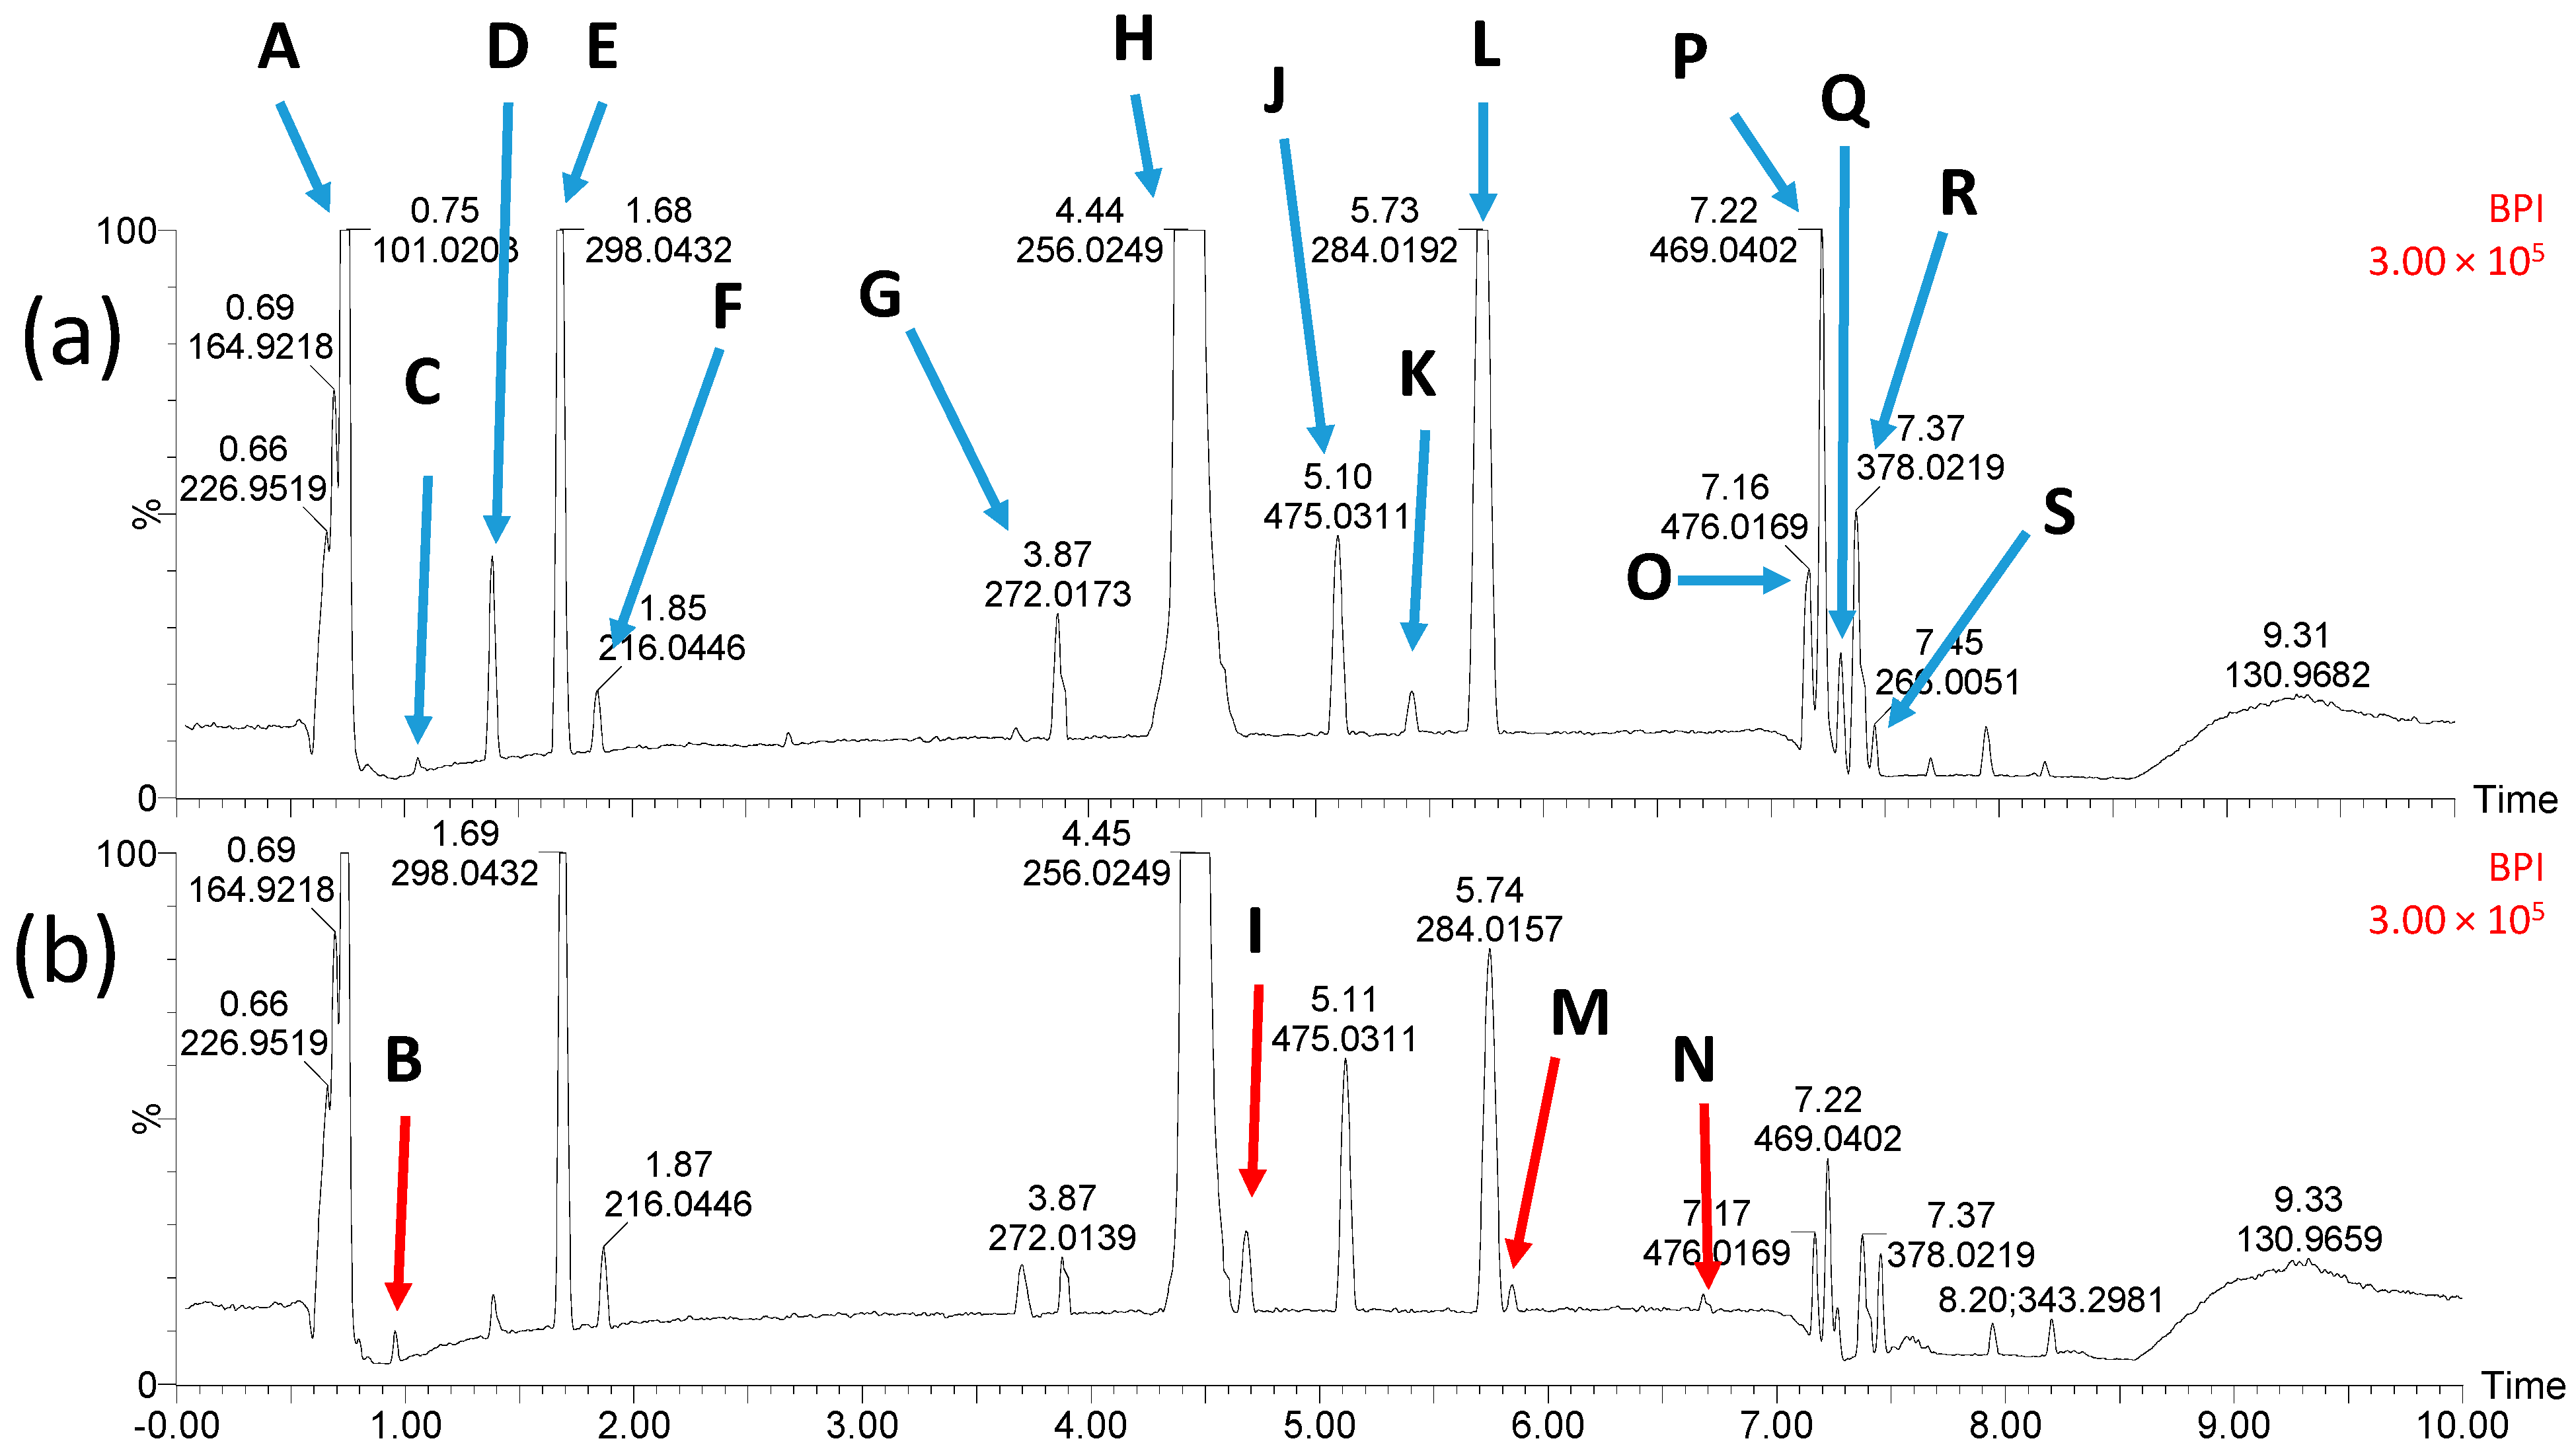
It cannot be excluded that apart from unreacted H2O2, the DPs with a high toxicity to microorganisms were produced during the Fenton process. As shown in Figure 6, a total of 18 products of the STZ transformation were found in the solution after the Fenton process (STZ is marked on the chromatogram with a letter H). The proposed structural formulas of the identified DPs are included in Figure 6.
Chromatograms shown in Figure 6a,b correspond to a solution with lower and higher antimicrobial activity and toxicity to environmental microorganisms, respectively. DPs marked with letters B, M, M and N are present on Figure 6b only. This indicates that they were formed in trace amounts in the presence of higher H2O2 concentration. The MSMS analysis confirmed that the sulfonamide group responsible for the antimicrobial activity of SNs was absent in these products. Therefore, we hold the view that these DPs were not responsible for the increased toxicity of solutions following the Fenton process (Section 2.8). However, DPs marked with letters D, F and G (Figure 7) still had the structure responsible for the antimicrobial activity of SNs.
The presence of compounds with an attached hydroxyl group among the intermediates indicates the participation of HO• radicals. The radicals may also be responsible for breaking the sulfonamide bond (S single bond N), thus leading to the generation of sulfanilamide and 1,3-thiazol-2-amine as products. The formation of similar DPs has been well-documented to date [24,51,66,67,68,69]. In turn, the addition of oxygen to the amine nitrogen (detected in B, C M, N and R compounds, Figure 7) could in our view result from the red-ox reaction.
Among the DPs of STZ we also identified the compounds resulting from the elimination of the sulfone group (marked as B, C and E) and previously unknown azo-compounds formed as a result of condensation of STZ with its DPs (marked as O, P and Q). These compounds could arise as a result of termination with the participation of organic radicals or cation radicals. It is not excluded that azo-compounds are formed as a result of charge transfer between organic compounds coordinated with iron. Similar DPs were identified after the photocatalytic degradation of STZ under acidic conditions. Such mechanisms of the Fenton reaction have been described, among others, by Duca et al. [70].

3. Materials and Methods

3.1. Reactants

A solution of STZ sodium salt (Sigma-Aldrich, St. Louis, MO, USA, >99%, Figure S10) in deionized water (>6 µS/cm) was a main reactant in the experiments. Additionally, FeSO4·7H2O (Sigma-Aldrich, >99%), H2O2 (30%, grade for trace analysis, Sigma-Aldrich), H2SO4 (96%, p.a., Merck, Darmstadt, Germany) and NaOH (p.a., POCH, Gliwice, Poland) were used. An aqueous solution of peptone (peptone from animal proteins, CAS Number: 93384-33-9, Fluka, Buchs, Switzerland) was used in some experiments to simulate a wastewater environment.

3.2. Fenton Process

Procedure 1. An aqueous STZ solution (50 mL, 0.05–1.0 mmol/L) was poured into amber glass bottles (100 mL). Then, a calculated volume of FeSO4·7H2O solution (0.5 mol/L) in H2SO4 solution (0.05 mol/L) was added. Subsequently, the pH was adjusted with H2SO4 or NaOH solutions (1.0 mol/L) and an appropriate dose of H2O2 solution was added. The mixture of reactants was stirred vigorously. All activities were performed in a darkened room, out of direct sunlight, to eliminate the effect of the photo-Fenton reaction.
Procedure 2. This procedure was similar to procedure 1, except that an STZ solution (50 mL, 0.1 mmol/L) with peptone (250–400 mg/L) was used.

3.3. Photo-Fenton Process

Procedure 1. STZ solution (100 mL, 0.1 mmol/L) in deionized water and 30 µL of FeSO4·7H2O (0.5 mol/L) in H2SO4 (0.05 mol/L) were stirred in an open crystallizer (500 mL). After adjustment of pH, a H2O2 solution (30 µL, 3%) was added to the mixture.
Procedure 2. This procedure was similar to procedure 1, except that STZ solution (100 mL, 0.1 mmol/L) in peptone solution was used. A volume of added FeSO4·7H2O was 200 µL and H2O2 was 300 µL.
In both procedures, simultaneously with the addition of H2O2 solution, the mixtures were irradiated with UVa radiation at the intensity of 13.5 W/m2. All samples were constantly stirred during irradiation.

3.4. Sampling and Preparation of Samples for Analysis

Before the addition of H2O2 and after predetermined time intervals, aliquots (5 mL) of the mixtures were collected into ampoules containing NaOH solution (50µL, 1.0 mol/L) and intensively mixed. Then, the ampoules were centrifuged (4000 RPM for 15 min) and the supernatant was immediately analyzed. The final pH of the samples ranged between 6.5 and 8.0.

3.5. UPLC Analysis

The analysis was performed using the UPLC technique (ACQUITY UPLC I-Class System, Waters, Milford, MA, USA; column ACQUITY UPLC BEH C18, 130 Å, 1.7 µm, 2.1 mm × 100 mm; detectors: PDA (λ 272 nm) and Xevo G2-XS QTof, ESI+ (Waters). Detailed data for the reagents, the analytical procedures and the mobile phase compositions are shown in Table S2 (Supplementary Materials).
DPs were identified by comparing the chromatograms using the QTof detector (ESI+) of the samples before and after the addition of H2O2. If the same monoisotopic molecular masses with the same retention time were recorded on the chromatograms before and after the addition of H2O2, these compounds were not analyzed. Protonated monoisotopic masses (M + H+) were calculated for all DPs of STZ using internal software. Fragmentation spectra of DPs were recorded at collision energy in the range of 10–25 V. The ionization conditions and acquisition parameters for the QToF detector are included in Supplementary Materials (Table S3). The retention time of the standard sulfanilamide was also used to verify its presence in DPs of STZ. All structural formulas were drawn using the ChemDraw Std 15.1 software with the Analysis package (CambridgeSoft, Cambridge, MA, USA). Aliphatic DPs were not recorded or identified on the chromatograms.

3.6. Total Organic Carbon Analysis

The Total Organic Carbon (TOC) analysis was used in the following experiments as a measure of the mineralization of the antibiotic solution. TOC determination was performed using the LCK380 cuvette test (HACH LANGE, Loveland, CO, USA), and the results were read on a DR 3900 spectrophotometer (HACH LANGE). The samples obtained after the degradation processes were diluted prior to the assay using deionized water.

3.7. Determination of Residual H2O2

The concentration of H2O2 remaining in the neutralized samples was determined using the Quantofix® Peroxyde 25 colorimetric test (Machery-Nagel, Düren, Germany). If necessary, the samples were diluted prior to the assay using deionized water.

3.8. Assessment of Chronic Toxicity

Chronic toxicity of the solution containing STZ (1.0 mmol/L only) and its DPs was evaluated using the MARA® assay (NCIMB Ltd., Aberdeen, Scotland, UK) and unselected microorganisms collected from the water of the Brynica River (50°15′33.1″ N 19°08′12.5″ E; Poland) and from the WWTP effluent (50°18′3.9″ N 19°12′06.0″ E; Poland). In each case, the procedures described by the authors of [71,72] were applied. The details of these experiments are presented in Supplementary Materials.

3.9. Assessment of Acute Toxicity (Microtox® assay)

The acute toxicity of STZ solution (1.0 mmol/L) and DPs formed after 30 min of the Fenton reaction was assessed using the standard Microtox® bioassay with a bioluminescent model bacterium V. fischeri [73]. After neutralization by NaOH, the pH of all samples was 7.4 ± 0.6. Bioluminescence inhibition (%) was calculated with the screening test (81.9% basic test protocol) using MicrotoxOmni software (Microtox® Model 500 Analyzer, Modern Water Inc., New Castle, DE, USA).
The percentage of inhibition versus the control sample that was not exposed to the potential toxicant was measured after a 15-min exposure time.

3.10. Calculations

Changes in STZ concentration during the experiments can be described by the following functions (Equations (18)–(20)):
C/C0 = f(t)
ln C0/C = f(t)
1/C = f(t)
where C0 is an initial STZ concentration and C is STZ concentration after time (t).
If the result is a linear function characterized by a high correlation coefficient (R2) (Figure 1b,c), the conditional degradation rate constant (k) and the STZ initial degradation rate (r0) can be calculated from the slope of the linear function.
The reaction order of STZ degradation with respect to the reactants used and TOC was determined using a slope of the linear function:
Log r0 = f(Log C0)
Toxicity effect was defined as a percentage of inhibition (I) according to the equation (Equation (22)):
I = 100 × (EcEt)/Ec
where Ec is an observed inhibition effect in the control sample and Et is an observed inhibition effect in the test sample.

4. Conclusions

Under the experimental conditions, the STZ degradation in the Fenton process can be described by the following kinetic equation: r0 = k CSTZ−1 or 0 CFe(II)3 CH2O20 or 1 CTOC−2. The initial concentration of FeSO4 and the total organic carbon content (TOC) in the solution had a significantly high effect on the rate of STZ degradation.
The reaction proceeded with high efficiency only in an acidic environment in a narrow pH range. Additionally, the STZ degradation required the use of a significant excess of reactants (Fe2+ salt and H2O2) relative to the decomposed substance. The useful pH range and reaction efficiency in solutions with high TOC could be increased by simultaneous UVa irradiation of the reaction mixture (Fe3+ compounds formed during the Fenton reaction are likely activated by UVa light). The mineralization of the STZ solution proceeded with an efficiency lower than that of its degradation. Therefore, the stable products of STZ degradation remained in the post-reaction solution. They formed as a result of cleavage of the heterocyclic substituent, hydroxylation, oxidation or condensation of sulfonamide with its DPs. Some DPs demonstrated antimicrobial activity. A higher degree of mineralization required the use of significantly higher doses of Fenton reagents. However, the presence of a large molar excess of H2O2 led to a partial conversion of this reactant. In our opinion, the undecomposed H2O2 present among DPs most likely affected the high ecotoxicity of the post-reaction solution. For these reasons, the achievement of a high degree of mineralization in the Fenton or photo-Fenton process is very disadvantageous from the point of view of the amounts and ecotoxicity of wastes. On the other hand, effective antibiotic inactivation can be achieved with only a slight excess of reactants used.

Supplementary Materials

The supporting information can be downloaded at: https://www.mdpi.com/article/10.3390/ijms232415676/s1. References [3,71,74,75,76,77] are cited in the supplementary materials.

Author Contributions

Conceptualizations, methodology, investigation and writing—original draft preparation E.A. and W.B.; investigation, E.M. and D.S. All authors have read and agreed to the published version of the manuscript.

Funding

This research was funded by Medical University of Silesia grants, number PCN-1-030/N/2/F and PCN-1-035/N/2/F.

Institutional Review Board Statement

Not applicable.

Informed Consent Statement

Not applicable.

Data Availability Statement

The data presented in this study are available on request from the corresponding author. The data are not publicity available due to very large sizes of chromatographic files.

Conflicts of Interest

The authors declare no conflict of interest.

References

  1. Hruska, K.; Franek, M. Sulfonamides in the Environment: A Review and a Case Report. Vet. Med. 2012, 57, 1–35. [Google Scholar] [CrossRef] [Green Version]
  2. Baran, W.; Adamek, E.; Ziemiańska, J.; Sobczak, A. Effects of the Presence of Sulfonamides in the Environment and Their Influence on Human Health. J. Hazard. Mater. 2011, 196, 1–15. [Google Scholar] [CrossRef] [PubMed]
  3. Attauabi, M.; Høg, B.B.; Müller-Pebody, B.; Duarte, A.S.R.; Korsgaard, H.B.; Boel, J.; Dalby, T.; Hammerum, A.M.; Hansen, F.; Hasman, H.; et al. DANMAP 2020 Use of Antimicrobial Agents and Occurrence of Antimicrobial Resistance in Bacteria from Food Animals, Food and Humans in Denmark; Statens Serum Institut og Technical University of Denmark: Copenhagen, Denmark; Kongens Lyngby, Denmark, 2021; p. 174. Available online: https://www.danmap.org/reports (accessed on 14 November 2022).
  4. Białk-Bielińska, A.; Stolte, S.; Matzke, M.; Fabiańska, A.; Maszkowska, J.; Kołodziejska, M.; Liberek, B.; Stepnowski, P.; Kumirska, J. Hydrolysis of Sulphonamides in Aqueous Solutions. J. Hazard. Mater. 2012, 221–222, 264–274. [Google Scholar] [CrossRef] [PubMed]
  5. Na, G.; Wang, C.; Gao, H.; Li, R.; Jin, S.; Zhang, W.; Zong, H. The Occurrence of Sulfonamide and Quinolone Resistance Genes at the Fildes Peninsula in Antarctica. Mar. Pollut. Bull. 2019, 149, 110503. [Google Scholar] [CrossRef] [PubMed]
  6. Thiele-Bruhn, S.; Beck, I.-C. Effects of Sulfonamide and Tetracycline Antibiotics on Soil Microbial Activity and Microbial Biomass. Chemosphere 2005, 59, 457–465. [Google Scholar] [CrossRef] [PubMed]
  7. Kemper, N. Veterinary Antibiotics in the Aquatic and Terrestrial Environment. Ecol. Indic. 2008, 8, 1–13. [Google Scholar] [CrossRef]
  8. Wu, L.; Xiao, X.; Chen, F.; Zhang, H.; Huang, L.; Rong, L.; Zou, X. New Parameters for the Quantitative Assessment of the Proliferation of Antibiotic Resistance Genes Dynamic in the Environment and Its Application: A Case of Sulfonamides and Sulfonamide Resistance Genes. Sci. Total. Environ. 2020, 726, 138516. [Google Scholar] [CrossRef]
  9. Vilela, P.B.; Martins, A.S.; Starling, M.C.V.M.; de Souza, F.A.R.; Pires, G.F.F.; Aguilar, A.P.; Pinto, M.E.A.; Mendes, T.A.O.; de Amorim, C.C. Solar Photon-Fenton Process Eliminates Free Plasmid DNA Harboring Antimicrobial Resistance Genes from Wastewater. J. Environ. Manag. 2021, 285, 112204. [Google Scholar] [CrossRef]
  10. Nieto-Juarez, J.I.; Kohn, T. Virus Removal and Inactivation by Iron (Hydr)Oxide-Mediated Fenton-like Processes under Sunlight and in the Dark. Photochem. Photobiol. Sci. 2013, 12, 1596–1605. [Google Scholar] [CrossRef]
  11. Pei, M.; Zhang, B.; He, Y.; Su, J.; Gin, K.; Lev, O.; Shen, G.; Hu, S. State of the Art of Tertiary Treatment Technologies for Controlling Antibiotic Resistance in Wastewater Treatment Plants. Environ. Int. 2019, 131, 105026. [Google Scholar] [CrossRef]
  12. Homem, V.; Santos, L. Degradation and Removal Methods of Antibiotics from Aqueous Matrices-A Review. J. Environ. Manag. 2011, 92, 2304–2347. [Google Scholar] [CrossRef] [PubMed]
  13. Karkman, A.; Do, T.T.; Walsh, F.; Virta, M.P.J. Antibiotic-Resistance Genes in Waste Water. Trends. Microbiol. 2018, 26, 220–228. [Google Scholar] [CrossRef] [PubMed] [Green Version]
  14. Paździor, K.; Bilińska, L.; Ledakowicz, S. A Review of the Existing and Emerging Technologies in the Combination of AOPs and Biological Processes in Industrial Textile Wastewater Treatment. Chem. Eng. J. 2019, 376, 120597. [Google Scholar] [CrossRef]
  15. Mirzaei, A.; Chen, Z.; Haghighat, F.; Yerushalmi, L. Removal of Pharmaceuticals from Water by Homo/Heterogonous Fenton-Type Processes-A Review. Chemosphere 2017, 174, 665–688. [Google Scholar] [CrossRef]
  16. Mousset, E.; Loh, W.H.; Lim, W.S.; Jarry, L.; Wang, Z.; Lefebvre, O. Cost Comparison of Advanced Oxidation Processes for Wastewater Treatment Using Accumulated Oxygen-Equivalent Criteria. Water. Res. 2021, 200, 117234. [Google Scholar] [CrossRef] [PubMed]
  17. Cassano, D.; Zapata, A.; Brunetti, G.; del Moro, G.; di Iaconi, C.; Oller, I.; Malato, S.; Mascolo, G. Comparison of Several Combined/Integrated Biological-AOPs Setups for the Treatment of Municipal Landfill Leachate: Minimization of Operating Costs and Effluent Toxicity. Chem. Eng. J. 2011, 172, 250–257. [Google Scholar] [CrossRef]
  18. Cañizares, P.; Paz, R.; Sáez, C.; Rodrigo, M.A. Costs of the Electrochemical Oxidation of Wastewaters: A Comparison with Ozonation and Fenton Oxidation Processes. J. Environ. Manag. 2009, 90, 410–420. [Google Scholar] [CrossRef] [PubMed]
  19. Gar Alalm, M.; Tawfik, A.; Ookawara, S. Comparison of Solar TiO2 Photocatalysis and Solar Photo-Fenton for Treatment of Pesticides Industry Wastewater: Operational Conditions, Kinetics, and Costs. J. Water Process. Eng. 2015, 8, 55–63. [Google Scholar] [CrossRef]
  20. Tejera, J.; Miranda, R.; Hermosilla, D.; Urra, I.; Negro, C.; Blanco, Á. Treatment of a Mature Landfill Leachate: Comparison between Homogeneous and Heterogeneous Photo-Fenton with Different Pretreatments. Water 2019, 11, 1849. [Google Scholar] [CrossRef] [Green Version]
  21. Noman, D.-S.; Yasar, A.; Yousaf, S. Solar Assisted Photo Fenton for Cost Effective Degradation of Textile Effluents in Comparison to AOPs. Glob. Nest. J. 2012, 14, 477–486. [Google Scholar]
  22. Kwan, W.P.; Voelker, B.M. Rates of Hydroxyl Radical Generation and Organic Compound Oxidation in Mineral-Catalyzed Fenton-like Systems. Environ. Sci. Technol. 2003, 37, 1150–1158. [Google Scholar] [CrossRef] [PubMed]
  23. Perini, J.A.L.; Tonetti, A.L.; Vidal, C.; Montagner, C.C.; Nogueira, R.F.P. Simultaneous Degradation of Ciprofloxacin, Amoxicillin, Sulfathiazole and Sulfamethazine, and Disinfection of Hospital Effluent after Biological Treatment via Photo-Fenton Process under Ultraviolet Germicidal Irradiation. Appl. Catal. B Environ. 2018, 224, 761–771. [Google Scholar] [CrossRef] [Green Version]
  24. Yang, J.-F.; Zhou, S.-B.; Xiao, A.-G.; Li, W.-J.; Ying, G.-G. Chemical Oxidation of Sulfadiazine by the Fenton Process: Kinetics, Pathways, Toxicity Evaluation. J. Environ. Sci. Health Part B 2014, 49, 909–916. [Google Scholar] [CrossRef] [PubMed]
  25. Jain, B.; Singh, A.K.; Kim, H.; Lichtfouse, E.; Sharma, V.K. Treatment of Organic Pollutants by Homogeneous and Heterogeneous Fenton Reaction Processes. Environ. Chem. Lett. 2018, 16, 947–967. [Google Scholar] [CrossRef] [Green Version]
  26. Khankhasaeva, S.T.; Dambueva, D.V.; Dashinamzhilova, E.T.; Gil, A.; Vicente, M.A.; Timofeeva, M.N. Fenton Degradation of Sulfanilamide in the Presence of Al, Fe-Pillared Clay: Catalytic Behavior and Identification of the Intermediates. J. Hazard. Mater. 2015, 293, 21–29. [Google Scholar] [CrossRef] [PubMed]
  27. Liu, X. Progress in the Mechanism and Kinetics of Fenton Reaction. MOJ Ecol. Environ. Sci. 2018, 3, 60. [Google Scholar] [CrossRef] [Green Version]
  28. Michael, I.; Frontistis, Z.; Fatta-Kassinos, D. Removal of Pharmaceuticals from Environmentally Relevant Matrices by Advanced Oxidation Processes (AOPs). Compr. Anal. Chem. 2013, 62, 345–407. [Google Scholar]
  29. Su, R.; Dai, X.; Wang, H.; Wang, Z.; Li, Z.; Chen, Y.; Luo, Y.; Ouyang, D. Metronidazole Degradation by UV and UV/H2O2 Advanced Oxidation Processes: Kinetics, Mechanisms, and Effects of Natural Water Matrices. Int. J. Environ. Res. Public Health 2022, 19, 12354. [Google Scholar] [CrossRef]
  30. Rozas, O.; Contreras, D.; Mondaca, M.A.; Pérez-Moya, M.; Mansilla, H.D. Experimental Design of Fenton and Photo-Fenton Reactions for the Treatment of Ampicillin Solutions. J. Hazard. Mater. 2010, 177, 1025–1030. [Google Scholar] [CrossRef] [PubMed]
  31. Batista, A.P.S.; Nogueira, R.F.P. Parameters Affecting Sulfonamide Photo-Fenton Degradation-Iron Complexation and Substituent Group. J. Photochem. Photobiol. A Chem. 2012, 232, 8–13. [Google Scholar] [CrossRef]
  32. Sági, G.; Csay, T.; Szabó, L.; Pátzay, G.; Csonka, E.; Takács, E.; Wojnárovits, L. Analytical Approaches to the OH Radical Induced Degradation of Sulfonamide Antibiotics in Dilute Aqueous Solutions. J. Pharm. Biomed. Anal. 2015, 106, 52–60. [Google Scholar] [CrossRef]
  33. Salgado, P.; Melin, V.; Contreras, D.; Moreno, Y.; Mansilla, H.D. Fenton Reaction Driven By Iron Ligands. J. Chil. Chem. Soc. 2013, 58, 2096–2101. [Google Scholar] [CrossRef]
  34. Lian, L.; Yao, B.; Hou, S.; Fang, J.; Yan, S.; Song, W. Kinetic Study of Hydroxyl and Sulfate Radical-Mediated Oxidation of Pharmaceuticals in Wastewater Effluents. Environ. Sci. Technol. 2017, 51, 2954–2962. [Google Scholar] [CrossRef] [PubMed]
  35. Cheng, S.; Zhang, X.; Yang, X.; Shang, C.; Song, W.; Fang, J.; Pan, Y. The Multiple Role of Bromide Ion in PPCPs Degradation under UV/Chlorine Treatment. Environ. Sci. Technol. 2018, 52, 1806–1816. [Google Scholar] [CrossRef] [PubMed]
  36. Kiwi, J.; Lopez, A.; Nadtochenko, V. Mechanism and Kinetics of the OH-Radical Intervention during Fenton Oxidation in the Presence of a Significant Amount of Radical Scavenger (Cl). Environ. Sci. Technol. 2000, 34, 2162–2168. [Google Scholar] [CrossRef]
  37. Babuponnusami, A.; Muthukumar, K. A Review on Fenton and Improvements to the Fenton Process for Wastewater Treatment. J. Environ. Chem. Eng. 2014, 2, 557–572. [Google Scholar] [CrossRef]
  38. Wang, N.; Zheng, T.; Zhang, G.; Wang, P. A Review on Fenton-like Processes for Organic Wastewater Treatment. J. Environ. Chem. Eng. 2016, 4, 762–787. [Google Scholar] [CrossRef] [Green Version]
  39. Elmolla, E.; Chaudhuri, M. Optimization of Fenton Process for Treatment of Amoxicillin, Ampicillin and Cloxacillin Antibiotics in Aqueous Solution. J. Hazard. Mater. 2009, 170, 666–672. [Google Scholar] [CrossRef] [PubMed]
  40. Burbano, A.A.; Dionysiou, D.D.; Suidan, M.T.; Richardson, T.L. Oxidation Kinetics and Effect of PH on the Degradation of MTBE with Fenton Reagent. Water Res. 2005, 39, 107–118. [Google Scholar] [CrossRef]
  41. Zazo, J.A.; Casas, J.A.; Mohedano, A.F.; Gilarranz, M.A.; Rodríguez, J.J. Chemical Pathway and Kinetics of Phenol Oxidation by Fenton’s Reagent. Environ. Sci. Technol. 2005, 39, 9295–9302. [Google Scholar] [CrossRef]
  42. Duesterberg, C.K.; Mylon, S.E.; Waite, T.D. pH Effects on Iron-Catalyzed Oxidation Using Fenton’s Reagent. Environ. Sci. Technol. 2008, 42, 8522–8527. [Google Scholar] [CrossRef] [PubMed]
  43. Sun, S.; Yao, H.; Li, X.; Deng, S.; Zhao, S.; Zhang, W. Enhanced Degradation of Sulfamethoxazole (SMX) in Toilet Wastewater by Photo-Fenton Reactive Membrane Filtration. Nanomaterials 2020, 10, 180. [Google Scholar] [CrossRef] [PubMed]
  44. Fiorentino, A.; Esteban, B.; Garrido-Cardenas, J.A.; Kowalska, K.; Rizzo, L.; Aguera, A.; Pérez, J.A.S. Effect of Solar Photo-Fenton Process in Raceway Pond Reactors at Neutral pH on Antibiotic Resistance Determinants in Secondary Treated Urban Wastewater. J. Hazard. Mater. 2019, 378, 120737. [Google Scholar] [CrossRef] [PubMed]
  45. Huang, W.; Brigante, M.; Wu, F.; Mousty, C.; Hanna, K.; Mailhot, G. Assessment of the Fe(III)–EDDS Complex in Fenton-Like Processes: From the Radical Formation to the Degradation of Bisphenol A. Environ. Sci. Technol. 2013, 47, 1952–1959. [Google Scholar] [CrossRef] [PubMed]
  46. Urbano, V.R.; Maniero, M.G.; Guimarães, J.R.; del Valle, L.J.; Pérez-Moya, M. Sulfaquinoxaline Oxidation and Toxicity Reduction by Photo-Fenton Process. Int. J. Environ. Res. Public Health 2021, 18, 1005. [Google Scholar] [CrossRef] [PubMed]
  47. Trovó, A.G.; Pupo Nogueira, R.F.; Agüera, A.; Fernandez-Alba, A.R.; Malato, S. Degradation of the Antibiotic Amoxicillin by Photo-Fenton Process-Chemical and Toxicological Assessment. Water Res. 2011, 45, 1394–1402. [Google Scholar] [CrossRef] [Green Version]
  48. Michael, I.; Hapeshi, E.; Aceña, J.; Perez, S.; Petrović, M.; Zapata, A.; Barceló, D.; Malato, S.; Fatta-Kassinos, D. Light-Induced Catalytic Transformation of Ofloxacin by Solar Fenton in Various Water Matrices at a Pilot Plant: Mineralization and Characterization of Major Intermediate Products. Sci. Total. Environ. 2013, 461–462, 39–48. [Google Scholar] [CrossRef] [PubMed] [Green Version]
  49. Pérez-Moya, M.; Graells, M.; Castells, G.; Amigó, J.; Ortega, E.; Buhigas, G.; Pérez, L.M.; Mansilla, H.D. Characterization of the Degradation Performance of the Sulfamethazine Antibiotic by Photo-Fenton Process. Water. Res. 2010, 44, 2533–2540. [Google Scholar] [CrossRef]
  50. Batista, A.P.S.; Pires, F.C.C.; Teixeira, A.C.S.C. Photochemical Degradation of Sulfadiazine, Sulfamerazine and Sulfamethazine: Relevance of Concentration and Heterocyclic Aromatic Groups to Degradation Kinetics. J. Photochem. Photobiol. A Chem. 2014, 286, 40–46. [Google Scholar] [CrossRef]
  51. Wang, S.; Wang, J. Comparative Study on Sulfamethoxazole Degradation by Fenton and Fe(II)-Activated Persulfate Process. RSC Adv. 2017, 7, 48670–48677. [Google Scholar] [CrossRef] [Green Version]
  52. Wang, S. A Comparative Study of Fenton and Fenton-like Reaction Kinetics in Decolourisation of Wastewater. Dye. Pigment. 2008, 76, 714–720. [Google Scholar] [CrossRef]
  53. Anotai, J.; Lu, M.C.; Chewpreecha, P. Kinetics of Aniline Degradation by Fenton and Electro-Fenton Processes. Water Res. 2006, 40, 1841–1847. [Google Scholar] [CrossRef] [PubMed]
  54. Abdili, T.; Rahmani, A.; Rahmani, H.; Alighadri, M.; Rahmani, K. Heterogeneous Oxidation of Sulfacetamide in Aquatic Environment Using Ultrasonic and Nano-Fenton: Kinetics Intermediates and Bioassay Test. Desalin. Water Treat. 2019, 166, 158–167. [Google Scholar] [CrossRef]
  55. Baran, W.; Adamek, E.; Sobczak, A.; Sochacka, J. The Comparison of Photocatalytic Activity of Fe-Salts, TiO2 and TiO2/FeCl3 during the Sulfanilamide Degradation Process. Catal. Commun. 2009, 10, 811–814. [Google Scholar] [CrossRef]
  56. Acosta-Rangel, A.; Sánchez-Polo, M.; Polo, A.M.S.; Rivera-Utrilla, J.; Berber-Mendoza, M.S. Sulfonamides Degradation Assisted by UV, UV/H2O2 and UV/K2S2O8: Efficiency, Mechanism and Byproducts Cytotoxicity. J. Environ. Manag. 2018, 225, 224–231. [Google Scholar] [CrossRef]
  57. Bach, A.; Shemer, H.; Semiat, R. Kinetics of Phenol Mineralization by Fenton-like Oxidation. Desalination 2010, 264, 188–192. [Google Scholar] [CrossRef]
  58. Pervaiz, M.; Riaz, A.; Munir, A.; Saeed, Z.; Hussain, S.; Rashid, A.; Younas, U.; Adnan, A. Synthesis and Characterization of Sulfonamide Metal Complexes as Antimicrobial Agents. J. Mol. Struct. 2020, 1202, 127284. [Google Scholar] [CrossRef]
  59. Engelmann, M.D.; Bobier, R.T.; Hiatt, T.; Cheng, I.F. Variability of the Fenton Reaction Characteristics of the EDTA, DTPA, and Citrate Complexes of Iron. BioMetals 2003, 16, 519–527. [Google Scholar] [CrossRef]
  60. Velásquez, M.; Santander, I.P.; Contreras, D.R.; Yáñez, J.; Zaror, C.; Salazar, R.A.; Pérez-Moya, M.; Mansilla, H.D. Oxidative Degradation of Sulfathiazole by Fenton and Photo-Fenton Reactions. J. Environ. Sci. Health A 2014, 49, 661–670. [Google Scholar] [CrossRef]
  61. Rokhina, E.V.; Virkutyte, J. Environmental Application of Catalytic Processes: Heterogeneous Liquid Phase Oxidation of Phenol With Hydrogen Peroxide. Crit. Rev. Environ. Sci. Technol. 2010, 41, 125–167. [Google Scholar] [CrossRef]
  62. Trovó, A.G.; de Paiva, V.A.B.; Machado, A.E.H.; de Oliveira, C.A.; Santos, R.O. Degradation of the Antibiotic Chloramphenicol by Photo-Fenton Process at Lab-Scale and Solar Pilot Plant: Kinetic, Toxicity and Inactivation Assessment. Sol. Energy 2013, 97, 596–604. [Google Scholar] [CrossRef]
  63. González, O.; Sans, C.; Esplugas, S. Sulfamethoxazole Abatement by Photo-Fenton: Toxicity, Inhibition and Biodegradability Assessment of Intermediates. J. Hazard. Mater. 2007, 146, 459–464. [Google Scholar] [CrossRef] [PubMed]
  64. Ben, W.; Qiang, Z.; Pan, X.; Chen, M. Removal of Veterinary Antibiotics from Sequencing Batch Reactor (SBR) Pretreated Swine Wastewater by Fenton’s Reagent. Water Res. 2009, 43, 4392–4402. [Google Scholar] [CrossRef] [PubMed]
  65. Wang, H.; Yao, H.; Sun, P.; Pei, J.; Li, D.; Huang, C.H. Oxidation of Tetracycline Antibiotics Induced by Fe(III) Ions without Light Irradiation. Chemosphere 2015, 119, 1255–1261. [Google Scholar] [CrossRef] [PubMed]
  66. Ge, L.; Zhang, P.; Halsall, C.; Li, Y.; Chen, C.E.; Li, J.; Sun, H.; Yao, Z. The Importance of Reactive Oxygen Species on the Aqueous Phototransformation of Sulfonamide Antibiotics: Kinetics, Pathways, and Comparisons with Direct Photolysis. Water Res. 2019, 149, 243–250. [Google Scholar] [CrossRef] [PubMed]
  67. Yin, R.; Guo, W.; Wang, H.; Du, J.; Zhou, X.; Wu, Q.; Zheng, H.; Chang, J.; Ren, N. Selective Degradation of Sulfonamide Antibiotics by Peroxymonosulfate Alone: Direct Oxidation and Nonradical Mechanisms. Chem. Eng. J. 2018, 334, 2539–2546. [Google Scholar] [CrossRef]
  68. Zhang, K.; Luo, Z.; Zhang, T.; Gao, N.; Ma, Y. Degradation Effect of Sulfa Antibiotics by Potassium Ferrate Combined with Ultrasound (Fe(VI)-US). Biomed. Res. Int. 2015, 2015, 169215. [Google Scholar] [CrossRef] [PubMed] [Green Version]
  69. García-Galán, M.J.; Díaz-Cruz, M.S.; Barceló, D. Identification and Determination of Metabolites and Degradation Products of Sulfonamide Antibiotics. TrAC Trends. Anal. Chem. 2008, 27, 1008–1022. [Google Scholar] [CrossRef]
  70. Duca, G. Homogeneous Redox Catalysis with Transition Metal Compounds in Oxide and Peroxide Systems. In Homogeneous Catalysis with Metal Complexes; Springer Series in Chemical Physics; Springer: Berlin/Heidelberg, Germany, 2012; Volume 102, pp. 11–121. [Google Scholar]
  71. Wadhia, K.; Dando, T.; Clive Thompson, K. Intra-Laboratory Evaluation of Microbial Assay for Risk Assessment (MARA) for Potential Application in the Implementation of the Water Framework Directive (WFD). J. Environ. Monit. 2007, 9, 953–958. [Google Scholar] [CrossRef]
  72. Adamek, E.; Baran, W.; Sobczak, A. Photocatalytic Degradation of Veterinary Antibiotics: Biodegradability and Antimicrobial Activity of Intermediates. Process. Saf. Environ. 2016, 103, 1–9. [Google Scholar] [CrossRef]
  73. Weltens, R.; Deprez, K.; Michiels, L. Validation of Microtox as a First Screening Tool for Waste Classification. Waste Manag. 2014, 34, 2427–2433. [Google Scholar] [CrossRef] [PubMed]
  74. Fai, P.B.; Grant, A. An Assessment of the Potential of the Microbial Assay for Risk Assessment (MARA) for Ecotoxicological Testing. Ecotoxicology 2010, 19, 1626–1633. [Google Scholar] [CrossRef] [PubMed]
  75. Nałȩcz-Jawecki, G.; Wadhia, K.; Adomas, B.; Piotrowicz-Cieślak, A.I.; Sawicki, J. Application of Microbial Assay for Risk Assessment Biotest in Evaluation of Toxicity of Human and Veterinary Antibiotics. Environ. Toxicol. 2010, 25, 487–494. [Google Scholar] [CrossRef] [PubMed]
  76. Baran, W.; Adamek, E.; Sobczak, A. Sobczak A Assessment of Sensitivity of Environmental Microorganisms to Antibiotics Using the Platelet Assays. Proc. ECOpole 2015, 9, 533–540. [Google Scholar]
  77. Wadhia, K. ISTA13-International Interlaboratory Comparative Evaluation of Microbial Assay for Risk Assessment (MARA). Environ. Toxicol. 2008, 23, 626–633. [Google Scholar] [CrossRef] [PubMed]
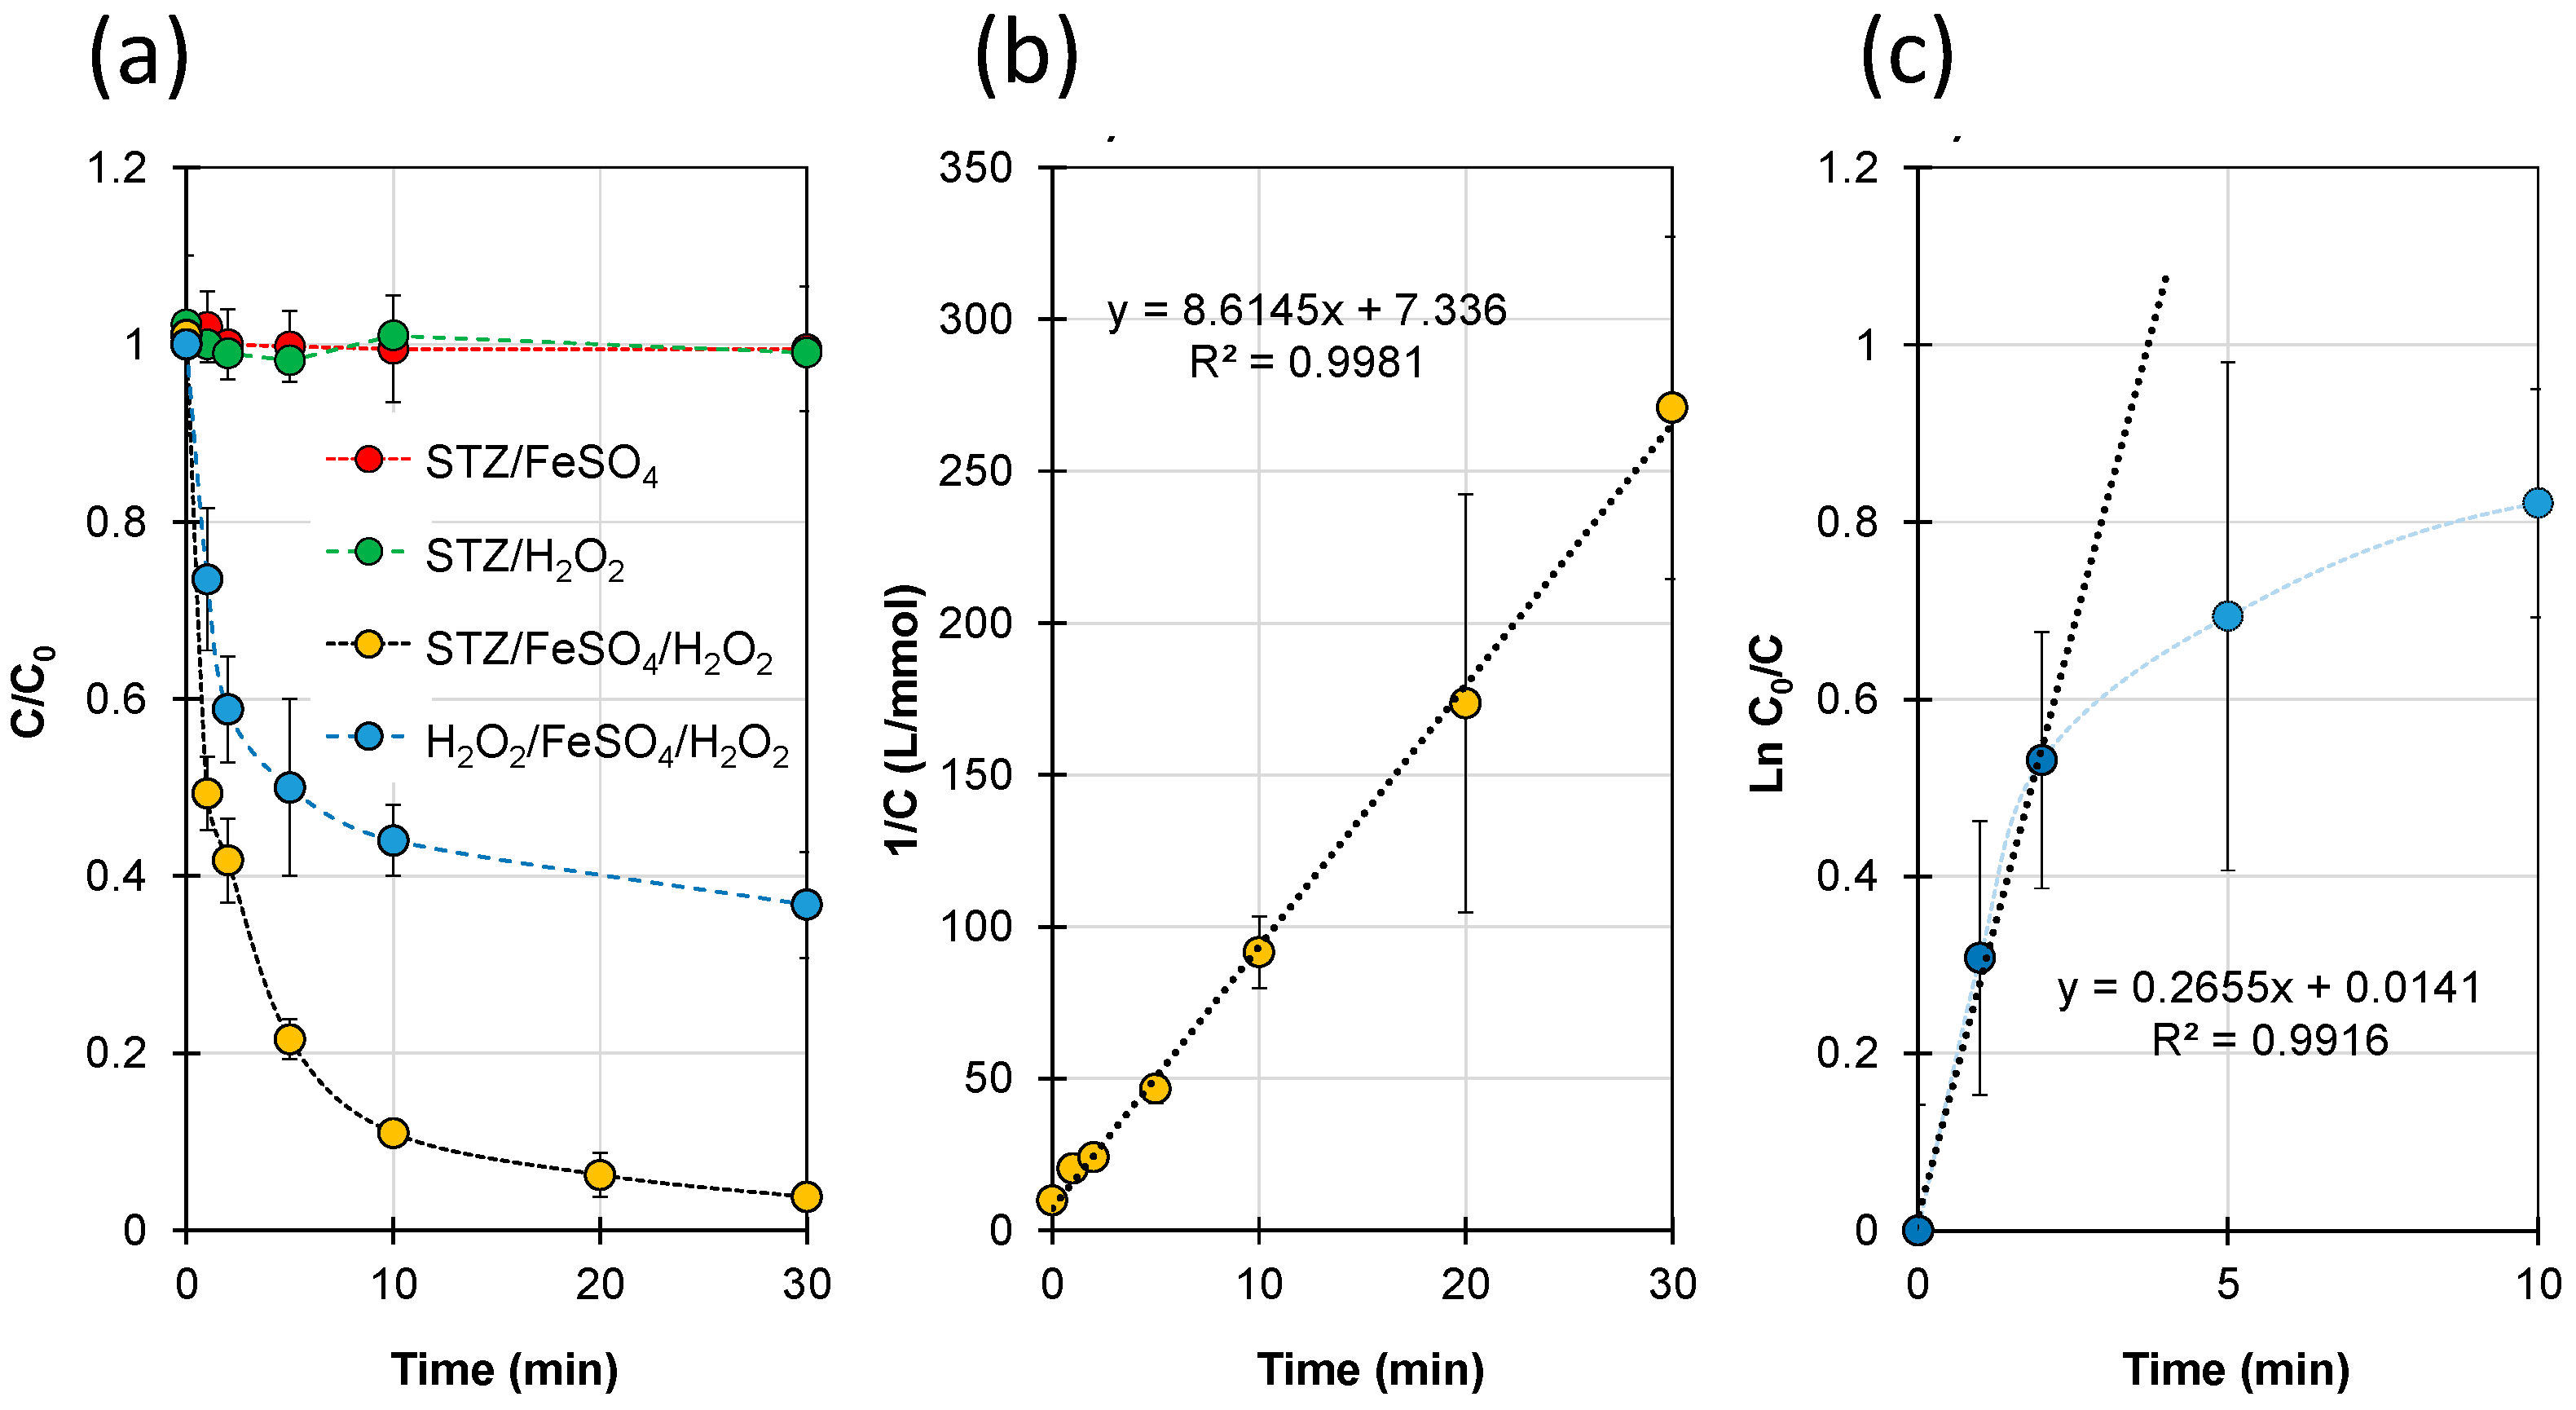
Figure 1. Dynamics of STZ and H2O2 degradation in the presence of FeSO4 and/or H2O2; (a) changes in STZ and H2O2 concentration during the reaction; (b) plot of the function 1/C = f(t) for change in STZ concentration; (c) plot of the function Ln(C0/C) = f(t) for change in H2O2 concentration. [FeSO4]0 = 0.15 mmol/L, [H2O2]0 = 2.0 mmol/L, pH = 3.35–3.45.
Ijms 23 15676 g001
Figure 2. Determination of reaction order; the concentration effect of STZ (a), FeSO4 (b), H2O2 (c) and Total Organic Carbon (TOC) (d).
Ijms 23 15676 g002
Figure 3. Effect of pH on the dynamics of STZ degradation (a), the degree of degradation after 10 and 30 min of reaction (b) and the initial degradation rate of STZ (c). [STZ]0 = 0.1 mmol/L, [FeSO4]0 = 0.15 mmol/L, [H2O2]0 = 2.0 mmol/L, pH = 3.35 ± 0.05.
Ijms 23 15676 g003
Figure 4. Effect of pH (a) and TOC (b) on STZ degradation and difference (Δ) in the degree of degradation of Fenton and photo-Fenton processes after 30 min (c). [STZ]0 = 0.1 mmol/L, [FeSO4]0 = 0.15 mmol/L, [H2O2]0 = 20.0 mmol/L.
Ijms 23 15676 g004
Figure 5. Figure 5. Effect of H2O2/FeSO4 dose on the relative STZ concentration (Ijms 23 15676 i001), on relative TOC content (Ijms 23 15676 i002) and H2O2 concentration (Ijms 23 15676 i003) (a) and relative inhibition determined for microorganisms from the Brynica River (Ijms 23 15676 i004), for microorganisms from effluent (Ijms 23 15676 i005), V fischeri (Ijms 23 15676 i006), on mean relative inhibition determined for B. diminuta, D. acidovorans and P. aurantiaca (Ijms 23 15676 i007) (b), in samples after 30 min of Fenton process in the presence of FeSO4. [STZ]0 = 1.0 mmol/L, pH = 3.35 ± 0.05.
Ijms 23 15676 g005
Figure 6. Chromatograms of solutions after STZ degradation with FeSO4 and: (a) 10 mmol/L H2O2, (b) 50 mmol/L H2O2. The chromatographic peaks of STZ and DPs are labelled with letters from A to S.
Ijms 23 15676 g006
Figure 7. Proposed DPs identified based on the analysis of the chromatograms (Figure 6) and the possible pathway of STZ degradation.
Ijms 23 15676 g007
Publisher’s Note: MDPI stays neutral with regard to jurisdictional claims in published maps and institutional affiliations.