
Unique Features of the Immune Response in BTBR Mice

 , , , and
Abstract
1. Introduction
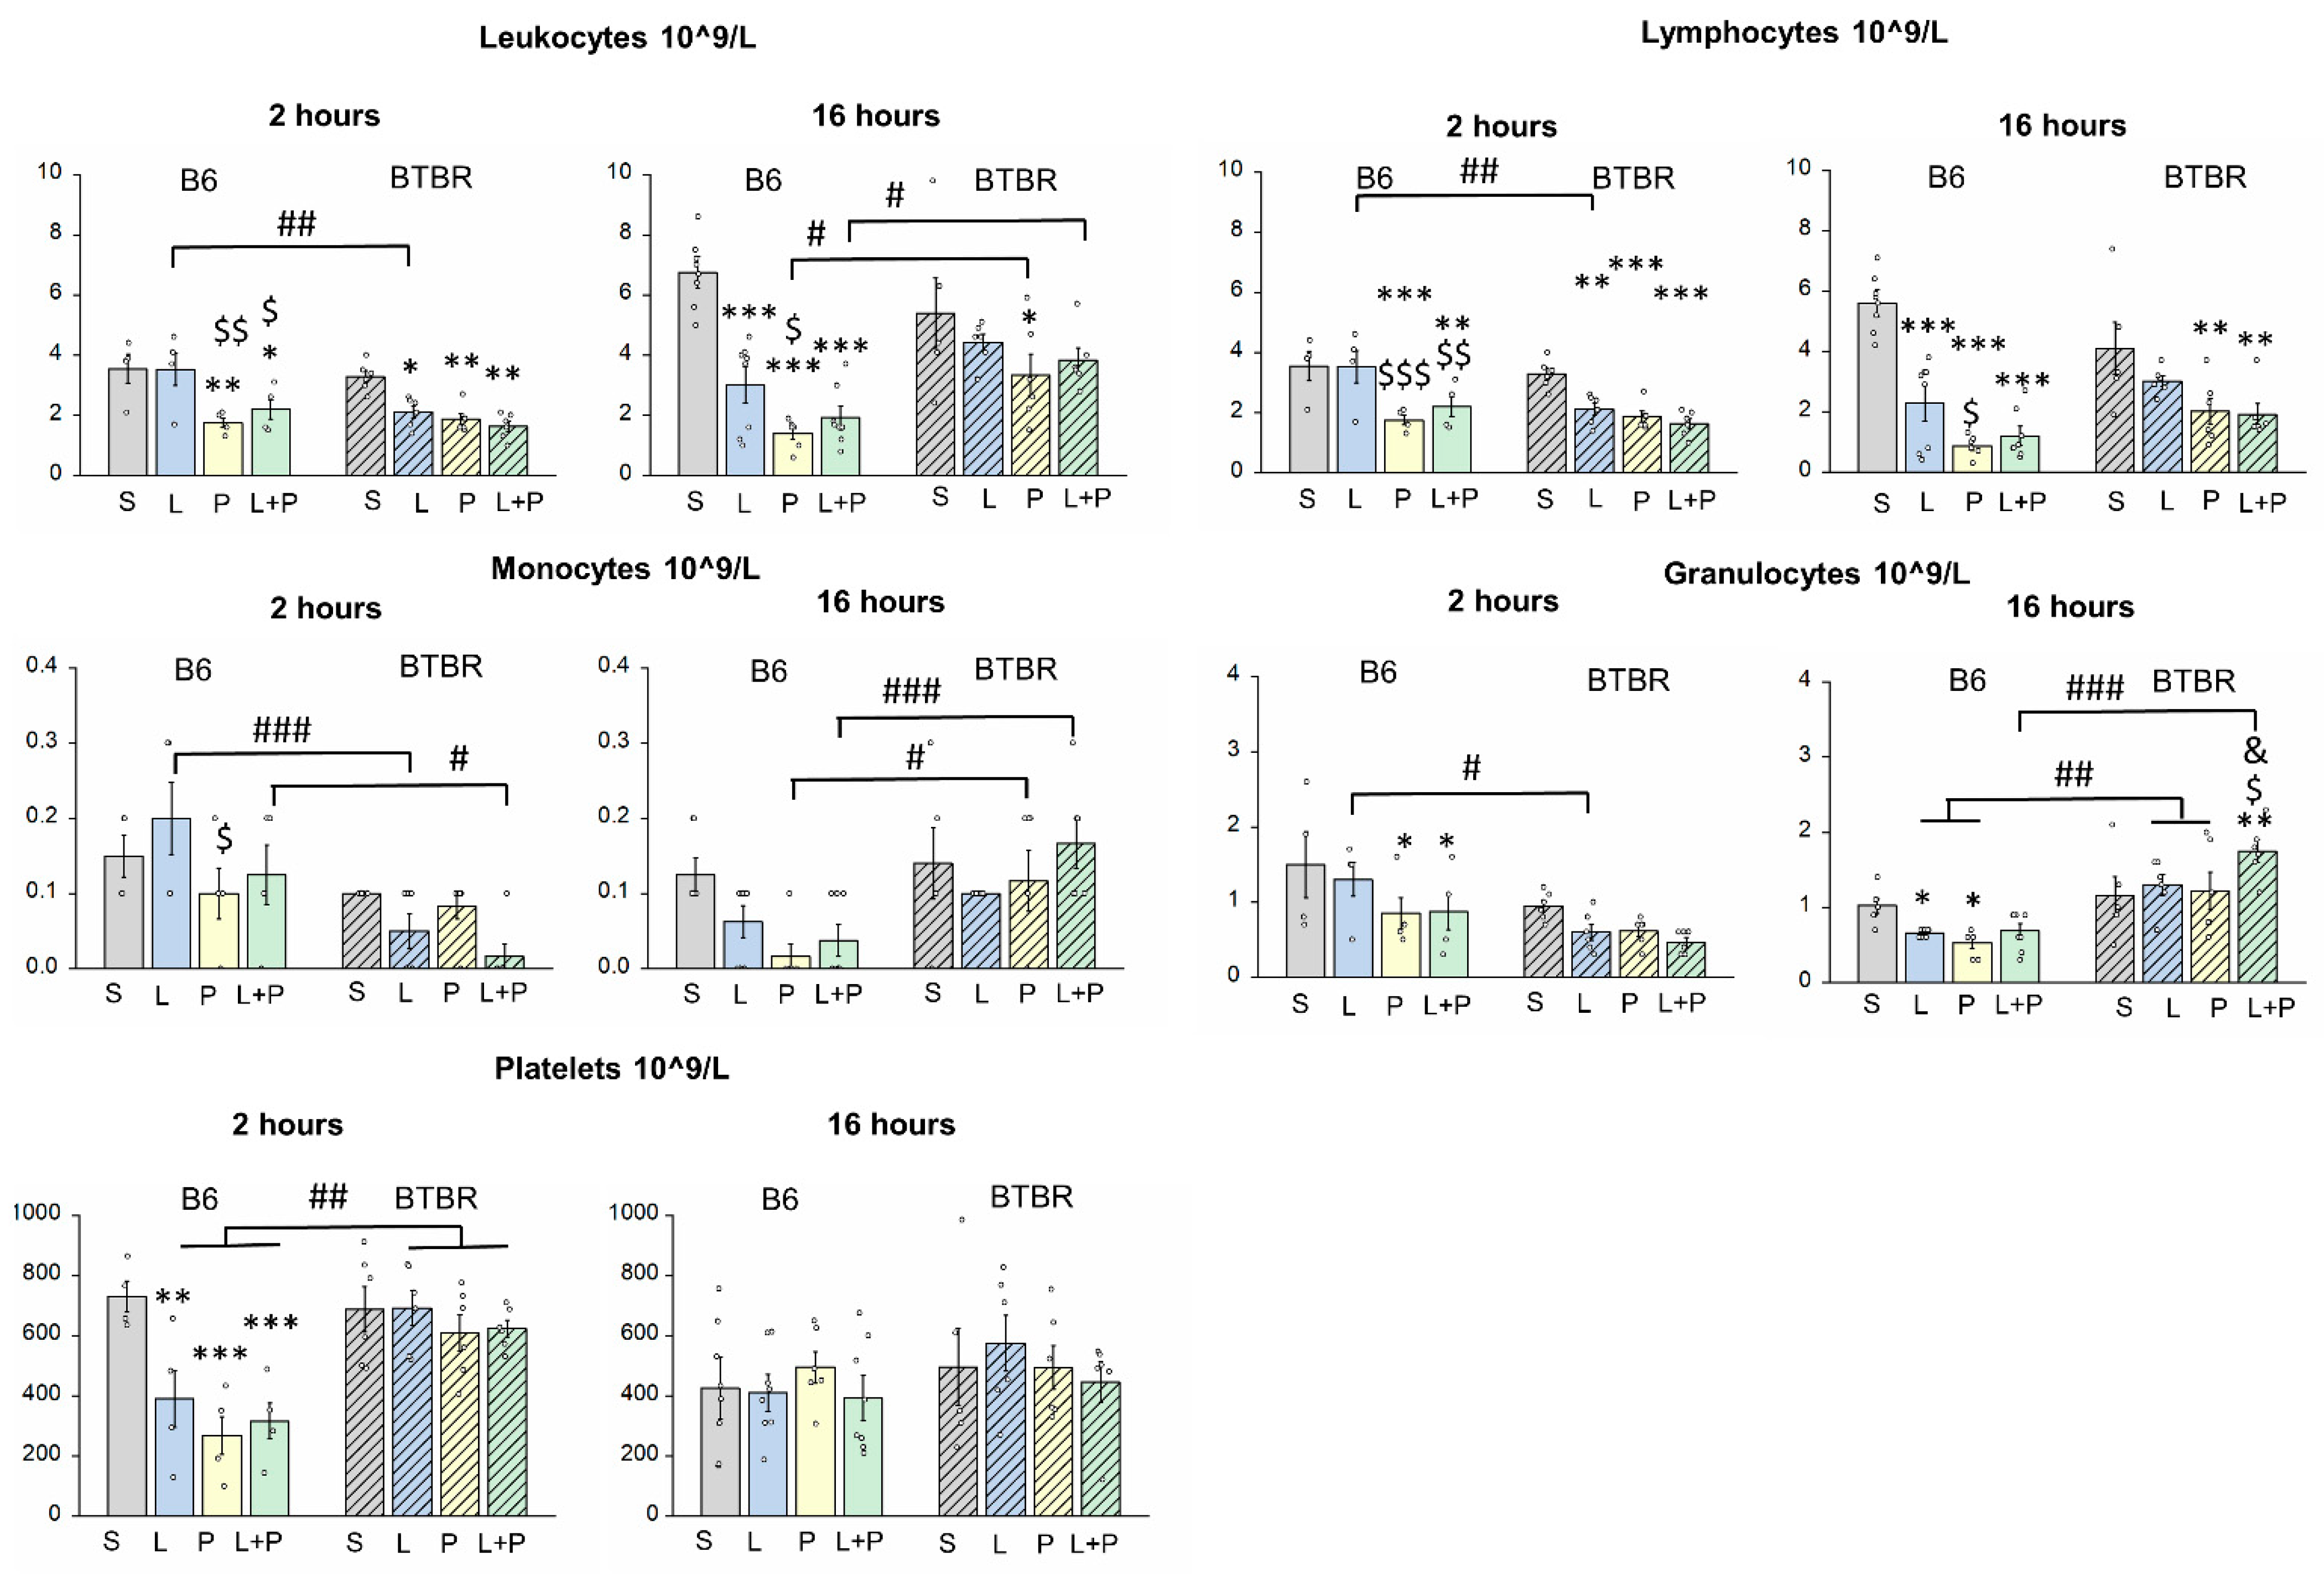
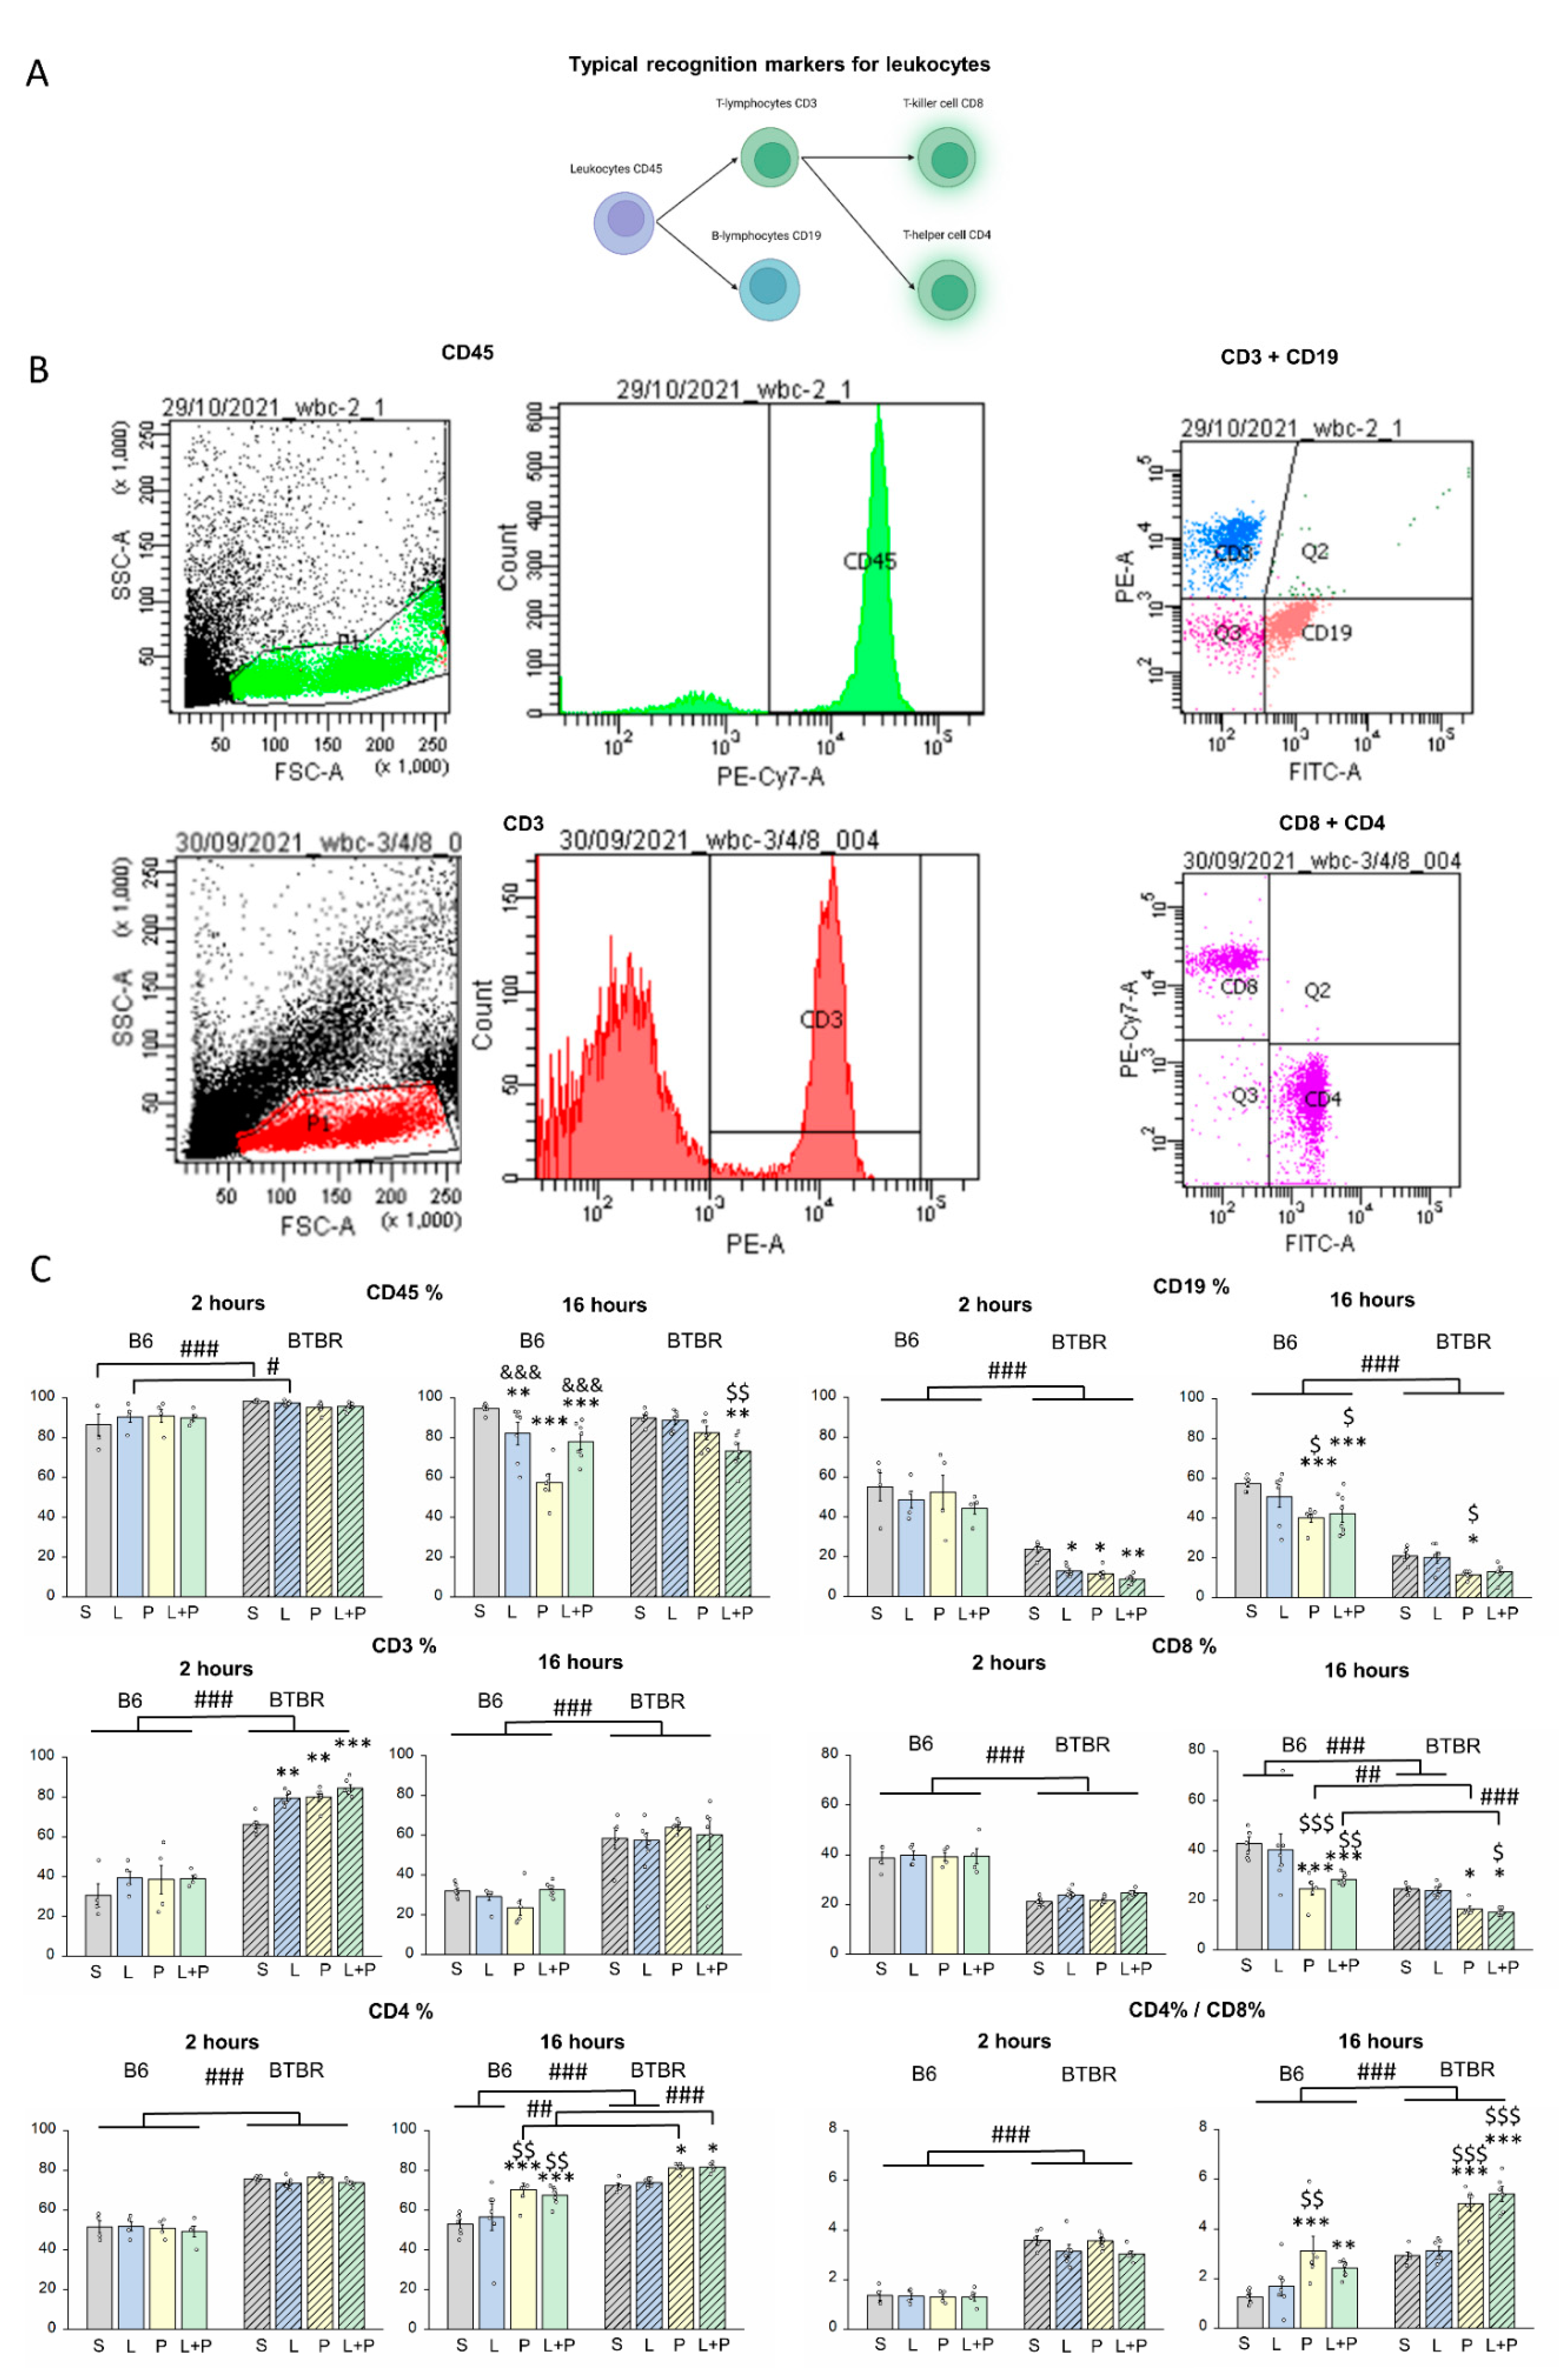
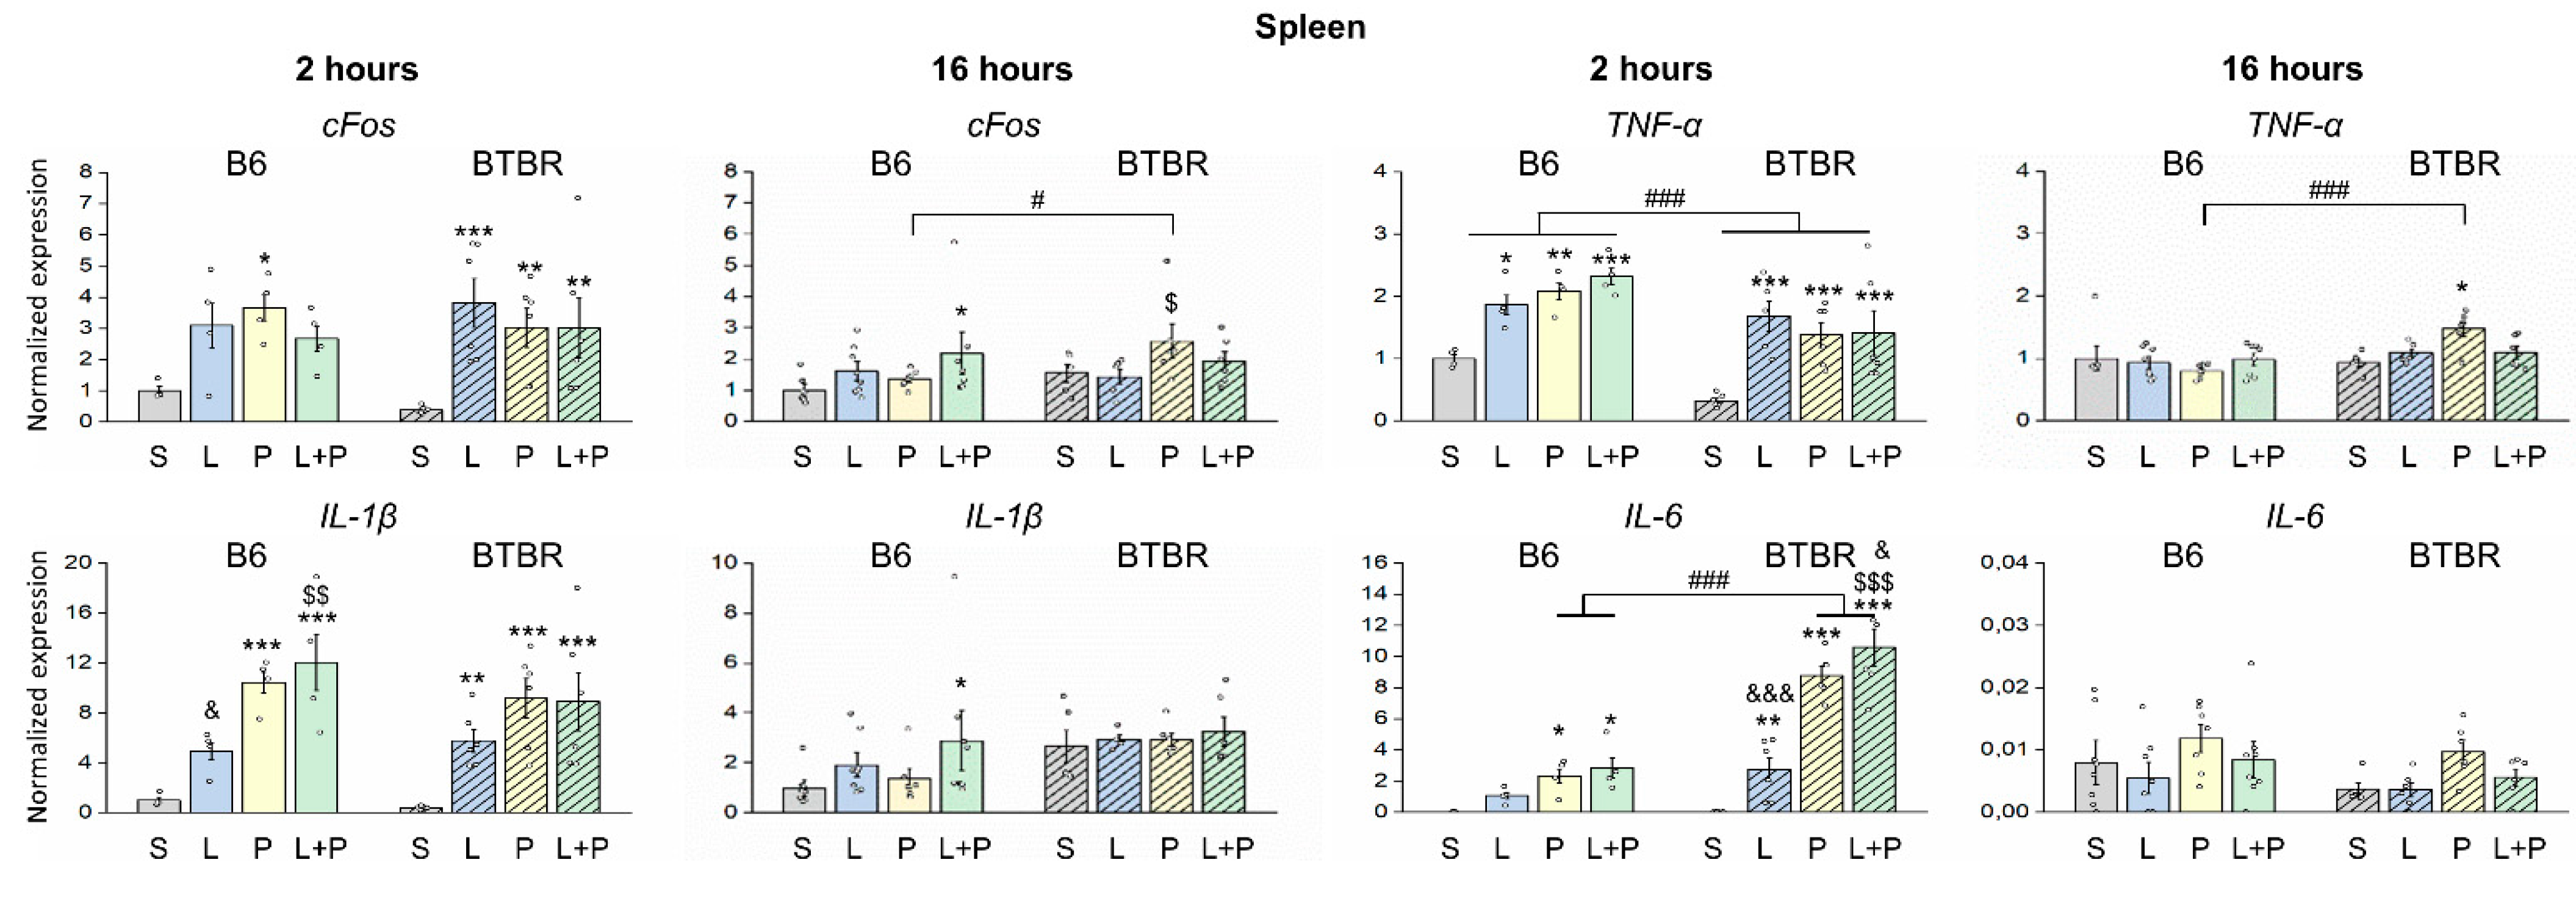
2. Results
Features of a Peripheral Immune Response in BTBR Mice
3. Discussion
4. Materials and Methods
4.1. Animals
4.2. Experimental Design
4.3. Complete Blood Count
4.4. Flow-Cytometric Analysis
4.5. Analysis of Gene Expression
4.6. Statistical Analysis
5. Conclusions
Author Contributions
Funding
Institutional Review Board Statement
Informed Consent Statement
Data Availability Statement
Conflicts of Interest
References
- Besedovsky, H.; del Rey, A.; Sorkin, E.; Da Prada, M.; Burri, R.; Honegger, C. The immune response evokes changes in brain noradrenergic neurons. Science 1983, 221, 564–566. [Google Scholar] [CrossRef] [PubMed]
- Arambula, S.E.; McCarthy, M.M. Neuroendocrine-Immune Crosstalk Shapes Sex-Specific Brain Development. Endocrinology 2020, 161, bqaa055. [Google Scholar] [CrossRef] [PubMed]
- Bilbo, S.D.; Schwarz, J.M. The immune system and developmental programming of brain and behavior. Front. Neuroendocrinol. 2012, 33, 267–286. [Google Scholar] [CrossRef] [PubMed]
- Meltzer, A.; Van de Water, J. The Role of the Immune System in Autism Spectrum Disorder. Neuropsychopharmacol. Off. Publ. Am. Coll. Neuropsychopharmacol. 2017, 42, 284–298. [Google Scholar] [CrossRef] [PubMed]
- Olson, J.K.; Miller, S.D. Microglia initiate central nervous system innate and adaptive immune responses through multiple TLRs. J. Immunol. 2004, 173, 3916–3924. [Google Scholar] [CrossRef] [PubMed]
- Jyonouchi, H.; Sun, S.; Le, H. Proinflammatory and regulatory cytokine production associated with innate and adaptive immune responses in children with autism spectrum disorders and developmental regression. J. Neuroimmunol. 2001, 120, 170–179. [Google Scholar] [CrossRef] [PubMed]
- Toscano, C.V.A.; Barros, L.; Lima, A.B.; Nunes, T.; Carvalho, H.M.; Gaspar, J.M. Neuroinflammation in autism spectrum disorders: Exercise as a “pharmacological” tool. Neurosci. Biobehav. Rev. 2021, 129, 63–74. [Google Scholar] [CrossRef]
- Vargas, D.L.; Nascimbene, C.; Krishnan, C.; Zimmerman, A.W.; Pardo, C.A. Neuroglial activation and neuroinflammation in the brain of patients with autism. Ann. Neurol. 2005, 57, 67–81. [Google Scholar] [CrossRef]
- Khantakova, J.N.; Bondar, N.; Antontseva, E.V.; Reshetnikov, V.V. Once induced, it lasts for a long time: The structural and molecular signatures associated with depressive-like behavior after neonatal immune activation. Front. Cell. Neurosci. 2022. [Google Scholar] [CrossRef]
- Kumar, V. Toll-like receptors in the pathogenesis of neuroinflammation. J. Neuroimmunol. 2019, 332, 16–30. [Google Scholar] [CrossRef]
- Han, V.X.; Jones, H.F.; Patel, S.; Mohammad, S.S.; Hofer, M.J.; Alshammery, S.; Maple-Brown, E.; Gold, W.; Brilot, F.; Dale, R.C. Emerging evidence of Toll-like receptors as a putative pathway linking maternal inflammation and neurodevelopmental disorders in human offspring: A systematic review. Brain Behav. Immun. 2022, 99, 91–105. [Google Scholar] [CrossRef]
- Cameron, J.S.; Alexopoulou, L.; Sloane, J.A.; DiBernardo, A.B.; Ma, Y.; Kosaras, B.; Flavell, R.; Strittmatter, S.M.; Volpe, J.; Sidman, R.; et al. Toll-like receptor 3 is a potent negative regulator of axonal growth in mammals. J. Neurosci. Off. J. Soc. Neurosci. 2007, 27, 13033–13041. [Google Scholar] [CrossRef] [PubMed]
- Chen, C.Y.; Liu, H.Y.; Hsueh, Y.P. TLR3 downregulates expression of schizophrenia gene Disc1 via MYD88 to control neuronal morphology. EMBO Rep. 2017, 18, 169–183. [Google Scholar] [CrossRef] [PubMed]
- Hung, Y.F.; Chen, C.Y.; Shih, Y.C.; Liu, H.Y.; Huang, C.M.; Hsueh, Y.P. Endosomal TLR3, TLR7, and TLR8 control neuronal morphology through different transcriptional programs. J. Cell Biol. 2018, 217, 2727–2742. [Google Scholar] [CrossRef] [PubMed]
- Lathia, J.D.; Okun, E.; Tang, S.C.; Griffioen, K.; Cheng, A.; Mughal, M.R.; Laryea, G.; Selvaraj, P.K.; ffrench-Constant, C.; Magnus, T.; et al. Toll-like receptor 3 is a negative regulator of embryonic neural progenitor cell proliferation. J. Neurosci. Off. J. Soc. Neurosci. 2008, 28, 13978–13984. [Google Scholar] [CrossRef] [PubMed]
- Okun, E.; Griffioen, K.J.; Mattson, M.P. Toll-like receptor signaling in neural plasticity and disease. Trends Neurosci. 2011, 34, 269–281. [Google Scholar] [CrossRef] [PubMed]
- Rolls, A.; Shechter, R.; London, A.; Ziv, Y.; Ronen, A.; Levy, R.; Schwartz, M. Toll-like receptors modulate adult hippocampal neurogenesis. Nat. Cell Biol. 2007, 9, 1081–1088. [Google Scholar] [CrossRef]
- Arai, H.; Furuya, T.; Yasuda, T.; Miura, M.; Mizuno, Y.; Mochizuki, H. Neurotoxic effects of lipopolysaccharide on nigral dopaminergic neurons are mediated by microglial activation, interleukin-1beta, and expression of caspase-11 in mice. J. Biol. Chem. 2004, 279, 51647–51653. [Google Scholar] [CrossRef]
- Caso, J.R.; Pradillo, J.M.; Hurtado, O.; Leza, J.C.; Moro, M.A.; Lizasoain, I. Toll-like receptor 4 is involved in subacute stress-induced neuroinflammation and in the worsening of experimental stroke. Stroke 2008, 39, 1314–1320. [Google Scholar] [CrossRef]
- Meyza, K.Z.; Defensor, E.B.; Jensen, A.L.; Corley, M.J.; Pearson, B.L.; Pobbe, R.L.; Bolivar, V.J.; Blanchard, D.C.; Blanchard, R.J. The BTBR T+ tf/J mouse model for autism spectrum disorders-in search of biomarkers. Behav. Brain Res. 2013, 251, 25–34. [Google Scholar] [CrossRef]
- Reshetnikov, V.V.; Ayriyants, K.A.; Ryabushkina, Y.A.; Sozonov, N.G.; Bondar, N.P. Sex-specific behavioral and structural alterations caused by early-life stress in C57BL/6 and BTBR mice. Behav. Brain Res. 2021, 414, 113489. [Google Scholar] [CrossRef] [PubMed]
- Ahmad, S.F.; Zoheir, K.M.A.; Ansari, M.A.; Nadeem, A.; Bakheet, S.A.; Al-Ayadhi, L.Y.; Alzahrani, M.Z.; Al-Shabanah, O.A.; Al-Harbi, M.M.; Attia, S.M. Dysregulation of Th1, Th2, Th17, and T regulatory cell-related transcription factor signaling in children with autism. Mol. Neurobiol. 2017, 54, 4390–4400. [Google Scholar] [CrossRef] [PubMed]
- Li, X.; Chauhan, A.; Sheikh, A.M.; Patil, S.; Chauhan, V.; Li, X.M.; Ji, L.; Brown, T.; Malik, M. Elevated immune response in the brain of autistic patients. J. Neuroimmunol. 2009, 207, 111–116. [Google Scholar] [CrossRef] [PubMed]
- Careaga, M.; Schwartzer, J.; Ashwood, P. Inflammatory profiles in the BTBR mouse: How relevant are they to autism spectrum disorders? Brain Behav. Immun. 2015, 43, 11–16. [Google Scholar] [CrossRef]
- Heo, Y.; Zhang, Y.; Gao, D.; Miller, V.M.; Lawrence, D.A. Aberrant immune responses in a mouse with behavioral disorders. PLoS ONE 2011, 6, e20912. [Google Scholar] [CrossRef]
- Bakheet, S.A.; Alzahrani, M.Z.; Ansari, M.A.; Nadeem, A.; Zoheir, K.M.A.; Attia, S.M.; Al-Ayadhi, L.Y.; Ahmad, S.F. Resveratrol Ameliorates Dysregulation of Th1, Th2, Th17, and T Regulatory Cell-Related Transcription Factor Signaling in a BTBR T + tf/J Mouse Model of Autism. Mol. Neurobiol. 2017, 54, 5201–5212. [Google Scholar] [CrossRef]
- Schwartzer, J.J.; Onore, C.E.; Rose, D.; Ashwood, P. C57BL/6J bone marrow transplant increases sociability in BTBR T(+) Itpr3(tf)/J mice. Brain Behav. Immun. 2017, 59, 55–61. [Google Scholar] [CrossRef]
- Jones-Davis, D.M.; Yang, M.; Rider, E.; Osbun, N.C.; da Gente, G.J.; Li, J.; Katz, A.M.; Weber, M.D.; Sen, S.; Crawley, J.; et al. Quantitative trait loci for interhemispheric commissure development and social behaviors in the BTBR T(+) tf/J mouse model of autism. PLoS ONE 2013, 8, e61829. [Google Scholar] [CrossRef]
- Hare, B.D.; Duman, R.S. Prefrontal cortex circuits in depression and anxiety: Contribution of discrete neuronal populations and target regions. Mol. Psychiatry 2020, 25, 2742–2758. [Google Scholar] [CrossRef]
- Bekhbat, M.; Treadway, M.T.; Felger, J.C. Inflammation as a Pathophysiologic Pathway to Anhedonia: Mechanisms and Therapeutic Implications. Curr. Top. Behav. Neurosci. 2022, 58, 397–419. [Google Scholar] [CrossRef]
- Cernackova, A.; Durackova, Z.; Trebaticka, J.; Mravec, B. Neuroinflammation and depressive disorder: The role of the hypothalamus. J. Clin. Neurosci. Off. J. Neurosurg. Soc. Australas. 2020, 75, 5–10. [Google Scholar] [CrossRef] [PubMed]
- Rahman, M.H.; Bhusal, A.; Lee, W.H.; Lee, I.K.; Suk, K. Hypothalamic inflammation and malfunctioning glia in the pathophysiology of obesity and diabetes: Translational significance. Biochem. Pharmacol. 2018, 153, 123–133. [Google Scholar] [CrossRef] [PubMed]
- Goldstein, D.S.; Kopin, I.J. Homeostatic systems, biocybernetics, and autonomic neuroscience. Auton. Neurosci. Basic Clin. 2017, 208, 15–28. [Google Scholar] [CrossRef] [PubMed]
- Tuzlak, S.; Dejean, A.S.; Iannacone, M.; Quintana, F.J.; Waisman, A.; Ginhoux, F.; Korn, T.; Becher, B. Repositioning TH cell polarization from single cytokines to complex help. Nat. Immunol. 2021, 22, 1210–1217. [Google Scholar] [CrossRef] [PubMed]
- Lasselin, J.; Schedlowski, M.; Karshikoff, B.; Engler, H.; Lekander, M.; Konsman, J.P. Comparison of bacterial lipopolysaccharide-induced sickness behavior in rodents and humans: Relevance for symptoms of anxiety and depression. Neurosci. Biobehav. Rev. 2020, 115, 15–24. [Google Scholar] [CrossRef] [PubMed]
- Biesmans, S.; Meert, T.F.; Bouwknecht, J.A.; Acton, P.D.; Davoodi, N.; De Haes, P.; Kuijlaars, J.; Langlois, X.; Matthews, L.J.; Ver Donck, L.; et al. Systemic immune activation leads to neuroinflammation and sickness behavior in mice. Mediat. Inflamm. 2013, 2013, 271359. [Google Scholar] [CrossRef] [PubMed]
- Hoogland, I.C.; Houbolt, C.; van Westerloo, D.J.; van Gool, W.A.; van de Beek, D. Systemic inflammation and microglial activation: Systematic review of animal experiments. J. Neuroinflamm. 2015, 12, 114. [Google Scholar] [CrossRef]
- Akira, S.; Uematsu, S.; Takeuchi, O. Pathogen recognition and innate immunity. Cell 2006, 124, 783–801. [Google Scholar] [CrossRef]
- Kato, H.; Takeuchi, O.; Mikamo-Satoh, E.; Hirai, R.; Kawai, T.; Matsushita, K.; Hiiragi, A.; Dermody, T.S.; Fujita, T.; Akira, S. Length-dependent recognition of double-stranded ribonucleic acids by retinoic acid-inducible gene-I and melanoma differentiation-associated gene 5. J. Exp. Med. 2008, 205, 1601–1610. [Google Scholar] [CrossRef]
- Kawai, T.; Akira, S. The role of pattern-recognition receptors in innate immunity: Update on Toll-like receptors. Nat. Immunol. 2010, 11, 373–384. [Google Scholar] [CrossRef]
- Napolitani, G.; Rinaldi, A.; Bertoni, F.; Sallusto, F.; Lanzavecchia, A. Selected Toll-like receptor agonist combinations synergistically trigger a T helper type 1-polarizing program in dendritic cells. Nat. Immunol. 2005, 6, 769–776. [Google Scholar] [CrossRef] [PubMed]
- Ruiz, J.; Kanagavelu, S.; Flores, C.; Romero, L.; Riveron, R.; Shih, D.Q.; Fukata, M. Systemic Activation of TLR3-Dependent TRIF Signaling Confers Host Defense against Gram-Negative Bacteria in the Intestine. Front. Cell. Infect. Microbiol. 2015, 5, 105. [Google Scholar] [CrossRef] [PubMed]
- Kurt-Jones, E.A.; Popova, L.; Kwinn, L.; Haynes, L.M.; Jones, L.P.; Tripp, R.A.; Walsh, E.E.; Freeman, M.W.; Golenbock, D.T.; Anderson, L.J.; et al. Pattern recognition receptors TLR4 and CD14 mediate response to respiratory syncytial virus. Nat. Immunol. 2000, 1, 398–401. [Google Scholar] [CrossRef] [PubMed]
- Monguio-Tortajada, M.; Franquesa, M.; Sarrias, M.R.; Borras, F.E. Low doses of LPS exacerbate the inflammatory response and trigger death on TLR3-primed human monocytes. Cell Death Dis. 2018, 9, 499. [Google Scholar] [CrossRef]
- Bagchi, A.; Herrup, E.A.; Warren, H.S.; Trigilio, J.; Shin, H.S.; Valentine, C.; Hellman, J. MyD88-dependent and MyD88-independent pathways in synergy, priming, and tolerance between TLR agonists. J. Immunol. 2007, 178, 1164–1171. [Google Scholar] [CrossRef]
- Butovsky, O.; Jedrychowski, M.P.; Moore, C.S.; Cialic, R.; Lanser, A.J.; Gabriely, G.; Koeglsperger, T.; Dake, B.; Wu, P.M.; Doykan, C.E.; et al. Identification of a unique TGF-beta-dependent molecular and functional signature in microglia. Nat. Neurosci. 2014, 17, 131–143. [Google Scholar] [CrossRef]
- Das, A.; Kim, S.H.; Arifuzzaman, S.; Yoon, T.; Chai, J.C.; Lee, Y.S.; Park, K.S.; Jung, K.H.; Chai, Y.G. Transcriptome sequencing reveals that LPS-triggered transcriptional responses in established microglia BV2 cell lines are poorly representative of primary microglia. J. Neuroinflamm. 2016, 13, 182. [Google Scholar] [CrossRef]
- Stansley, B.; Post, J.; Hensley, K. A comparative review of cell culture systems for the study of microglial biology in Alzheimer’s disease. J. Neuroinflamm. 2012, 9, 115. [Google Scholar] [CrossRef]
- Bao, M.; Hofsink, N.; PLoSch, T. LPS versus Poly I:C model: Comparison of long-term effects of bacterial and viral maternal immune activation on the offspring. Am. J. Physiol. Regul. Integr. Comp. Physiol. 2022, 322, R99–R111. [Google Scholar] [CrossRef]
- Khantakova, J.N.; Bondar, N.P.; Sapronova, A.A.; Reshetnikov, V.V. Delayed effects of neonatal immune activation on brain neurochemistry and hypothalamic-pituitary-adrenal axis functioning. Eur. J. Neurosci. 2022. [Google Scholar] [CrossRef]
- Owen, A.M.; Fults, J.B.; Patil, N.K.; Hernandez, A.; Bohannon, J.K. TLR Agonists as Mediators of Trained Immunity: Mechanistic Insight and Immunotherapeutic Potential to Combat Infection. Front. Immunol. 2020, 11, 622614. [Google Scholar] [CrossRef] [PubMed]
- Adhikarla, S.V.; Jha, N.K.; Goswami, V.K.; Sharma, A.; Bhardwaj, A.; Dey, A.; Villa, C.; Kumar, Y.; Jha, S.K. TLR-Mediated Signal Transduction and Neurodegenerative Disorders. Brain Sci. 2021, 11, 1373. [Google Scholar] [CrossRef] [PubMed]
- de Pablo, Y.; Nilsson, M.; Pekna, M.; Pekny, M. Intermediate filaments are important for astrocyte response to oxidative stress induced by oxygen-glucose deprivation and reperfusion. Histochem. Cell Biol. 2013, 140, 81–91. [Google Scholar] [CrossRef]
- Nadeem, A.; Ahmad, S.F.; Al-Harbi, N.O.; Attia, S.M.; Alshammari, M.A.; Alzahrani, K.S.; Bakheet, S.A. Increased oxidative stress in the cerebellum and peripheral immune cells leads to exaggerated autism-like repetitive behavior due to deficiency of antioxidant response in BTBR T+tf/J mice. Prog. Neuro-Psychopharmacol. Biol. Psychiatry 2019, 89, 245–253. [Google Scholar] [CrossRef] [PubMed]
- Milatovic, D.; Zaja-Milatovic, S.; Brockett, M.M.; Breyer, R.M.; Aschner, M.; Montine, T.J. Neuroinflammation and oxidative injury in developmental neurotoxicity. In Reproductive and Developmental Toxicology, 3rd ed.; Academic Press: Cambridge, MA, USA, 2022. [Google Scholar]
- Cunningham, C.; Campion, S.; Teeling, J.; Felton, L.; Perry, V.H. The sickness behaviour and CNS inflammatory mediator profile induced by systemic challenge of mice with synthetic double-stranded RNA (poly I:C). Brain Behav. Immun. 2007, 21, 490–502. [Google Scholar] [CrossRef] [PubMed]
- Murray, C.; Griffin, E.W.; O’Loughlin, E.; Lyons, A.; Sherwin, E.; Ahmed, S.; Stevenson, N.J.; Harkin, A.; Cunningham, C. Interdependent and independent roles of type I interferons and IL-6 in innate immune, neuroinflammatory and sickness behaviour responses to systemic poly I:C. Brain Behav. Immun. 2015, 48, 274–286. [Google Scholar] [CrossRef] [PubMed]
- Gibney, S.M.; McGuinness, B.; Prendergast, C.; Harkin, A.; Connor, T.J. Poly I:C-induced activation of the immune response is accompanied by depression and anxiety-like behaviours, kynurenine pathway activation and reduced BDNF expression. Brain Behav. Immun. 2013, 28, 170–181. [Google Scholar] [CrossRef]
- Guha-Thakurta, N.; Majde, J.A. Early induction of proinflammatory cytokine and type I interferon mRNAs following Newcastle disease virus, poly [rI:rC], or low-dose LPS challenge of the mouse. J. Interferon Cytokine Res. Off. J. Int. Soc. Interferon Cytokine Res. 1997, 17, 197–204. [Google Scholar] [CrossRef]
- Kurilin, V.V.; Khantakova, J.N.; Tereschenko, V.P.; Lopatnikova, J.A.; Obleukhova, I.A.; Sennikov, S.V. The Effects of Immunosuppressive Factors on Primary Dendritic Cells from C57BL/6 and CBA Mice. J. Immunol. Res. 2019, 2019, 7029726. [Google Scholar] [CrossRef]
- Richardson, R.P.; Rhyne, C.D.; Fong, Y.; Hesse, D.G.; Tracey, K.J.; Marano, M.A.; Lowry, S.F.; Antonacci, A.C.; Calvano, S.E. Peripheral blood leukocyte kinetics following in vivo lipopolysaccharide (LPS) administration to normal human subjects. Influence of elicited hormones and cytokines. Ann. Surg. 1989, 210, 239–245. [Google Scholar] [CrossRef]
- Reshetnikov, V.V.; Kisaretova, P.E.; Ershov, N.I.; Merkulova, T.I.; Bondar, N.P. Social defeat stress in adult mice causes alterations in gene expression, alternative splicing, and the epigenetic landscape of H3K4me3 in the prefrontal cortex: An impact of early-life stress. Prog. Neuro-Psychopharmacol. Biol. Psychiatry 2021, 106, 110068. [Google Scholar] [CrossRef] [PubMed]


| Parameters | Time after Injection | Strain | Group | Strain × Group |
|---|---|---|---|---|
| Leukocytes, ×109/L | 2 h | F(1,39) = 10.015 p < 0.01 | F(1,39) = 9.125 p < 0.001 | F(3,36) = 1.650 p > 0.5 |
| 16 h | F(1,45) = 6.571 p < 0.05 | F(1,45) = 17.703 p < 0.001 | F(3,42) = 4.102 p < 0.05 | |
| Lymphocytes, ×109/L | 2 h | F(1,39) = 6.092 p < 0.05 | F(1,39) = 12.675 p < 0.001 | F(3,36) = 2.267 p > 0.5 |
| 16 h | F(1,45) = 0.813 p > 0.5 | F(1,45) = 26.162 p < 0.001 | F(3,42) = 3.746 p < 0.05 | |
| Monocytes, ×109/L | 2 h | F(1,39) = 15.700 p < 0.001 | F(1,39) = 1.689 p > 0.5 | F(3,36) = 2.102 p > 0.5 |
| 16 h | F(1,45) = 14.782 p < 0.001 | F(1,45) = 2.329 p > 0.5 | F(3,42) = 2.130 p > 0.5 | |
| Granulocytes, ×109/L | 2 h | F(1,39) = 11.462 p < 0.01 | F(1,39) = 3.217 p < 0.05 | F(3,36) = 0.508 p > 0.5 |
| 16 h | F(1,45) = 42.792 p < 0.001 | F(1,45) = 2.357 p > 0.5 | F(3,42) = 3.916 p < 0.05 | |
| Platelets, ×109/L | 2 h | F(1,39) = 22.074 p < 0.001 | F(1,39] = 6.260 p < 0.01 | F(3,36) = 3.484 p < 0.05 |
| 16 h | F(1,45) = 1.767 p > 0.5 | F(1,45) = 0.432 p > 0.5 | F(3,42) = 0.408 p > 0.5 | |
| CD45+ % | 2 h | F(1,39) = 20.357 p < 0.001 | F(1,39) = 0.185 p > 0.5 | F(3,36) = 1.134 p > 0.5 |
| 16 h | F(1,43) = 5.077 p < 0.05 | F(1,43) = 16.141 p < 0.001 | F(3,40) = 7.920 p < 0.001 | |
| CD3+ % | 2 h | F(1,39) = 263.534 p < 0.001 | F(1,39) = 5.700 p < 0.01 | F(3,36) = 0.681 p > 0.5 |
| 16 h | F(1,43) = 141.102 p < 0.001 | F(1,43) = 0.323 p > 0.5 | F(3,40) = 1.471 p > 0.5 | |
| CD19+ % | 2 h | F(1,39) = 155.891 p < 0.001 | F(1,39) = 3.597 p < 0.05 | F(3,36) = 0.436 p > 0.5 |
| 16 h | F(1,43) = 223.312 p < 0.001 | F(1,43) = 9.135 p < 0.001 | F(3,40) = 0.648 p > 0.05 | |
| CD8+ % | 2 h | F(1,39) = 172.804 p < 0.001 | F(1,39) = 0.626 p > 0.5 | F(3,36) = 0.266 p > 0.5 |
| 16 h | F(1,43) = 53.095 p < 0.001 | F(1,43) = 12.821 p < 0.001 | F(3,40) = 1.267 p > 0.05 | |
| CD4+ % | 2 h | F(1,39) = 375.799 p < 0.001 | F(1,39) = 0.669 p > 0.5 | F(3,36)= 0.483 p > 0.5 |
| 16 h | F(1,43) = 55.375 p < 0.001 | F(1,43) = 10.173 p < 0.001 | F(3,40) = 0.645 p > 0.05 | |
| CD8+ %/CD4+ % | 2 h | F(1,39) = 130.405 p < 0.001 | F(1,39) = 0.324 p > 0.5 | F(3,36) = 0.073 p > 0.5 |
| 16 h | F(1,43) = 12.385 p < 0.01 | F(1,43) = 3.020 p < 0.05 | F(3,40) = 1.021 p > 0.05 |
| Gene | Sequence 5′→3′ | |
|---|---|---|
| Pik3c3 | Probe | HEX-ACTTGATGGTTGAGTTTCGCTGTGT-BHQ1 |
| For | GGATTGGCTGGACAGATT | |
| Rev | CTCCTTGTCATCGCACTT | |
| Hk1 | Probe | Cy5-CCTTCTCGTTTCCCTGCAAG-BHQ2 |
| For | ACATTGTCTCCTGCATCTCC | |
| Rev | GCTTTGAATCCCTTTGTCCAC | |
| Rab22a | Probe | Cy5-AGCATCGTGTGGCGGTTTGTG-BHQ2 |
| For | GATACGGGTGTGGGTAAATC | |
| Rev | CTGGACAGTCTTGGTCATAAA | |
| cFos | Probe | ROX-CGTCATCCTCCCGCTGCA-BHQ2 |
| For | CGGGTTTCAACGCCGACTA | |
| Rev | TTGGCACTAGAGACGGACAGA | |
| Aif1 | Probe | ROX-AGAGAGGCTGGAGGGGATC-BHQ2 |
| For | GCTTTTGGACTGCTGAAGGC | |
| Rev | GAAGGCTTCAAGTTTGGACG | |
| Gfap | Probe | ROX-GCAAGAGACAGAGGAGTGG-(BHQ-2) |
| For | CCTGAGAGAGATTCGCACTC | |
| Rev | GACTCCAGATCGCAGGTCAAG | |
| TNF | Probe | ROX-CGAGTGACAAGCCTGTAGC-BHQ2 |
| For | CATCAGTTCTATGGCCCAGACCCT | |
| Rev | GCTCCTCCACTTGGTGGTTTGCTA | |
| IL-1β | Probe | ROX-CTGCTTCCAAACCTTTGACCTGG-BHQ2 |
| For | CCTGTTCTTTGAAGTTGACGG | |
| Rev | CTGAAGCTCTTGTTGATGTGC | |
| IL-6 | Probe | ROX-CTGGGAAATCGTGGAAATGAG-BHQ2 |
| For | CAGACCTGTCTATACCACTTCAC | |
| Rev | GGTACTCCAGAAGACCAGAGG | |
Publisher’s Note: MDPI stays neutral with regard to jurisdictional claims in published maps and institutional affiliations. |
© 2022 by the authors. Licensee MDPI, Basel, Switzerland. This article is an open access article distributed under the terms and conditions of the Creative Commons Attribution (CC BY) license (https://creativecommons.org/licenses/by/4.0/).
Share and Cite
Mutovina, A.; Ayriyants, K.; Mezhlumyan, E.; Ryabushkina, Y.; Litvinova, E.; Bondar, N.; Khantakova, J.; Reshetnikov, V. Unique Features of the Immune Response in BTBR Mice. Int. J. Mol. Sci. 2022, 23, 15577. https://doi.org/10.3390/ijms232415577
Mutovina A, Ayriyants K, Mezhlumyan E, Ryabushkina Y, Litvinova E, Bondar N, Khantakova J, Reshetnikov V. Unique Features of the Immune Response in BTBR Mice. International Journal of Molecular Sciences. 2022; 23(24):15577. https://doi.org/10.3390/ijms232415577
Chicago/Turabian StyleMutovina, Anastasia, Kseniya Ayriyants, Eva Mezhlumyan, Yulia Ryabushkina, Ekaterina Litvinova, Natalia Bondar, Julia Khantakova, and Vasiliy Reshetnikov. 2022. "Unique Features of the Immune Response in BTBR Mice" International Journal of Molecular Sciences 23, no. 24: 15577. https://doi.org/10.3390/ijms232415577
APA StyleMutovina, A., Ayriyants, K., Mezhlumyan, E., Ryabushkina, Y., Litvinova, E., Bondar, N., Khantakova, J., & Reshetnikov, V. (2022). Unique Features of the Immune Response in BTBR Mice. International Journal of Molecular Sciences, 23(24), 15577. https://doi.org/10.3390/ijms232415577