
Isolation of TTF-1 Positive Circulating Tumor Cells for Single-Cell Sequencing by Using an Automatic Platform Based on Microfluidic Devices

 , , ,
, , , 
Abstract
:1. Introduction
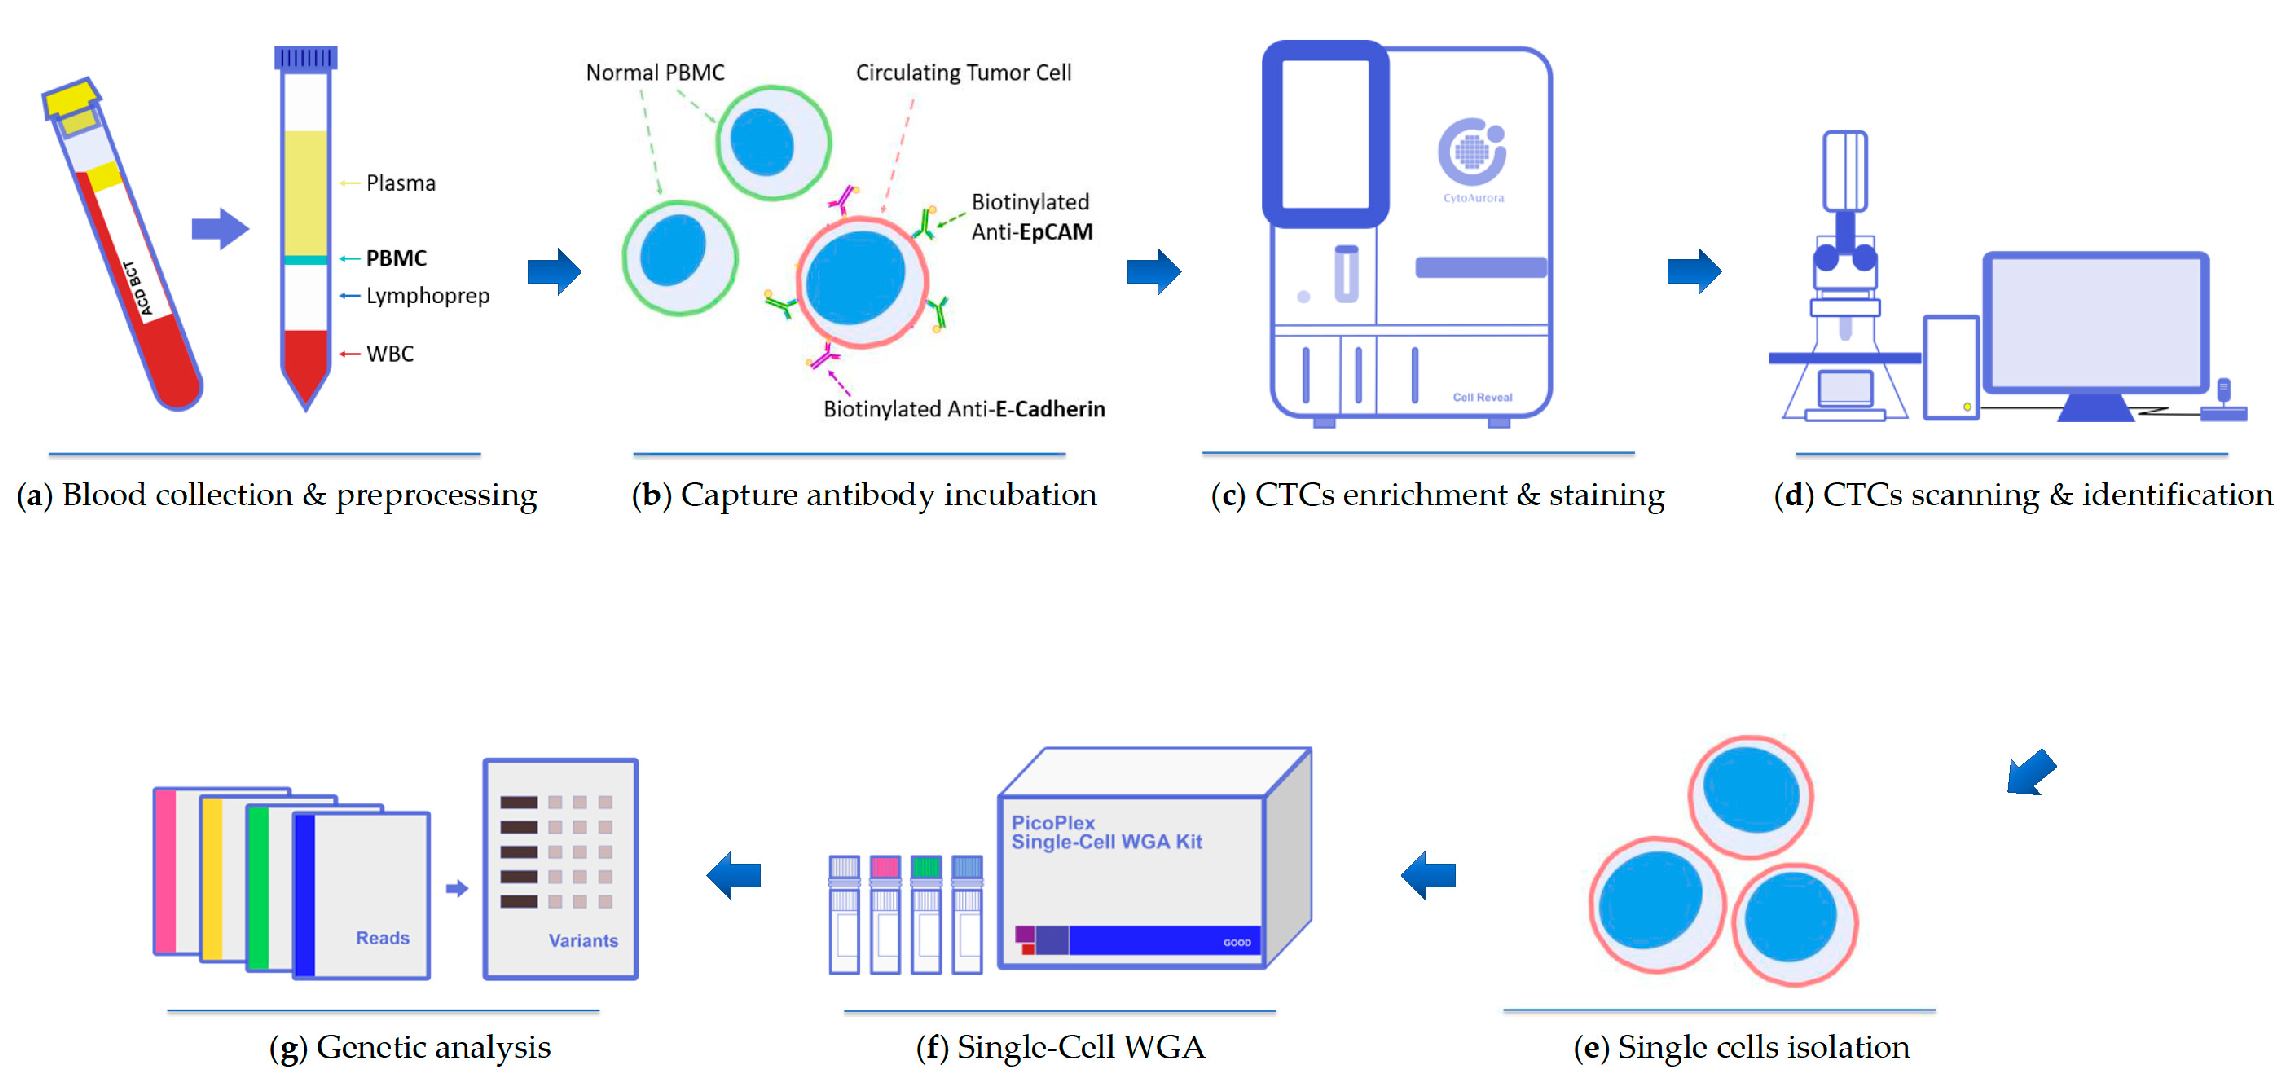
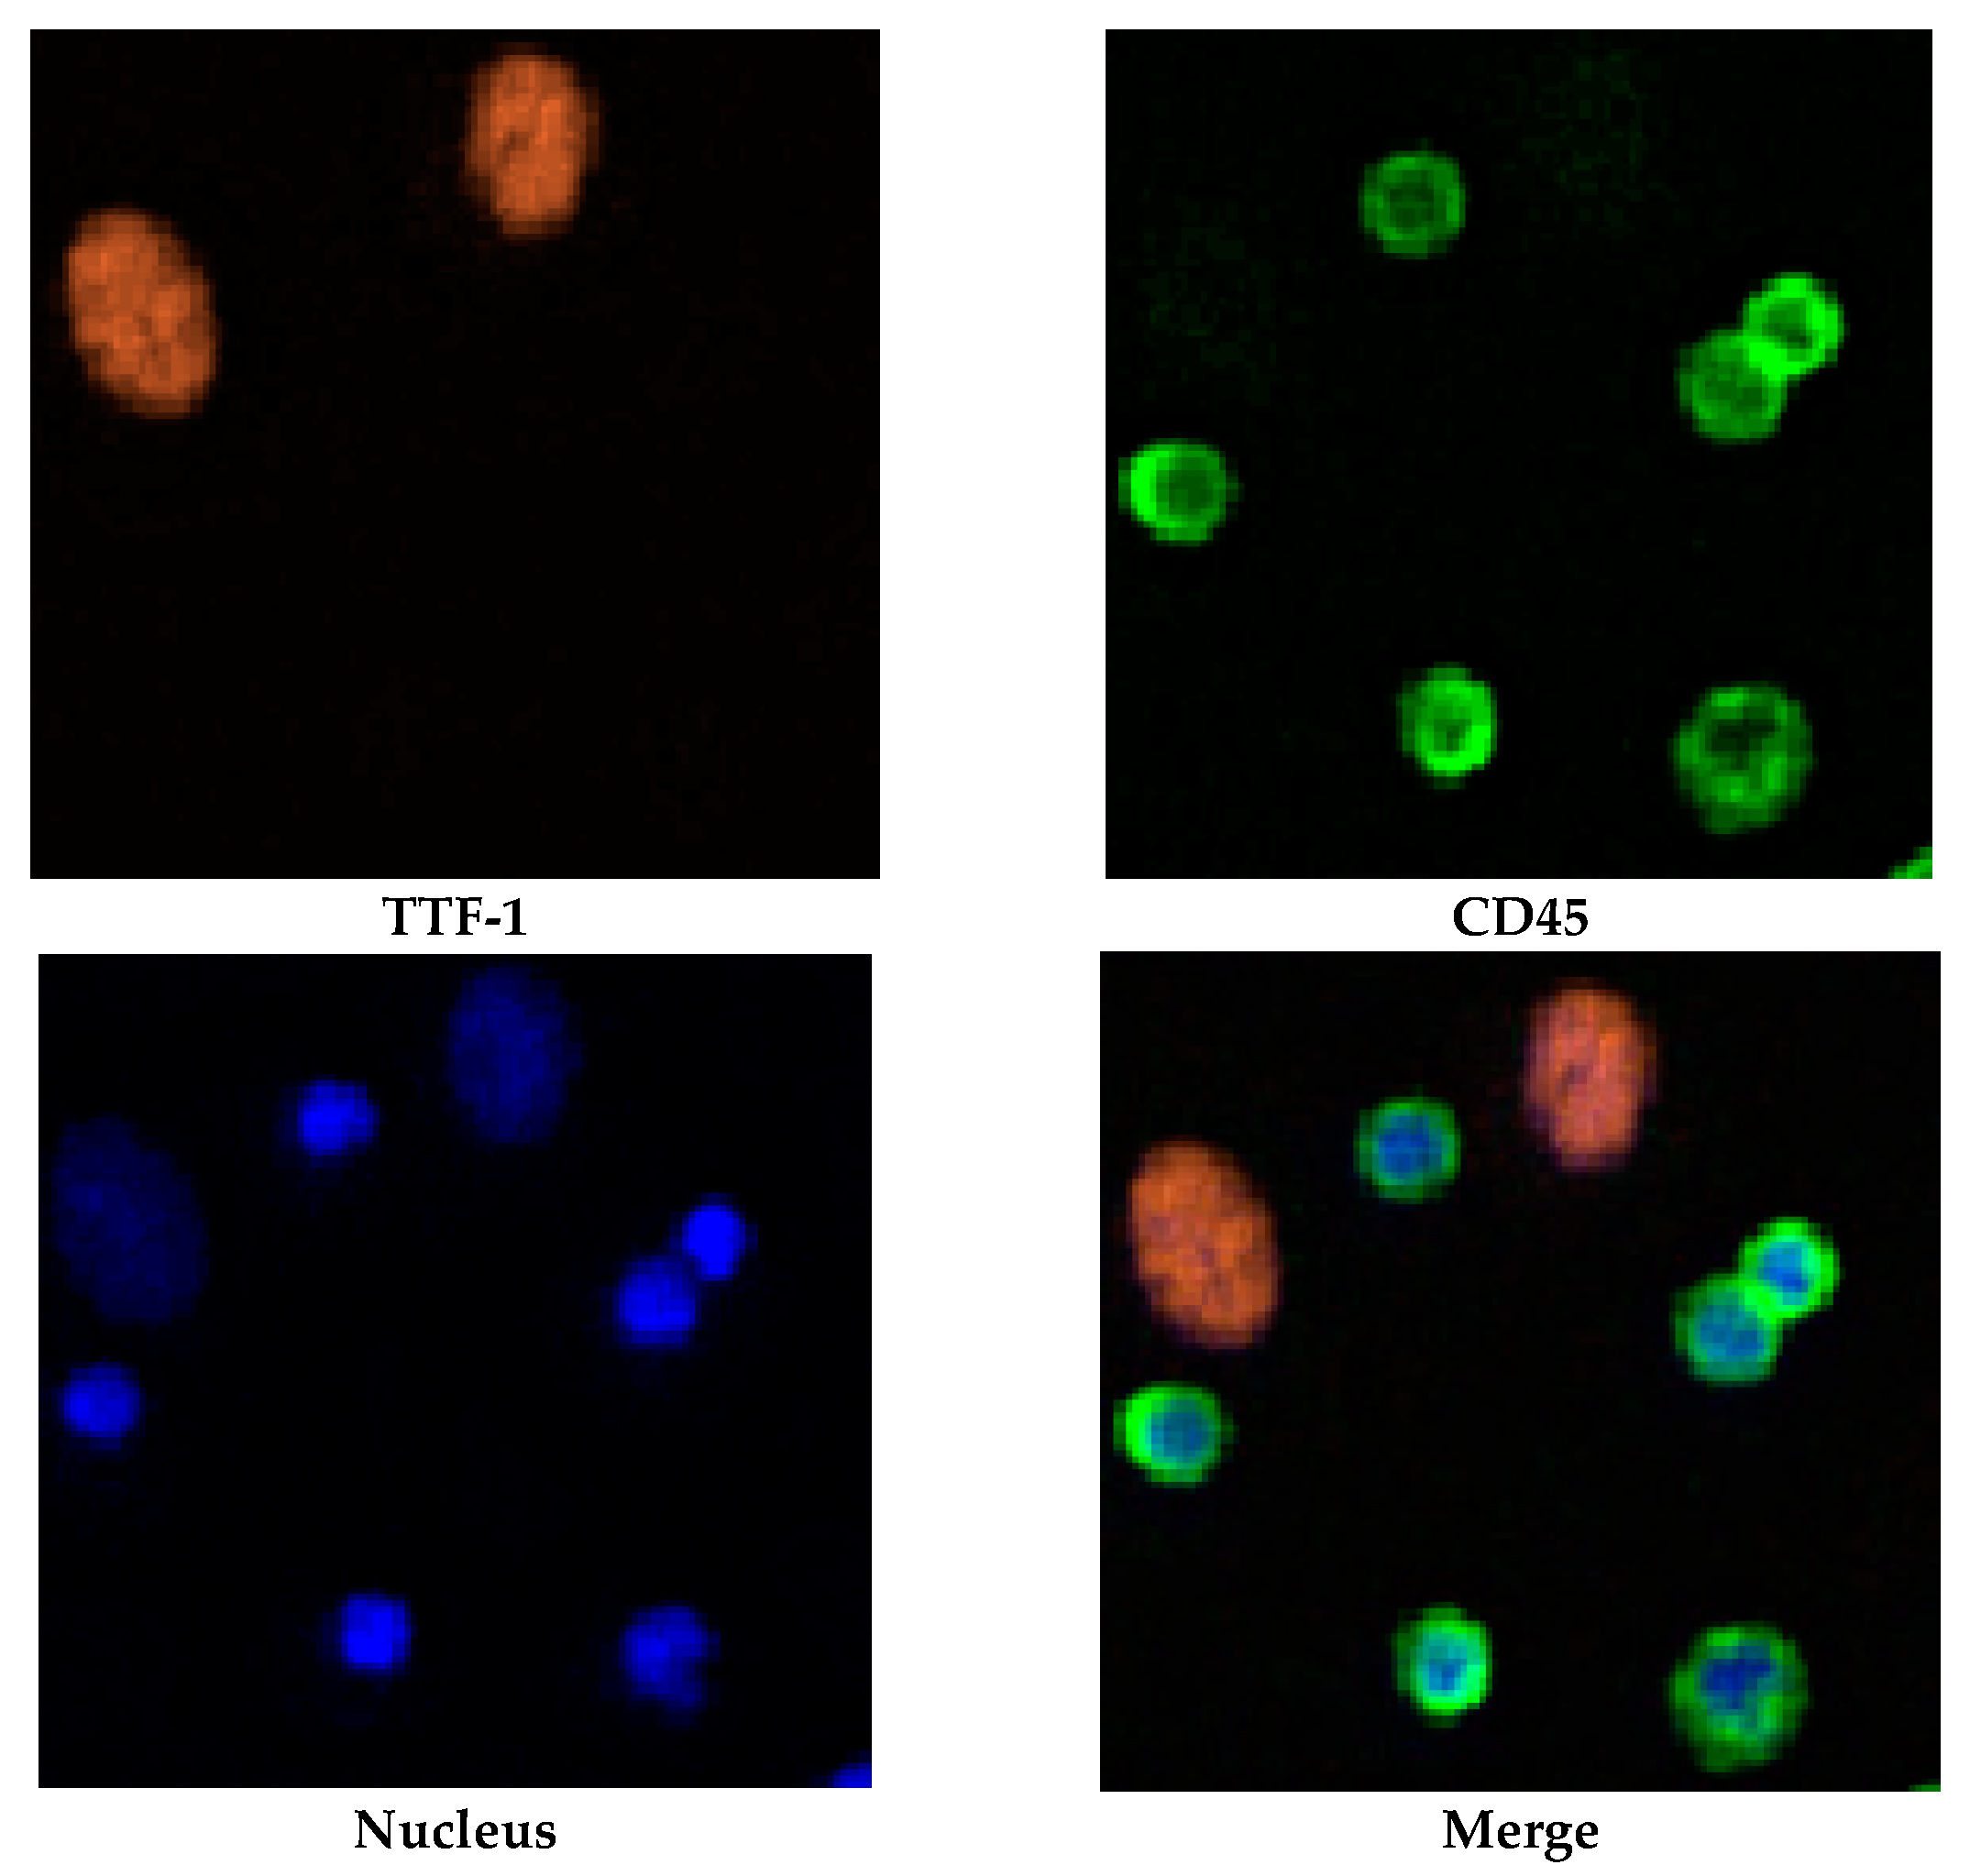
2. Results
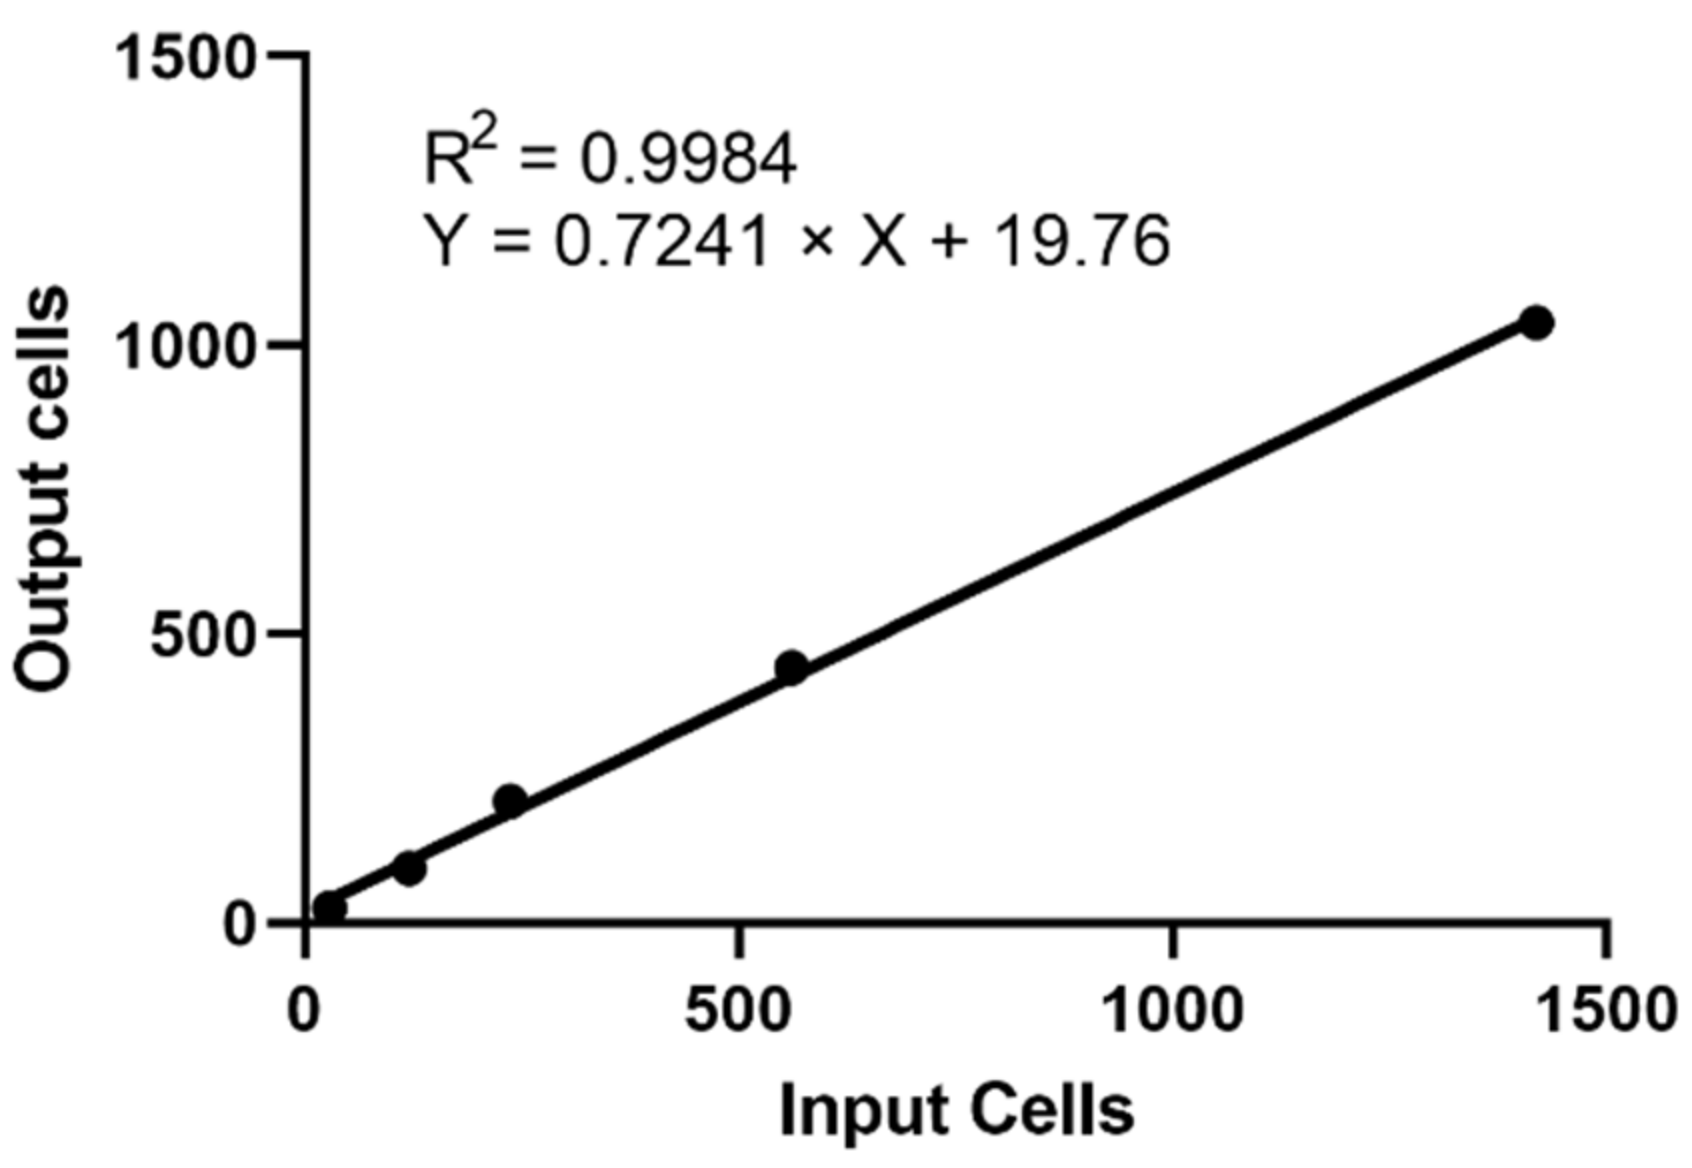
2.1. Recovery Rate and Linearity of Cell RevealTM System
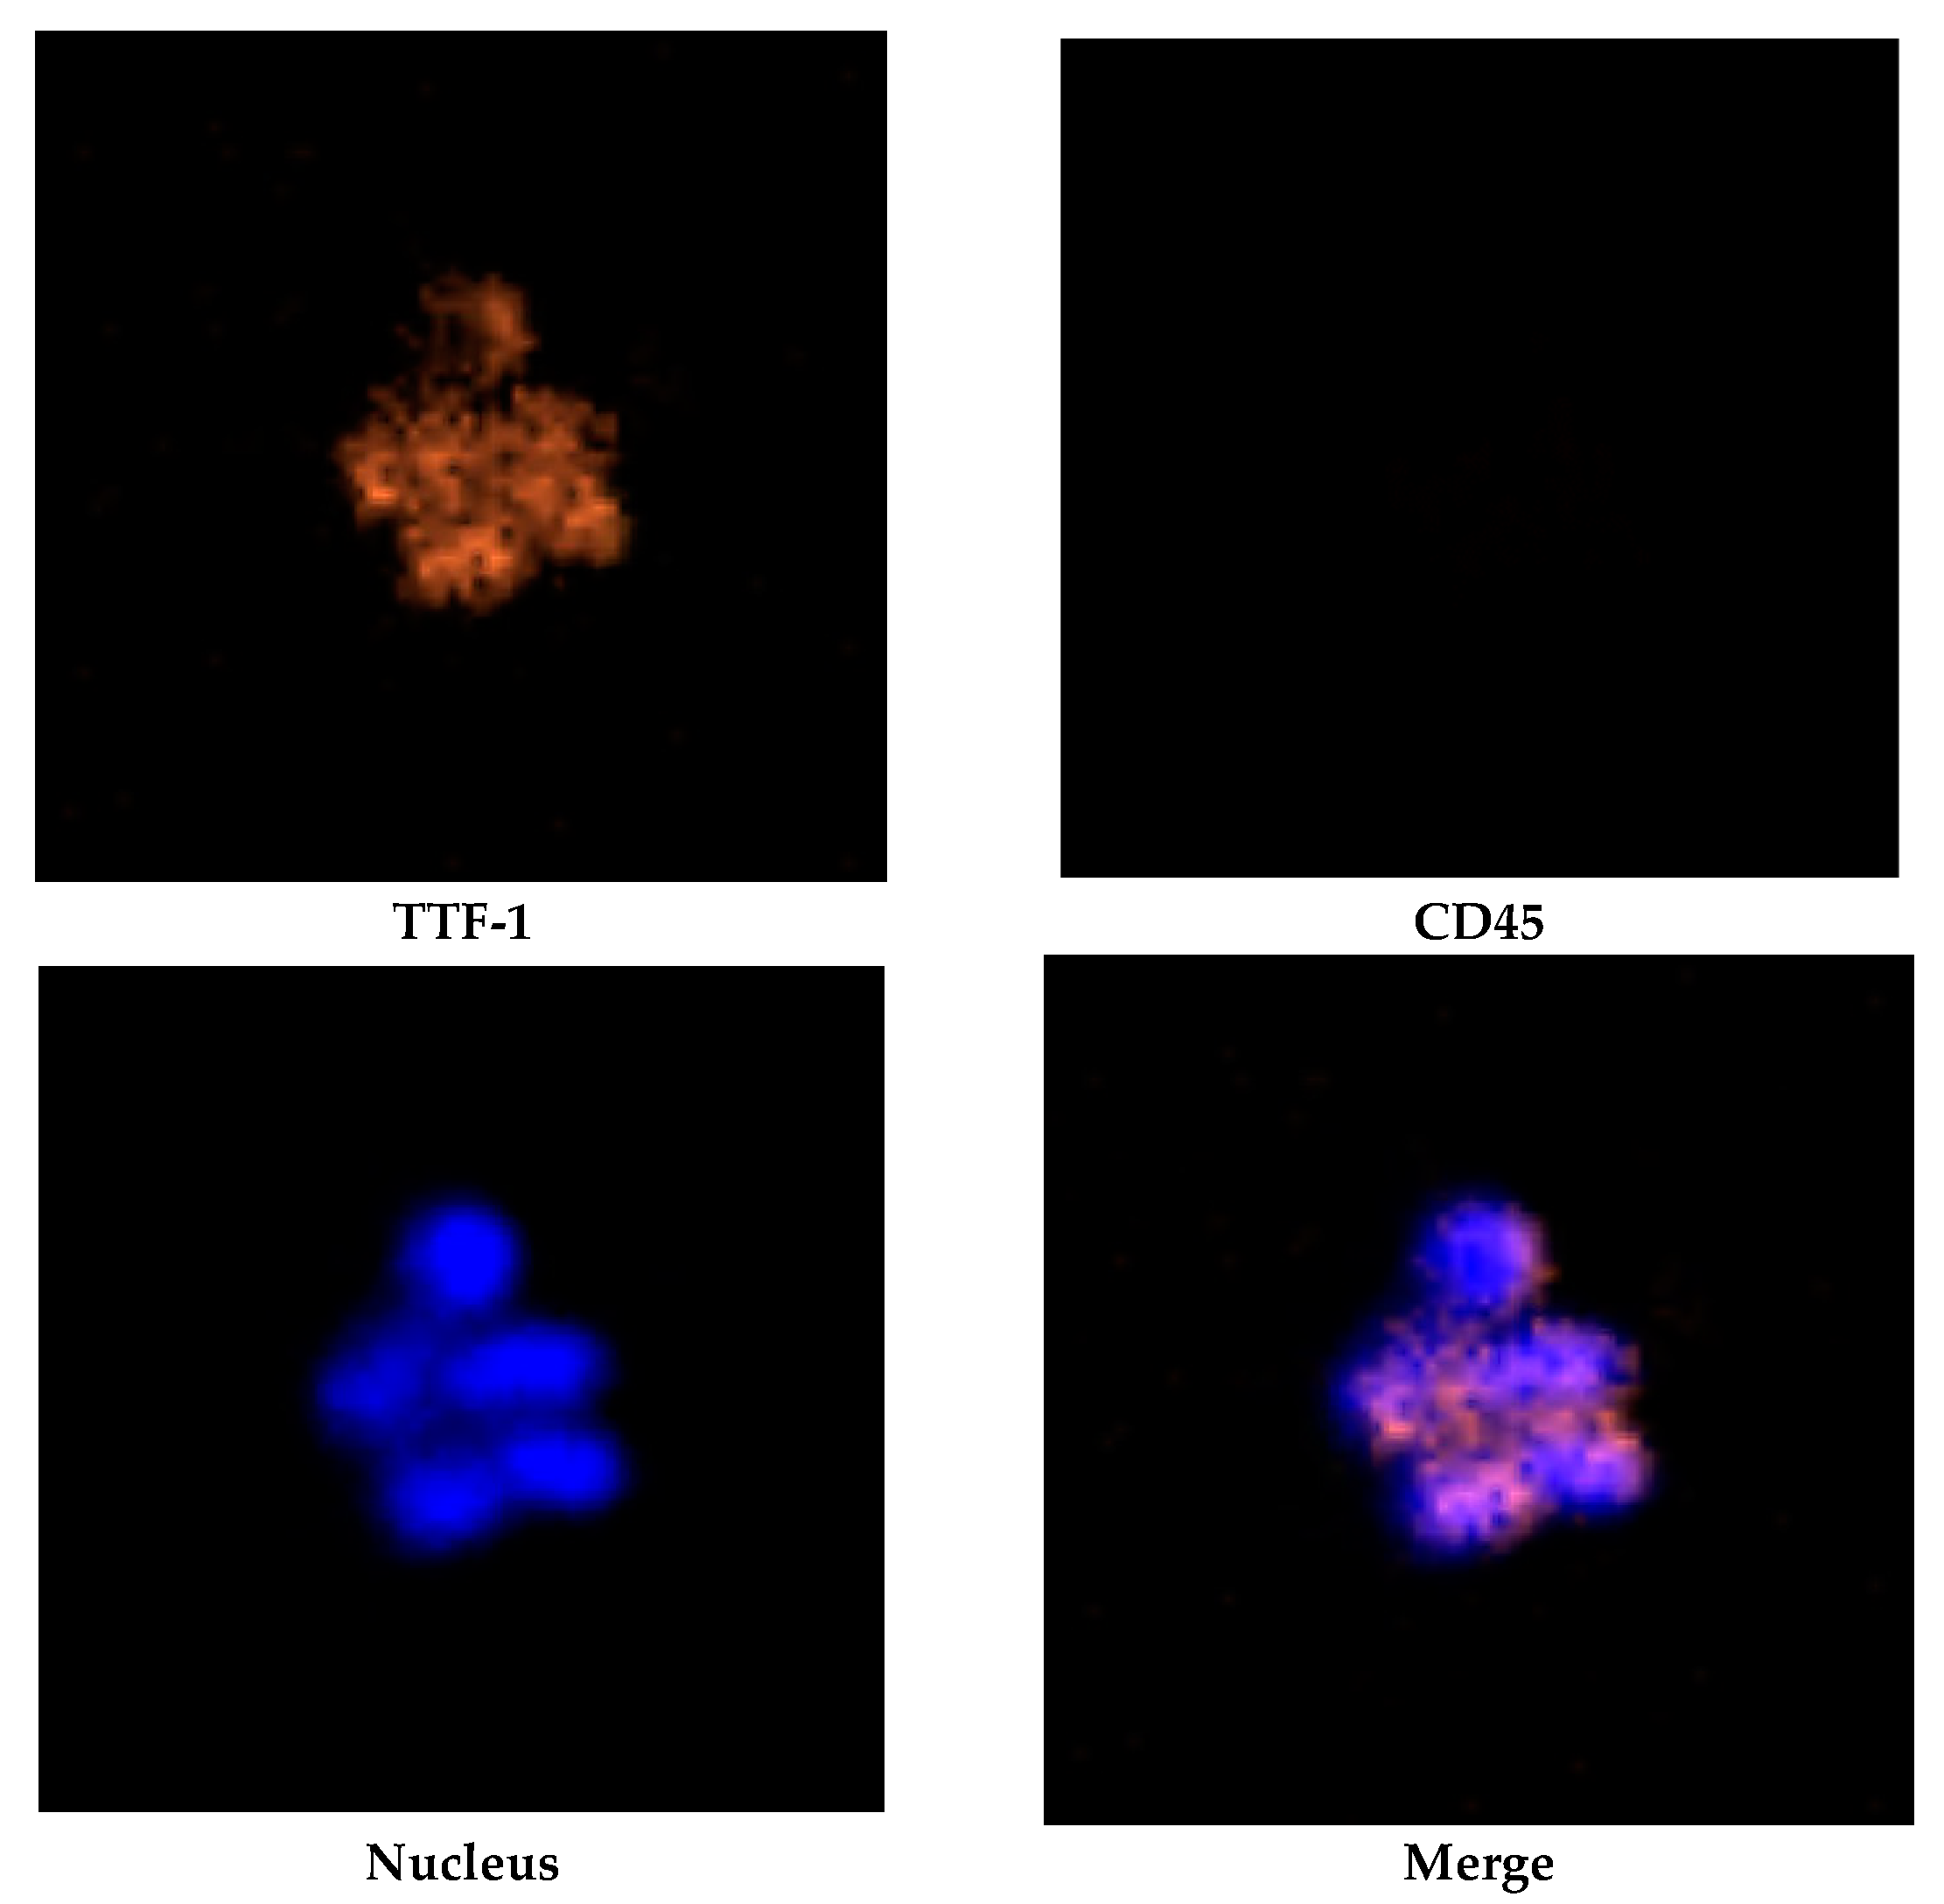
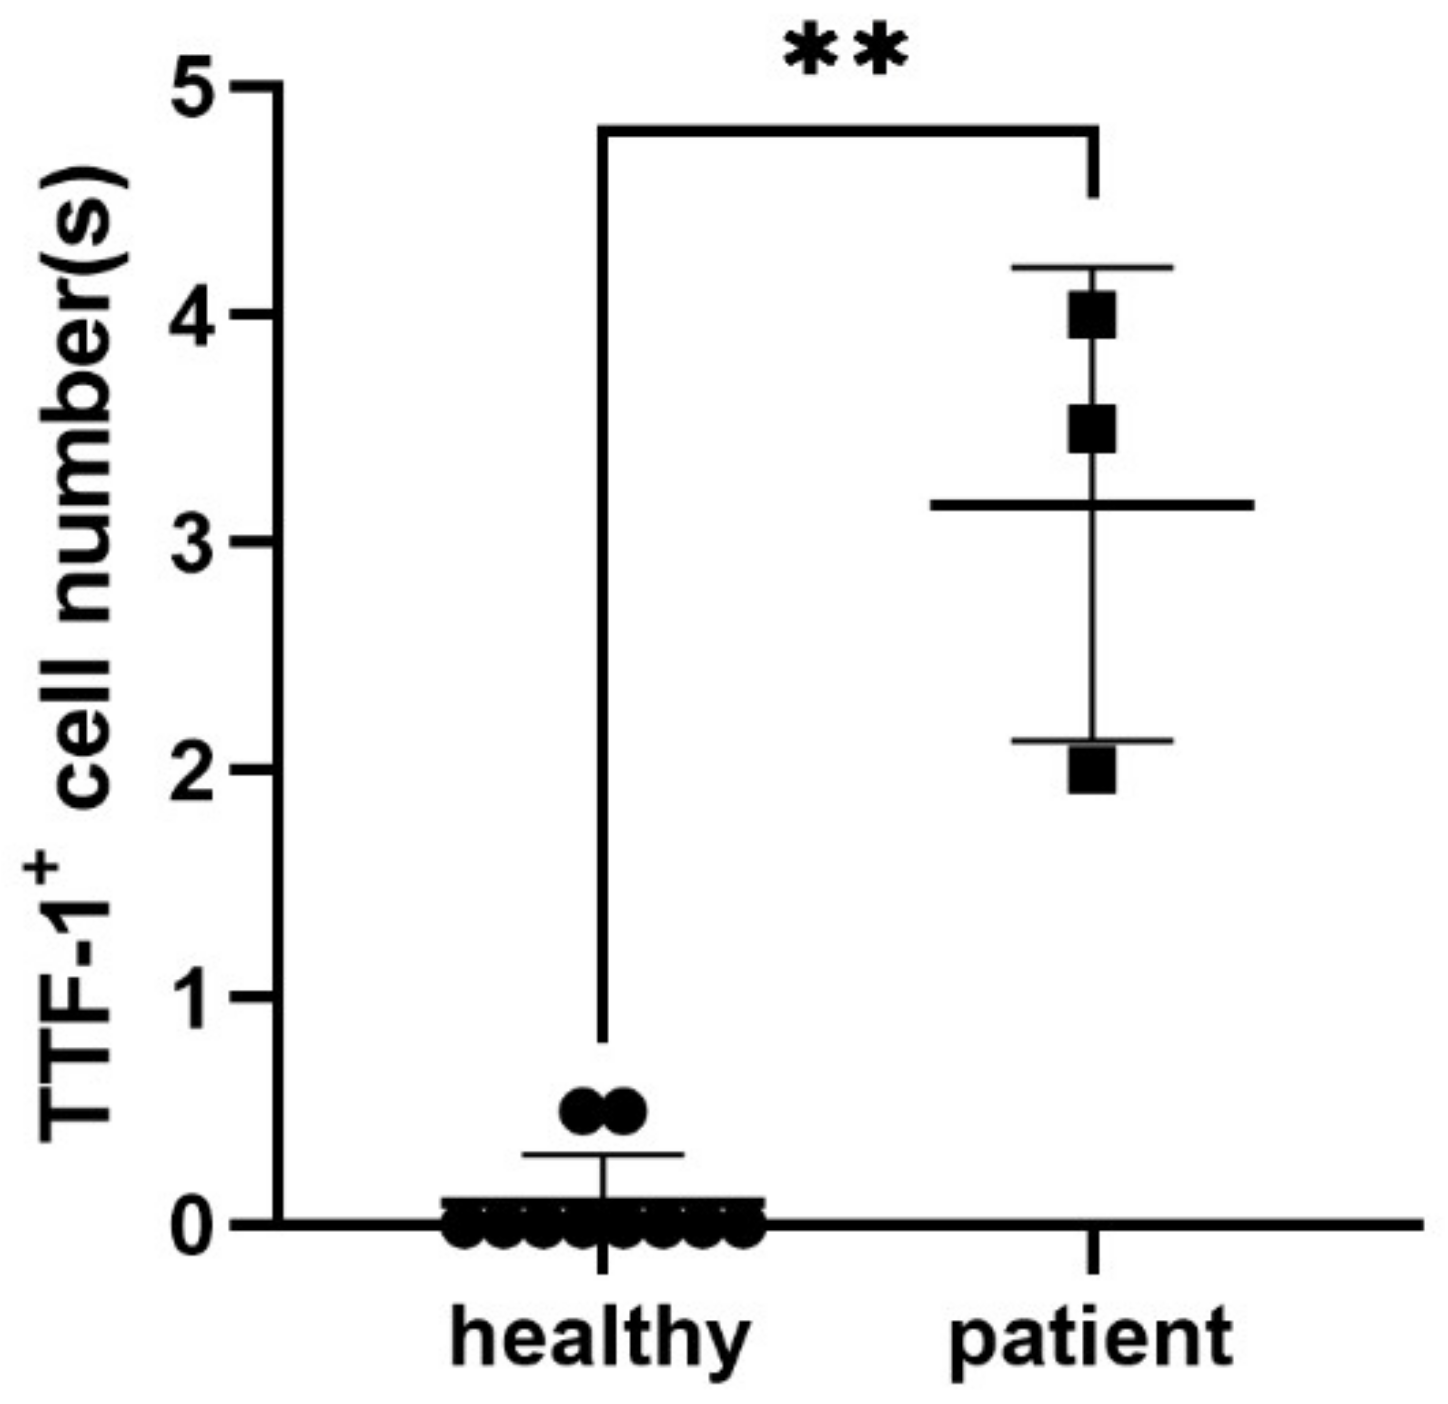
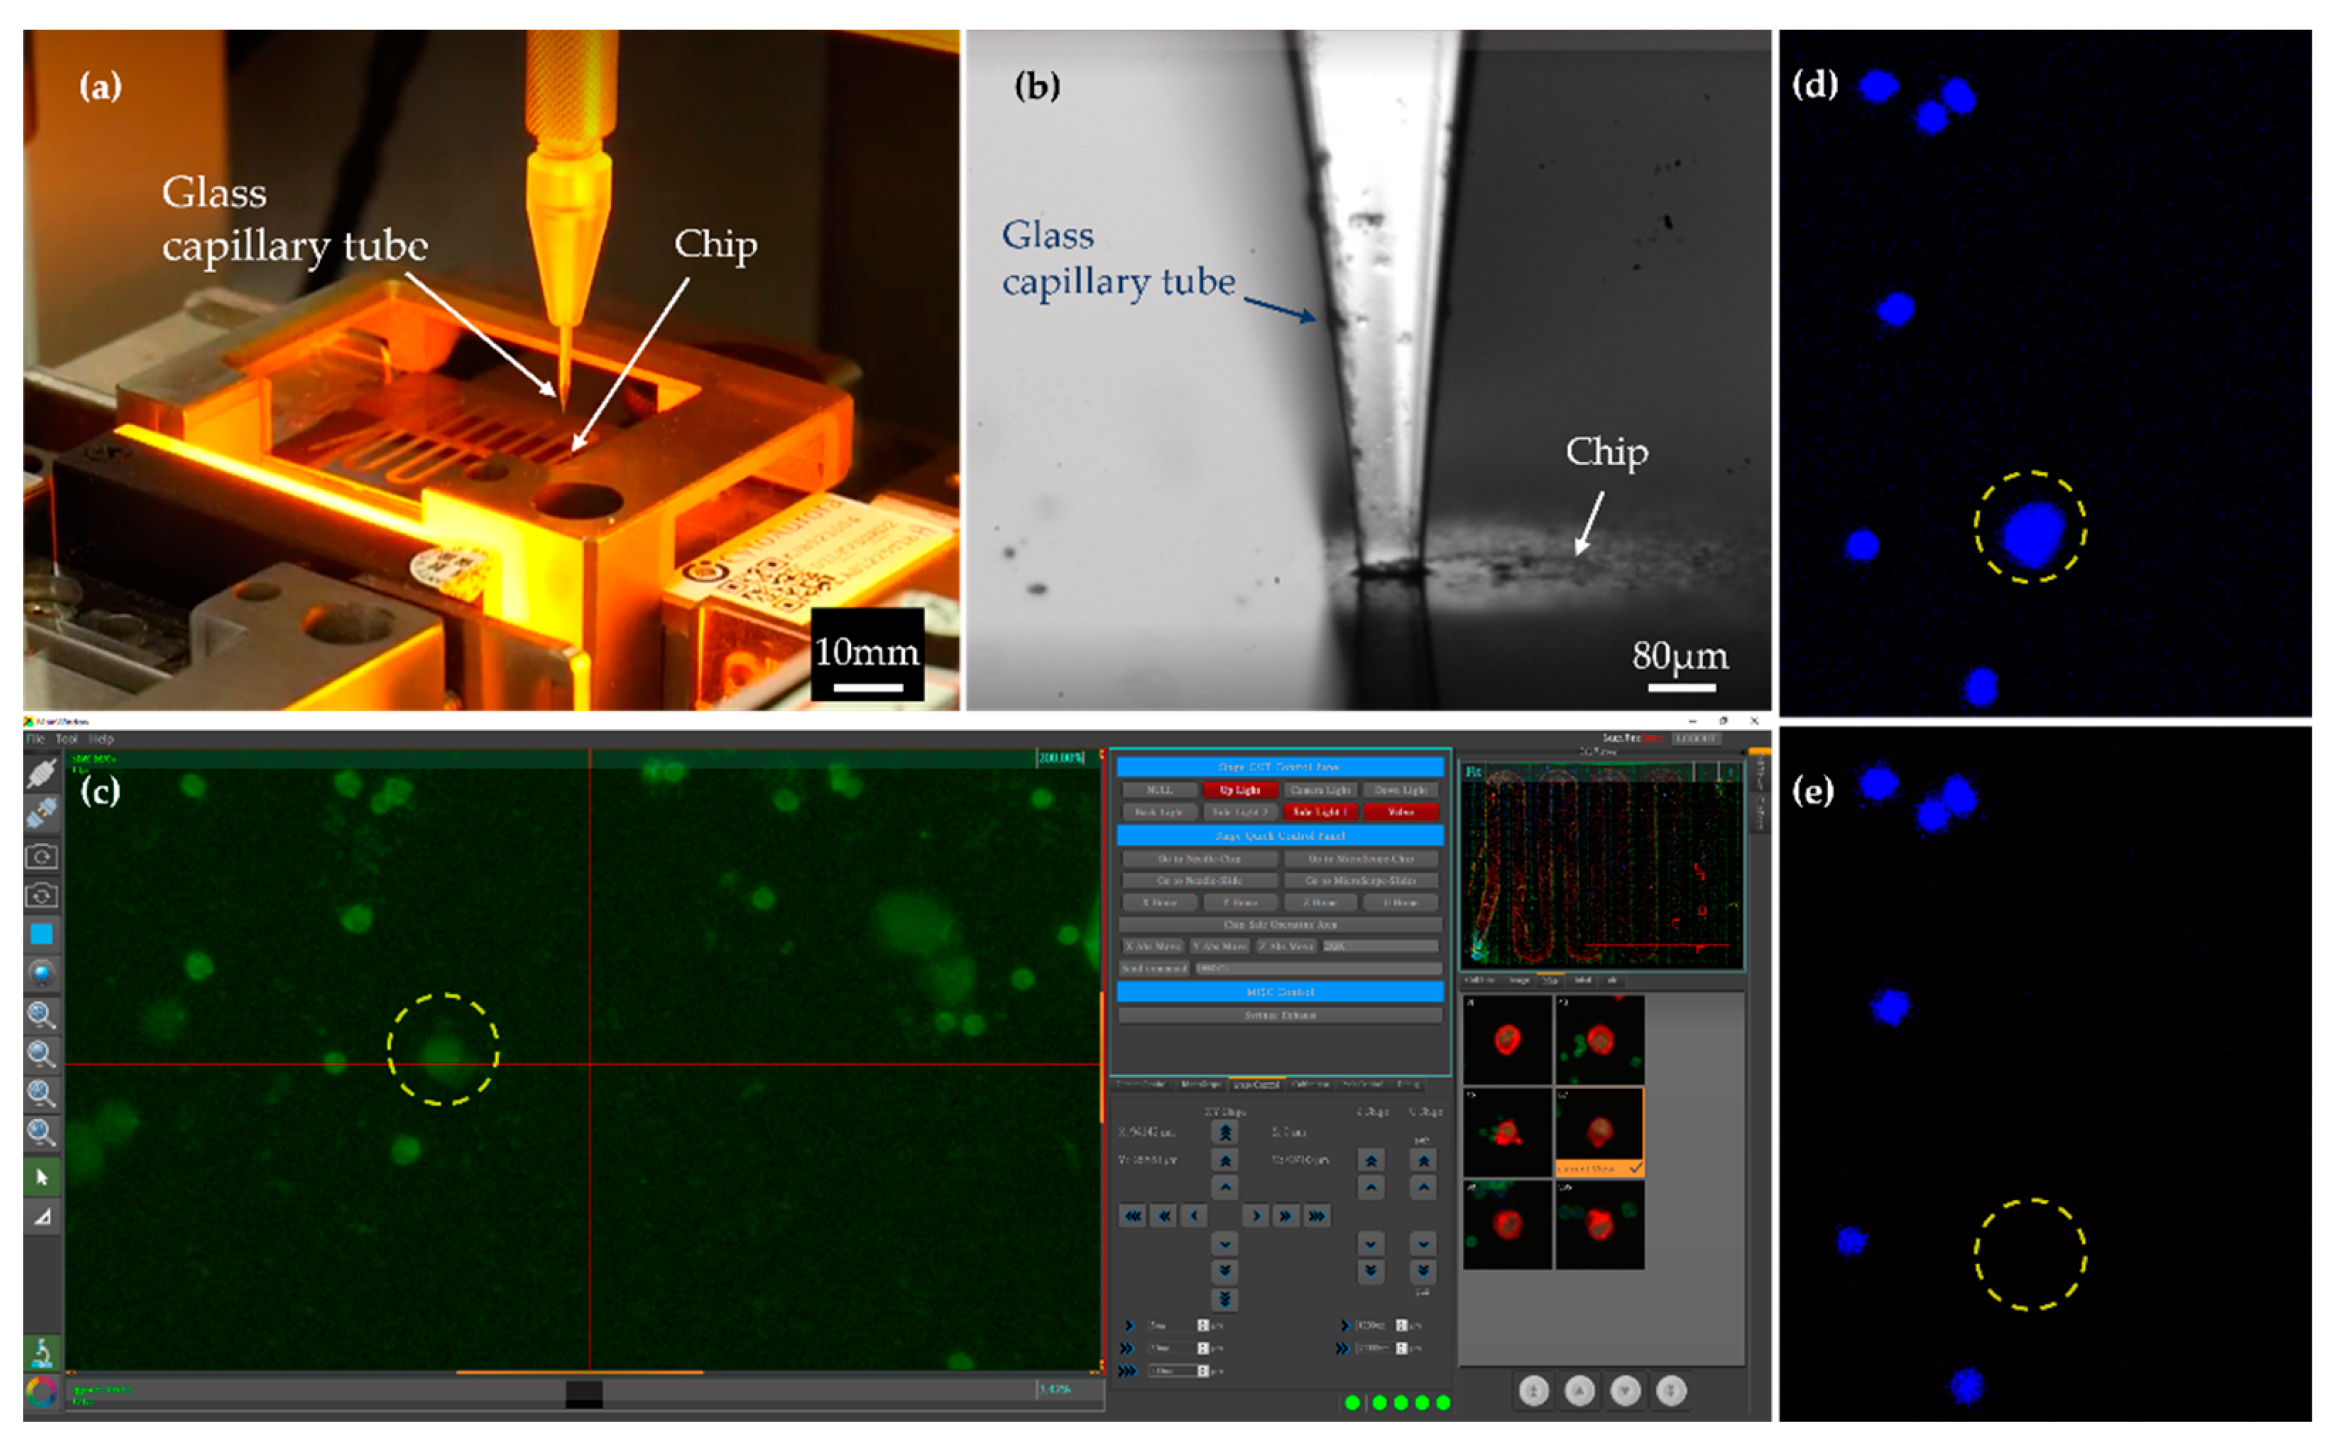
2.2. Identification and Isolation of CTCs
2.3. Average Sequencing Depth and On-Target Percentage
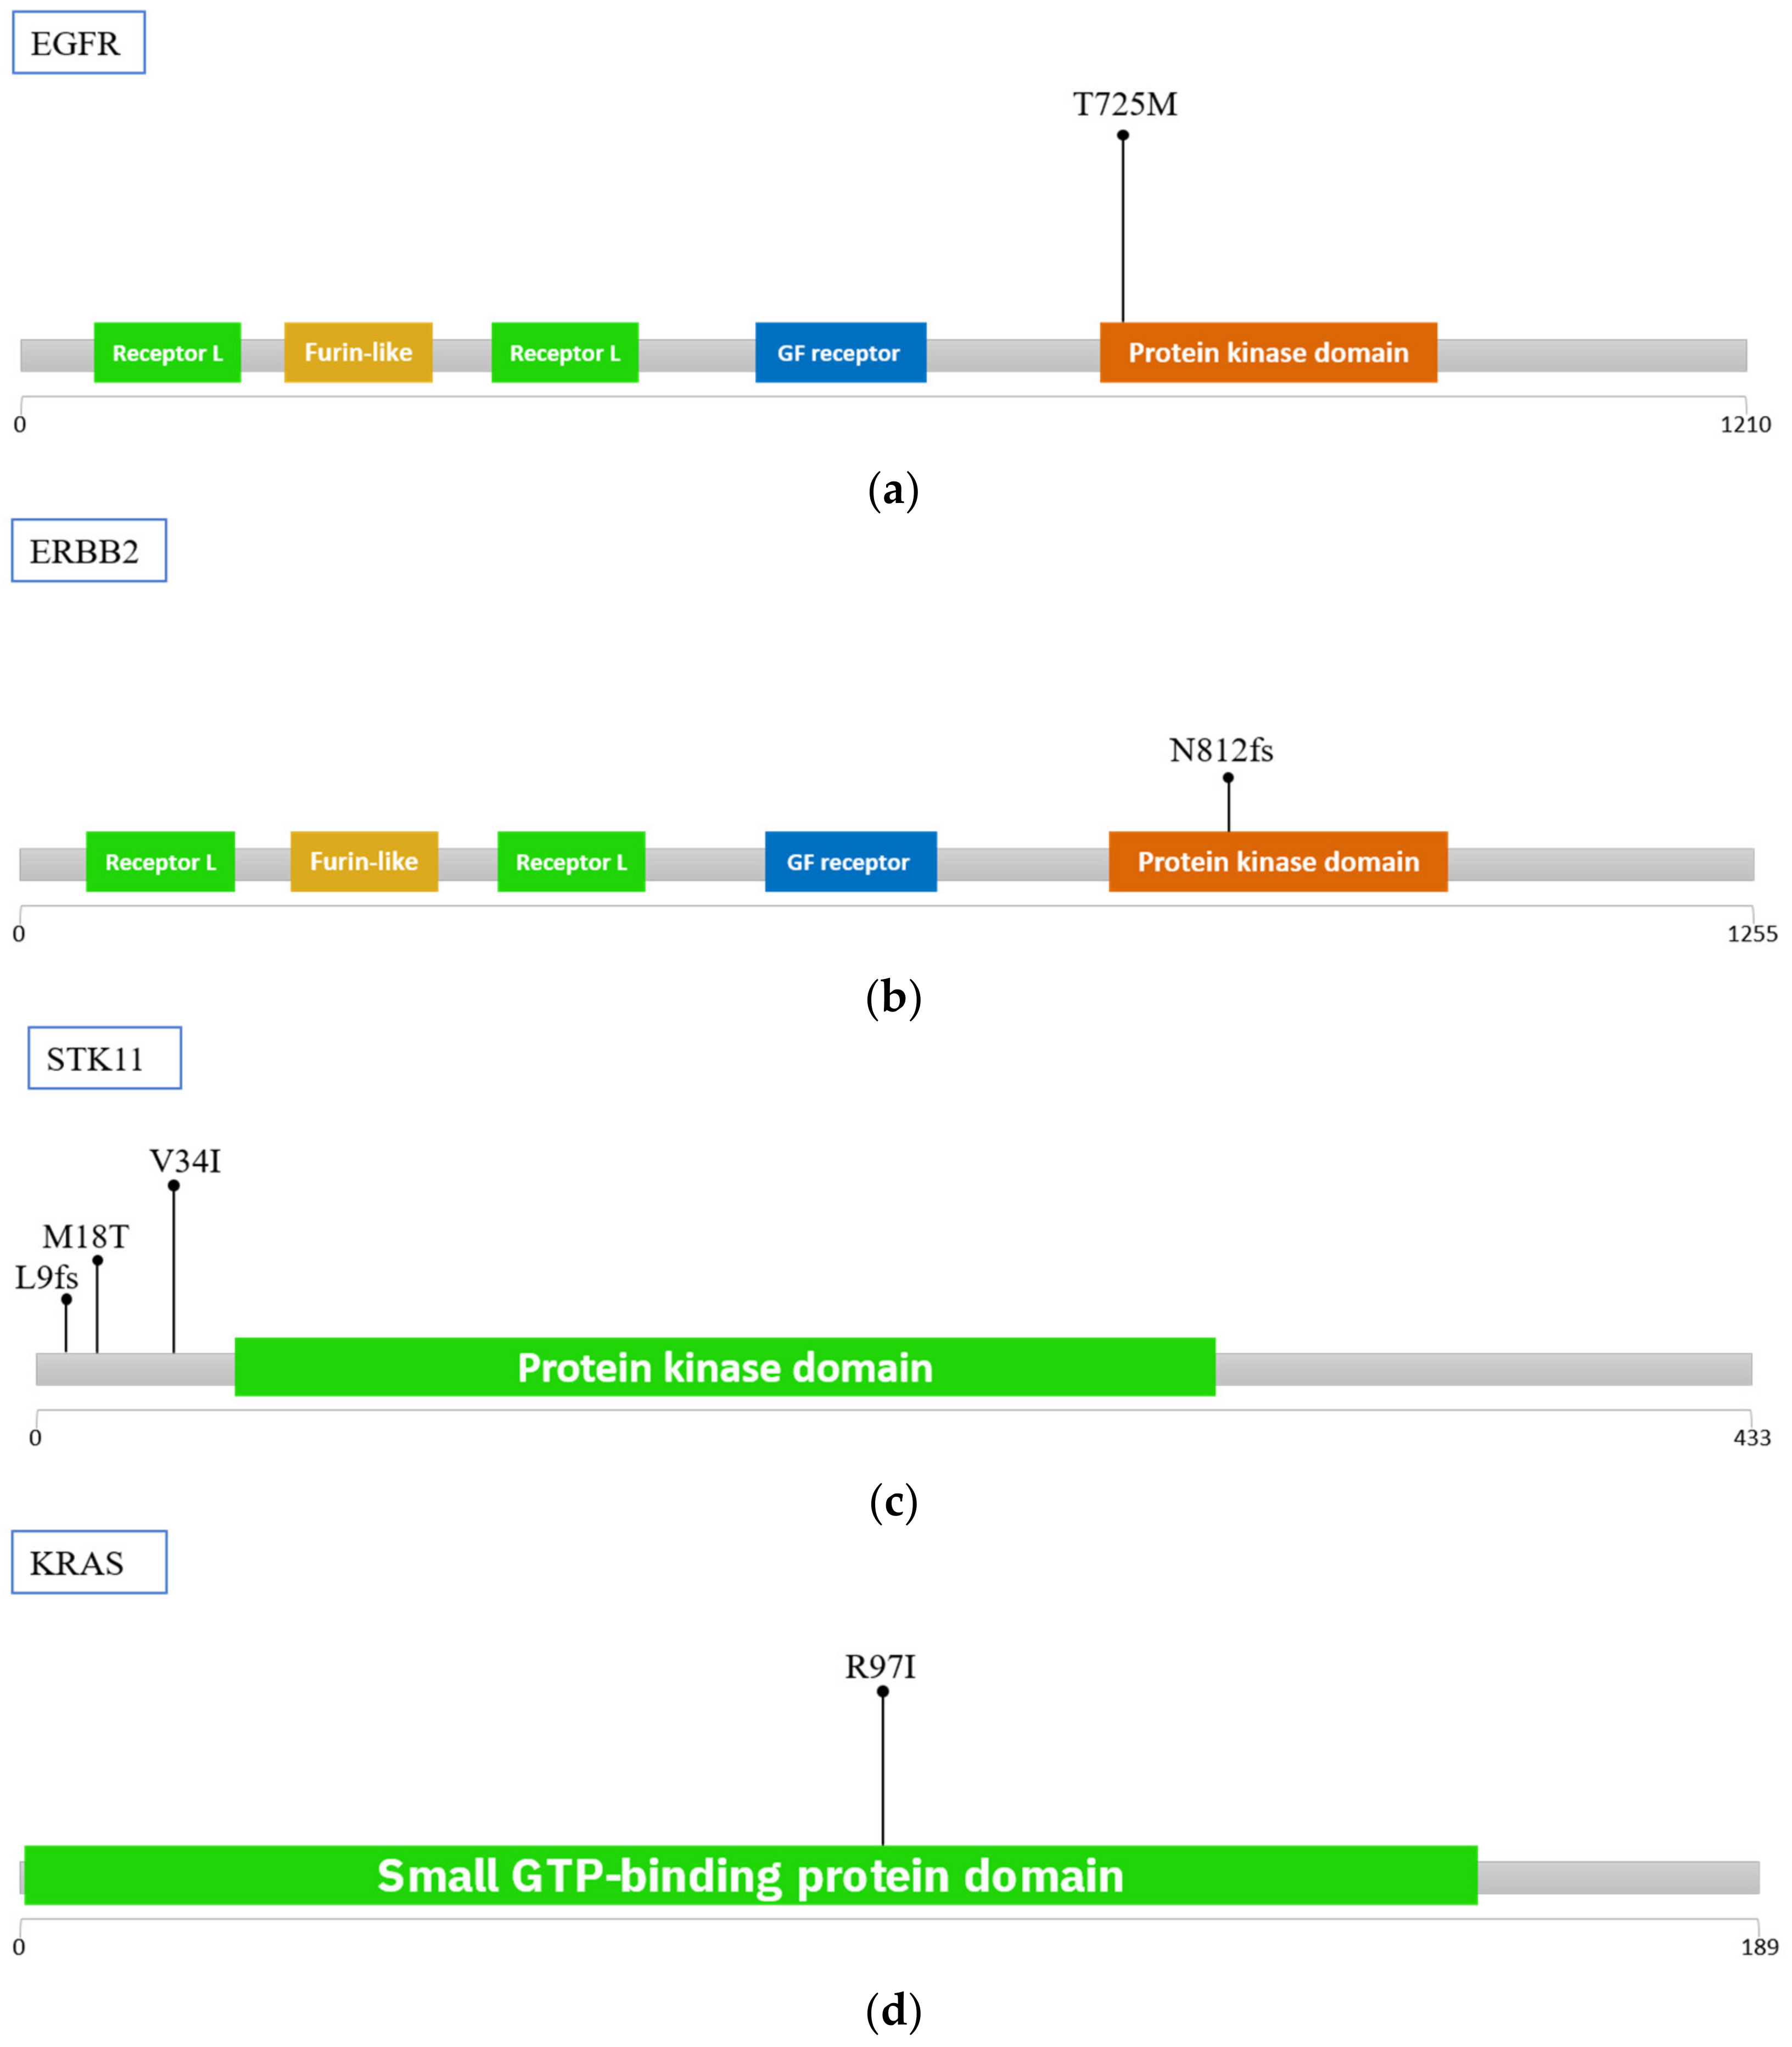
2.4. Mutations in Isolated CTCs
3. Discussion
4. Materials and Methods
4.1. Cell Line and Spiking Test
4.2. Patient Sample Preparation
4.3. CTC Enrichment and Identification
4.4. CTCs Isolation
4.5. Whole Genome Amplification (WGA)
4.6. PCR-Based Targeted Sequencing
4.7. Next-Generation Sequencing Analysis (For Panel_File)
4.8. Next-Generation Sequencing Analysis (For Panel_with_deDup_File)
4.9. Strategies of Prioritizing Variants
5. Conclusions
Author Contributions
Funding
Institutional Review Board Statement
Informed Consent Statement
Data Availability Statement
Acknowledgments
Conflicts of Interest
References
- Cancer. Available online: https://www.who.int/news-room/fact-sheets/detail/cancer (accessed on 30 May 2022).
- Chaffer, C.L.; Weinberg, R.A. A perspective on cancer cell metastasis. Science 2011, 331, 1559–1564. [Google Scholar] [CrossRef] [PubMed]
- Habli, Z.; AlChamaa, W.; Saab, R.; Kadara, H.; Khraiche, M.L. Circulating Tumor Cell Detection Technologies and Clinical Utility: Challenges and Opportunities. Cancers 2020, 12, 1930. [Google Scholar] [CrossRef]
- Yan, W.T.; Cui, X.; Chen, Q.; Li, Y.F.; Cui, Y.H.; Wang, Y.; Jiang, J. Circulating tumor cell status monitors the treatment responses in breast cancer patients: A meta-analysis. Sci. Rep. 2017, 7, 43464. [Google Scholar] [CrossRef] [PubMed] [Green Version]
- Khoo, B.L.; Grenci, G.; Jing, T.; Lim, Y.B.; Lee, S.C.; Thiery, J.P.; Han, J.; Lim, C.T. Liquid biopsy and therapeutic response: Circulating tumor cell cultures for evaluation of anticancer treatment. Sci. Adv. 2016, 2, e1600274. [Google Scholar] [CrossRef] [PubMed] [Green Version]
- Ashworth, T. A case of cancer in which cells similar to those in the tumours were seen in the blood after death. Aust. Med. J. 1869, 14, 146. [Google Scholar]
- Miller, M.C.; Doyle, G.V.; Terstappen, L.W. Significance of Circulating Tumor Cells Detected by the CellSearch System in Patients with Metastatic Breast Colorectal and Prostate Cancer. J. Oncol. 2010, 2010, 617421. [Google Scholar] [CrossRef] [PubMed] [Green Version]
- Sharma, S.; Zhuang, R.; Long, M.; Pavlovic, M.; Kang, Y.; Ilyas, A.; Asghar, W. Circulating tumor cell isolation, culture, and downstream molecular analysis. Biotechnol. Adv. 2018, 36, 1063–1078. [Google Scholar] [CrossRef]
- Lei, K.F. A Review on Microdevices for Isolating Circulating Tumor Cells. Micromachines 2020, 11, 531. [Google Scholar] [CrossRef] [PubMed]
- Lim, S.B.; Lim, C.T.; Lim, W.T. Single-Cell Analysis of Circulating Tumor Cells: Why Heterogeneity Matters. Cancers 2019, 11, 1595. [Google Scholar] [CrossRef] [PubMed] [Green Version]
- Shishido, S.N.; Carlsson, A.; Nieva, J.; Bethel, K.; Hicks, J.B.; Bazhenova, L.; Kuhn, P. Circulating tumor cells as a response monitor in stage IV non-small cell lung cancer. J. Transl. Med. 2019, 17, 2035. [Google Scholar] [CrossRef] [PubMed] [Green Version]
- Bhat, M.P.; Thendral, V.; Uthappa, U.T.; Lee, K.H.; Kigga, M.; Altalhi, T.; Kurkuri, M.D.; Kant, K. Recent Advances in Microfluidic Platform for Physical and Immunological Detection and Capture of Circulating Tumor Cells. Biosensors 2022, 12, 220. [Google Scholar] [CrossRef]
- Zou, D.; Cui, D. Advances in isolation and detection of circulating tumor cells based on microfluidics. Cancer Biol. Med. 2018, 15, 335–353. [Google Scholar] [CrossRef] [PubMed] [Green Version]
- Rossi, E.; Zamarchi, R. Single-Cell Analysis of Circulating Tumor Cells: How Far Have We Come in the -Omics Era? Front. Genet. 2019, 10, 958. [Google Scholar] [CrossRef] [PubMed] [Green Version]
- Guan, L.; Zhao, X.; Tang, L.; Chen, J.; Zhao, J.; Guo, M.; Chen, C.; Zhou, Y.; Xu, L. Thyroid Transcription Factor-1: Structure, Expression, Function and Its Relationship with Disease. Biomed. Res. Int. 2021, 2021, 9957209. [Google Scholar] [CrossRef]
- Ordonez, N.G. Value of thyroid transcription factor-1 immunostaining in tumor diagnosis: A review and update. Appl. Immunohistochem. Mol. Morphol. 2012, 20, 429–444. [Google Scholar] [CrossRef]
- Lu, S.-H.; Tsai, W.-S.; Chang, Y.-H.; Chou, T.-Y.; Pang, S.-T.; Lin, P.-H.; Tsai, C.-M.; Chang, Y.-C. Identifying cancer origin using circulating tumor cells. Cancer Bio. Ther. 2016, 17, 430–438. [Google Scholar] [CrossRef] [PubMed] [Green Version]
- Messaritakis, I.; Stoltidis, D.; Kotsakis, A.; Dermitzaki, E.K.; Koinis, F.; Lagoudaki, E.; Koutsopoulos, A.; Politaki, E.; Apostolaki, S.; Souglakos, J.; et al. TTF-1- and/or CD56-positive Circulating Tumor Cells in patients with small cell lung cancer (SCLC). Sci. Rep. 2017, 7, 45351. [Google Scholar] [CrossRef] [Green Version]
- Ding, L.; Getz, G.; Wheeler, D.A.; Mardis, E.R.; McLellan, M.D.; Cibulskis, K.; Sougnez, C.; Greulich, H.; Muzny, D.M.; Morgan, M.B.; et al. Somatic mutations affect key pathways in lung adenocarcinoma. Nature 2008, 455, 1069–1075. [Google Scholar] [CrossRef] [Green Version]
- Talevich, E.; Katiyar, S.; Rasheed, K.; Kannan, N. Prediction and prioritization of rare oncogenic mutations in the cancer Kinome using novel features and multiple classifiers. PLoS Comput. Biol. 2014, 10, e1003545. [Google Scholar] [CrossRef]
- Pecuchet, N.; Laurent-Puig, P.; Mansuet-Lupo, A.; Legras, A.; Alifano, M.; Pallier, K.; Didelot, A.; Gibault, L.; Danel, C.; Just, P.A.; et al. Different prognostic impact of STK11 mutations in non-squamous non-small-cell lung cancer. Oncotarget 2017, 8, 23831–23840. [Google Scholar] [CrossRef] [PubMed] [Green Version]
- Zhang, X.; Lv, J.; Wu, Y.; Qin, N.; Ma, L.; Li, X.; Nong, J.; Zhang, H.; Zhang, Q.; Yang, X.; et al. HER2 Exon 20 Insertion Mutations in Lung Adenocarcinoma: Case Series and Response to Pyrotinib. Front. Oncol. 2020, 10, 1162. [Google Scholar] [CrossRef]
- Ma, G.C.; Lin, W.H.; Huang, C.E.; Chang, T.Y.; Liu, J.Y.; Yang, Y.J.; Lee, M.H.; Wu, W.J.; Chang, Y.S.; Chen, M. A Silicon-based Coral-like Nanostructured Microfluidics to Isolate Rare Cells in Human Circulation: Validation by SK-BR-3 Cancer Cell Line and Its Utility in Circulating Fetal Nucleated Red Blood Cells. Micromachines 2019, 10, 132. [Google Scholar] [CrossRef] [PubMed] [Green Version]
- Jou, H.J.; Chou, L.Y.; Chang, W.C.; Ho, H.C.; Zhang, W.T.; Ling, P.Y.; Tsai, K.H.; Chen, S.H.; Chen, T.H.; Lo, P.H.; et al. An Automatic Platform Based on Nanostructured Microfluidic Chip for Isolating and Identification of Circulating Tumor Cells. Micromachines 2021, 12, 473. [Google Scholar] [CrossRef] [PubMed]
- Huang, C.E.; Ma, G.C.; Jou, H.J.; Lin, W.H.; Lee, D.J.; Lin, Y.S.; Ginsberg, N.A.; Chen, H.F.; Chang, F.M.; Chen, M. Noninvasive prenatal diagnosis of fetal aneuploidy by circulating fetal nucleated red blood cells and extravillous trophoblasts using silicon-based nanostructured microfluidics. Mol. Cytogenet. 2017, 10, 44. [Google Scholar] [CrossRef] [Green Version]
- Chang, T.Y.; Chen, S.W.; Lin, W.H.; Huang, C.E.; Evans, M.I.; Chung, I.F.; Wu, J.W.; Ma, G.C.; Chen, M. Comparison of Genetic Profiling between Primary Tumor and Circulating Tumor Cells Captured by Microfluidics in Epithelial Ovarian Cancer: Tumor Heterogeneity or Allele Dropout? Diagnostics 2021, 11, 1102. [Google Scholar] [CrossRef] [PubMed]
- Bolger, A.M.; Lohse, M.; Usadel, B. Trimmomatic: A flexible trimmer for Illumina sequence data. Bioinformatics 2014, 30, 2114–2120. [Google Scholar] [CrossRef] [PubMed] [Green Version]
- Li, H.; Durbin, R. Fast and accurate short read alignment with Burrows-Wheeler transform. Bioinformatics 2009, 25, 1754–1760. [Google Scholar] [CrossRef] [PubMed] [Green Version]
- McKenna, A.; Hanna, M.; Banks, E.; Sivachenko, A.; Cibulskis, K.; Kernytsky, A.; Garimella, K.; Altshuler, D.; Gabriel, S.; Daly, M.; et al. The Genome Analysis Toolkit: A MapReduce framework for analyzing next-generation DNA sequencing data. Genome. Res. 2010, 20, 1297–1303. [Google Scholar] [CrossRef] [PubMed] [Green Version]
- McLaren, W.; Gil, L.; Hunt, S.E.; Riat, H.S.; Ritchie, G.R.; Thormann, A.; Flicek, P.; Cunningham, F. The Ensembl Variant Effect Predictor. Genome. Biol. 2016, 17, 122. [Google Scholar] [CrossRef] [PubMed] [Green Version]
- Ng, P.C.; Henikoff, S. SIFT: Predicting amino acid changes that affect protein function. Nucleic Acids Res. 2003, 31, 3812–3814. [Google Scholar] [CrossRef] [PubMed] [Green Version]
- Adzhubei, I.; Jordan, D.M.; Sunyaev, S.R. Predicting functional effect of human missense mutations using PolyPhen-2. Curr. Protoc. Hum. Genet. 2013, 7, 76. [Google Scholar] [CrossRef] [PubMed]
- Tate, J.G.; Bamford, S.; Jubb, H.C.; Sondka, Z.; Beare, D.M.; Bindal, N.; Boutselakis, H.; Cole, C.G.; Creatore, C.; Dawson, E.; et al. COSMIC: The Catalogue of Somatic Mutations in Cancer. Nucleic Acids Res. 2019, 47, D941–D947. [Google Scholar] [CrossRef] [PubMed] [Green Version]
- Sherry, S.T.; Ward, M.H.; Kholodov, M.; Baker, J.; Phan, L.; Smigielski, E.M.; Sirotkin, K. dbSNP: The NCBI database of genetic variation. Nucleic Acids Res. 2001, 29, 308–311. [Google Scholar] [CrossRef] [PubMed] [Green Version]
- Li, H.; Handsaker, B.; Wysoker, A.; Fennell, T.; Ruan, J.; Homer, N.; Marth, G.; Abecasis, G.; Durbin, R.; 1000 Genome Project Data Processing Subgroup. The sequence alignment/map format and SAMtools. Bioinformatics 2009, 25, 2078–2079. [Google Scholar] [CrossRef] [Green Version]
- Landrum, M.J.; Lee, J.M.; Benson, M.; Brown, G.R.; Chao, C.; Chitipiralla, S.; Gu, B.; Hart, J.; Hoffman, D.; Jang, W.; et al. ClinVar: Improving access to variant interpretations and supporting evidence. Nucleic Acids Res. 2018, 46, D1062–D1067. [Google Scholar] [CrossRef] [PubMed] [Green Version]
- Pinero, J.; Ramirez-Anguita, J.M.; Sauch-Pitarch, J.; Ronzano, F.; Centeno, E.; Sanz, F.; Furlong, L.I. The DisGeNET knowledge platform for disease genomics: 2019 update. Nucleic Acids Res. 2020, 48, D845–D855. [Google Scholar] [CrossRef] [Green Version]
- Chunn, L.M.; Nefcy, D.C.; Scouten, R.W.; Tarpey, R.P.; Chauhan, G.; Lim, M.S.; Elenitoba-Johnson, K.S.; Schwartz, S.A.; Kiel, M.J. Mastermind: A comprehensive genomic association search engine for empirical evidence curation and genetic variant interpretation. Front. Genet. 2020, 11, 577152. [Google Scholar] [CrossRef]
- Whirl-Carrillo, M.; Huddart, R.; Gong, L.; Sangkuhl, K.; Thorn, C.F.; Whaley, R.; Klein, T.E. An Evidence-Based Framework for Evaluating Pharmacogenomics Knowledge for Personalized Medicine. Clin. Pharmacol. Ther. 2021, 110, 563–572. [Google Scholar] [CrossRef]
- Mistry, J.; Chuguransky, S.; Williams, L.; Qureshi, M.; Salazar, G.A.; Sonnhammer, E.L.L.; Tosatto, S.C.E.; Paladin, L.; Raj, S.; Richardson, L.J.; et al. Pfam: The protein families database in 2021. Nucleic Acids Res. 2021, 49, D412–D419. [Google Scholar] [CrossRef] [PubMed]
- UniProt, C. UniProt: The universal protein knowledgebase in 2021. Nucleic Acids Res. 2021, 49, D480–D489. [Google Scholar] [CrossRef]


| Case No. | 1 | 2 | 3 |
|---|---|---|---|
| Sex | F | F | M |
| Age | 62 | 49 | 67 |
| Diagnosis/Staging | Lung AdCa/I | Lung AdCa/IV | Double cancer (lung AdCa/I & thyroid papillary carcinoma/IV) |
| Status | Post-operation | Post-treatment | Post-operation |
| CTCs | |||
| TTF-1+ CTCs | 14/4 mL (2 mL × 2) | 8/2 mL | 16#/8 mL (4 mL × 2) |
| TTF-1− CTCs | 18/4 mL (2 mL × 2) | 1/2 mL | 12/8 mL (4 mL × 2) |
| Total CTC count | 32/4 mL (2 mL × 2) | 9/2 mL | 28#/8 mL (4 mL × 2) |
| Isolated CTCs | |||
| TTF-1+ CTC | 6 | 8 | 10 |
| TTF-1− CTC | 6 | 0 | 0 |
| WBCs | 10 | 2 | 17 |
| Purity (%) | 55 | 80 | 37 |
| Case No | Average Depth | On-Target Percentage (10×) | On-Target Percentage (100×) | On-Target Percentage (250×) |
|---|---|---|---|---|
| 1 | 7560 | 89% | 84% | 79% |
| 2 | 8014 | 62% | 57% | 54% |
| 3 | 5852 | 90% | 79% | 71% |
| Gene | Variation | Patient | CTCs AF | Pathway |
|---|---|---|---|---|
| EGFR | p.T725M | STE504366 | 0.235 | 1. MAPK_SIGNALING_PATHWAY 2. ERBB_SIGNALING_PATHWAY 3. PATHWAYS_IN_CANCER |
| ERBB2 | p.N812fs | RCE162277 | 0.087 | 1. ERBB_SIGNALING_PATHWAY 2. PATHWAYS_IN_CANCER |
| ERBB2 | RCE385327 | 0.127 | ||
| KRAS | p.R97I | RCE162277 | 0.253 | 1. ERBB_SIGNALING_PATHWAY 2. PATHWAYS_IN_CANCER |
| STK11 | p.L9fs | STE504366 | 0.2 | 1. MTOR_SIGNALING_PATHWAY 2. ADIPOCYTOKINE_SIGNALING_PATHWAY |
| STK11 | p.M18T | STE504366 | 0.267 | |
| STK11 | p.V34I | STE504366 | 0.275 |
Publisher’s Note: MDPI stays neutral with regard to jurisdictional claims in published maps and institutional affiliations. |
© 2022 by the authors. Licensee MDPI, Basel, Switzerland. This article is an open access article distributed under the terms and conditions of the Creative Commons Attribution (CC BY) license (https://creativecommons.org/licenses/by/4.0/).
Share and Cite
Jou, H.-J.; Ho, H.-C.; Huang, K.-Y.; Chen, C.-Y.; Chen, S.-W.; Lo, P.-H.; Huang, P.-W.; Huang, C.-E.; Chen, M. Isolation of TTF-1 Positive Circulating Tumor Cells for Single-Cell Sequencing by Using an Automatic Platform Based on Microfluidic Devices. Int. J. Mol. Sci. 2022, 23, 15139. https://doi.org/10.3390/ijms232315139
Jou H-J, Ho H-C, Huang K-Y, Chen C-Y, Chen S-W, Lo P-H, Huang P-W, Huang C-E, Chen M. Isolation of TTF-1 Positive Circulating Tumor Cells for Single-Cell Sequencing by Using an Automatic Platform Based on Microfluidic Devices. International Journal of Molecular Sciences. 2022; 23(23):15139. https://doi.org/10.3390/ijms232315139
Chicago/Turabian StyleJou, Hei-Jen, Hsin-Cheng Ho, Kuan-Yeh Huang, Chen-Yang Chen, Sheng-Wen Chen, Pei-Hsuan Lo, Pin-Wen Huang, Chung-Er Huang, and Ming Chen. 2022. "Isolation of TTF-1 Positive Circulating Tumor Cells for Single-Cell Sequencing by Using an Automatic Platform Based on Microfluidic Devices" International Journal of Molecular Sciences 23, no. 23: 15139. https://doi.org/10.3390/ijms232315139
APA StyleJou, H.-J., Ho, H.-C., Huang, K.-Y., Chen, C.-Y., Chen, S.-W., Lo, P.-H., Huang, P.-W., Huang, C.-E., & Chen, M. (2022). Isolation of TTF-1 Positive Circulating Tumor Cells for Single-Cell Sequencing by Using an Automatic Platform Based on Microfluidic Devices. International Journal of Molecular Sciences, 23(23), 15139. https://doi.org/10.3390/ijms232315139