

Quality of T-Cell Response to SARS-CoV-2 mRNA Vaccine in ART-Treated PLWH


 , ,
, ,  , , , , ,
Abstract
:1. Introduction
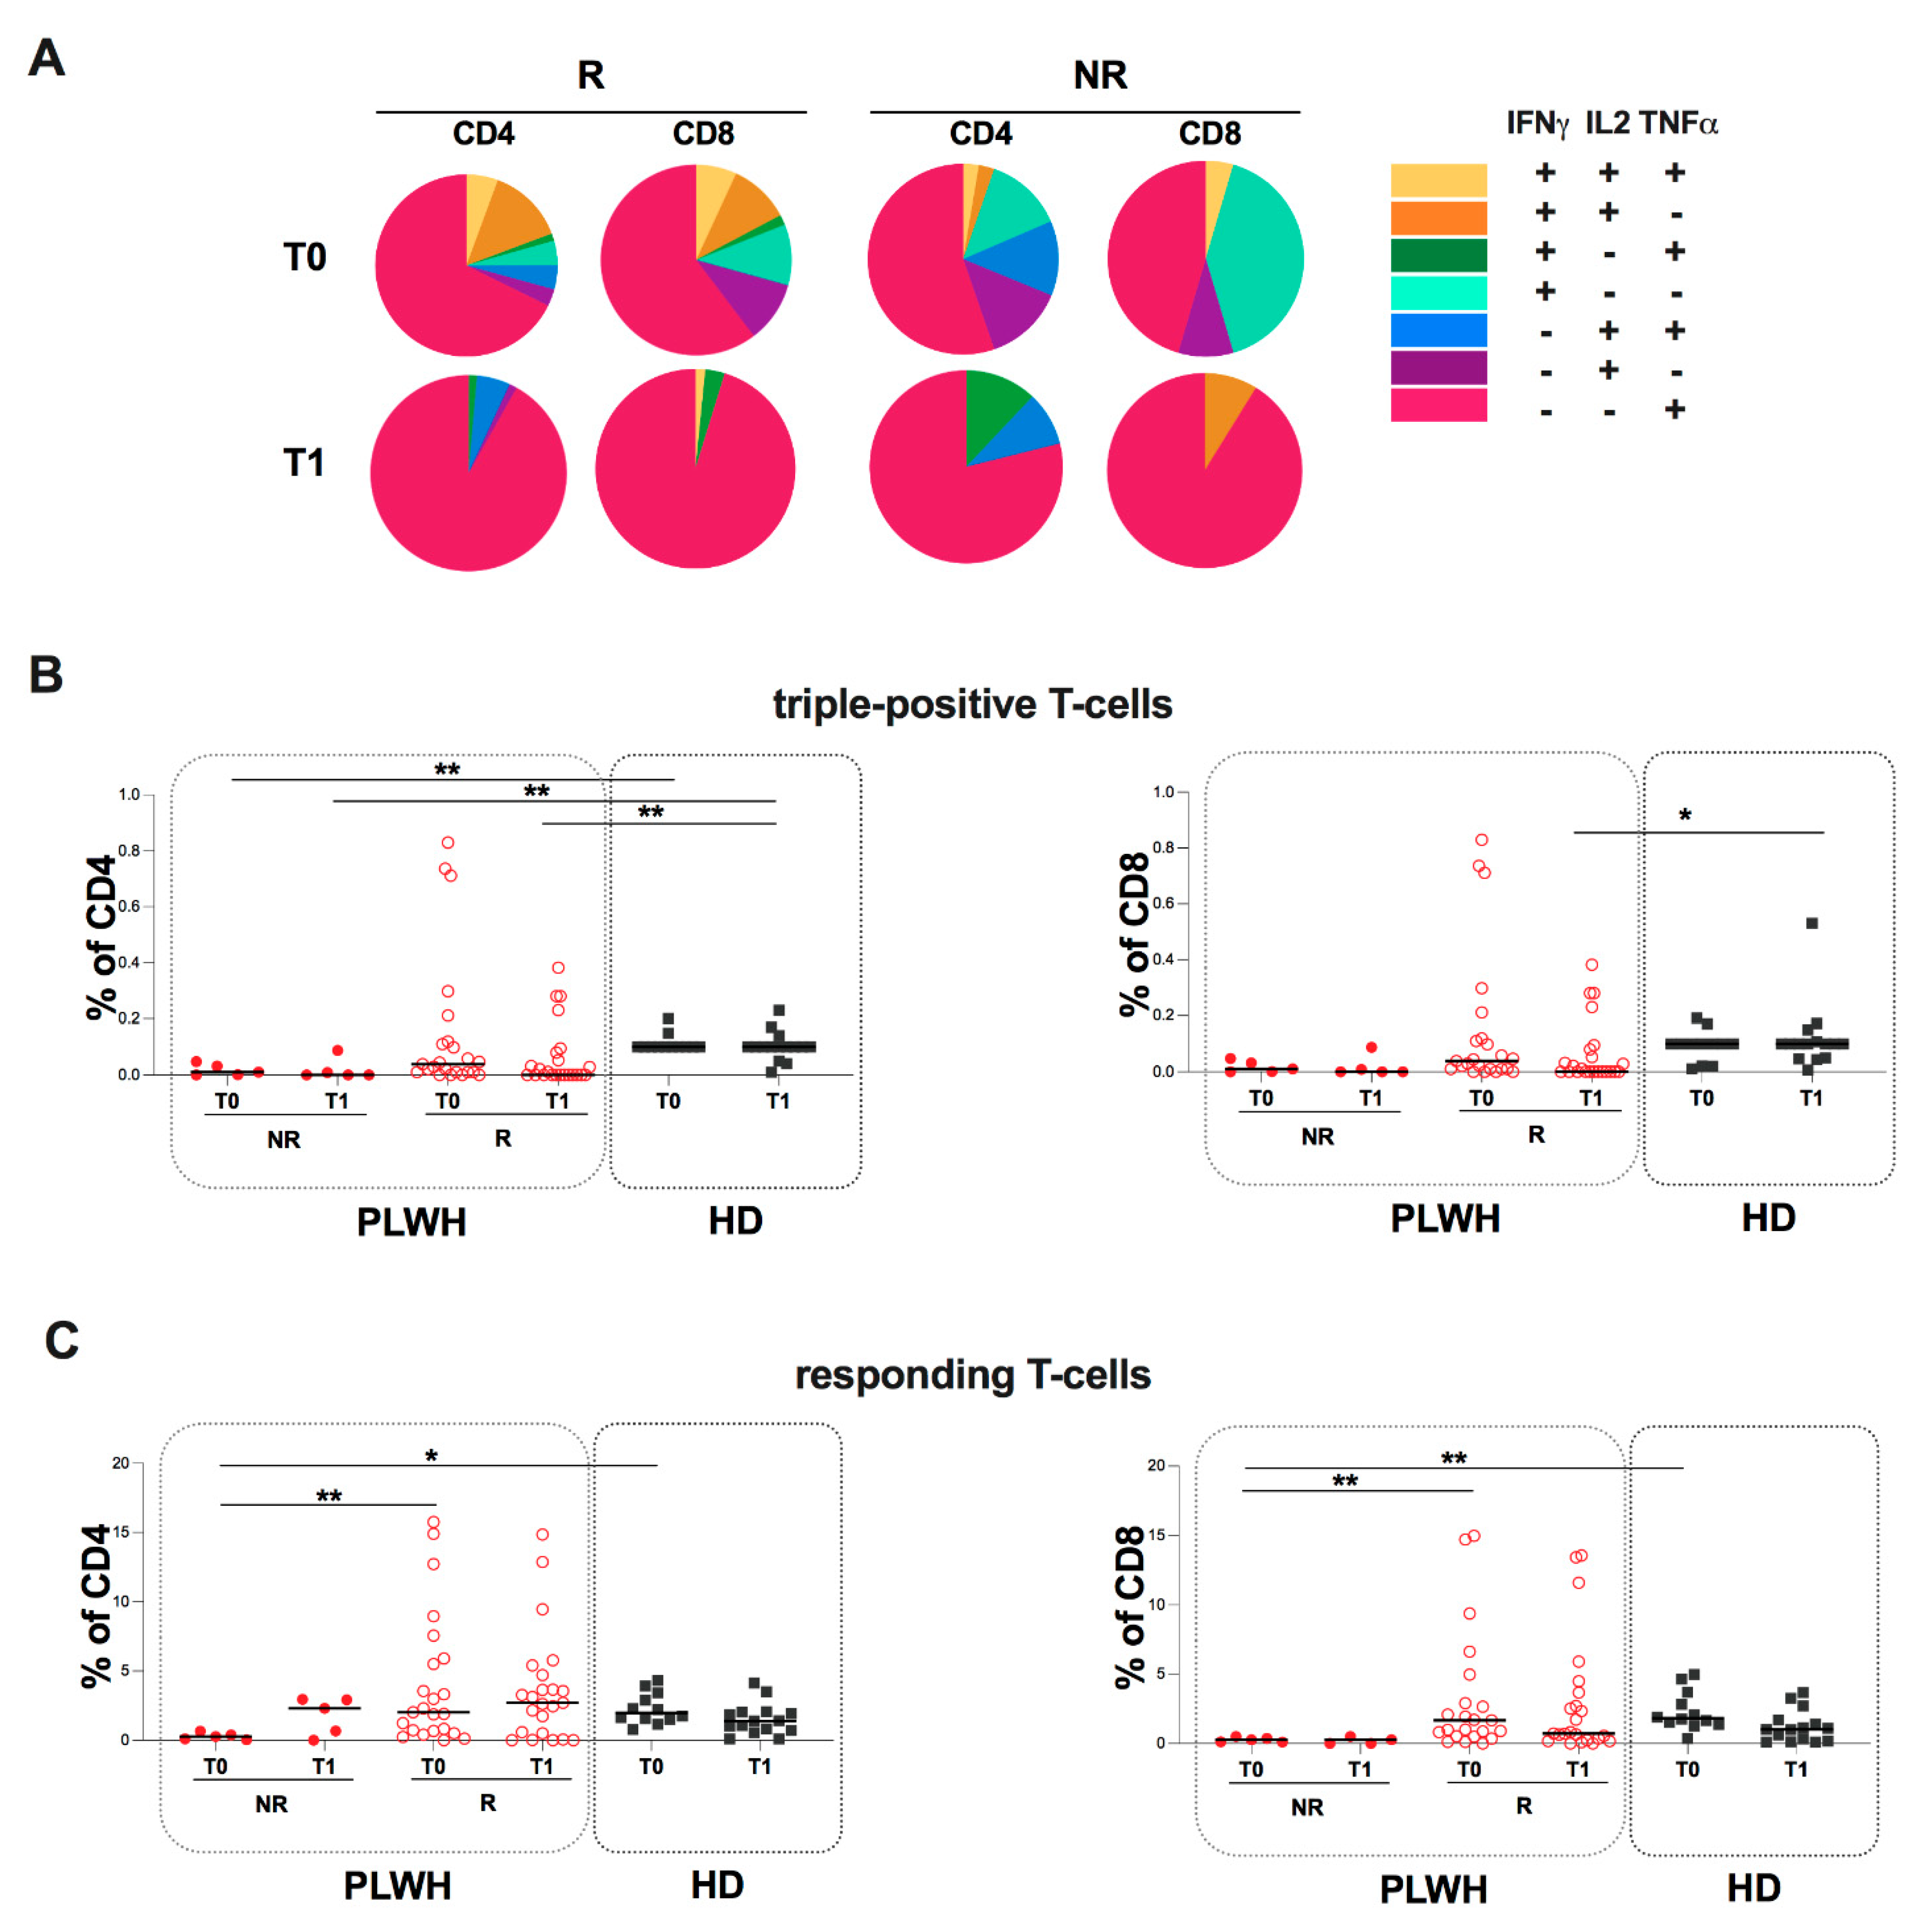
2. Results
2.1. Demographic and Clinical Characteristics of PLWH
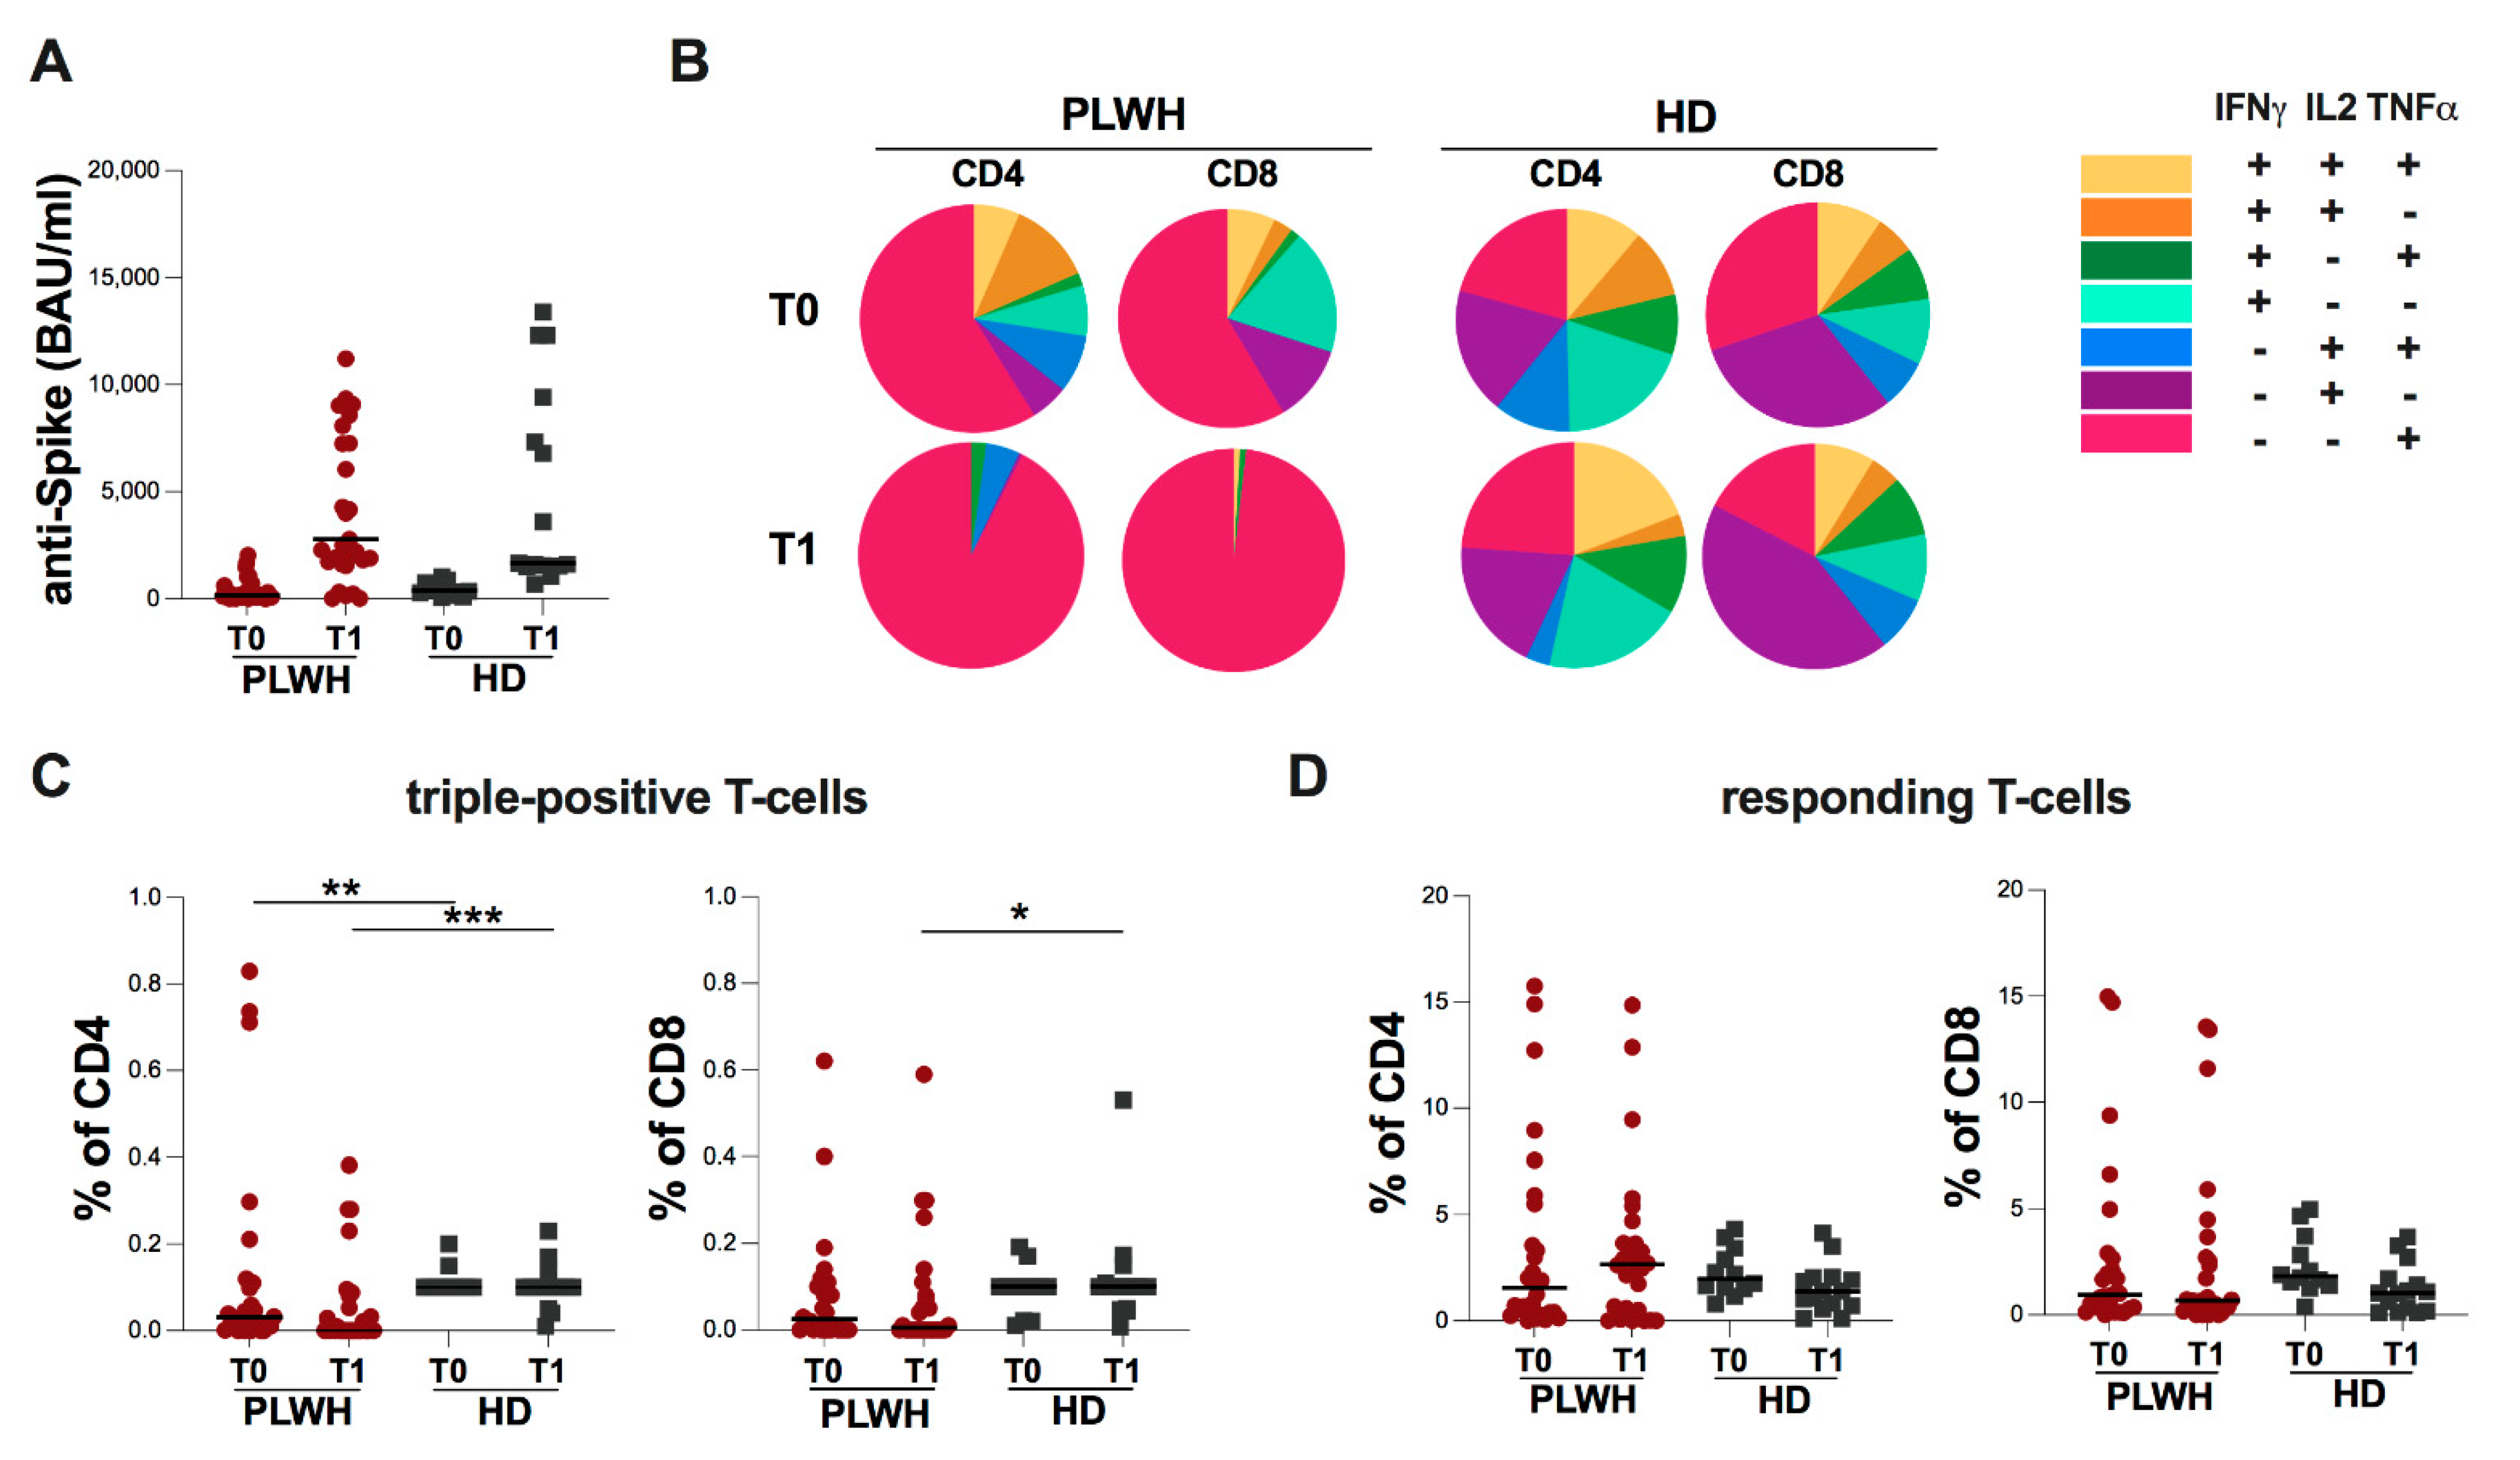
2.2. Evaluation of Spike-Specific Humoral and T-Cell Response in Study Population
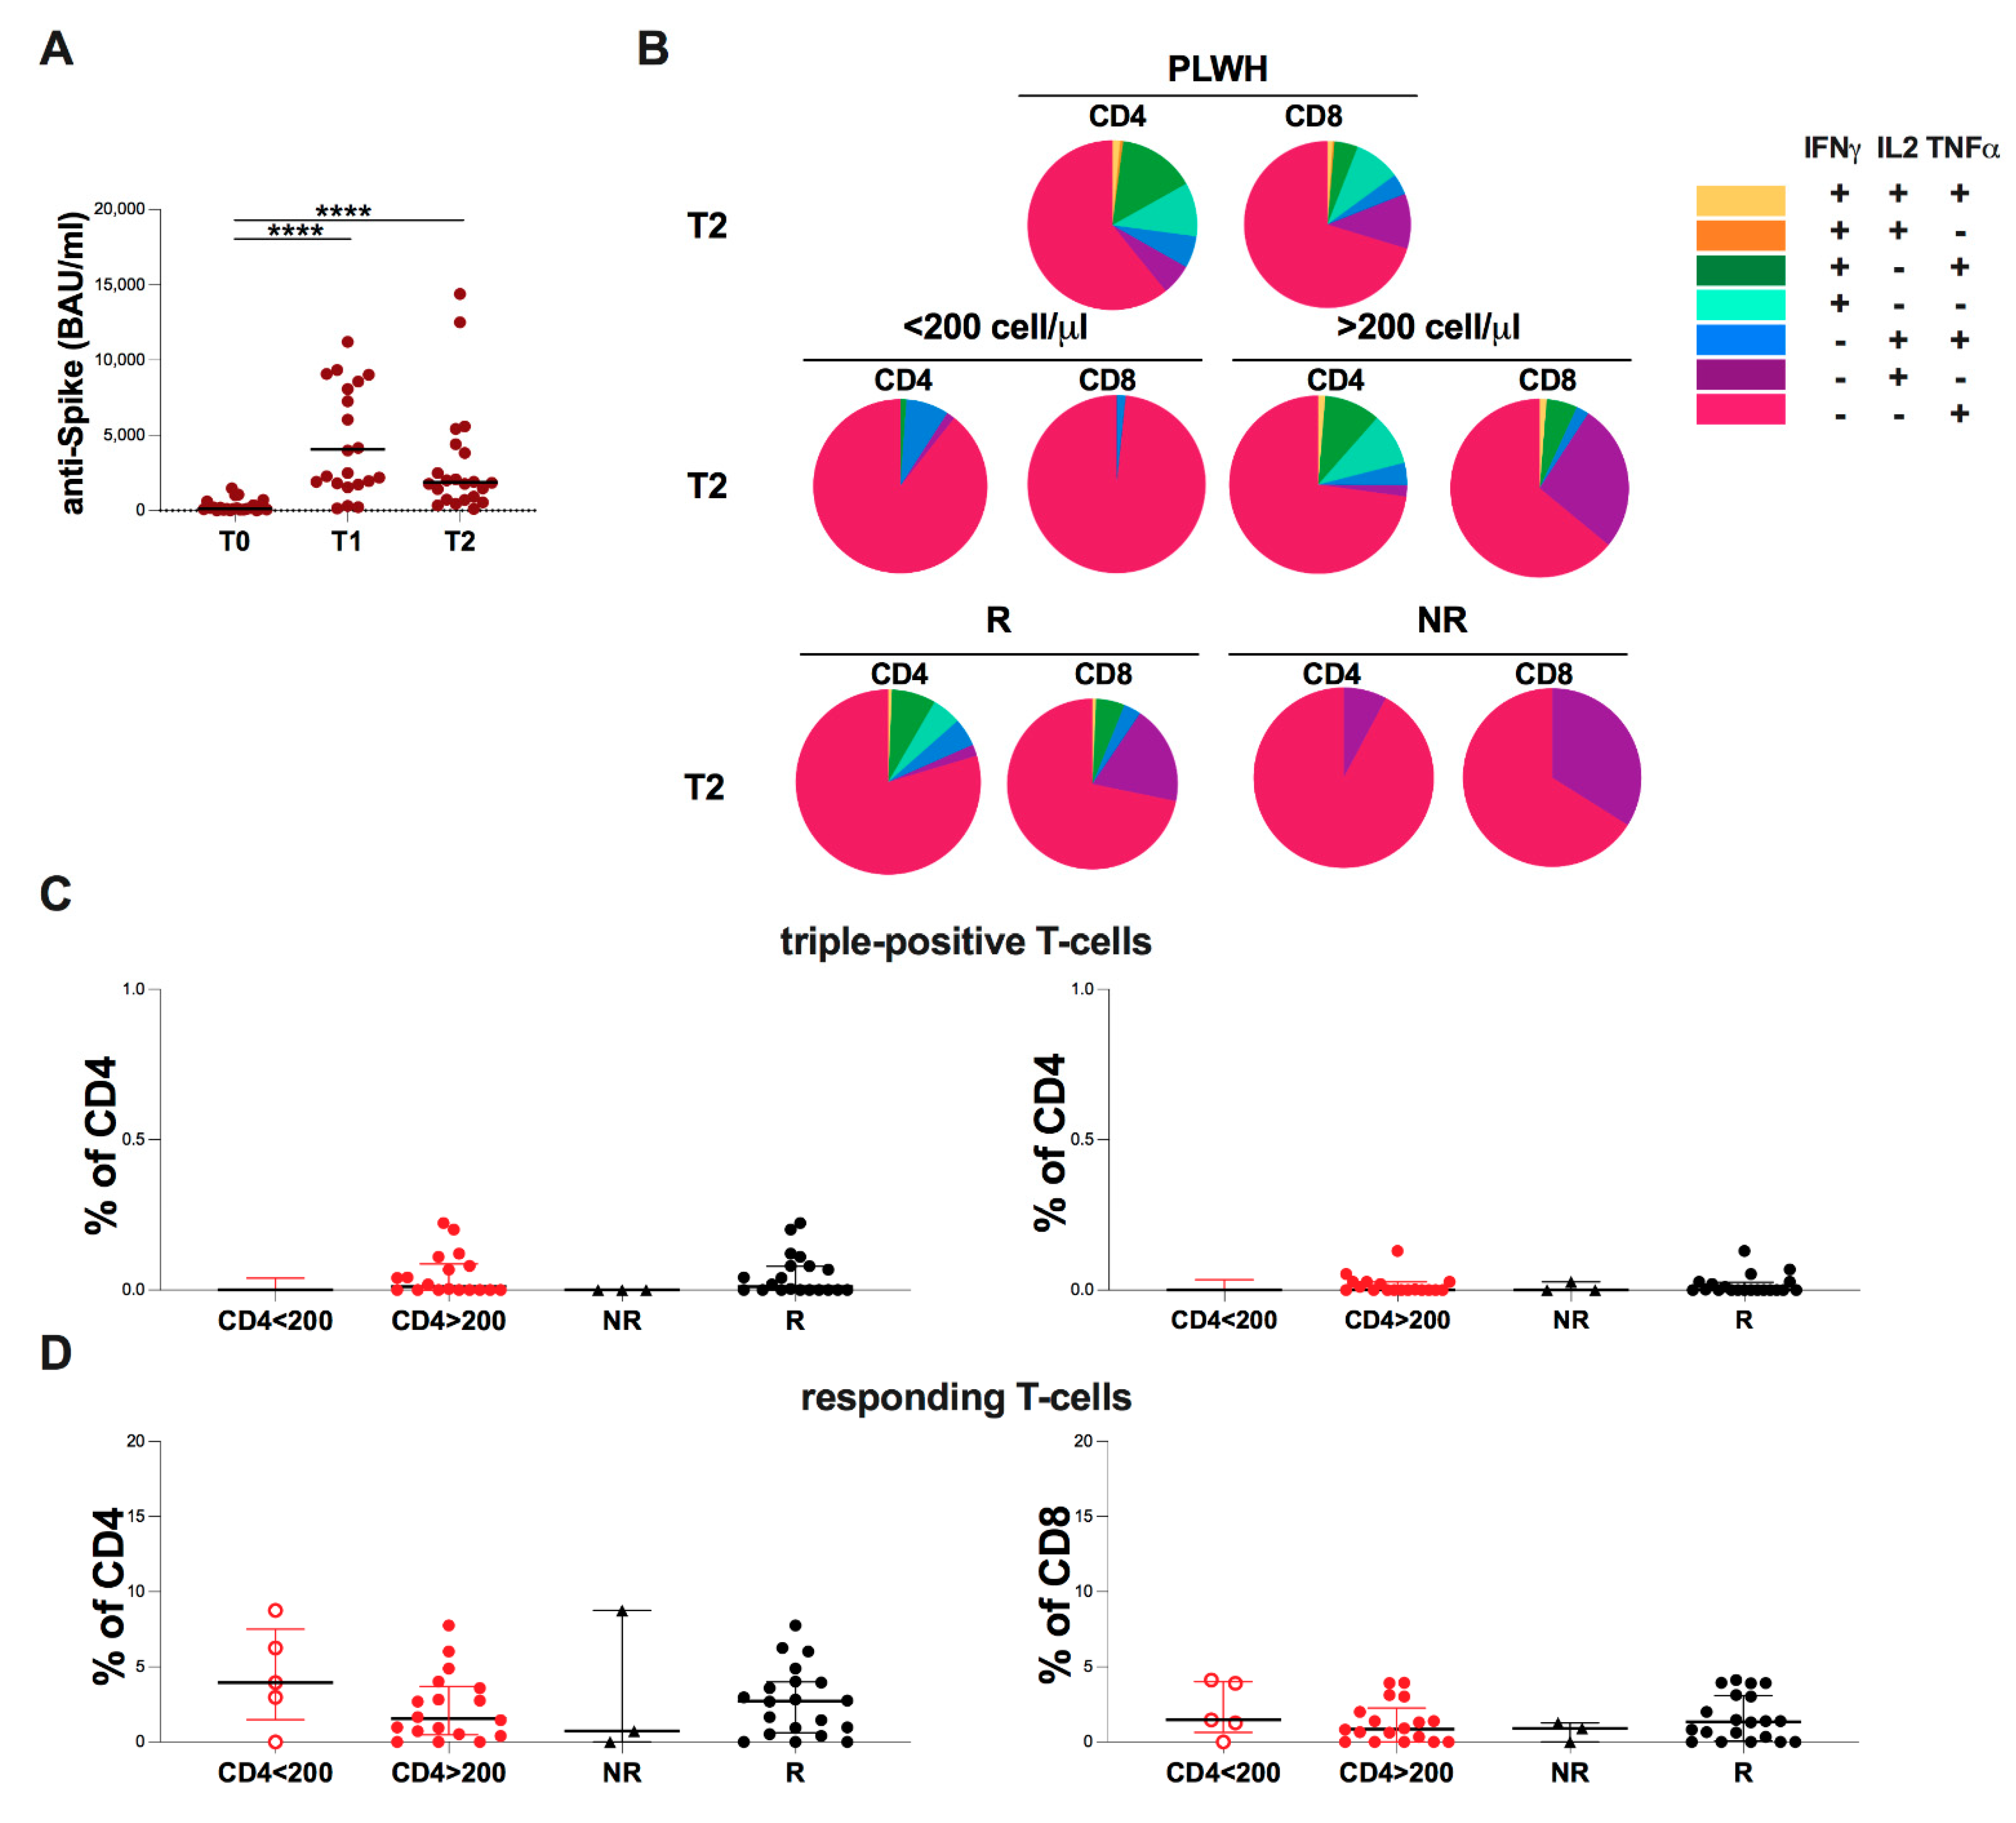
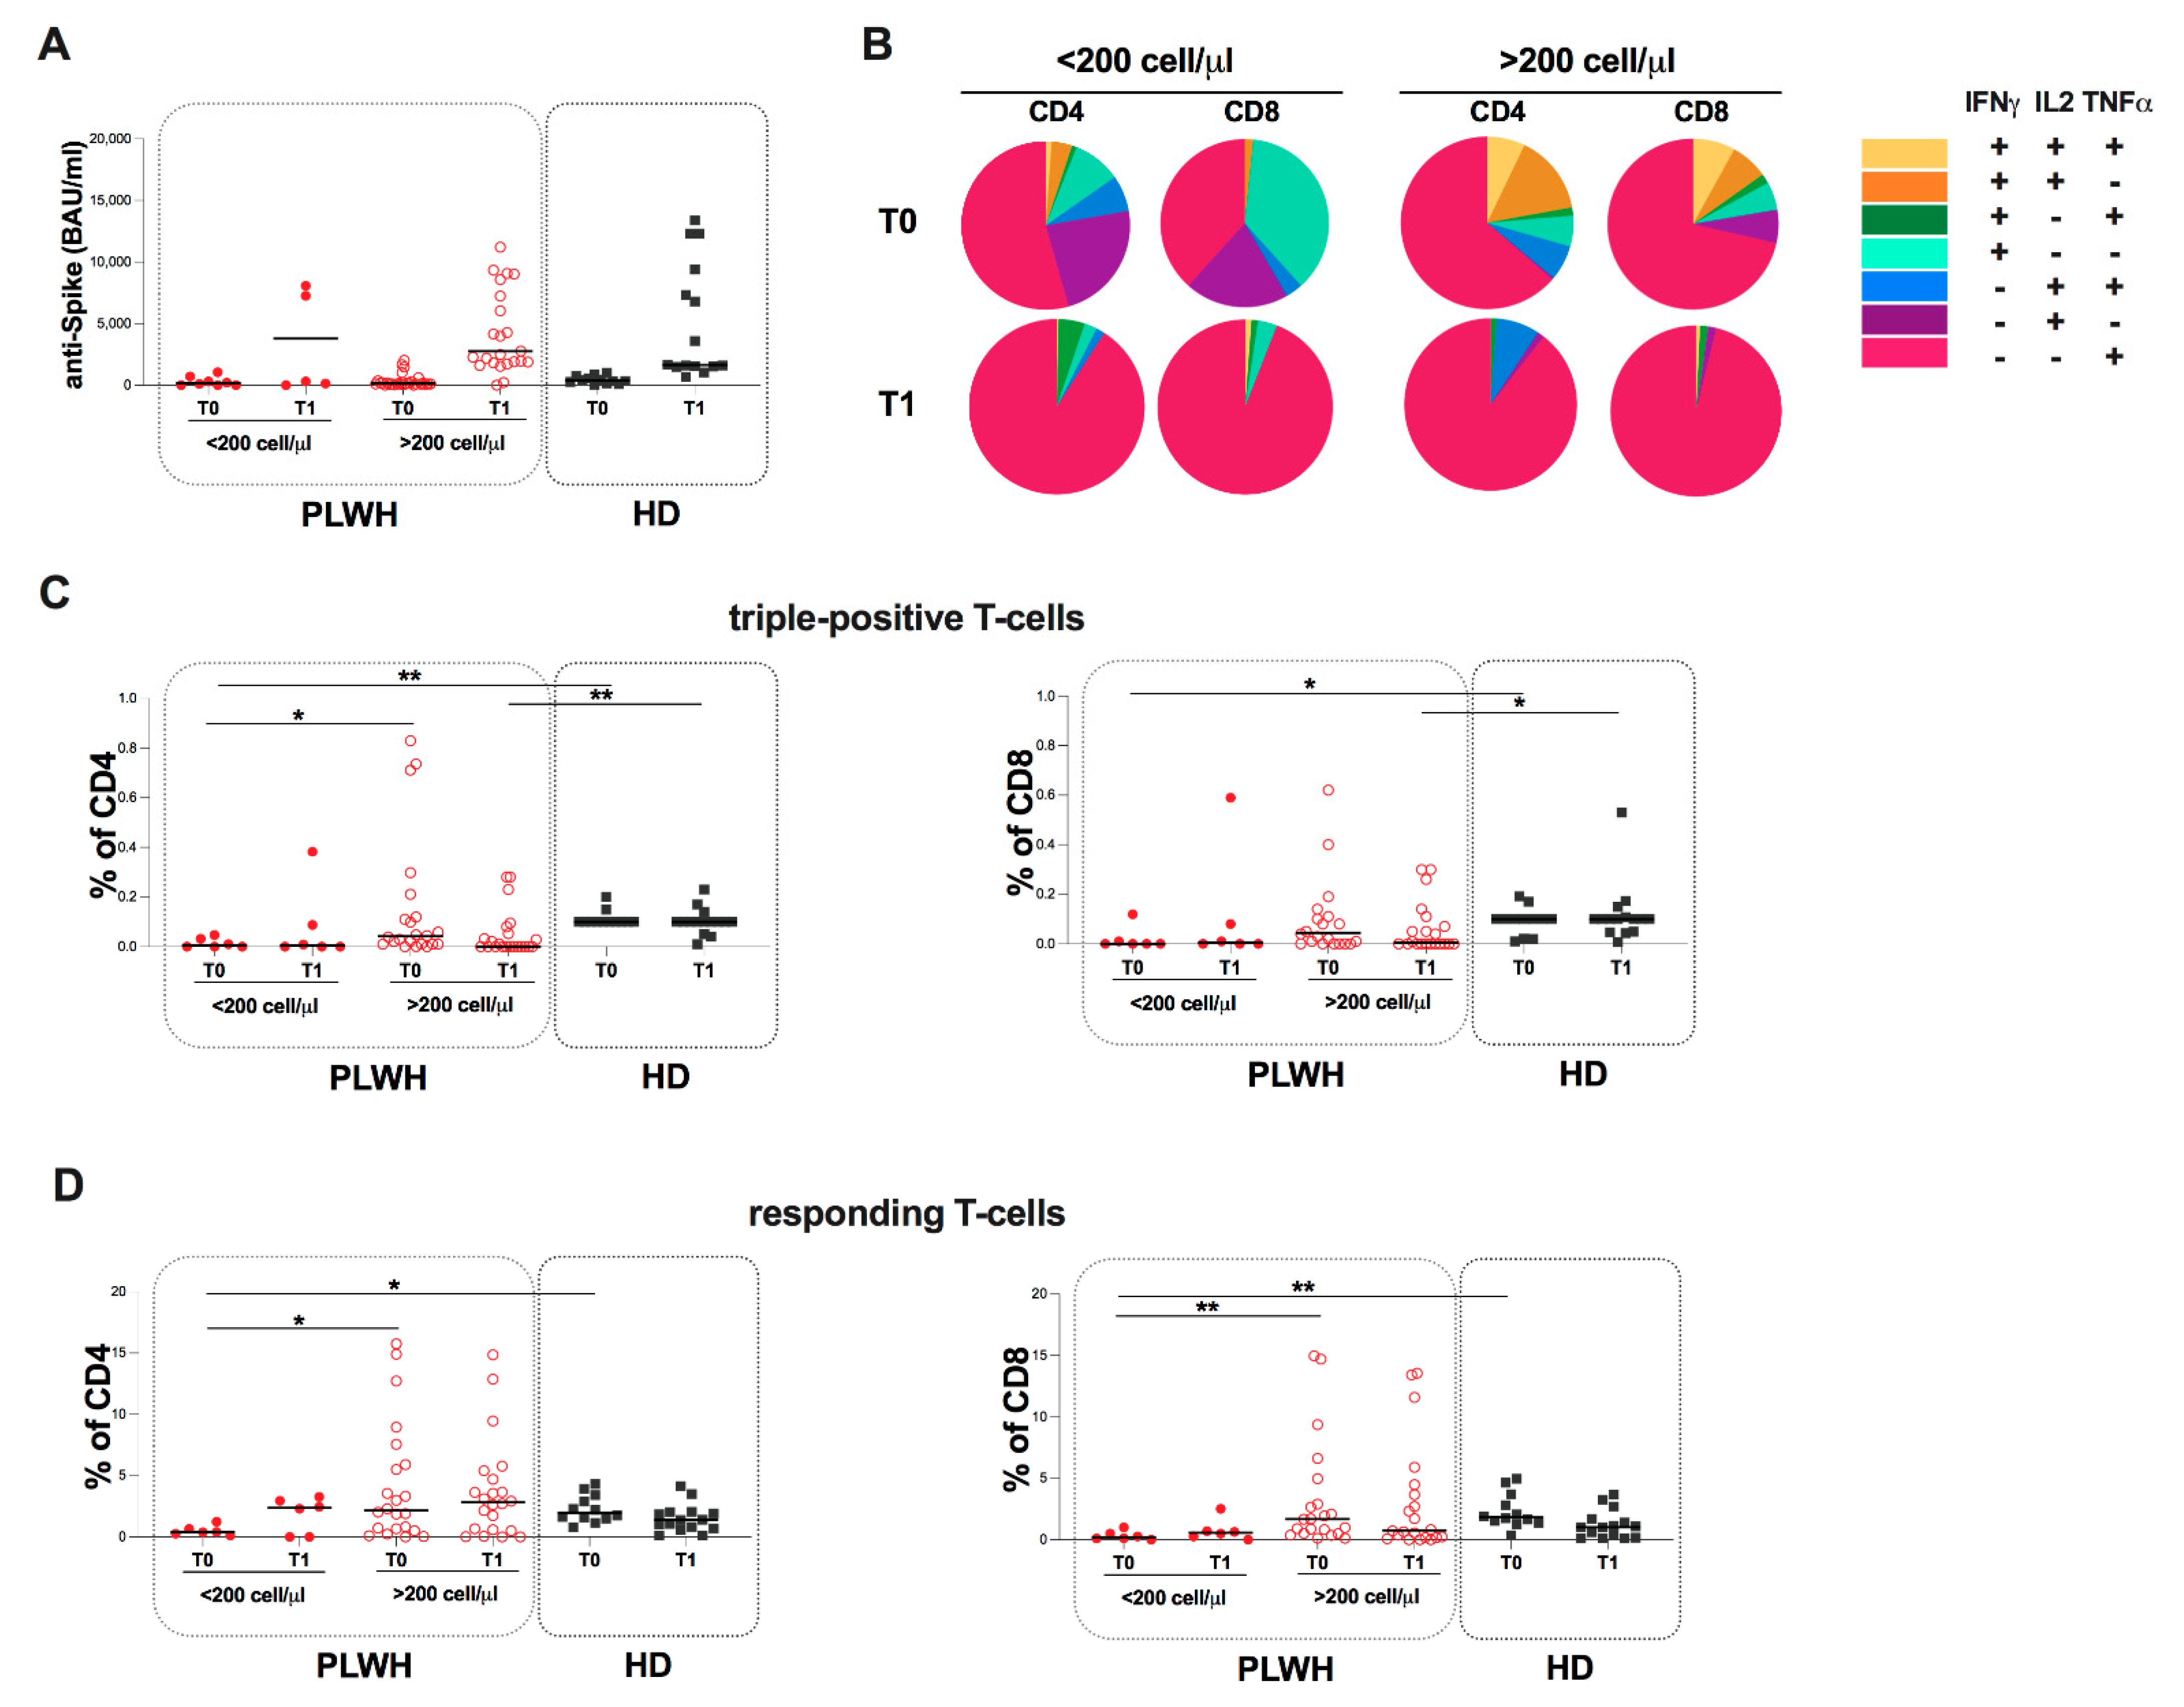
2.3. Evaluation of Spike-Specific Humoral and T-Cell Response in PLWH Stratified According to CD4 Cell Count
2.4. Evaluation of Spike-Specific Humoral and T-Cell Response in PLWH Stratified According to Humoral Response
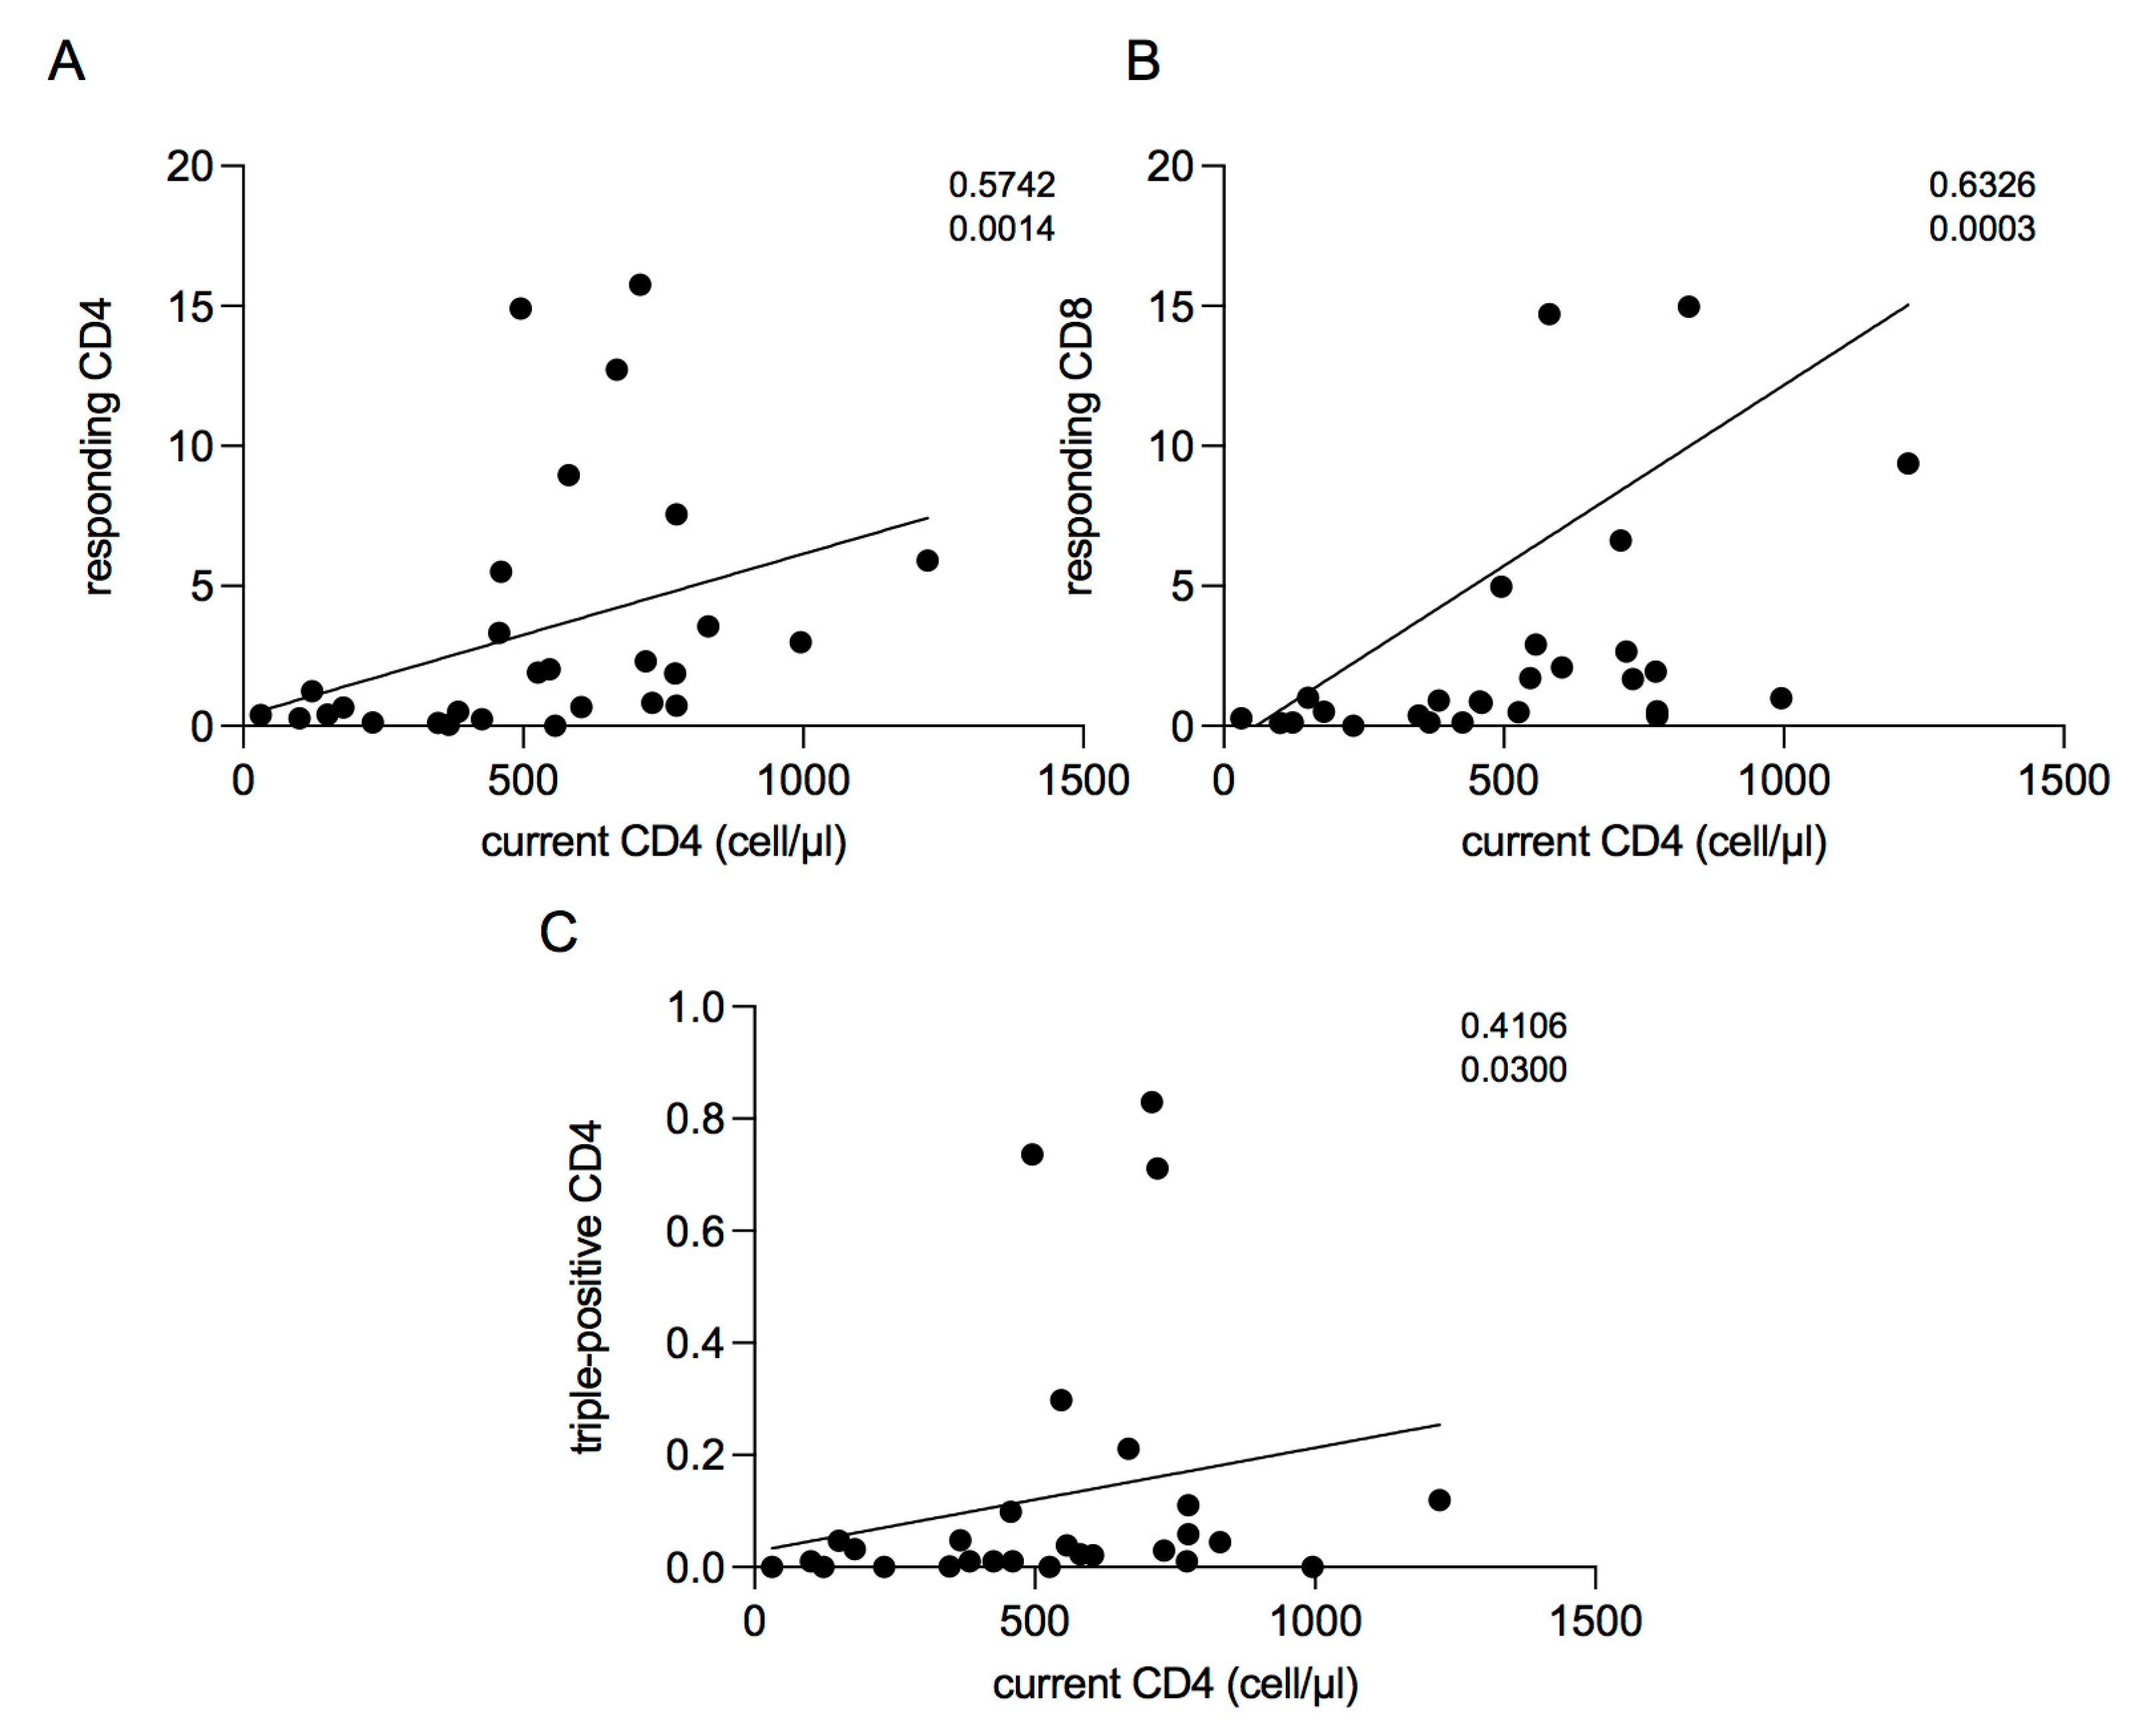
2.5. Correlations between Current CD4 Cell Count and T-Cell Response
2.6. Evaluation of Spike-Specific Humoral and T-Cell at T2 in PLWH
3. Discussion
4. Materials and Methods
4.1. Study Design and Participants
4.2. Evaluation of Anti-S Antibodies
4.3. Determination of Anti-N Antibodies
4.4. T-Cell Stimulation with SARS-CoV-2–Specific Peptide Libraries
4.5. Flow Cytometry Assay of Stimulated T-Cells
4.6. Ethics Statement
4.7. Statistical Analysis
Supplementary Materials
Author Contributions
Funding
Institutional Review Board Statement
Informed Consent Statement
Data Availability Statement
Acknowledgments
Conflicts of Interest
References
- Zhu, N.; Zhang, D.; Wang, W.; Li, X.; Yang, B.; Song, J.; Zhao, X.; Huang, B.; Shi, W.; Lu, R.; et al. A Novel Coronavirus from Patients with Pneumonia in China, 2019. N. Engl. J. Med. 2020, 382, 727–733. [Google Scholar] [CrossRef] [PubMed]
- Governo Italiano. Report Vaccini Anti Covid-19. Available online: https://www.governo.it/it/cscovid19/report-vaccini/ (accessed on 8 March 2022).
- Polack, F.P.; Thomas, S.J.; Kitchin, N.; Absalon, J.; Gurtman, A.; Lockhart, S.; Perez, J.L.; Pérez Marc, G.; Moreira, E.D.; Zerbini, C.; et al. Safety and Efficacy of the BNT162b2 MRNA Covid-19 Vaccine. N. Engl. J. Med. 2020, 383, 2603–2615. [Google Scholar] [CrossRef] [PubMed]
- Sahin, U.; Muik, A.; Derhovanessian, E.; Vogler, I.; Kranz, L.M.; Vormehr, M.; Baum, A.; Pascal, K.; Quandt, J.; Maurus, D.; et al. COVID-19 Vaccine BNT162b1 Elicits Human Antibody and TH1 T Cell Responses. Nature 2020, 586, 594–599. [Google Scholar] [CrossRef]
- Baden, L.R.; El Sahly, H.M.; Essink, B.; Kotloff, K.; Frey, S.; Novak, R.; Diemert, D.; Spector, S.A.; Rouphael, N.; Creech, C.B.; et al. Efficacy and Safety of the MRNA-1273 SARS-CoV-2 Vaccine. N. Engl. J. Med. 2021, 384, 403–416. [Google Scholar] [CrossRef] [PubMed]
- Kalimuddin, S.; Tham, C.Y.L.; Qui, M.; de Alwis, R.; Sim, J.X.Y.; Lim, J.M.E.; Tan, H.-C.; Syenina, A.; Zhang, S.L.; Le Bert, N.; et al. Early T Cell and Binding Antibody Responses Are Associated with COVID-19 RNA Vaccine Efficacy Onset. Medicine 2021, 2, 682–688.e4. [Google Scholar] [CrossRef]
- Turner, J.S.; Kim, W.; Kalaidina, E.; Goss, C.W.; Rauseo, A.M.; Schmitz, A.J.; Hansen, L.; Haile, A.; Klebert, M.K.; Pusic, I.; et al. SARS-CoV-2 Infection Induces Long-Lived Bone Marrow Plasma Cells in Humans. Nature 2021, 595, 421–425. [Google Scholar] [CrossRef] [PubMed]
- Altmann, D.M.; Boyton, R.J.; Beale, R. Immunity to SARS-CoV-2 Variants of Concern. Science 2021, 371, 1103–1104. [Google Scholar] [CrossRef]
- Tarke, A.; Sidney, J.; Methot, N.; Yu, E.D.; Zhang, Y.; Dan, J.M.; Goodwin, B.; Rubiro, P.; Sutherland, A.; Wang, E.; et al. Impact of SARS-CoV-2 Variants on the Total CD4+ and CD8+ T Cell Reactivity in Infected or Vaccinated Individuals. Cell Rep. Med. 2021, 2, 100355. [Google Scholar] [CrossRef] [PubMed]
- Woldemeskel, B.A.; Garliss, C.C.; Blankson, J.N. SARS-CoV-2 MRNA Vaccines Induce Broad CD4+ T Cell Responses That Recognize SARS-CoV-2 Variants and HCoV-NL63. J. Clin. Investig. 2021, 131, e149335. [Google Scholar] [CrossRef] [PubMed]
- Hoffmann, C.; Casado, J.L.; Härter, G.; Vizcarra, P.; Moreno, A.; Cattaneo, D.; Meraviglia, P.; Spinner, C.D.; Schabaz, F.; Grunwald, S.; et al. Immune Deficiency Is a Risk Factor for Severe COVID-19 in People Living with HIV. HIV Med. 2021, 22, 372–378. [Google Scholar] [CrossRef] [PubMed]
- Alrubayyi, A.; Gea-Mallorquí, E.; Touizer, E.; Hameiri-Bowen, D.; Kopycinski, J.; Charlton, B.; Fisher-Pearson, N.; Muir, L.; Rosa, A.; Roustan, C.; et al. Characterization of Humoral and SARS-CoV-2 Specific T Cell Responses in People Living with HIV. Nat. Commun. 2021, 12, 5839. [Google Scholar] [CrossRef] [PubMed]
- Rydyznski Moderbacher, C.; Ramirez, S.I.; Dan, J.M.; Grifoni, A.; Hastie, K.M.; Weiskopf, D.; Belanger, S.; Abbott, R.K.; Kim, C.; Choi, J.; et al. Antigen-Specific Adaptive Immunity to SARS-CoV-2 in Acute COVID-19 and Associations with Age and Disease Severity. Cell 2020, 183, 996–1012.e19. [Google Scholar] [CrossRef]
- Tebas, P.; Frank, I.; Lewis, M.; Quinn, J.; Zifchak, L.; Thomas, A.; Kenney, T.; Kappes, R.; Wagner, W.; Maffei, K.; et al. Poor Immunogenicity of the H1N1 2009 Vaccine in Well Controlled HIV-Infected Individuals. AIDS 2010, 24, 2187–2192. [Google Scholar] [CrossRef]
- Muema, D.M.; Macharia, G.N.; Hassan, A.S.; Mwaringa, S.M.; Fegan, G.W.; Berkley, J.A.; Nduati, E.W.; Urban, B.C. Control of Viremia Enables Acquisition of Resting Memory B Cells with Age and Normalization of Activated B Cell Phenotypes in HIV-Infected Children. J. Immunol. 2015, 195, 1082–1091. [Google Scholar] [CrossRef] [PubMed] [Green Version]
- Guaraldi, G.; Orlando, G.; Zona, S.; Menozzi, M.; Carli, F.; Garlassi, E.; Berti, A.; Rossi, E.; Roverato, A.; Palella, F. Premature Age-Related Comorbidities among HIV-Infected Persons Compared with the General Population. Clin. Infect. Dis. 2011, 53, 1120–1126. [Google Scholar] [CrossRef] [PubMed] [Green Version]
- Woldemeskel, B.A.; Karaba, A.H.; Garliss, C.C.; Beck, E.J.; Wang, K.H.; Laeyendecker, O.; Cox, A.L.; Blankson, J.N. The BNT162b2 MRNA Vaccine Elicits Robust Humoral and Cellular Immune Responses in People Living With Human Immunodeficiency Virus (HIV). Clin. Infect. Dis. 2021, 74, ciab648. [Google Scholar] [CrossRef]
- Levy, I.; Wieder-Finesod, A.; Litchevsky, V.; Biber, A.; Indenbaum, V.; Olmer, L.; Huppert, A.; Mor, O.; Goldstein, M.; Levin, E.G.; et al. Immunogenicity and Safety of the BNT162b2 MRNA COVID-19 Vaccine in People Living with HIV-1. Clin. Microbiol. Infect. 2021, 27, 1851–1855. [Google Scholar] [CrossRef] [PubMed]
- Ruddy, J.A.; Boyarsky, B.J.; Bailey, J.R.; Karaba, A.H.; Garonzik-Wang, J.M.; Segev, D.L.; Durand, C.M.; Werbel, W.A. Safety and Antibody Response to Two-Dose SARS-CoV-2 Messenger RNA Vaccination in Persons with HIV. AIDS 2021, 35, 2399–2401. [Google Scholar] [CrossRef]
- Lombardi, A.; Butta, G.M.; Donnici, L.; Bozzi, G.; Oggioni, M.; Bono, P.; Matera, M.; Consonni, D.; Ludovisi, S.; Muscatello, A.; et al. Anti-Spike Antibodies and Neutralising Antibody Activity in People Living with HIV Vaccinated with COVID-19 MRNA-1273 Vaccine: A Prospective Single-Centre Cohort Study. Lancet Reg. Health Eur. 2022, 13, 100287. [Google Scholar] [CrossRef] [PubMed]
- Antinori, A.; Cicalini, S.; Meschi, S.; Bordoni, V.; Lorenzini, P.; Vergori, A.; Lanini, S.; De Pascale, L.; Matusali, G.; Mariotti, D.; et al. Humoral and Cellular Immune Response Elicited by MRNA Vaccination against SARS-CoV-2 in People Living with HIV (PLWH) Receiving Antiretroviral Therapy (ART) According with Current CD4 T-Lymphocyte Count. Clin. Infect. Dis. 2022, 75, ciac238. [Google Scholar] [CrossRef]
- Seder, R.A.; Darrah, P.A.; Roederer, M. T-Cell Quality in Memory and Protection: Implications for Vaccine Design. Nat. Rev. Immunol. 2008, 8, 247–258. [Google Scholar] [CrossRef] [PubMed]
- Bertoletti, A.; Le Bert, N.; Qui, M.; Tan, A.T. SARS-CoV-2-Specific T Cells in Infection and Vaccination. Cell. Mol. Immunol. 2021, 18, 2307–2312. [Google Scholar] [CrossRef] [PubMed]
- Betts, M.R.; Nason, M.C.; West, S.M.; De Rosa, S.C.; Migueles, S.A.; Abraham, J.; Lederman, M.M.; Benito, J.M.; Goepfert, P.A.; Connors, M.; et al. HIV Nonprogressors Preferentially Maintain Highly Functional HIV-Specific CD8+ T Cells. Blood 2006, 107, 4781–4789. [Google Scholar] [CrossRef] [PubMed] [Green Version]
- Painter, M.M.; Mathew, D.; Goel, R.R.; Apostolidis, S.A.; Pattekar, A.; Kuthuru, O.; Baxter, A.E.; Herati, R.S.; Oldridge, D.A.; Gouma, S.; et al. Rapid Induction of Antigen-Specific CD4+ T Cells Is Associated with Coordinated Humoral and Cellular Immunity to SARS-CoV-2 MRNA Vaccination. Immunity 2021, 54, 2133–2142.e3. [Google Scholar] [CrossRef]
- Arunachalam, P.S.; Scott, M.K.D.; Hagan, T.; Li, C.; Feng, Y.; Wimmers, F.; Grigoryan, L.; Trisal, M.; Edara, V.V.; Lai, L.; et al. Systems Vaccinology of the BNT162b2 MRNA Vaccine in Humans. Nature 2021, 596, 410–416. [Google Scholar] [CrossRef]
- McElhaney, J.E.; Gravenstein, S.; Upshaw, C.M.; Hooton, J.W.; Krause, P.; Drinka, P. Immune Response to Influenza Vaccination in Institutionalized Elderly: Effect on Different T-Cell Subsets. Vaccine 1998, 16, 403–409. [Google Scholar] [CrossRef]
- Riou, C.; du Bruyn, E.; Stek, C.; Daroowala, R.; Goliath, R.T.; Abrahams, F.; Said-Hartley, Q.; Allwood, B.W.; Hsiao, N.-Y.; Wilkinson, K.A.; et al. Relationship of SARS-CoV-2-Specific CD4 Response to COVID-19 Severity and Impact of HIV-1 and Tuberculosis Coinfection. J. Clin. Investig. 2021, 131, 149125. [Google Scholar] [CrossRef]
- Schub, D.; Klemis, V.; Schneitler, S.; Mihm, J.; Lepper, P.M.; Wilkens, H.; Bals, R.; Eichler, H.; Gärtner, B.C.; Becker, S.L.; et al. High Levels of SARS-CoV-2-Specific T Cells with Restricted Functionality in Severe Courses of COVID-19. JCI Insight 2020, 5, 142167. [Google Scholar] [CrossRef]
- Feikin, D.R.; Higdon, M.M.; Abu-Raddad, L.J.; Andrews, N.; Araos, R.; Goldberg, Y.; Groome, M.J.; Huppert, A.; O’Brien, K.L.; Smith, P.G.; et al. Duration of Effectiveness of Vaccines against SARS-CoV-2 Infection and COVID-19 Disease: Results of a Systematic Review and Meta-Regression. Lancet 2022, 399, 924–944. [Google Scholar] [CrossRef] [PubMed]
- Darrah, P.A.; Patel, D.T.; De Luca, P.M.; Lindsay, R.W.B.; Davey, D.F.; Flynn, B.J.; Hoff, S.T.; Andersen, P.; Reed, S.G.; Morris, S.L.; et al. Multifunctional TH1 Cells Define a Correlate of Vaccine-Mediated Protection against Leishmania Major. Nat. Med. 2007, 13, 843–850. [Google Scholar] [CrossRef]
- Zingaropoli, M.A.; Iannetta, M.; Pontecorvo, S.; Anzivino, E.; Prezioso, C.; Rodio, D.M.; Morreale, M.; D’Abramo, A.; Oliva, A.; Lichtner, M.; et al. JC Virus-DNA Detection Is Associated with CD8 Effector Accumulation in Peripheral Blood of Patients with Multiple Sclerosis under Natalizumab Treatment, Independently from JC Virus Serostatus. Available online: https://www.hindawi.com/journals/bmri/2018/5297980/cta/ (accessed on 22 March 2018).
- Iannetta, M.; Landi, D.; Cola, G.; Campogiani, L.; Malagnino, V.; Teti, E.; Coppola, L.; Di Lorenzo, A.; Fraboni, D.; Buccisano, F.; et al. B-and T-Cell Responses After SARS-CoV-2 Vaccination in Patients With Multiple Sclerosis Receiving Disease Modifying Therapies: Immunological Patterns and Clinical Implications. Front. Immunol. 2021, 12, 796482. [Google Scholar] [CrossRef] [PubMed]
- Guardiani, M.; Zingaropoli, M.A.; Cogliati Dezza, F.; Centofanti, A.; Carillo, C.; Tortellini, E.; Dominelli, F.; Napoli, A.; Del Borgo, C.; Gaeta, A.; et al. Evaluation of Immunogenicity to Three Doses of the SARS-CoV-2 BNT162b2 MRNA Vaccine in Lung Transplant Patients. Vaccines 2022, 10, 1642. [Google Scholar] [CrossRef] [PubMed]


| PLWH (n = 37) | HD (n = 18) | |
|---|---|---|
| Age, median (IQR) years | 61 (48–68) | 30 (30–53) |
| Male/Female | 26/11 | 13/5 |
| Current CD4 cell count (cells/µL) | 547 (308–714) | |
| CD4+ cell count nadir, (cells/µL) | 90 (22–281) | |
| HIV-RNA zenith (cp/mL) | 92,280 (17,000–544,323) | |
| HIV-RNA (cp/mL) | 40 (40–166) | |
| ART | ||
| Dual (%) | 8/37 (22%) | |
| Non-Dual (%) | 29/37 (78%) | |
| Comorbidities | ||
| Any (%) | 11/37 (30%) | |
| More than one (%) | 26/37 (70%) | |
| HCV serostatus | ||
| Anti-HCV Ab positive (%) | 9/37 (24%) | |
| Smoke status | ||
| No (%) | 24/37 (65%) | |
| Yes (%) | 13/37 (35%) |
Publisher’s Note: MDPI stays neutral with regard to jurisdictional claims in published maps and institutional affiliations. |
© 2022 by the authors. Licensee MDPI, Basel, Switzerland. This article is an open access article distributed under the terms and conditions of the Creative Commons Attribution (CC BY) license (https://creativecommons.org/licenses/by/4.0/).
Share and Cite
Tortellini, E.; Zingaropoli, M.A.; Mancarella, G.; Marocco, R.; Carraro, A.; Jamhour, M.; Barbato, C.; Guardiani, M.; Dominelli, F.; Pasculli, P.; et al. Quality of T-Cell Response to SARS-CoV-2 mRNA Vaccine in ART-Treated PLWH. Int. J. Mol. Sci. 2022, 23, 14988. https://doi.org/10.3390/ijms232314988
Tortellini E, Zingaropoli MA, Mancarella G, Marocco R, Carraro A, Jamhour M, Barbato C, Guardiani M, Dominelli F, Pasculli P, et al. Quality of T-Cell Response to SARS-CoV-2 mRNA Vaccine in ART-Treated PLWH. International Journal of Molecular Sciences. 2022; 23(23):14988. https://doi.org/10.3390/ijms232314988
Chicago/Turabian StyleTortellini, Eeva, Maria Antonella Zingaropoli, Giulia Mancarella, Raffaella Marocco, Anna Carraro, Meriem Jamhour, Christian Barbato, Mariasilvia Guardiani, Federica Dominelli, Patrizia Pasculli, and et al. 2022. "Quality of T-Cell Response to SARS-CoV-2 mRNA Vaccine in ART-Treated PLWH" International Journal of Molecular Sciences 23, no. 23: 14988. https://doi.org/10.3390/ijms232314988
APA StyleTortellini, E., Zingaropoli, M. A., Mancarella, G., Marocco, R., Carraro, A., Jamhour, M., Barbato, C., Guardiani, M., Dominelli, F., Pasculli, P., Napoli, A., Gaeta, A., Mengoni, F., Zuccalà, P., Belvisi, V., Kertusha, B., Parente, A., Del Borgo, C., Vullo, V., ... LATINA COVID-19 Group. (2022). Quality of T-Cell Response to SARS-CoV-2 mRNA Vaccine in ART-Treated PLWH. International Journal of Molecular Sciences, 23(23), 14988. https://doi.org/10.3390/ijms232314988