

Intermittent ELF-MF Induce an Amplitude-Window Effect on Umbilical Cord Blood Lymphocytes


Abstract
1. Introduction
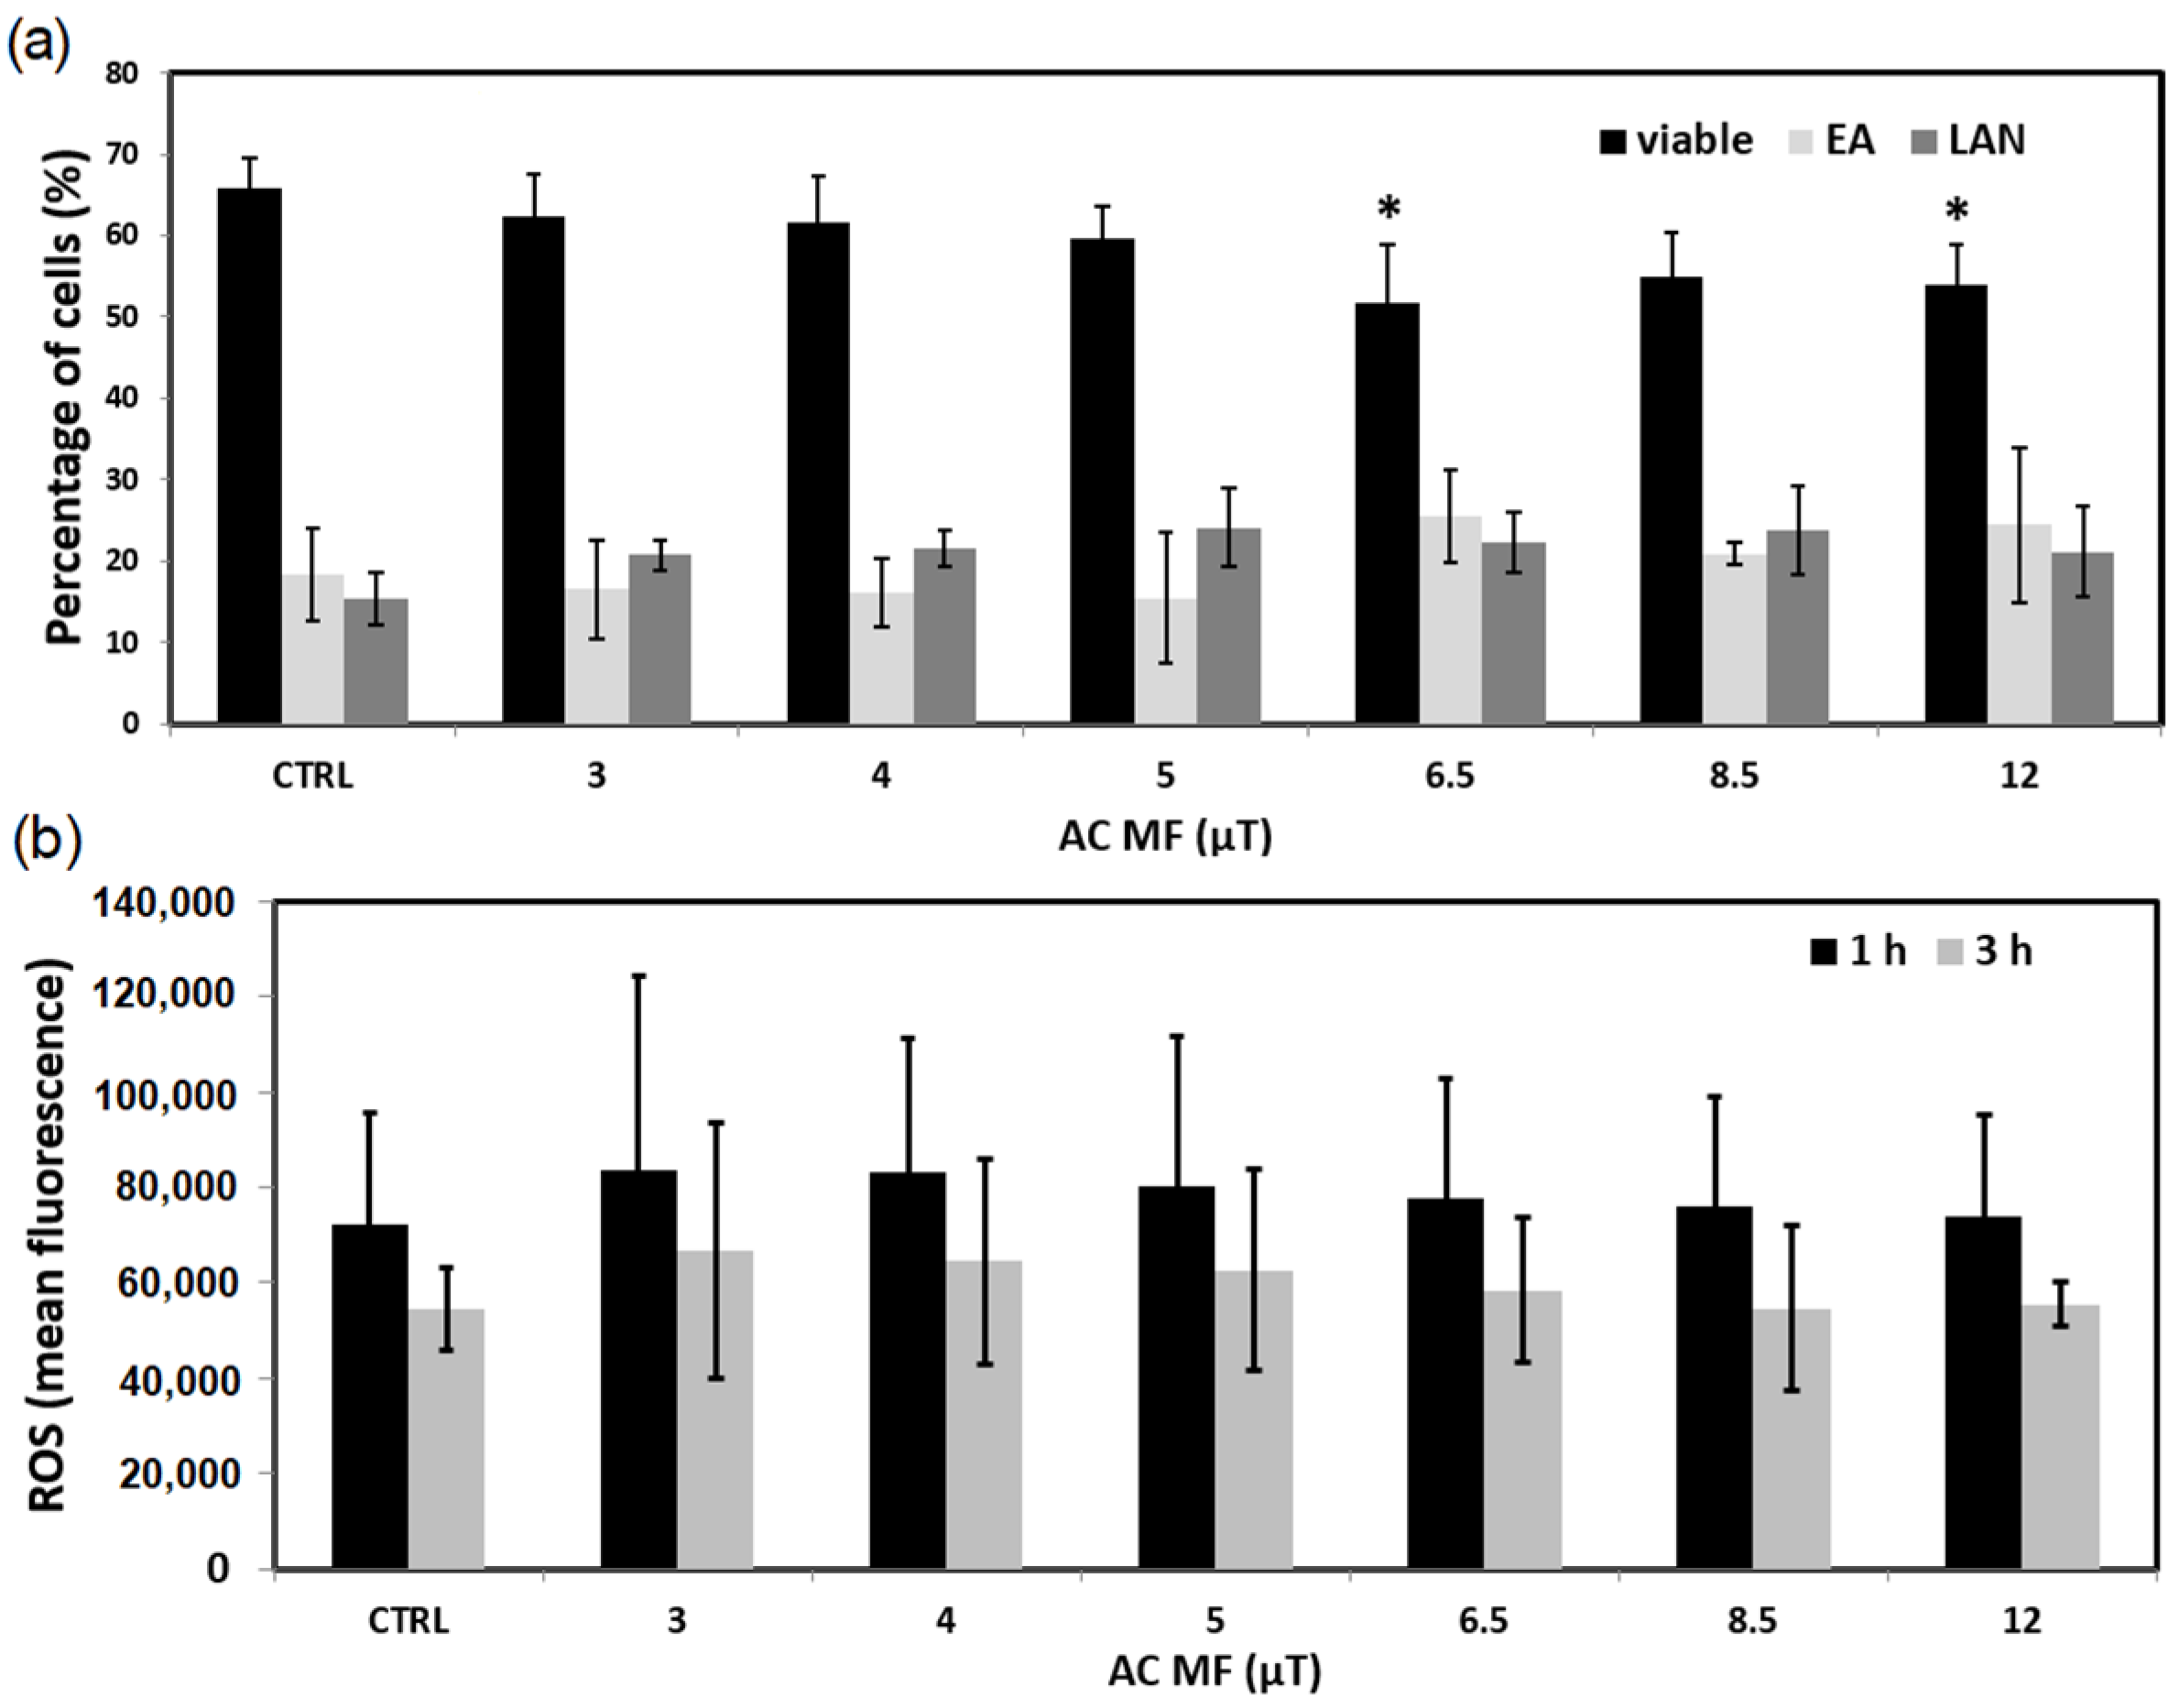
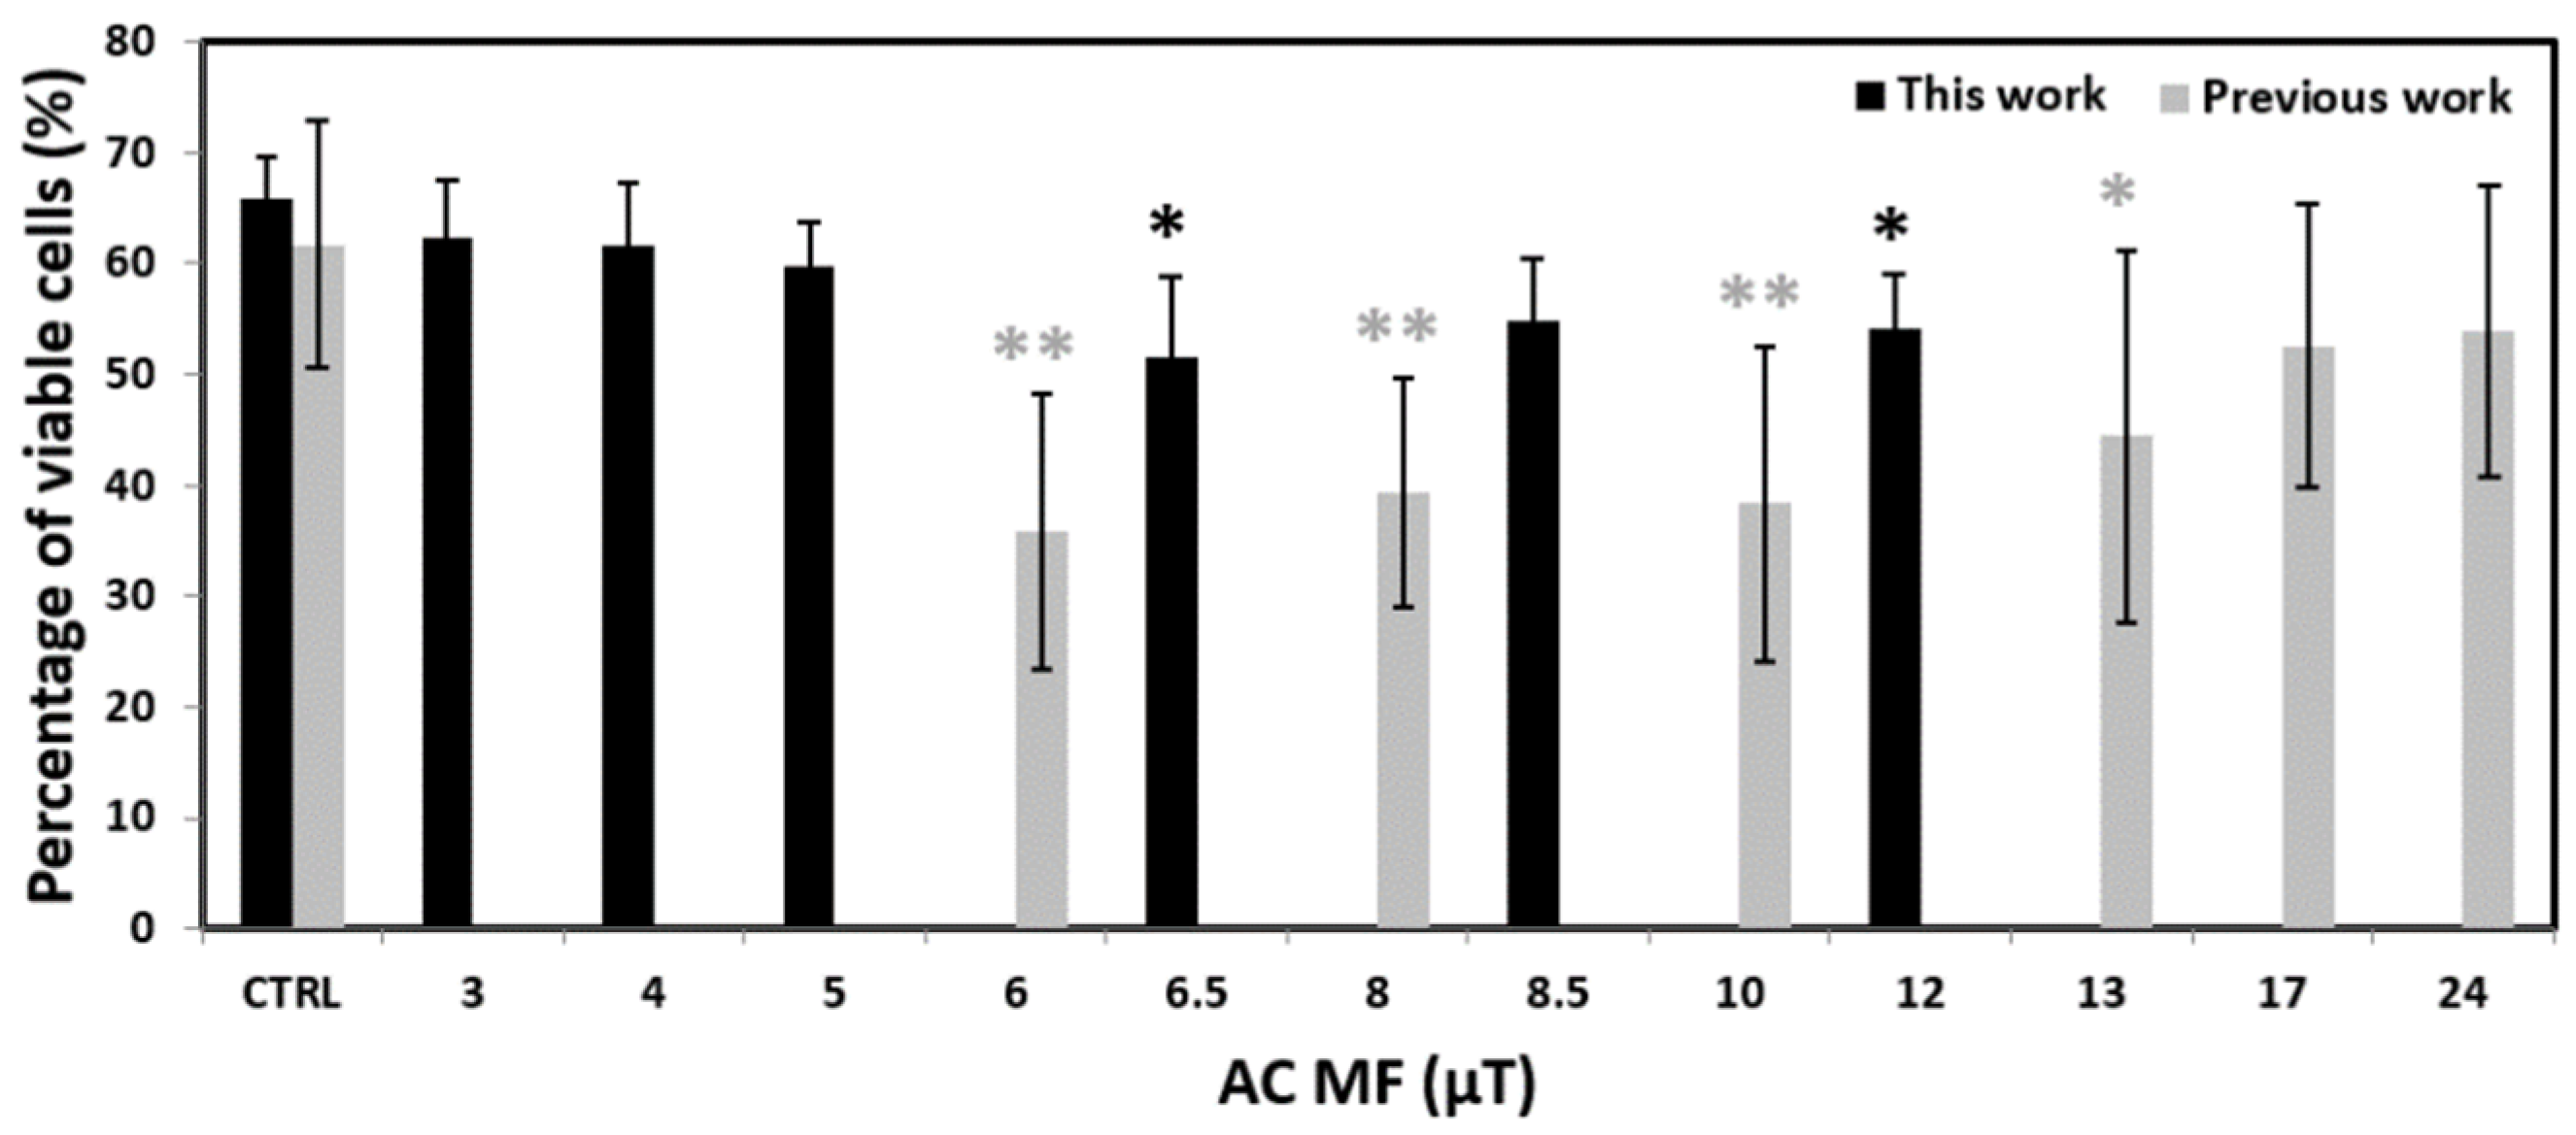
2. Results
3. Discussion
4. Materials and Methods
4.1. Cell Culture
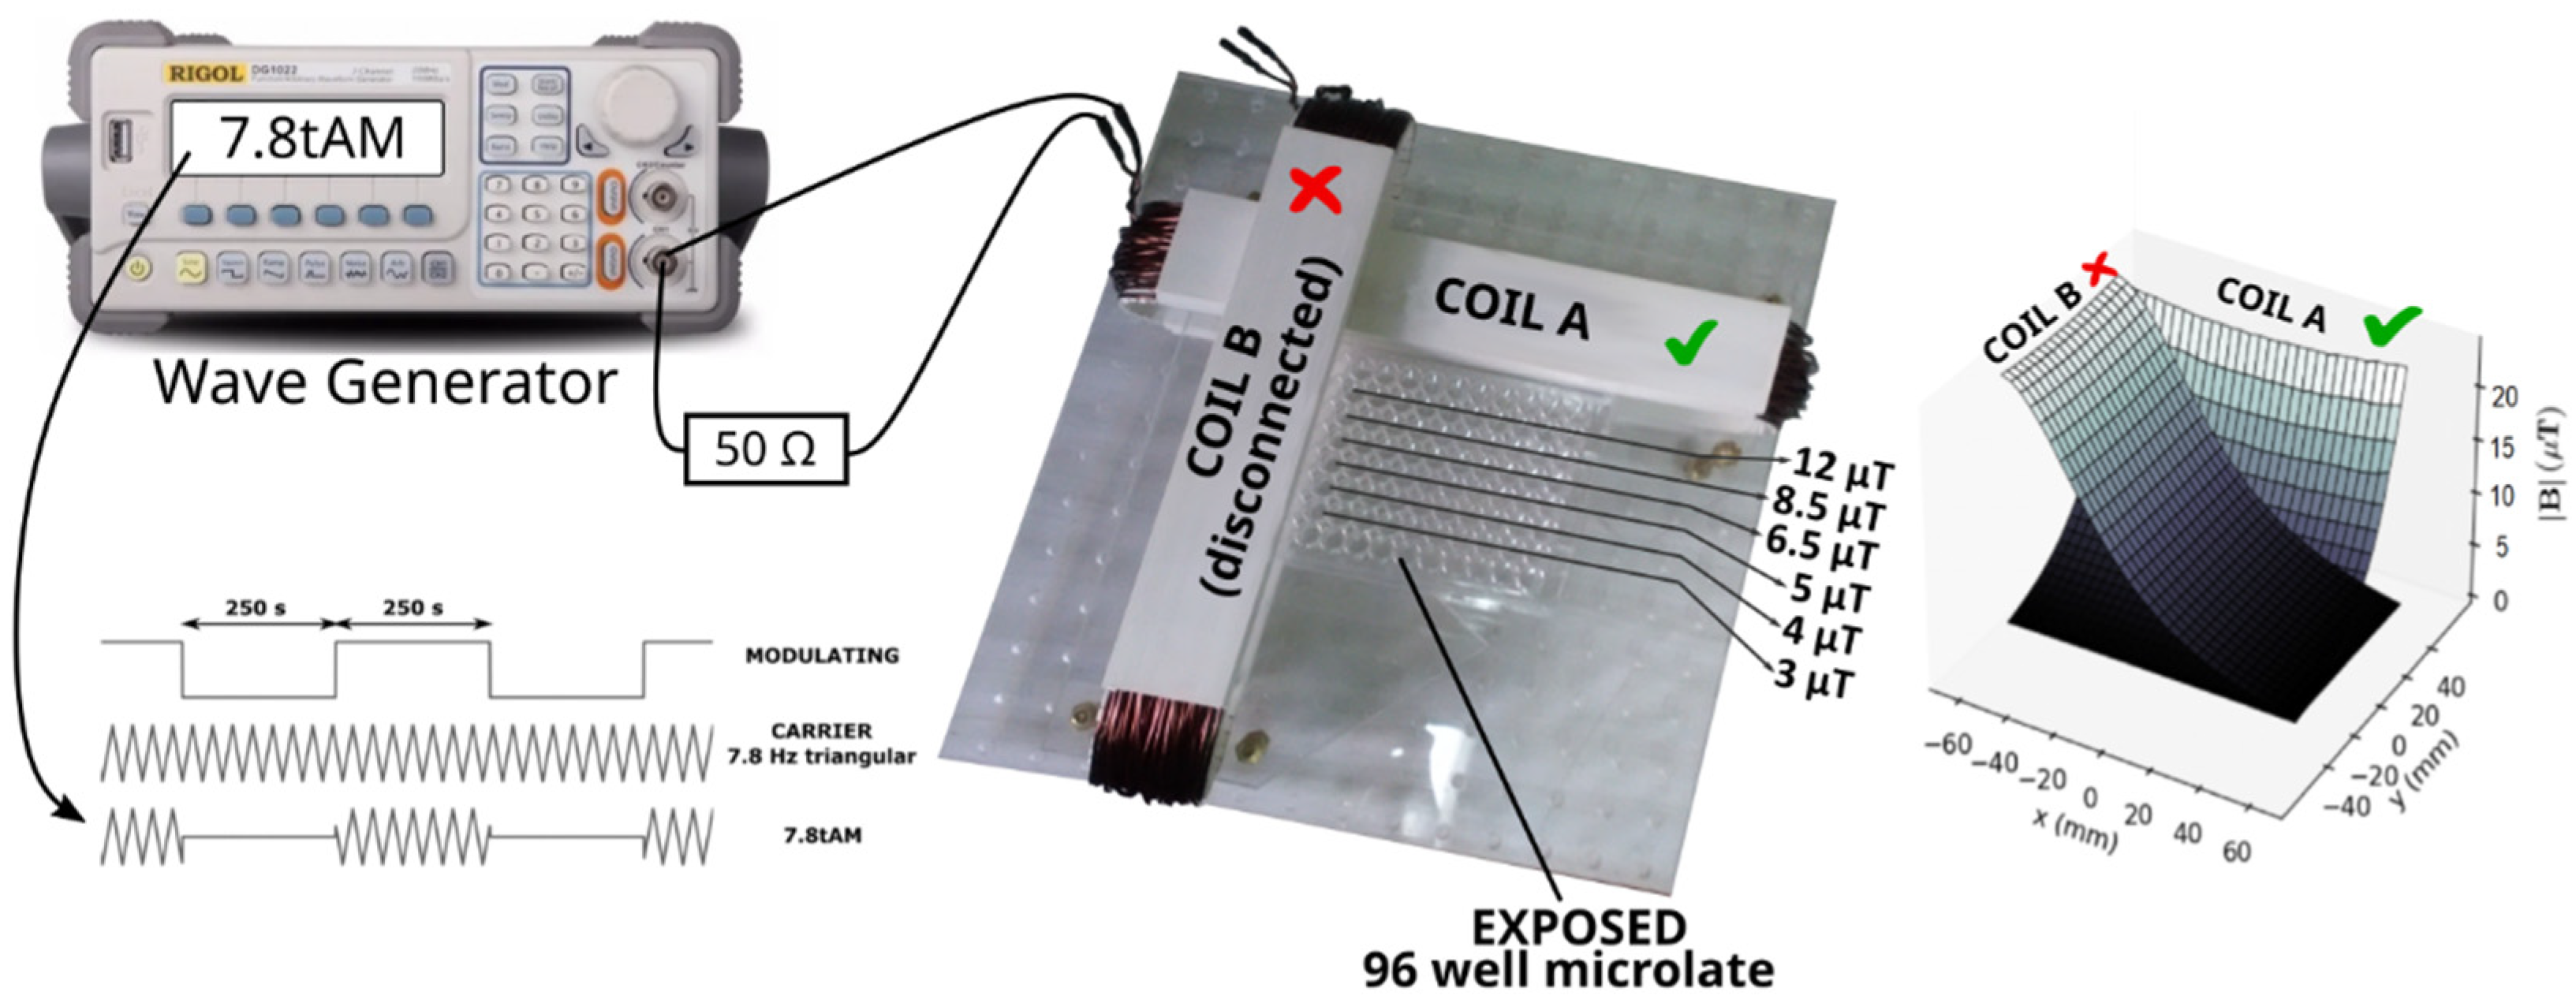
4.2. Exposure to Intermittent ELF-MF
4.3. Flow Cytometry
4.4. Reactive Oxygen Species
4.5. Statistical Analysis
Author Contributions
Funding
Institutional Review Board Statement
Informed Consent Statement
Data Availability Statement
Conflicts of Interest
References
- Barnothy, J.M.; Barnothy, M.F.; Boszormeny-Nagy, I. Influence of a Magnetic Field upon de Leucocytes of the Mouse. Nature 1956, 177, 577–578. [Google Scholar] [CrossRef] [PubMed]
- Wertheimer, N.; Leeper, E. Electrical Wiring Configurations and Childhood Cancer. Am. J. Epidemiol. 1979, 109, 273–284. [Google Scholar] [CrossRef] [PubMed]
- IARC. Non-Ionizing Radiation, Part 1: Static and Extremely Low-Frequency (ELF) Electric and Magnetic Fields. In IARC Monographs on the Evaluation of Carcinogenic Risks to Humans; IARC Press: Lyon, France, 2002. [Google Scholar]
- Svendsen, A.L.; Weihkopf, T.; Kaatsch, P.; Schüz, J. Exposure to Magnetic Fields and Survival after Diagnosis of Childhood Leukemia: A German Cohort Study. Cancer Epidemiol. Biomark. Prev. 2007, 16, 1167–1171. [Google Scholar] [CrossRef] [PubMed][Green Version]
- Pedersen, C.; Raaschou-Nielsen, O.; Rod, N.H.; Frei, P.; Poulsen, A.H.; Johansen, C.; Schüz, J. Distance from Residence to Power Line and Risk of Childhood Leukemia: A Population-Based Case–Control Study in Denmark. Cancer Causes Control 2014, 25, 171–177. [Google Scholar] [CrossRef]
- Núñez-Enríquez, J.C.; Correa-Correa, V.; Flores-Lujano, J.; Pérez-Saldivar, M.L.; Jiménez-Hernández, E.; Martín-Trejo, J.A.; Espinoza-Hernández, L.E.; Medina-Sanson, A.; Cárdenas-Cardos, R.; Flores-Villegas, L.V.; et al. Extremely Low-Frequency Magnetic Fields and the Risk of Childhood B-Lineage Acute Lymphoblastic Leukemia in a City With High Incidence of Leukemia and Elevated Exposure to ELF Magnetic Fields. Bioelectromagnetics 2020, 41, 581–597. [Google Scholar] [CrossRef] [PubMed]
- Amoon, A.T.; Crespi, C.M.; Ahlbom, A.; Bhatnagar, M.; Bray, I.; Bunch, K.J.; Clavel, J.; Feychting, M.; Hémon, D.; Johansen, C.; et al. Proximity to Overhead Power Lines and Childhood Leukaemia: An International Pooled Analysis. Br. J. Cancer 2018, 119, 364–373. [Google Scholar] [CrossRef] [PubMed]
- Ahlbom, A.; Day, N.; Feychting, M.; Roman, E.; Skinner, J.; Dockerty, J.; Linet, M.; McBride, M.; Michaelis, J.; Olsen, J.H.; et al. A Pooled Analysis of Magnetic Fields and Childhood Leukaemia. Br. J. Cancer 2000, 83, 692–698. [Google Scholar] [CrossRef]
- Zhang, Y.; Lai, J.; Ruan, G.; Chen, C.; Wang, D.W. Meta-Analysis of Extremely Low Frequency Electromagnetic Fields and Cancer Risk: A Pooled Analysis of Epidemiologic Studies. Environ. Int. 2016, 88, 36–43. [Google Scholar] [CrossRef]
- Schmidt, J.-A.; Hornhardt, S.; Erdmann, F.; Sánchez-García, I.; Fischer, U.; Schüz, J.; Ziegelberger, G. Risk Factors for Childhood Leukemia: Radiation and Beyond. Front. Public Health 2021, 9, 805757. [Google Scholar] [CrossRef]
- Maffei, M.E. Magnetic Fields and Cancer: Epidemiology, Cellular Biology, and Theranostics. Int. J. Mol. Sci. 2022, 23, 1339. [Google Scholar] [CrossRef]
- Manser, M.; Sater, M.R.A.; Schmid, C.D.; Noreen, F.; Murbach, M.; Kuster, N.; Schuermann, D.; Schär, P. ELF-MF Exposure Affects the Robustness of Epigenetic Programming during Granulopoiesis. Sci. Rep. 2017, 7, 43345. [Google Scholar] [CrossRef]
- Uckun, F.M.; Kurosaki, T.; Jin, J.; Jun, X.; Morgan, A.; Takata, M.; Bolen, J.; Luben, R. Exposure of B-Lineage Lymphoid Cells to Low Energy Electromagnetic Fields Stimulates Lyn Kinase. J. Biol. Chem. 1995, 270, 27666–27670. [Google Scholar] [CrossRef] [PubMed]
- Lindström, E.; Still, M.; Mattsson, M.-O.; Hansson Mild, K.; Luben, R.A. ELF Magnetic Fields Initiate Protein Tyrosine Phosphorylation of the T Cell Receptor Complex. Bioelectrochemistry 2001, 53, 73–78. [Google Scholar] [CrossRef]
- Miller, S.C.; Furniss, M.J. Bruton’s Tyrosine Kinase Activity and Inositol 1,4,5-Trisphosphate Production Are Not Altered in DT40 Lymphoma B Cells Exposed to Power Line Frequency Magnetic Fields. J. Biol. Chem. 1998, 273, 32618–32626. [Google Scholar] [CrossRef] [PubMed]
- Kapri-Pardes, E.; Hanoch, T.; Maik-Rachline, G.; Murbach, M.; Bounds, P.L.; Kuster, N.; Seger, R. Activation of Signaling Cascades by Weak Extremely Low Frequency Electromagnetic Fields. Cell. Physiol. Biochem. 2017, 43, 1533–1546. [Google Scholar] [CrossRef] [PubMed]
- Campos-Sanchez, E.; Vicente-Dueñas, C.; Rodríguez-Hernández, G.; Capstick, M.; Kuster, N.; Dasenbrock, C.; Sánchez-García, I.; Cobaleda, C. Novel ETV6-RUNX1 Mouse Model to Study the Role of ELF-MF in Childhood B-Acute Lymphoblastic Leukemia: A Pilot Study. Bioelectromagnetics 2019, 40, 343–353. [Google Scholar] [CrossRef] [PubMed]
- Schüz, J.; Dasenbrock, C.; Ravazzani, P.; Röösli, M.; Schär, P.; Bounds, P.L.; Erdmann, F.; Borkhardt, A.; Cobaleda, C.; Fedrowitz, M.; et al. Extremely Low-Frequency Magnetic Fields and Risk of Childhood Leukemia: A Risk Assessment by the ARIMMORA Consortium: Risk Assessment ELF-MF and Childhood Leukemia. Bioelectromagnetics 2016, 37, 183–189. [Google Scholar] [CrossRef]
- Miyakoshi, J. Effects of Static Magnetic Fields at the Cellular Level. Prog. Biophys. Mol. Biol. 2005, 87, 213–223. [Google Scholar] [CrossRef]
- Vergallo, C. Infusion of HLA-Matched and Static Magnetic Field-Exposed Allogenic Lymphocytes Treating Lymphocytopenia and Cytokine Storm Syndrome: A Treatment Proposal for COVID-19 Patients. Electromagn. Biol. Med. 2021, 40, 11–25. [Google Scholar] [CrossRef]
- Aldinucci, C.; Garcia, J.B.; Palmi, M.; Sgaragli, G.; Benocci, A.; Meini, A.; Pessina, F.; Rossi, C.; Bonechi, C.; Pessina, G.P. The Effect of Strong Static Magnetic Field on Lymphocytes. Bioelectromagnetics 2003, 24, 109–117. [Google Scholar] [CrossRef]
- Belyaev, I.Y.; Alipov, E.D. Frequency-Dependent E¡ects of ELF Magnetic Field on Chromatin Conformation in Escherichia Coli Cells and Human Lymphocytes. Biochim. Biophys. Acta 2001, 8. [Google Scholar]
- Stuchly, M.A.; Ruddick, J.; Villeneuve, D.; Robinson, K.; Reed, B.; Lecuyer, D.W.; Tan, K.; Wong, J. Teratological Assessment of Exposure to Time-Varying Magnetic Field. Teratology 1988, 38, 461–466. [Google Scholar] [CrossRef] [PubMed]
- Yost, M.G.; Liburdy, R.P. Time-Varying and Static Magnetic Fields Act in Combination to Alter Calcium Signal Transduction in the Lymphocyte. FEBS Lett. 1992, 296, 117–122. [Google Scholar] [CrossRef]
- Zhan, T.; Wang, X.; Ouyang, Z.; Yao, Y.; Xu, J.; Liu, S.; Liu, K.; Deng, Q.; Wang, Y.; Zhao, Y. Rotating Magnetic Field Ameliorates Experimental Autoimmune Encephalomyelitis by Promoting T Cell Peripheral Accumulation and Regulating the Balance of Treg and Th1/Th17. Aging 2020, 12, 6225–6239. [Google Scholar] [CrossRef] [PubMed]
- Binhi, V.N. Magnetobiology: Underlying Physical Problems; Academic Press: San Diego, CA, USA, 2002. [Google Scholar]
- Zastko, L.; Makinistian, L.; Moravčíková, A.; Jakuš, J.; Belyaev, I. Effect of Intermittent ELF MF on Umbilical Cord Blood Lymphocytes. Bioelectromagnetics 2020, 41, 649–655. [Google Scholar] [CrossRef] [PubMed]
- Markov, M.S. “Biological Windows”: A Tribute to W. Ross Adey. Environmentalist 2005, 25, 67–74. [Google Scholar] [CrossRef]
- Bawin, S.M.; Adey, W.R. Sensitivity of Calcium Binding in Cerebral Tissue to Weak Environmental Electric Fields Oscillating at Low Frequency. Proc. Natl. Acad. Sci. USA 1976, 73, 1999–2003. [Google Scholar] [CrossRef]
- Aarholt, E.; Flinn, E.A.; Smith, C.W. Effects of Low-Frequency Magnetic Fields on Bacterial Growth Rate. Phys. Med. Biol. 1981, 26, 613–621. [Google Scholar] [CrossRef]
- Aarholt, E.; Flinn, E.A.; Smith, C.W. Magnetic Fields Affect the Lac Operon System. Phys. Med. Biol. 1982, 27, 606–610. [Google Scholar] [CrossRef]
- Binhi, V.N.; Alipov, Y.D.; Belyaev, I.Y. Effect of Static Magnetic Field on E. Coli Cells and Individual Rotations of Ion-Protein Complexes. Bioelectromagnetics 2001, 22, 79–86. [Google Scholar] [CrossRef]
- Blackman, C.F.; Blanchard, J.P.; Benane, S.G.; House, D.E. Empirical Test of an Ion Parametric Resonance Model for Magnetic Field Interactions with PC-12 Cells. Bioelectromagnetics 1994, 15, 239–260. [Google Scholar] [CrossRef] [PubMed]
- Blanchard, J.P.; Blackman, C.F. Clarification and Application of an Ion Parametric Resonance Model for Magnetic Field Interactions with Biological Systems. Bioelectromagnetics 1994, 15, 217–238. [Google Scholar] [CrossRef] [PubMed]
- Van Huizen, A.V.; Morton, J.M.; Kinsey, L.J.; Von Kannon, D.G.; Saad, M.A.; Birkholz, T.R.; Czajka, J.M.; Cyrus, J.; Barnes, F.S.; Beane, W.S. Weak Magnetic Fields Alter Stem Cell–Mediated Growth. Sci. Adv. 2019, 5, eaau7201. [Google Scholar] [CrossRef] [PubMed]
- Dhiman, S.K.; Galland, P. Effects of Weak Static Magnetic Fields on the Gene Expression of Seedlings of Arabidopsis Thaliana. J. Plant Physiol. 2018, 231, 9–18. [Google Scholar] [CrossRef]
- Novikov, V.V.; Novikov, G.V.; Fesenko, E.E. Effect of Weak Combined Static and Extremely Low-Frequency Alternating Magnetic Fields on Tumor Growth in Mice Inoculated with the Ehrlich Ascites Carcinoma. Bioelectromagnetics 2009, 30, 343–351. [Google Scholar] [CrossRef]
- Lindström, E.; Lindström, P.; Berglund, A.; Lundgren, E.; Mild, K.H. Intracellular Calcium Oscillations in a T-Cell Line after Exposure to Extremely-Low-Frequency Magnetic Fields with Variable Frequencies and Flux Densities. Bioelectromagnetics 1995, 16, 41–47. [Google Scholar] [CrossRef]
- Toda, T.; Ito, M.; Takeda, J.; Masuda, A.; Mino, H.; Hattori, N.; Mohri, K.; Ohno, K. Extremely Low-Frequency Pulses of Faint Magnetic Field Induce Mitophagy to Rejuvenate Mitochondria. Commun. Biol. 2022, 5, 453. [Google Scholar] [CrossRef]
- Barnes, F.; Kandala, S. Effects of Time Delays on Biological Feedback Systems and Electromagnetic Field Exposures: Gain and Sign Changes With Time Delay. Bioelectromagnetics 2018, 39, 249–252. [Google Scholar] [CrossRef]
- Manzella, N.; Bracci, M.; Ciarapica, V.; Staffolani, S.; Strafella, E.; Rapisarda, V.; Valentino, M.; Amati, M.; Copertaro, A.; Santarelli, L. Circadian Gene Expression and Extremely Low-Frequency Magnetic Fields: An in Vitro Study: ELF-MF Modulates Clock Gene Expression. Bioelectromagnetics 2015, 36, 294–301. [Google Scholar] [CrossRef]
- Rosenspire, A.J.; Kindzelskii, A.L.; Simon, B.J.; Petty, H.R. Real-Time Control of Neutrophil Metabolism by Very Weak Ultra-Low Frequency Pulsed Magnetic Fields. Biophys. J. 2005, 88, 3334–3347. [Google Scholar] [CrossRef]
- Naarala, J.; Kesari, K.K.; McClure, I.; Chavarriaga, C.; Juutilainen, J.; Martino, C.F. Direction-Dependent Effects of Combined Static and ELF Magnetic Fields on Cell Proliferation and Superoxide Radical Production. BioMed Res. Int. 2017, 2017, 5675086. [Google Scholar] [CrossRef] [PubMed]
- Misek, J.; Vojtek, J.; Veternik, M.; Kohan, M.; Jakusova, V.; Spanikova, G.; Belyaev, I.; Jakus, J. New Radiofrequency Exposure System with Real Telecommunication Signals. Adv. Electr. Electron. Eng. 2018, 16, 101–107. [Google Scholar] [CrossRef]
- Misek, J.; Belyaev, I.; Jakusova, V.; Tonhajzerova, I.; Barabas, J.; Jakus, J. Heart Rate Variability Affected by Radiofrequency Electromagnetic Field in Adolescent Students. Bioelectromagnetics 2018, 39, 277–288. [Google Scholar] [CrossRef]
- Engels, S.; Schneider, N.-L.; Lefeldt, N.; Hein, C.M.; Zapka, M.; Michalik, A.; Elbers, D.; Kittel, A.; Hore, P.J.; Mouritsen, H. Anthropogenic Electromagnetic Noise Disrupts Magnetic Compass Orientation in a Migratory Bird. Nature 2014, 509, 353–356. [Google Scholar] [CrossRef]
- Schwarze, S.; Schneider, N.-L.; Reichl, T.; Dreyer, D.; Lefeldt, N.; Engels, S.; Baker, N.; Hore, P.J.; Mouritsen, H. Weak Broadband Electromagnetic Fields Are More Disruptive to Magnetic Compass Orientation in a Night-Migratory Songbird (Erithacus Rubecula) than Strong Narrow-Band Fields. Front. Behav. Neurosci. 2016, 10, 55. [Google Scholar] [CrossRef] [PubMed]
- Landler, L.; Painter, M.S.; Youmans, P.W.; Hopkins, W.A.; Phillips, J.B. Spontaneous Magnetic Alignment by Yearling Snapping Turtles: Rapid Association of Radio Frequency Dependent Pattern of Magnetic Input with Novel Surroundings. PLoS ONE 2015, 10, e0124728. [Google Scholar] [CrossRef]
- Vasilyev, S.A.; Kubes, M.; Markova, E.; Belyaev, I. DNA Damage Response in CD133 + Stem/Progenitor Cells from Umbilical Cord Blood: Low Level of Endogenous Foci and High Recruitment of 53BP1. Int. J. Radiat. Biol. 2013, 89, 301–309. [Google Scholar] [CrossRef]
- Makinistian, L. A Novel System of Coils for Magnetobiology Research. Rev. Sci. Instrum. 2016, 87, 114304. [Google Scholar] [CrossRef]
- Makinistian, L.; Marková, E.; Belyaev, I. A High Throughput Screening System of Coils for ELF Magnetic Fields Experiments: Proof of Concept on the Proliferation of Cancer Cell Lines. BMC Cancer 2019, 19, 188. [Google Scholar] [CrossRef]
- Suominen, I. Dispense Liquids Containing Proteins More Reliably with Reverse Pipetting; Application Note: AN-HP-REVPIPET-0909; Thermo Fisher Scientific: Vantaa, Finland, 2009. [Google Scholar]
- Pilla, A.A.; Markov, M.S. Bioeffects of Weak Electromagnetic Fields. Rev. Environ. Health 1994, 10, 155–169. [Google Scholar] [CrossRef]


Publisher’s Note: MDPI stays neutral with regard to jurisdictional claims in published maps and institutional affiliations. |
© 2022 by the authors. Licensee MDPI, Basel, Switzerland. This article is an open access article distributed under the terms and conditions of the Creative Commons Attribution (CC BY) license (https://creativecommons.org/licenses/by/4.0/).
Share and Cite
Zastko, L.; Makinistian, L.; Tvarožná, A.; Belyaev, I. Intermittent ELF-MF Induce an Amplitude-Window Effect on Umbilical Cord Blood Lymphocytes. Int. J. Mol. Sci. 2022, 23, 14391. https://doi.org/10.3390/ijms232214391
Zastko L, Makinistian L, Tvarožná A, Belyaev I. Intermittent ELF-MF Induce an Amplitude-Window Effect on Umbilical Cord Blood Lymphocytes. International Journal of Molecular Sciences. 2022; 23(22):14391. https://doi.org/10.3390/ijms232214391
Chicago/Turabian StyleZastko, Lucián, Leonardo Makinistian, Andrea Tvarožná, and Igor Belyaev. 2022. "Intermittent ELF-MF Induce an Amplitude-Window Effect on Umbilical Cord Blood Lymphocytes" International Journal of Molecular Sciences 23, no. 22: 14391. https://doi.org/10.3390/ijms232214391
APA StyleZastko, L., Makinistian, L., Tvarožná, A., & Belyaev, I. (2022). Intermittent ELF-MF Induce an Amplitude-Window Effect on Umbilical Cord Blood Lymphocytes. International Journal of Molecular Sciences, 23(22), 14391. https://doi.org/10.3390/ijms232214391