

Study of Hypoglycemic Activity of Novel 9-N-alkyltetrahydroberberine Derivatives

 , , , ,
Abstract
1. Introduction
2. Results
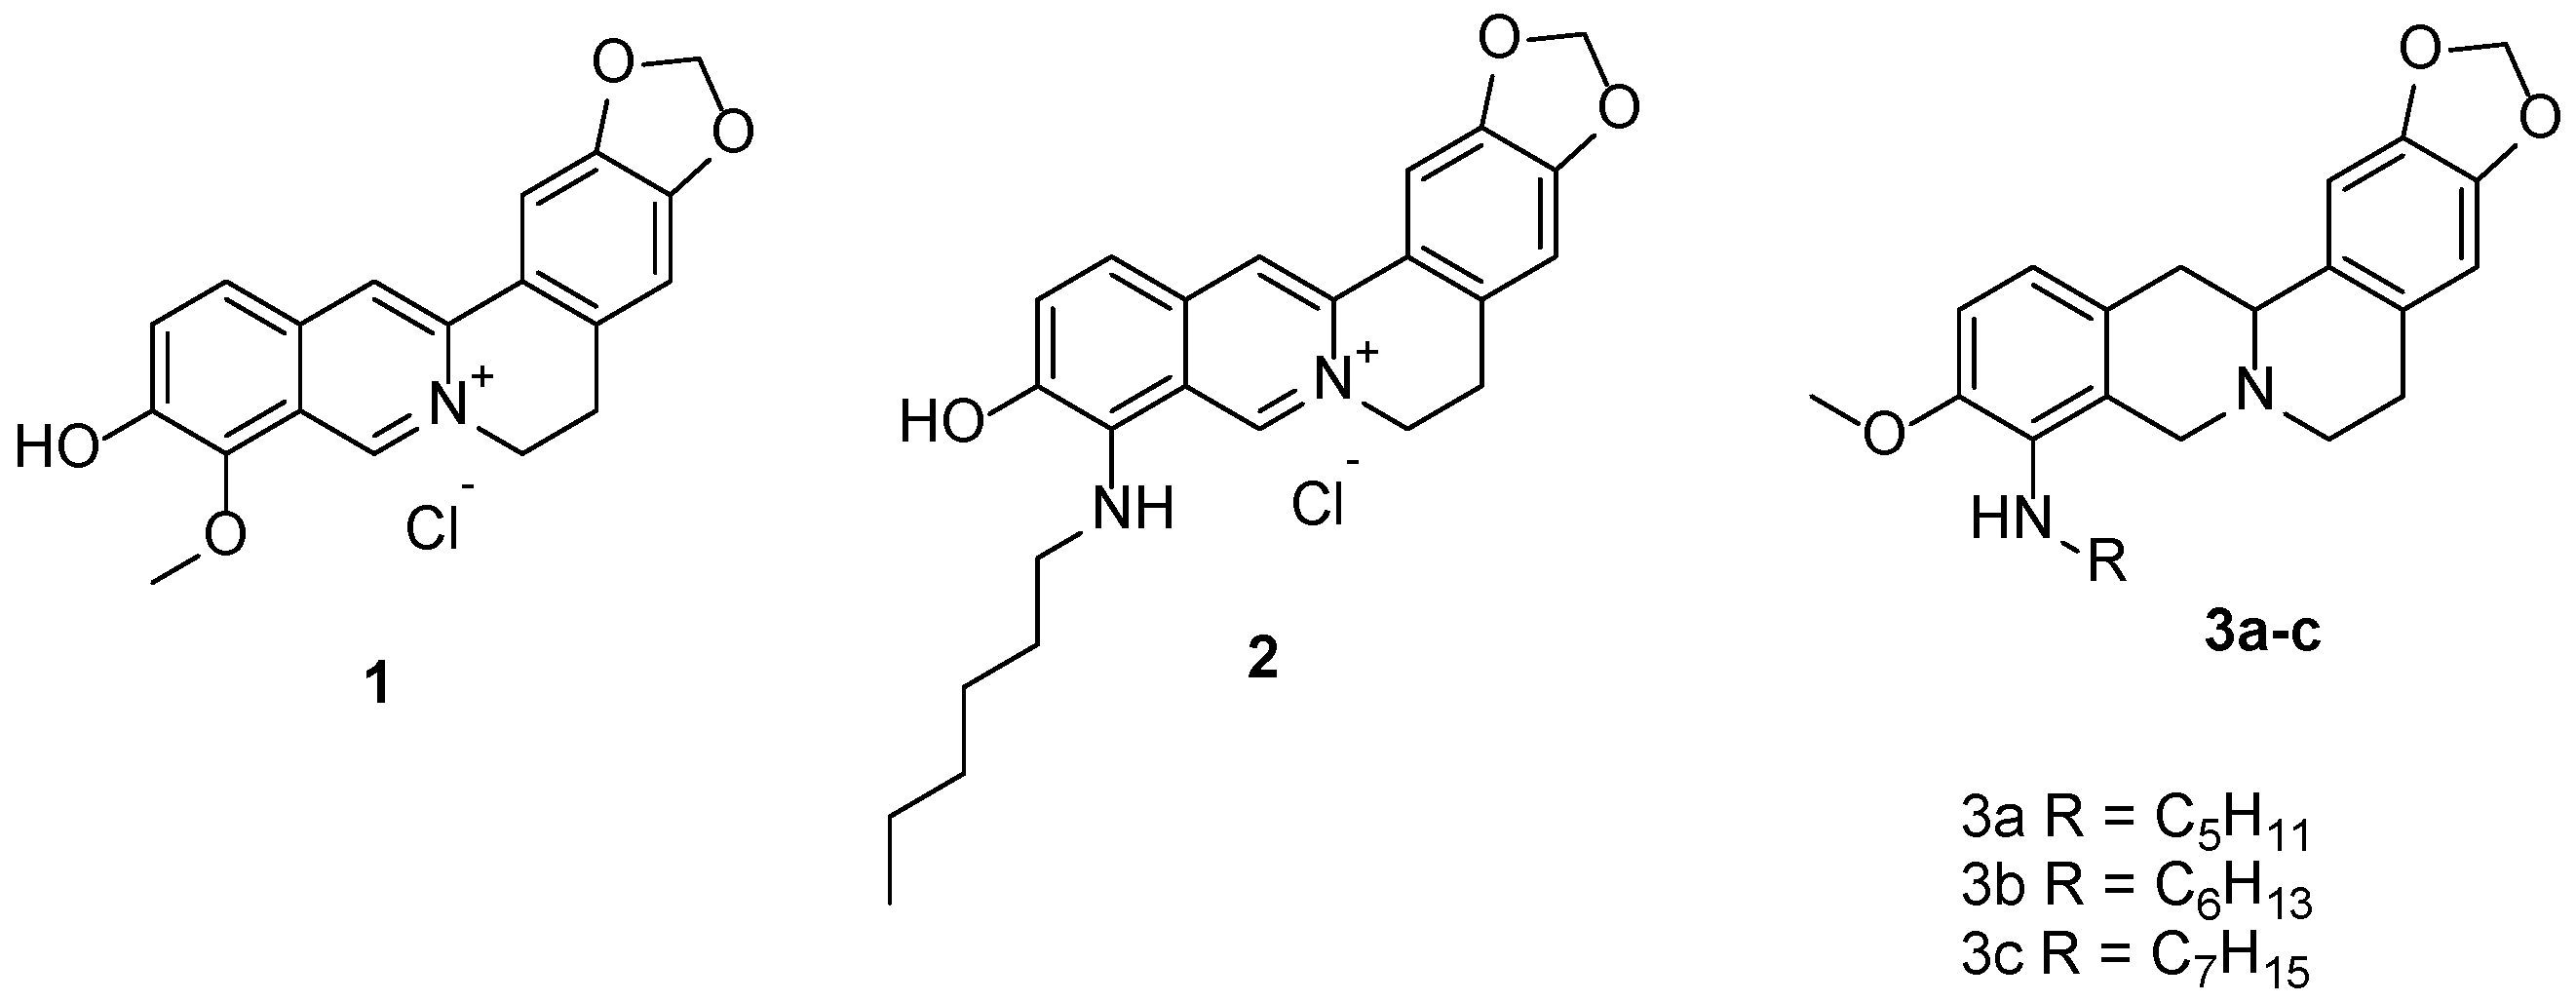
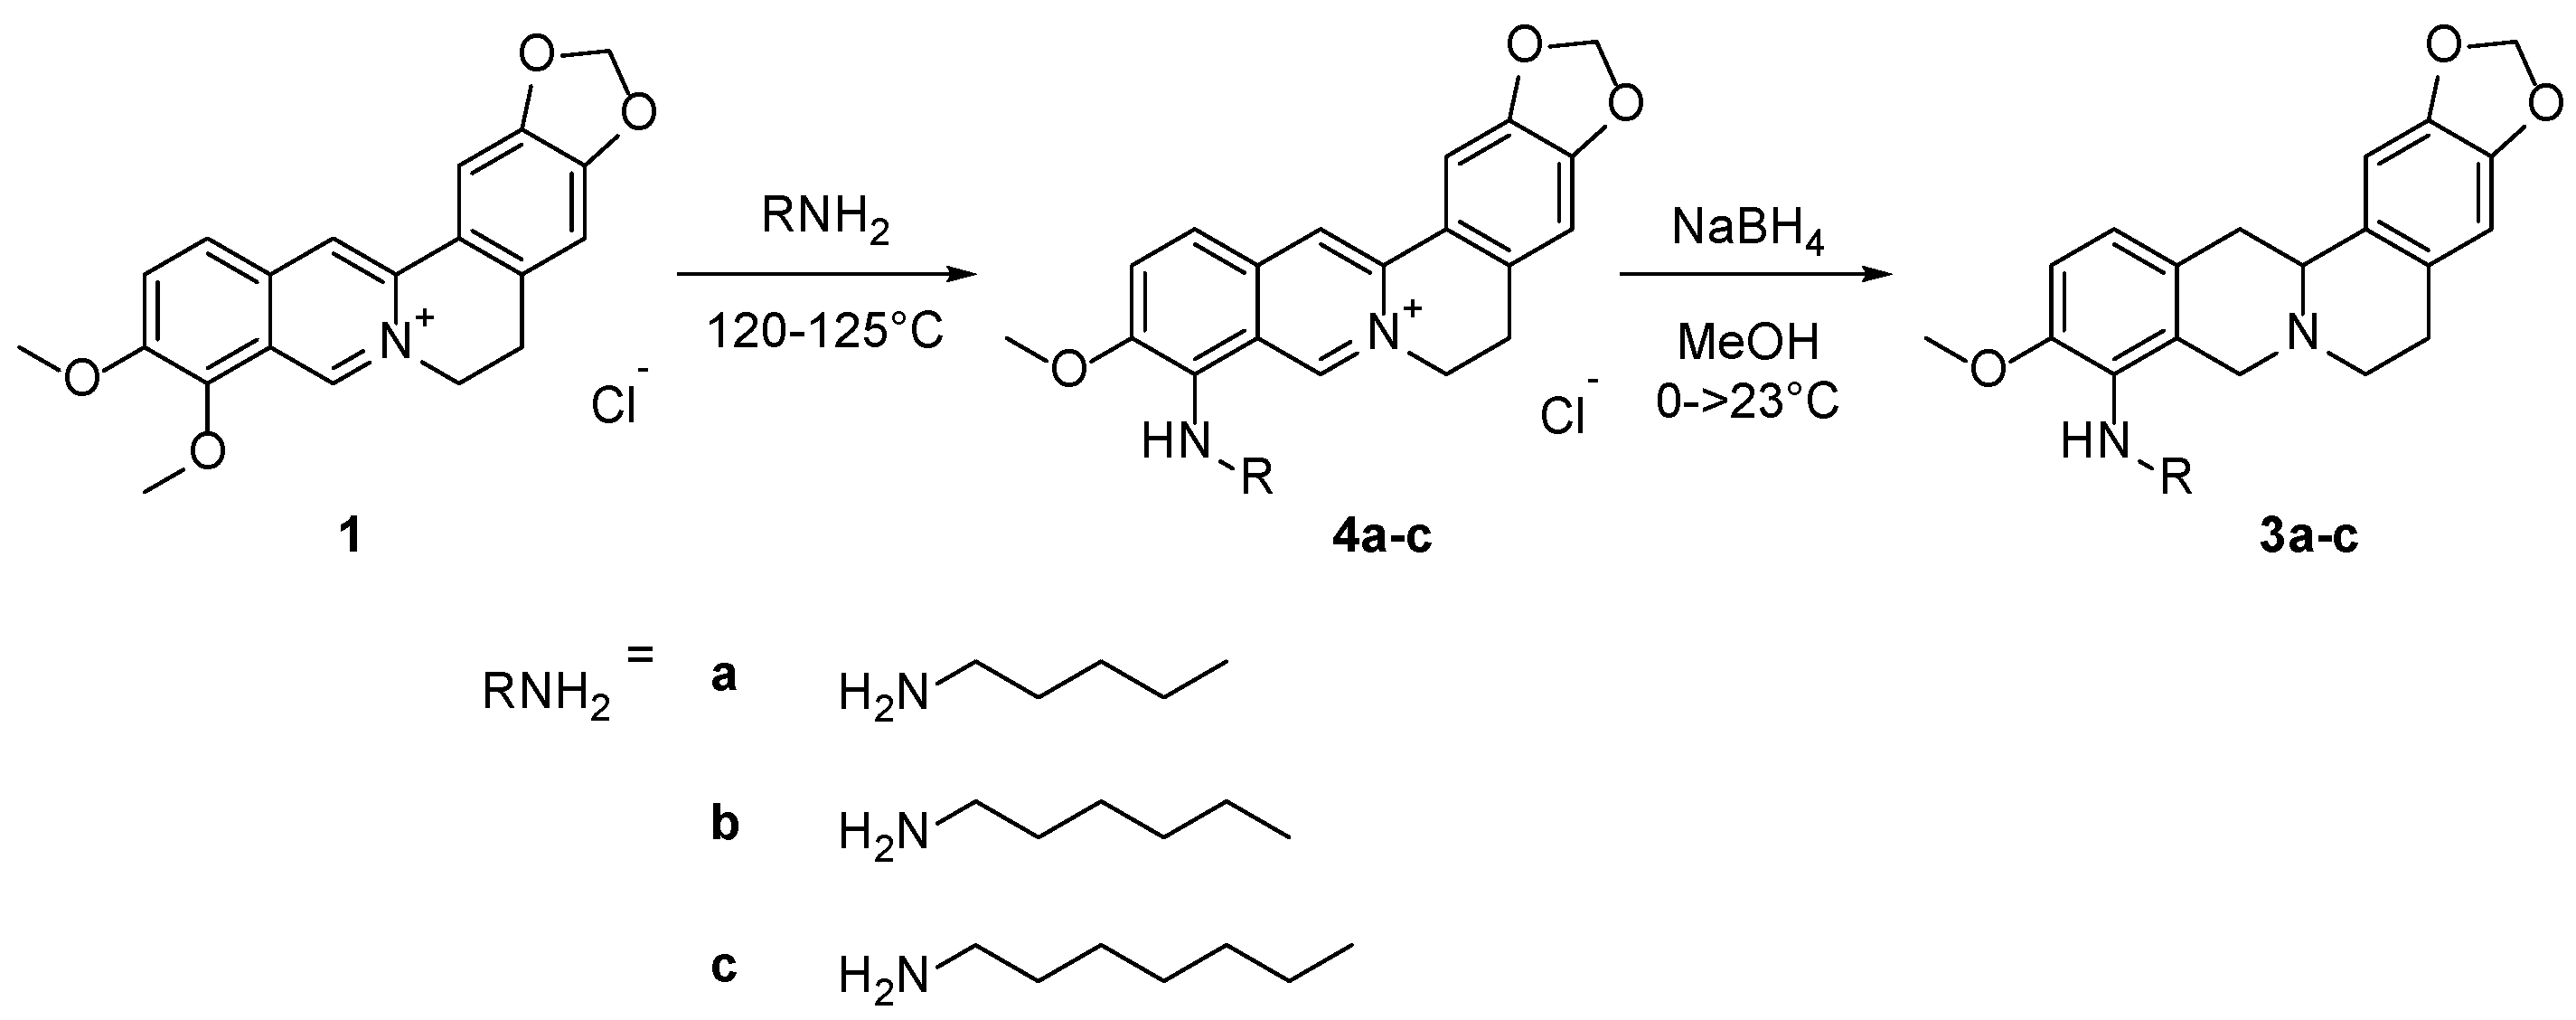
2.1. Synthesis
2.2. OGTT Screening
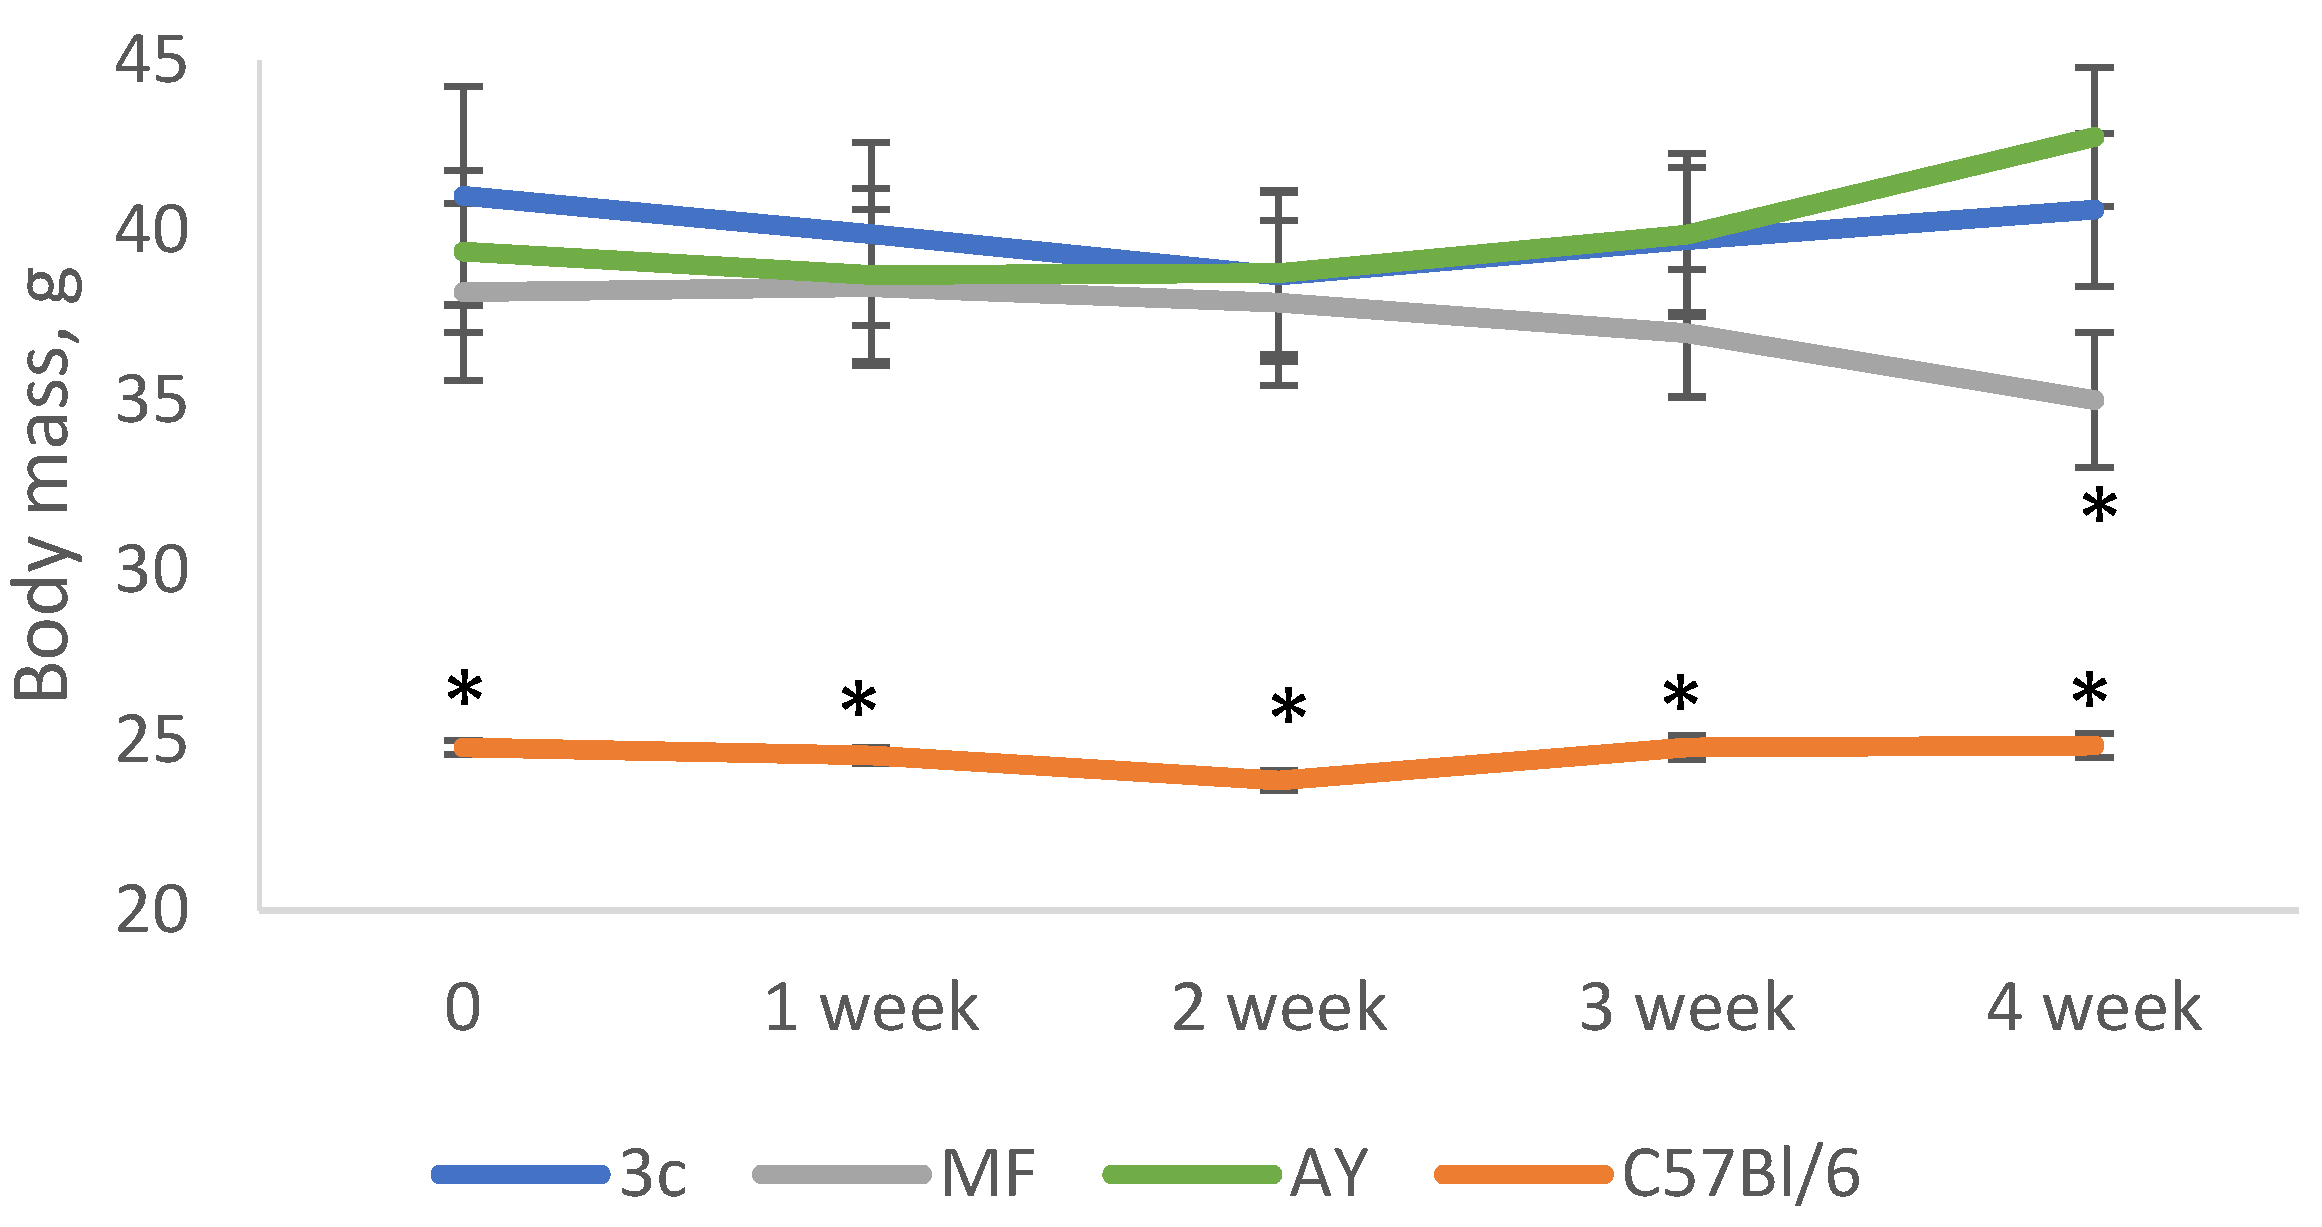
2.3. Body Weight and Food Consuption
2.4. OGTT after 14 Days of Experiment
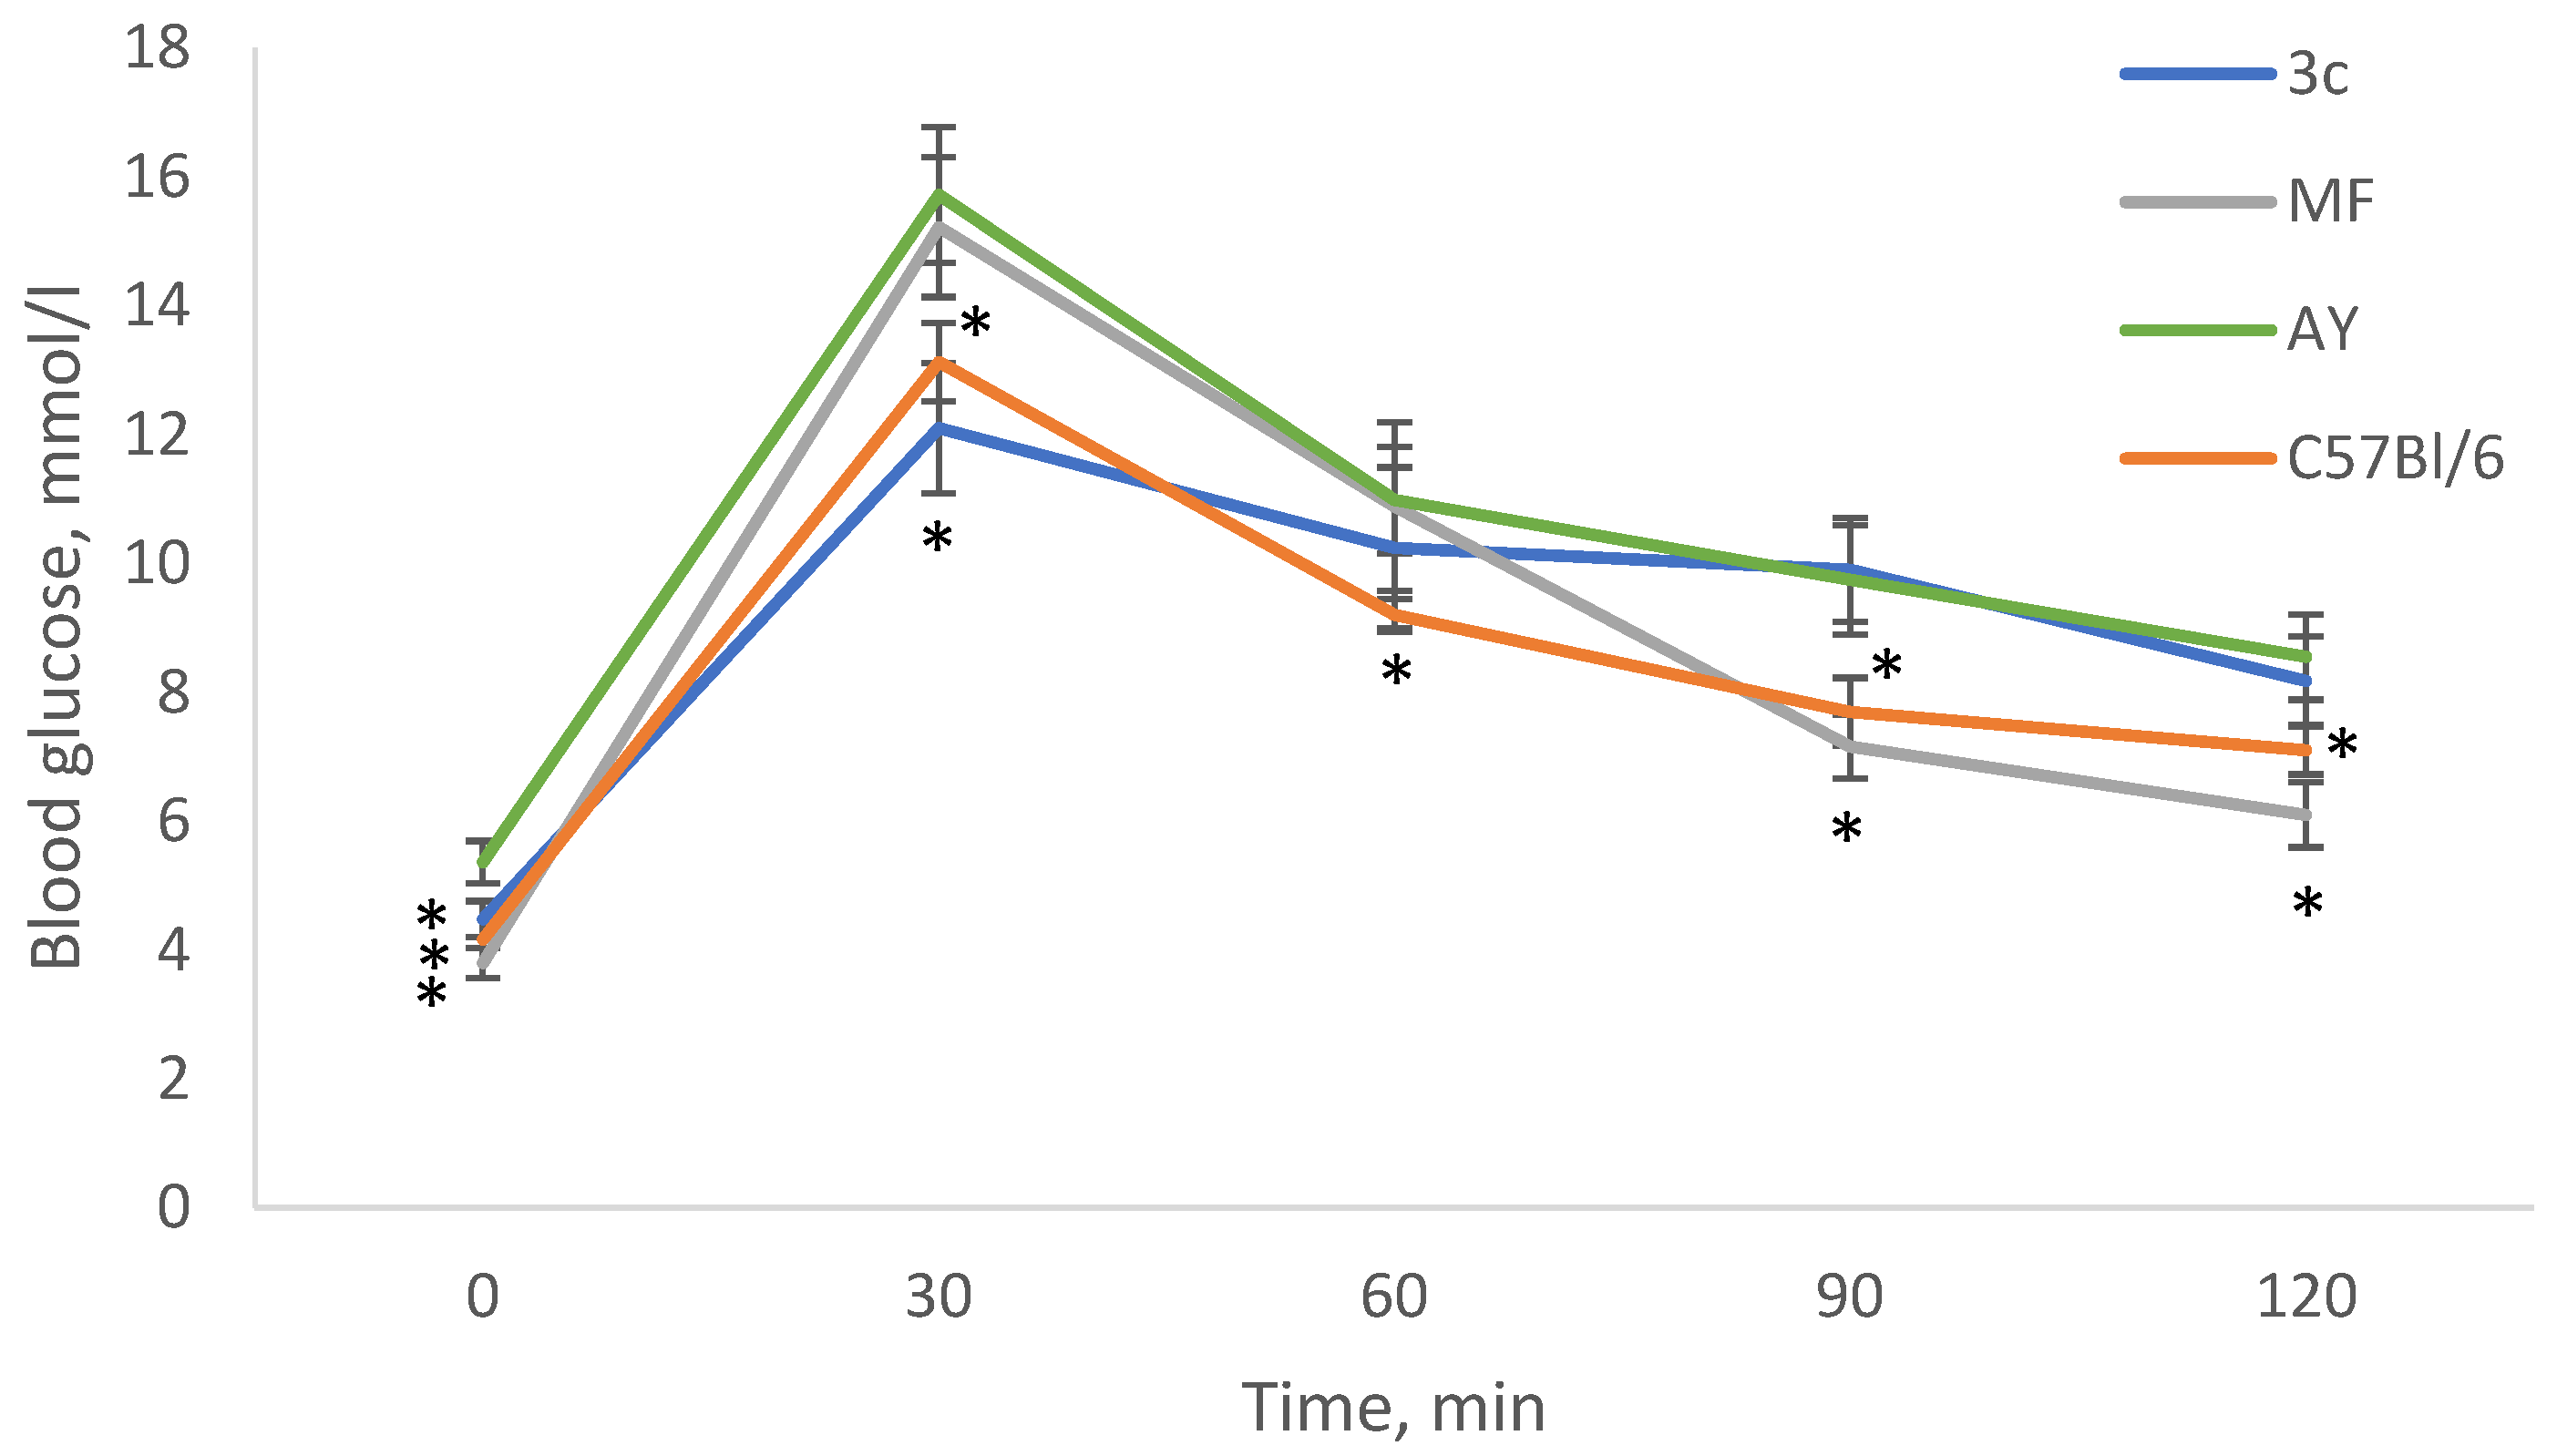
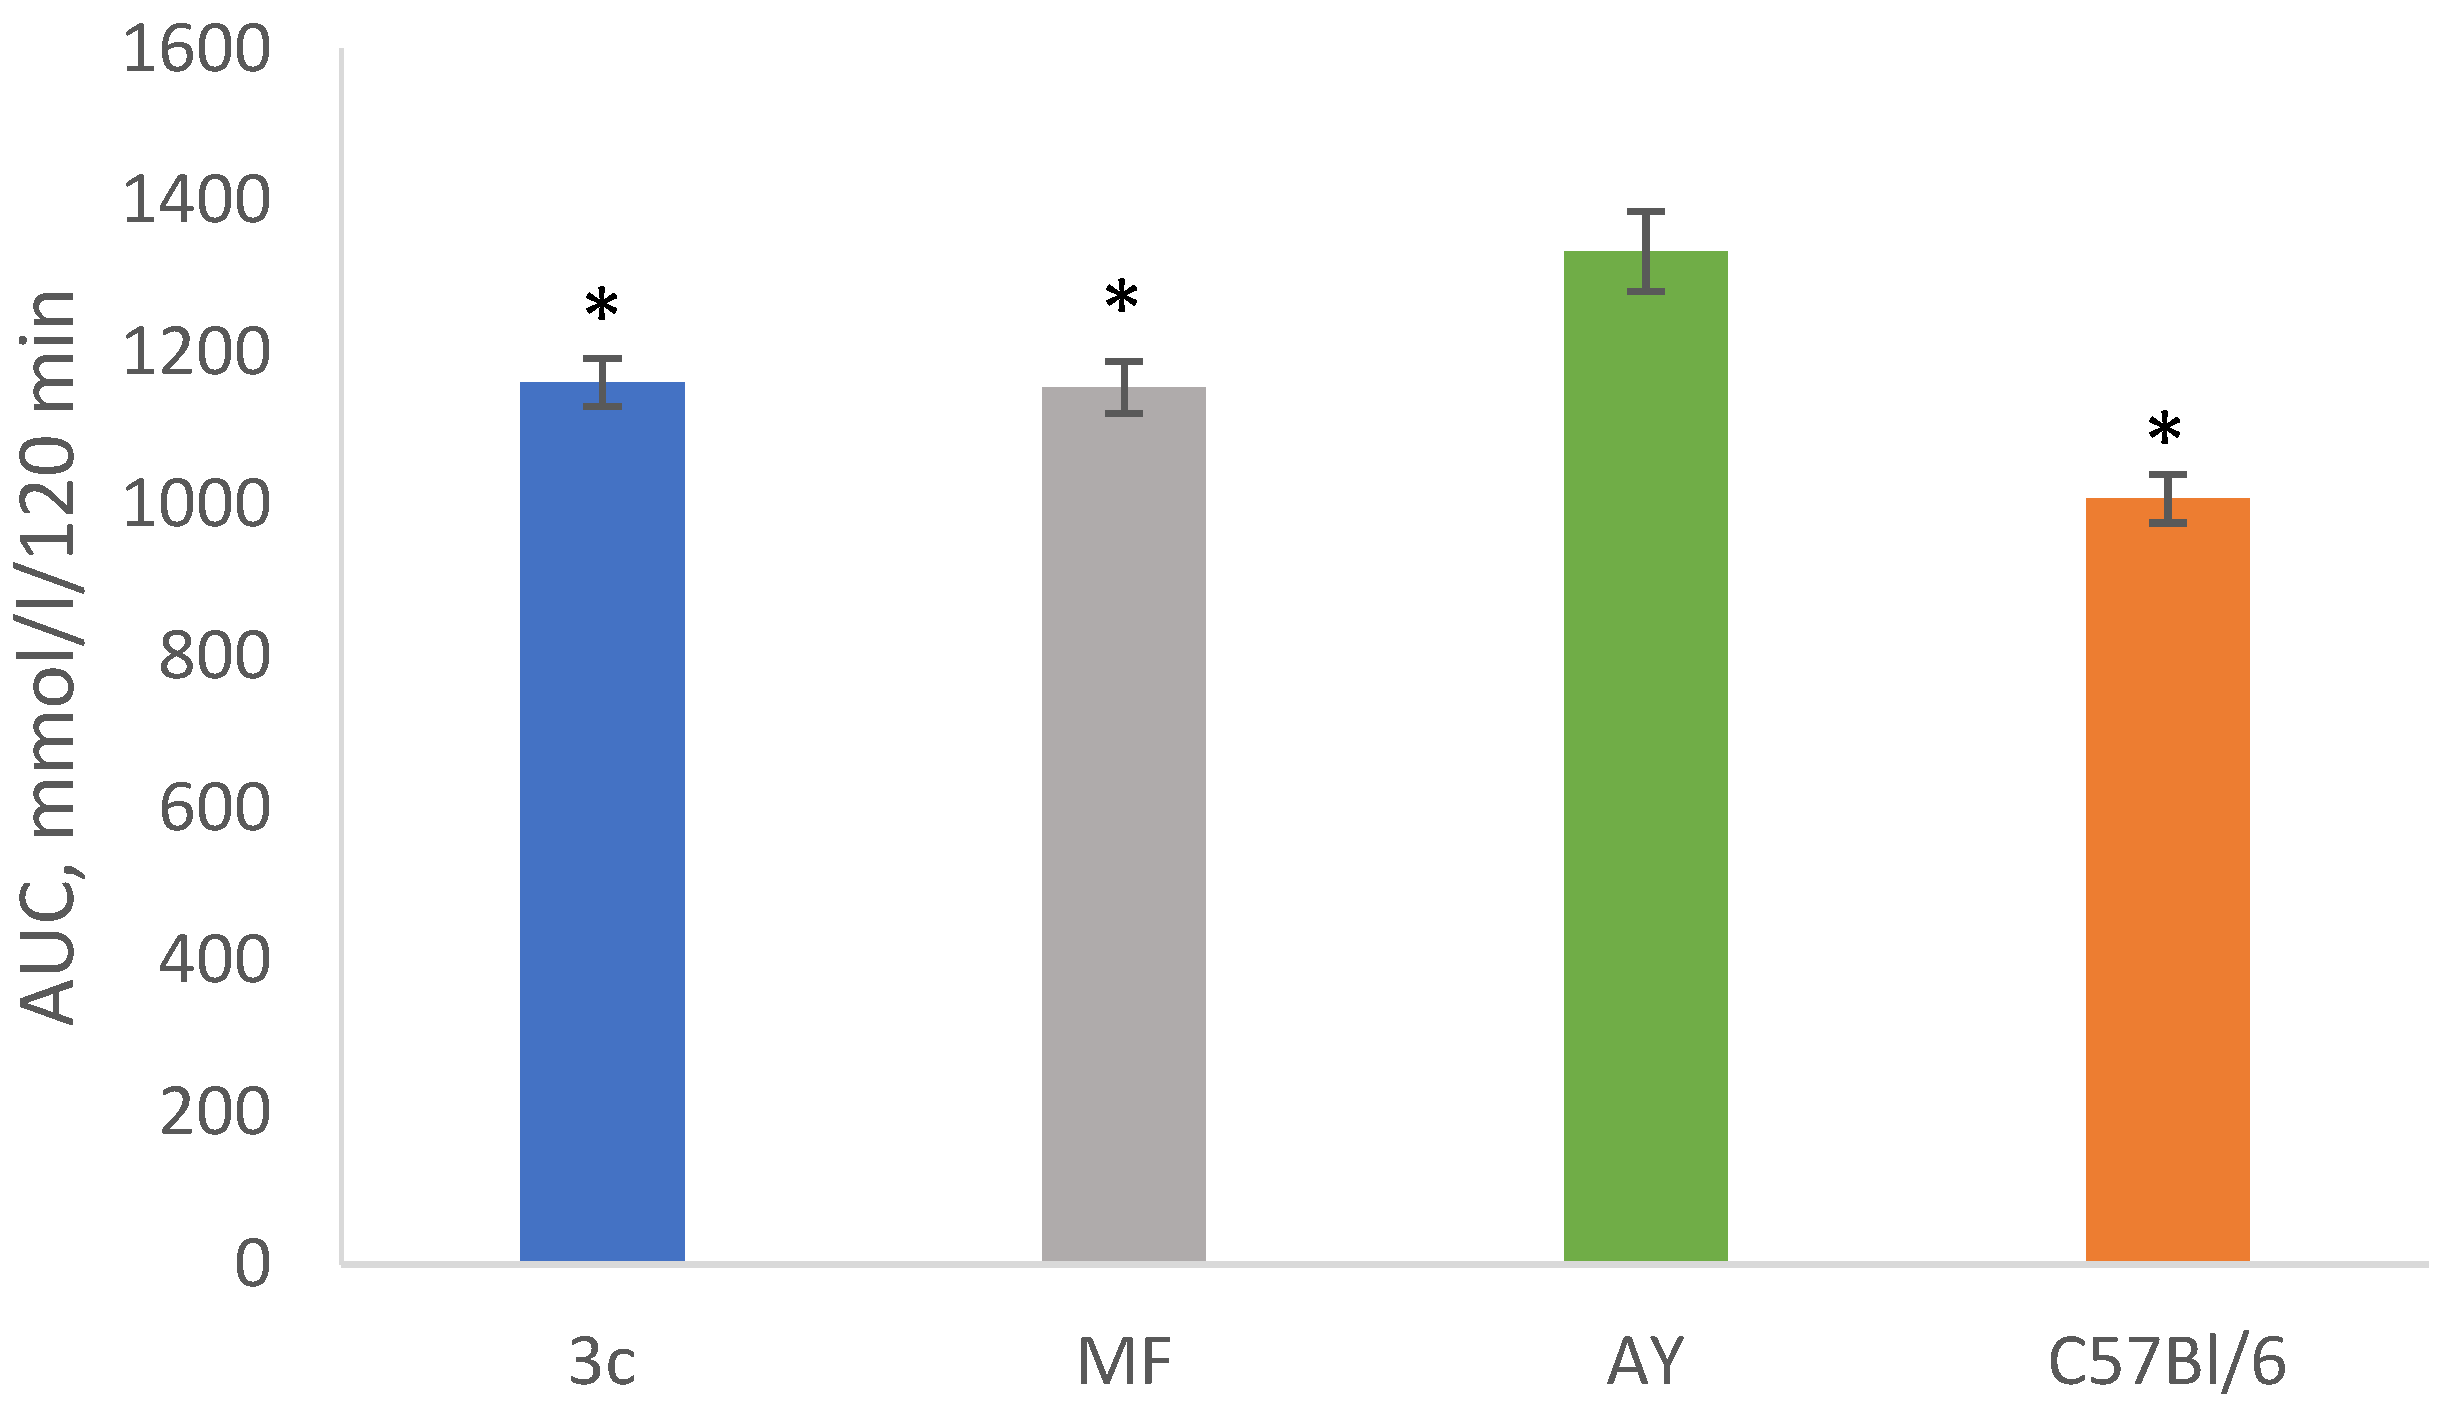
2.5. OGTT after 28 Days of Experiment
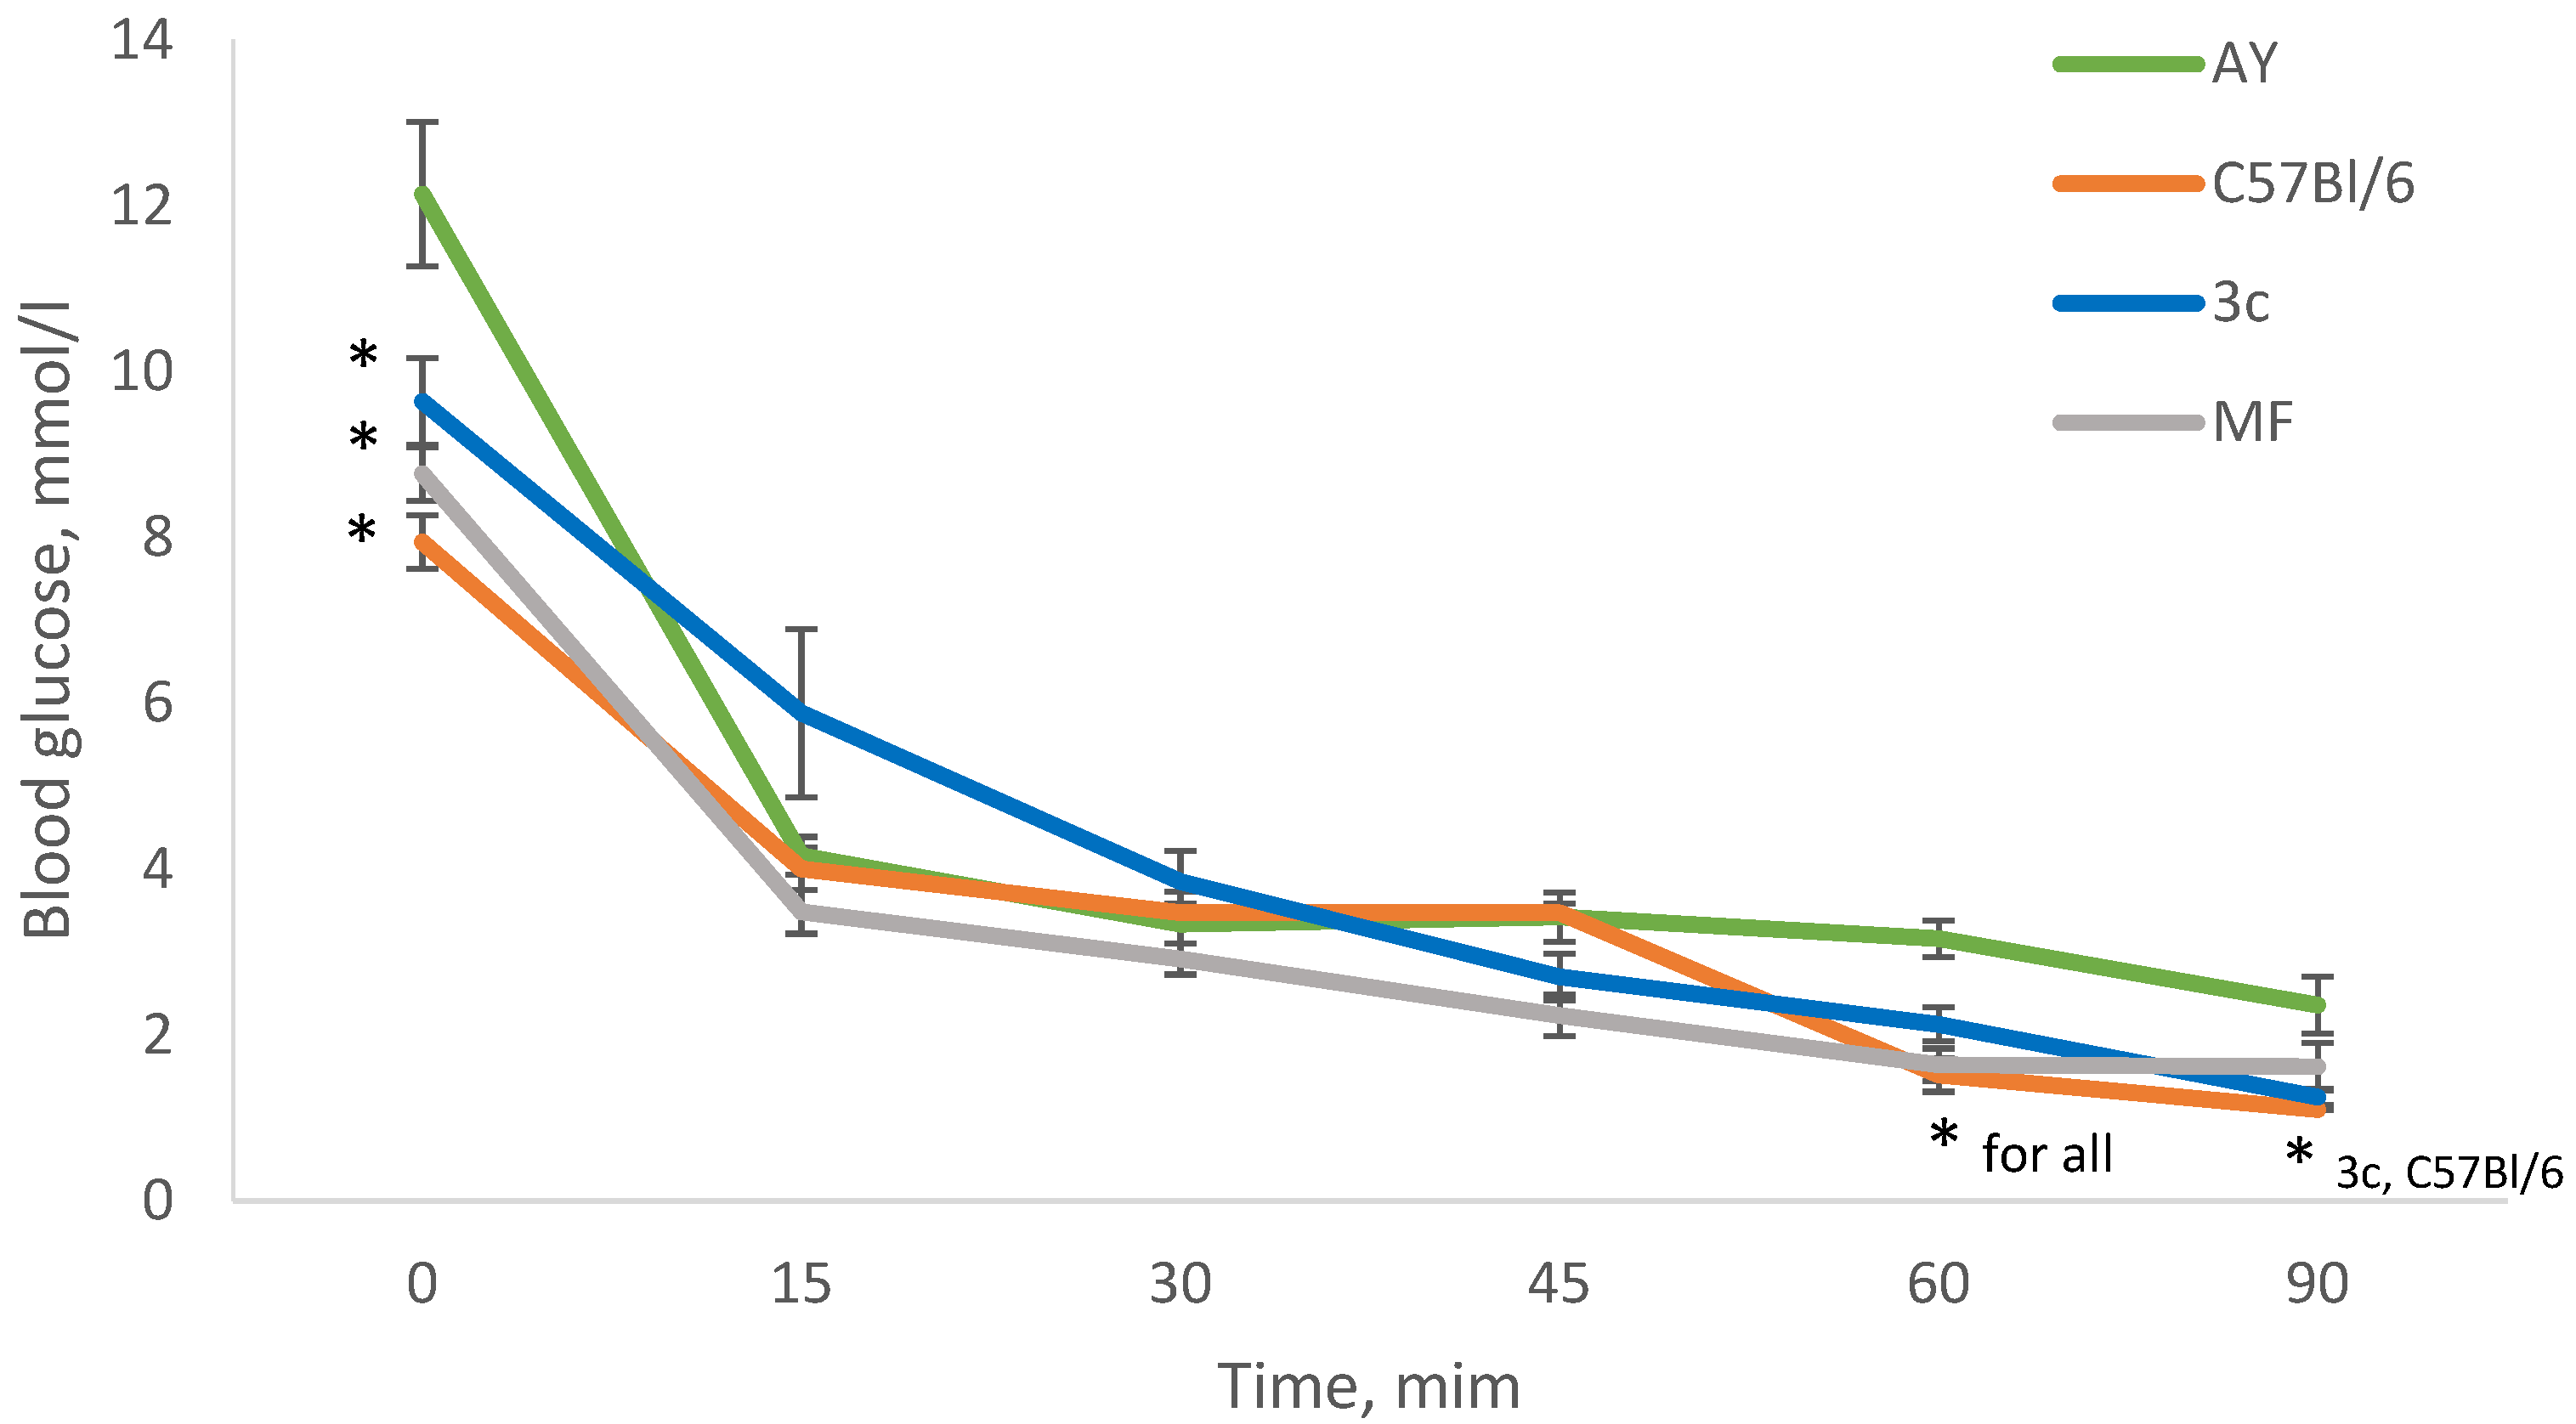
2.6. Insulin Tolerance Test (ITT) after 29 Days of Experiment
2.7. Weight of Organs and Tissues
2.8. Biochemical Blood Test
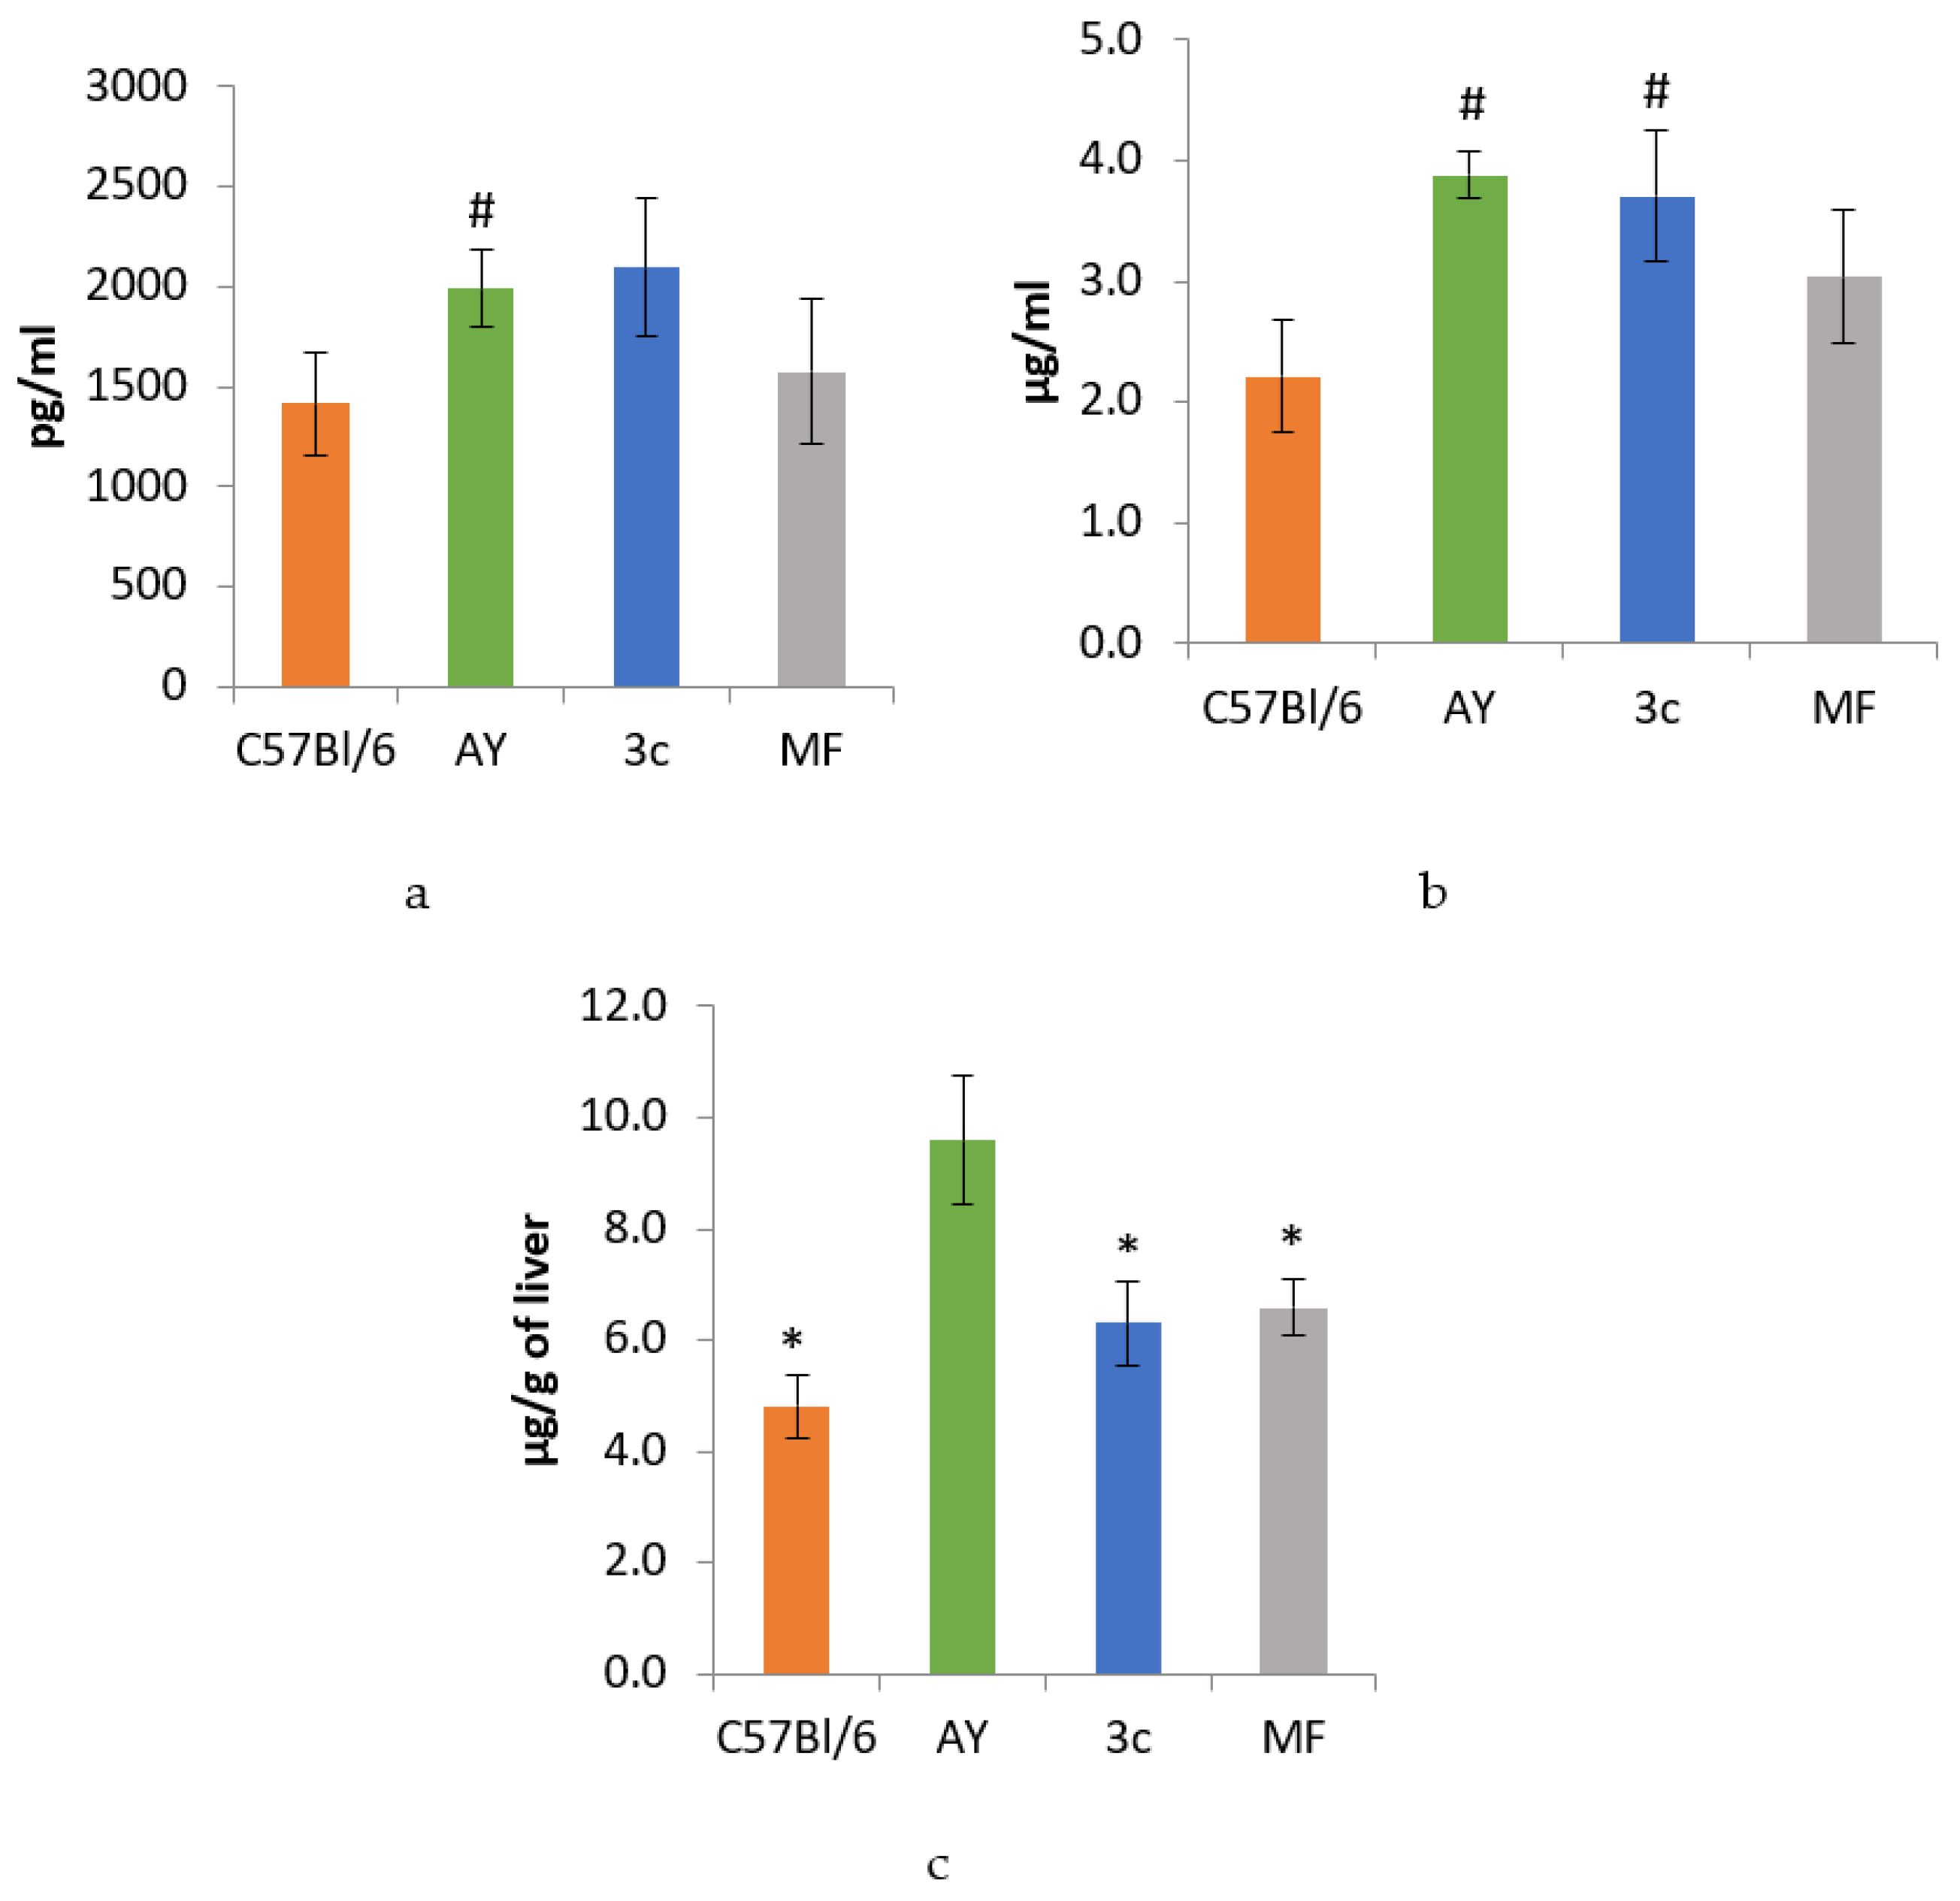
2.9. ELISA Data
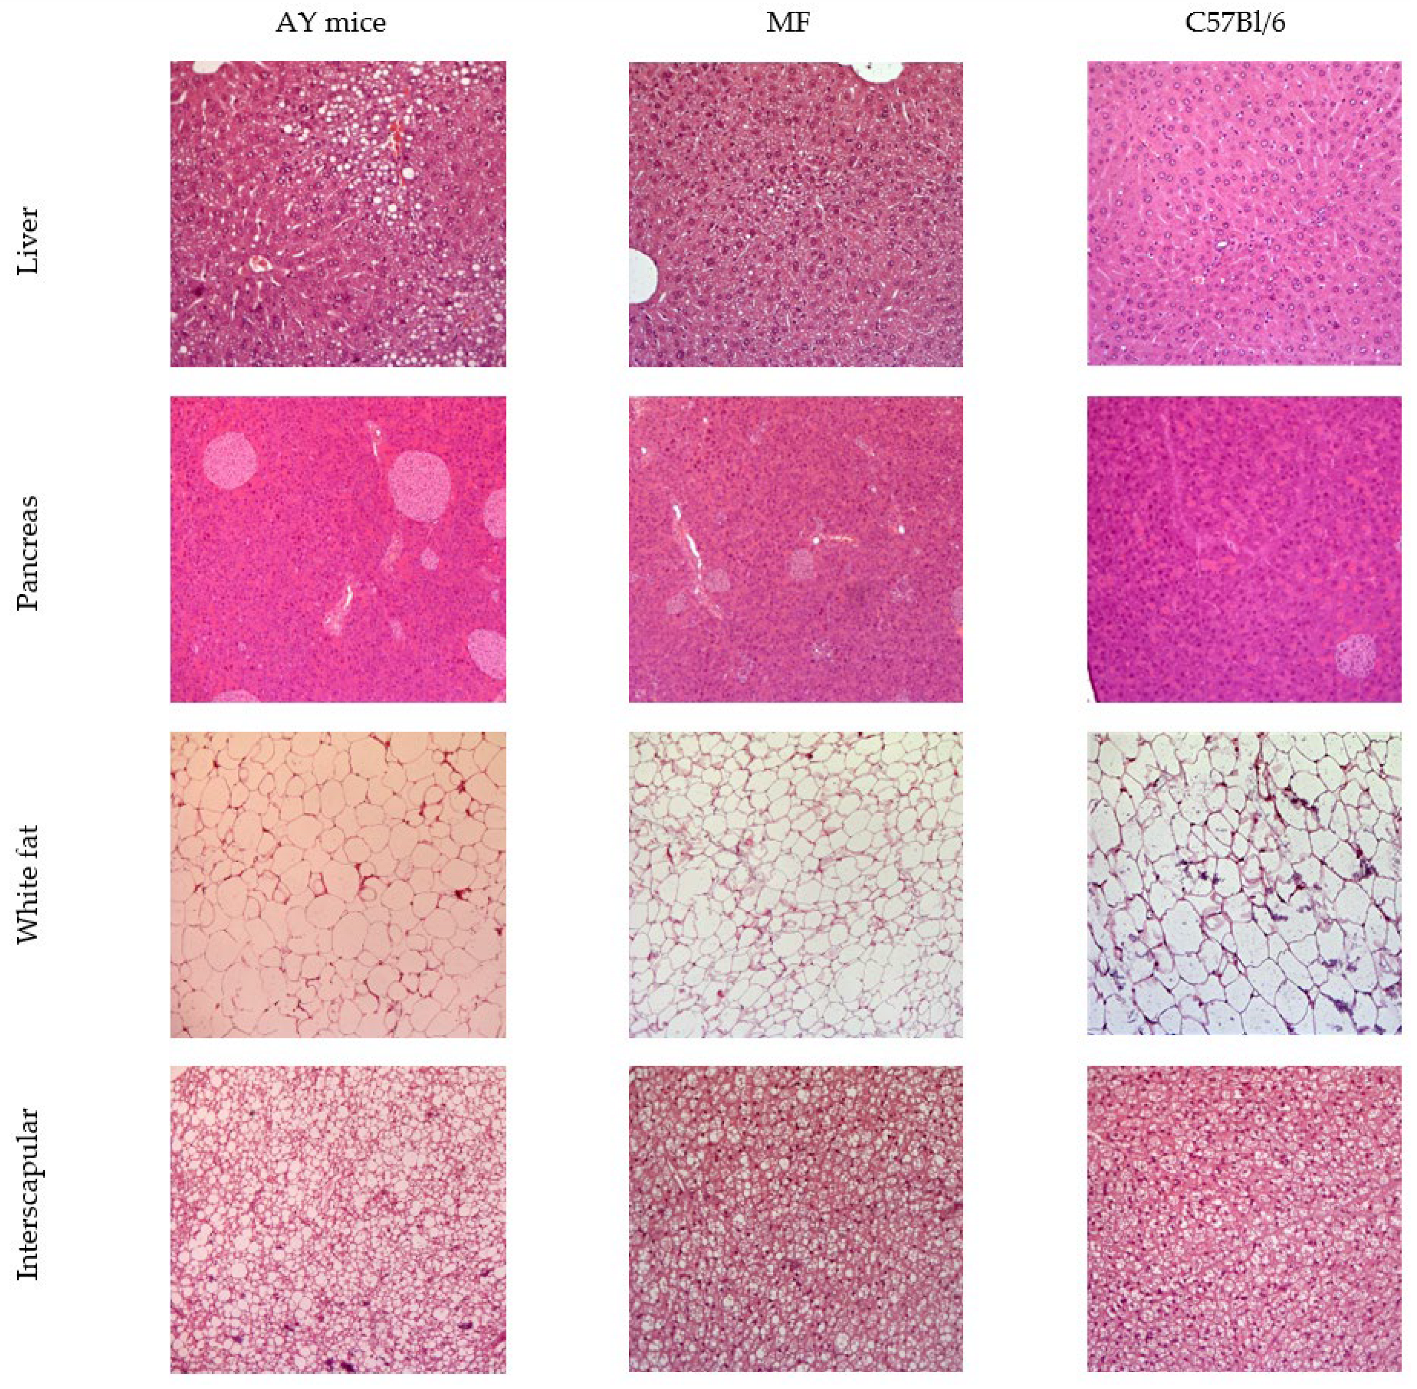
2.10. Histology
3. Discussion
4. Materials and Methods
4.1. Chemistry
4.2. Biological Experiments
4.2.1. Animals
4.2.2. The OGTT
4.2.3. The ITT
4.2.4. The Design of the Experiment on AY Mice
4.2.5. ELISA Examination
4.2.6. Biochemical Assays
4.2.7. Histological Examination
4.2.8. Statistical Analysis
5. Conclusions
Supplementary Materials
Author Contributions
Funding
Institutional Review Board Statement
Data Availability Statement
Acknowledgments
Conflicts of Interest
References
- DeFronzo, R.A.; Ferrannini, E.; Groop, L.; Henry, R.R.; Herman, W.H.; Holst, J.J.; Hu, F.B.; Kahn, C.R.; Raz, I.; Shulman, G.I.; et al. Type 2 diabetes mellitus. Nat. Rev. Dis. Prim. 2015, 1, 15019. [Google Scholar] [CrossRef] [PubMed]
- Guo, W.; Liu, J.; Cheng, L.; Liu, Z.; Zheng, X.; Liang, H.; Xu, F. Metformin Alleviates Steatohepatitis in Diet Induced Obese Mice in a SIRT1-Dependent Way. Front. Pharmacol. 2021, 12, 704112. [Google Scholar] [CrossRef]
- McCreight, L.J.; Bailey, C.J.; Pearson, E.R. Metformin and the gastrointestinal tract. Diabetologia 2016, 59, 426–435. [Google Scholar] [CrossRef] [PubMed]
- American Diabetes Association. 9. Pharmacologic Approaches to Glycemic Treatment: Standards of Medical Care in Diabetes. Diabetes Care 2021, 44 (Suppl. 1), S111–S124. [Google Scholar] [CrossRef]
- Gray, A.; Threlkeld, R.J. Nutritional Recommendations for Individuals with Diabetes. In Endotext [Internet]; Feingold, K.R., Anawalt, B., Boyce, A., Chrousos, G., de Herder, W.W., Dhatariya, K., Dungan, K., Hershman, J.M., Hofland, J., Kalra, S., et al., Eds.; MDText.com, Inc.: South Dartmouth, MA, USA, 2019. [Google Scholar]
- Kong, Y.; Li, L.; Zhao, L.; Yu, P.; Li, D. A patent review of berberine and its derivatives with various pharmacological activities. Expert Opin. Ther. Pat. 2022, 32, 211–223. [Google Scholar] [CrossRef] [PubMed]
- Albarrati, A.; Albratty, M.; Behl, T.; Bungau, S.; Meraya, A.M.; Najmi, A.; Sharma, N.; Singh, S.; Zahoor, I. Expatiating the Pharmacological and Nanotechnological Aspects of the Alkaloidal Drug Berberine: Current and Future Trends. Molecules 2022, 27, 3705. [Google Scholar] [CrossRef]
- Xing, Y.; Liu, X.; Lin, Y.; Zhang, Y. Progress in pharmacological effects and clinical applications of berberine. Chin. J. Pharmacol. Toxicol. 2017, 31, 491–502. [Google Scholar] [CrossRef]
- Pang, B.; Zhao, L.-H.; Zhou, Q.; Zhao, T.-Y.; Wang, H.; Gu, C.-J.; Tong, X.-L. Application of Berberine on Treating Type 2 Diabetes Mellitus. Int. J. Endocrinol. 2015, 2015, 905749. [Google Scholar] [CrossRef]
- Pirillo, A.; Catapano, A.L. Berberine, a plant alkaloid with lipid- and glucose-lowering properties: From in vitro evidence to clinical studies. Atherosclerosis 2015, 243, 449–461. [Google Scholar] [CrossRef]
- Zhao, J.; Wang, Z.; Karrar, E.; Xu, D.; Sun, X. Inhibition Mechanism of Berberine on α-Amylase and α-Glucosidase in Vitro. Starch 2022, 74, 2100231. [Google Scholar] [CrossRef]
- Zhao, Y.; Li, Z.; Lu, E.; Sheng, Q.; Zhao, Y. Berberine exerts neuroprotective activities against cerebral ischemia/reperfusion injury through up-regulating PPAR-γ to suppress NF-κB-mediated pyroptosis. Brain Res. Bull. 2021, 177, 22–30. [Google Scholar] [CrossRef] [PubMed]
- Zhou, J.; Zhou, S. Berberine regulates peroxisome proliferator-activated receptors and positive transcription elongation factor b expression in diabetic adipocytes. Eur. J. Pharm. 2010, 649, 390–397. [Google Scholar] [CrossRef] [PubMed]
- Jiang, S.-J.; Dong, H.; Li, J.-B.; Xu, L.-J.; Zou, X.; Wang, K.-F.; Lu, F.-E.; Yi, P. Berberine inhibits hepatic gluconeogenesis via the LKB1-AMPK-TORC2 signaling pathway in streptozotocin-induced diabetic rats. World J. Gastroenterol. 2015, 21, 7777–7785. [Google Scholar] [CrossRef] [PubMed]
- Sun, R.; Yang, N.; Kong, B.; Cao, B.; Feng, D.; Yu, X.; Ge, C.; Huang, J.; Shen, J.; Wang, P.; et al. Orally Administered Berberine Modulates Hepatic Lipid Metabolism by Altering Microbial Bile Acid Metabolism and the Intestinal FXR Signaling Pathway. Mol. Pharmacol. 2017, 91, 110–122. [Google Scholar] [CrossRef]
- Sun, R.; Kong, B.; Yang, N.; Cao, B.; Feng, D.; Yu, X.; Ge, C.; Feng, S.; Fei, F.; Huang, J.; et al. The Hypoglycemic Effect of Berberine and Berberrubine Involves Modulation of Intestinal FXR Signaling Pathway and Inhibition of Hepatic Gluconeogenesis. Drug Metab. Dispos. 2021, 49, 276–286. [Google Scholar] [CrossRef]
- Xu, G.; Wan, H.; Yi, L.; Chen, W.; Luo, Y.; Huang, Y.; Liu, X. Berberine administrated with different routes attenuates inhaled LPS-induced acute respiratory distress syndrome through TLR4/NF-κB and JAK2/STAT3 inhibition. Eur. J. Pharmacol. 2021, 908, 174349. [Google Scholar] [CrossRef]
- Li, W.; Hua, B.; Saud, S.M.; Lin, H.; Hou, W.; Matter, M.S.; Jia, L.; Colburn, N.H.; Young, M.R. Berberine regulates AMP-activated protein kinase signaling pathways and inhibits colon tumorigenesis in mice. Mol. Carcinog. 2015, 54, 1096–1109. [Google Scholar] [CrossRef]
- Turner, N.; Li, J.-Y.; Gosby, A.; To, S.W.C.; Cheng, Z.; Miyoshi, H.; Taketo, M.M.; Cooney, G.J.; Kraegen, E.W.; James, D.E.; et al. Berberine and its more biologically available derivative, dihydroberberine, inhibit mitochondrial respiratory complex I: A mechanism for the action of berberine to activate AMP-activated protein kinase and improve insulin action. Diabetes 2008, 57, 1414–1418. [Google Scholar] [CrossRef]
- Chen, C.; Zhang, Y.; Huang, C. Berberine inhibits PTP1B activity and mimics insulin action. Biochem. Biophys. Res. Commun. 2010, 397, 543–547. [Google Scholar] [CrossRef]
- Chen, W.; Miao, Y.-Q.; Fan, D.-J.; Yang, S.-S.; Lin, X.; Meng, L.-K.; Tang, X. Bioavailability Study of Berberine and the Enhancing Effects of TPGS on Intestinal Absorption in Rats. AAPS Pharmscitech. 2011, 12, 705–711. [Google Scholar] [CrossRef]
- Xia, X.; Yan, J.; Shen, Y.; Tang, K.; Yin, J.; Zhang, Y.; Yang, D.; Liang, H.; Ye, J.; Weng, J. Berberine Improves Glucose Metabolism in Diabetic Rats by Inhibition of Hepatic Gluconeogenesis. PLoS ONE 2011, 6, e16556. [Google Scholar] [CrossRef] [PubMed]
- Gaba, S.; Monga, V.; Saini, A.; Singh, G. An insight into the medicinal attributes of berberine derivatives: A review. Bioorg. Med. Chem. 2021, 38, 116143. [Google Scholar] [CrossRef] [PubMed]
- Nowak, R.; Och, A.; Och, M.; Podgórska, D.; Podgórski, R. Berberine, a Herbal Metabolite in the Metabolic Syndrome: The Risk Factors, Course, and Consequences of the Disease. Molecules 2022, 27, 1351. [Google Scholar] [CrossRef]
- Singh, N.; Sharma, B. Toxicological Effects of Berberine and Sanguinarine. Front. Mol. Biosci. 2018, 5, 21. [Google Scholar] [CrossRef] [PubMed]
- Zhang, S.; Wang, X.; Yin, W.; Liu, Z.; Zhou, M.; Xiao, D.; Liu, Y.; Peng, D. Synthesis and hypoglycemic activity of 9-O-(lipophilic group substituted) berberine derivatives. Bioorg. Med. Chem. Lett. 2016, 26, 4799–4803. [Google Scholar] [CrossRef]
- Khvostov, M.V.; Gladkova, E.D.; Borisov, S.A.; Zhukova, N.A.; Marenina, M.K.; Meshkova, Y.V.; Luzina, O.A.; Tolstikova, T.G.; Salakhutdinov, N.F. Discovery of the First in Class 9-N-Berberine Derivative as Hypoglycemic Agent with Extra-Strong Action. Pharmaceutics 2021, 13, 2138. [Google Scholar] [CrossRef]
- Qi, Y.; Takahashi, N.; Hileman, S.M.; Patel, H.R.; Berg, A.H.; Pajvani, U.B.; Scherer, P.E.; Ahima, R.S. Adiponectin Acts in the Brain to Decrease Body Weight. Nat. Med. 2004, 10, 524–529. [Google Scholar] [CrossRef]
- Lovejoy, J.; Newby, F.; Gebhart, S.; DiGirolamo, M. Insulin resistance in obesity is associated with elevated basal lactate levels and diminished lactate appearance following intravenous glucose and insulin. Metabolism 1992, 41, 22–27. [Google Scholar] [CrossRef]
- Massa, M.L.; Gagliardino, J.J.; Francini, F. Liver glucokinase: An overview on the regulatory mechanisms of its activity. IUBMB Life 2011, 63, 1–6. [Google Scholar] [CrossRef] [PubMed]
- Miranda, C.S.; Silva-Veiga, F.; Martins, F.F.; Rachid, T.L.; Mandarim-De-Lacerda, C.A.; Souza-Mello, V. PPAR-α activation counters brown adipose tissue whitening: A comparative study between high-fat- and high-fructose-fed mice. Nutrition 2020, 78, 110791. [Google Scholar] [CrossRef]
- Sharma, B.; Xie, L.; Yang, F.; Wang, W.; Zhou, Q.; Xiang, M.; Zhou, S.; Lv, W.; Jia, Y.; Pokhrel, L.; et al. Recent Advance on PTP1B Inhibitors and Their Biomedical Applications. Eur. J. Med. Chem. 2020, 199, 112376. [Google Scholar] [CrossRef] [PubMed]
- Tai, M.M. A Mathematical Model for the Determination of Total Area Under Glucose Tolerance and Other Metabolic Curves. Diabetes Care 1994, 17, 152–154. [Google Scholar] [CrossRef] [PubMed]


| Dose | 5 mg/kg | 15 mg/kg | 30 mg/kg | 45 mg/kg | ||||
|---|---|---|---|---|---|---|---|---|
| Group | Effect | Mortality | Effect | Mortality | Effect | Mortality | Effect | Mortality |
| 3a | 0 | 0 | 0 | 0 | 0 | 0 | n.d. | n.d. |
| 3b | 0 | 0 | 9.4 | 0 | 43.1 | 33.3 | n.d. | n.d. |
| 3c | 0 | 0 | 24.5 | 0 | 13.9 | 0 | 26 | 16.6 |
| Experiment Week | 3c | MF | AY |
|---|---|---|---|
| g/Mouse | |||
| 1 | 25.4 | 29.9 | 23.7 |
| 2 | 27.6 | 29.8 | 26.2 |
| 3 | 23.8 | 25.9 | 25.3 |
| 4 | 26.3 | 26.2 | 23.8 |
| Body Mass, g | Liver Mass, g | Gonadal Fat Pad, g | Interscapular Fat Pad, g | Interscapular Brown Fat, g | |
|---|---|---|---|---|---|
| C57Bl/6 | 21.90 ± 0.30 * | 0.85 ± 0.013 * | 0.27 ± 0.02 * | - | 0.06 ± 0.003 * |
| AY | 36.97 ± 2.41 | 1.09 ± 0.05 | 1.99 ± 0.26 | 1.10 ± 0.16 | 0.20 ± 0.009 |
| 3c | 36.37 ± 2.12 | 1.06 ± 0.04 | 2.01 ± 0.21 | 1.01 ± 0.14 | 0.15 ± 0.02 * |
| MF | 32.45 ± 2.01 | 1.07 ± 0.06 | 1.93 ± 0.26 | 0.73 ± 0.12 | 0.13 ± 0.02 * |
| Group | TC, mmol/L | TG, mmol/L | TP, g/L | Lactate, mmol/L | ALT, U/L | AST, U/L |
|---|---|---|---|---|---|---|
| C57Bl/6 | 4.11 ± 0.03 | 1.37 ± 0,02 * | 6.79 ± 0.14 | 8.94 ± 0.29 | 13.39 ± 3.36 | 45.39 ± 2.96 |
| AY | 4.03 ± 0.05 | 1.54 ± 0.03 | 6.37 ± 0.46 | 8.63 ± 0.11 | 20.25 ± 3.10 | 46.85 ± 2.53 |
| 3c | 3.96 ± 0.45 | 1.57 ± 0.02 | 6.66 ± 0.09 | 7.94 ± 0.28 * | 19.21 ± 2.69 | 45.15 ± 4.43 |
| MF | 4.48 ± 0.48 | 1.53 ± 0.09 | 6.77 ± 0.13 | 7.93 ± 0.24 * | 15.71 ± 1.50 | 48.89 ± 3.37 |
Publisher’s Note: MDPI stays neutral with regard to jurisdictional claims in published maps and institutional affiliations. |
© 2022 by the authors. Licensee MDPI, Basel, Switzerland. This article is an open access article distributed under the terms and conditions of the Creative Commons Attribution (CC BY) license (https://creativecommons.org/licenses/by/4.0/).
Share and Cite
Khvostov, M.V.; Gladkova, E.D.; Borisov, S.A.; Fedotova, M.S.; Zhukova, N.A.; Marenina, M.K.; Meshkova, Y.V.; Luzina, O.A.; Tolstikova, T.G.; Salakhutdinov, N.F. Study of Hypoglycemic Activity of Novel 9-N-alkyltetrahydroberberine Derivatives. Int. J. Mol. Sci. 2022, 23, 14186. https://doi.org/10.3390/ijms232214186
Khvostov MV, Gladkova ED, Borisov SA, Fedotova MS, Zhukova NA, Marenina MK, Meshkova YV, Luzina OA, Tolstikova TG, Salakhutdinov NF. Study of Hypoglycemic Activity of Novel 9-N-alkyltetrahydroberberine Derivatives. International Journal of Molecular Sciences. 2022; 23(22):14186. https://doi.org/10.3390/ijms232214186
Chicago/Turabian StyleKhvostov, Mikhail V., Elizaveta D. Gladkova, Sergey A. Borisov, Marina S. Fedotova, Nataliya A. Zhukova, Mariya K. Marenina, Yuliya V. Meshkova, Olga A. Luzina, Tatiana G. Tolstikova, and Nariman F. Salakhutdinov. 2022. "Study of Hypoglycemic Activity of Novel 9-N-alkyltetrahydroberberine Derivatives" International Journal of Molecular Sciences 23, no. 22: 14186. https://doi.org/10.3390/ijms232214186
APA StyleKhvostov, M. V., Gladkova, E. D., Borisov, S. A., Fedotova, M. S., Zhukova, N. A., Marenina, M. K., Meshkova, Y. V., Luzina, O. A., Tolstikova, T. G., & Salakhutdinov, N. F. (2022). Study of Hypoglycemic Activity of Novel 9-N-alkyltetrahydroberberine Derivatives. International Journal of Molecular Sciences, 23(22), 14186. https://doi.org/10.3390/ijms232214186