Article

Modeling of Creep Behavior of Particulate Composites with Focus on Interfacial Adhesion Effect

by
Julian Rech
1,2,
Esther Ramakers-van Dorp
1,
Bernhard Möginger
1 and
Berenika Hausnerova
2,3,*
1
Department of Natural Sciences, Bonn-Rhein-Sieg University of Applied Sciences, von-Liebig-Straße 20, 53359 Rheinbach, Germany
2
Centre of Polymer Systems, University Institute, Tomas Bata University in Zlin, nam. T.G. Masaryka 5555, 76001 Zlin, Czech Republic
3
Faculty of Technology, Tomas Bata University in Zlin, Vavreckova 275, 76001 Zlin, Czech Republic
*
Author to whom correspondence should be addressed.
Int. J. Mol. Sci. 2022, 23(22), 14120; https://doi.org/10.3390/ijms232214120
Submission received: 19 October 2022 / Revised: 2 November 2022 / Accepted: 2 November 2022 / Published: 15 November 2022
(This article belongs to the Special Issue Polymer Composites: Preparation, Properties, and Application)

Abstract

:
Evaluation of creep compliance of particulate composites using empirical models always provides parameters depending on initial stress and material composition. The effort spent to connect model parameters with physical properties has not resulted in success yet. Further, during the creep, delamination between matrix and filler may occur depending on time and initial stress, reducing an interface adhesion and load transfer to filler particles. In this paper, the creep compliance curves of glass beads reinforced poly(butylene terephthalate) composites were fitted with Burgers and Findley models providing different sets of time-dependent model parameters for each initial stress. Despite the finding that the Findley model performs well in a primary creep, the Burgers model is more suitable if secondary creep comes into play; they allow only for a qualitative prediction of creep behavior because the interface adhesion and its time dependency is an implicit, hidden parameter. As Young’s modulus is a parameter of these models (and the majority of other creep models), it was selected to be introduced as a filler content-dependent parameter with the help of the cube in cube elementary volume approach of Paul. The analysis led to the time-dependent creep compliance that depends only on the time-dependent creep of the matrix and the normalized particle distance (or the filler volume content), and it allowed accounting for the adhesion effect. Comparison with the experimental data confirmed that the elementary volume-based creep compliance function can be used to predict the realistic creep behavior of particulate composites.

1. Introduction

The majority of lightweight design parts are realized using reinforced composites [1]. Knowledge of their reliable and relevant physico-mechanical materials data, such as stiffness, strength, or creep compliance, is indispensable for engineering and design purposes. Due to the viscoelastic nature of polymer matrices, the dimensional stability in structural applications, and the corresponding long-term behavior, are often estimated by either extrapolation of short-term data or under accelerated testing conditions using higher initial stresses, elevated temperatures, and relative humidity [2]. However, these investigations are time and energy-consuming, especially in the case of creep experiments. To overcome this, modeling as an analytical approach is currently used to predict the performance of the composites.
The creep behavior of composites depends on the creep response of a matrix and a dispersed phase (fibers or particles), the content of the dispersed phase, interface adhesion between filler and matrix, and experimental parameters such as temperature and initial stress [3]. During the creep experiment, the interface adhesion in the composites can be reduced (by, e.g., delamination), leading to accelerated creep. The creep compliances increase faster with time than in the case of pure viscoelastic creep. If the load transfer from matrix to filler is decreased, the creep behavior of composites is determined dominantly by the matrix creep.
The filler/matrix adhesion depends on the compatibility between the filler and the matrix. Bek et al. [4] compared the long-term creep compliances of neat and recycled polypropylene (PP) reinforced with untreated wood fibers. They found a superior creep resistance for neat PP composites and attributed it to a higher crystallinity and better interfacial adhesion due to trans-crystalline structures around the wood fibers occurring only for neat PP. Chandekar et al. [5] studied the effect of various chemical pre-treatments of jute fibers on the creep recovery behavior of PP-jute composites. The creep evaluation using the Burgers model revealed that creep strains decreased due to the chosen fiber pre-treatment in the following manner: untreated > potassium permanganate > alkali (NaOH) > silane > NaOH with maleic anhydride grafted PP. Similar results were presented by Marcovich and Villar [6] for the creep behavior of low-density polyethylene compounded with untreated wood flour and modified with both organic peroxide and MAH. They concluded that MAH increased the interfacial adhesion between filler and matrix. Furthermore, they found that the functionalization using organic peroxide hindered crystallization and led to composites with lower crystallinity and, thus, more pronounced creep behavior.
In general, the creep at constant load is divided into three ranges of deformation [7]. After an instantaneous elastic deformation due to applied initial stress, primary creep, characterized by a decreasing creep rate, occurs. After a certain time, the creep rate becomes almost constant, indicating the range of secondary creep. Finally, tertiary creep occurs with a fast-increasing creep rate leading to a fracture. To quantitatively describe the measured creep behavior of polymers and composites, several models were developed, Table 1. They can be divided into two categories [8]:

1.1. Rheological Models

They combine springs and dashpots in a suitable manner to reproduce measured behavior (Maxwell model, Kelvin/Voigt model, Burgers model, etc.). The model parameters are the stiffnesses of springs and viscosities of dashpots, which can partly be determined by experiments or fitting procedures.

1.2. Empirical Equations

They approximate the measured behavior and the model parameter are determined by fitting procedures.
The Burgers model is an in-series arrangement of the Maxwell model (elastic spring E1 in series with a viscous dashpot η1) and the Kelvin model (elastic spring E2 parallel to viscous dashpot η2) [9]. For the constant initial stress σ0, it reproduces qualitatively the creep behavior with the initial elastic strain and primary and secondary creep strains; Equation (1), Table 1. For long times, only the dashpot having viscosity η2 determines the creep behavior in a time-linear manner, which does not display the real creep behavior of most materials. To give the Burgers model more generality and to account for both constant and tertiary creep strains, Sarabi [10] introduced a time-dependent viscosity η2, Equation (2).
Both the Findley power law model [7], Equation (3), and the Findley modified power law model [11], Equation (4), are empirical power functions describing creep with an elastic strain and a transient, non-elastic strain. Equation (3) was employed to describe creep for a variety of materials, such as polymers [12,13,14], metals [7], and concrete [15]. However, some materials show a non-linear viscoelastic behavior in cases of higher initial stresses. Thus, Equation (4) provided successful estimates of long-term creep on the basis of short-term creep data at higher stress levels [11].
The models of Burgers and Findley are widely used to depict the creep behavior of polymers and polymer composites. In Table 1, further models are listed (Equations (5)–(7)) using exponential and power functions or power series. These models may provide suitable and better adjustments to measured creep data, as can be found in [16,17,18].
All models of Table 1 allow for fitting adaption of measured creep data. As a result, one can tabulate model parameters with respect to initial stresses and temperatures. An interface adhesion of polymer composites is a hidden parameter within other parameters. It means that the effect of the reduced and time-dependent interface adhesion on the creep behavior of polymer composites has not been considered yet. The aim of this study is to derive a time-dependent compliance function containing the adhesion term on the base of a cube in cube model to predict the creep behavior of reinforced polymers.

2. Results and Discussion

2.1. Measured Creep Compliances and Their Fitting Using Burgers and Findley Models

The measured creep compliance curves exhibit an initial elastic compliance followed by primary and partly secondary creep behavior within the measuring time of 1000 h; Figure 1. As expected, the creep compliances increase with time and initial stress and decrease with filler volume content. In the secondary creep range, the creep rates decrease as glass beads are a factor 20 stiffer than the poly(butylene terephthalate) (PBT) matrix, thus, exhibiting negligible creep for small initial stresses [19]. Only PBT GB30 at σ0 = 22 MPa clearly reached the range of the secondary creep with the constant creep rate.
Burgers model and Findley power law model were used to fit the creep curves; Figure 1. They provide good fits up to 250 h, especially as long as the initial stresses remain small. The determined fitting parameters are summarized in Table 2 and Table 3. In general, the Findley power law model performs better in the investigated time ranging from 250 to 1000 h, respectively. From the creep curves, it is obvious that the secondary creep has not been reached yet, Figure 1a,b,d–f. Except for PBT GB30 at 40% σmax, the Burgers model performed better as it shows nice linear creep, which can be attributed to a constant slippage rate of polymer chains in load direction [20], Figure 1c.
Fitting the measured creep compliances using the Burgers model shows that the model parameters E1, E2, η1, and η2 decrease with initial stresses (=softening effect due to more free volume) and increase with glass beads volume contents (=stiffening effect due to hard fillers), Table 2. In general, the values of the model parameters decrease if the upper time limit is increased from 250 to 1000 h. This behavior is an effect of fitting procedure as viscous flow behavior mainly addressed by a dashpot η1 comes more into play for longer time ranges with a consequence of decreasing viscosities η1.
The parameter E1 can be associated with Young’s modulus of the material, and the E1 values in Table 3 and Table 4 are similar to Young’s moduli of PBT determined by tensile tests [21]. The first data point of the creep experiment is not determined at the beginning but with a delay of 10 to 20 s. This means that it contains already small creep portions with the consequence that the start value of E1 can be chosen up to 5% smaller as E2 may partly compensate for that in the fitting process.
There have been some trials to connect the model parameters with physical properties, e.g., E2 was associated with the stiffness of amorphous polymer chains [22], which plays a role in the short-time creep stage. However, the moduli E2 of Table 2 are far too large for amorphous polymers. Similarly, viscosities η1 and η2 were connected to damage of crystalline or oriented non-crystalline regions and characteristic times of damaging processes [23]. Nevertheless, as damage mechanisms in crystalline regions differ from those of amorphous regions with respect to physical processes and characteristic times, it is clear that all model parameters except E1 are only fit parameters.
Fitting of the measured creep compliance curves using the Findley power law model provides values for the model parameters, Table 3, for the upper fitting time limits of 250 h and 1000 h. The parameter ε0 represents the initial elastic strain, and as expected, it increases with the initial stress and decreases with the content of glass beads. The conversion to the initial modulus E1 shows coincidence to the moduli determined for the Burgers model and Young’s moduli from the literature within the accuracy of measurements.
The power coefficient n ranges from 0.35 to 0.55, meaning that the Findley model can describe only primary creep. As the n increases with the initial stresses, it provides enhanced creep. The introduction of glass beads leads to the smaller n indicating the reduction of the creep. Interestingly, n remains unchanged if the upper fitting time limit is increased from 250 h to 1000 h. This makes the Findley model a good tool for practitioners to predict creep behavior from short-term creep experiments [12,24].
In this evaluation, the determined transient strain ε+ corresponds to the creep strain after 1 h, which should increase with the initial stress. This is only true for the neat PBT, whereas it decreases for the glass-beads filled PBT. Furthermore, the transient strains ε+ of the glass bead-filled PBT exceed those of the neat PBT by a factor 2 to 3. This may mean that the glass bead-filled PBT exhibits an enhanced strain rate during the first hour of the creep before the creep equilibrium is established.
The evaluation of the creep compliance curves using empirical models always provides parameter sets depending on the initial stresses and materials compositions (e.g., the content of glass beads). It means that for calculation, one has to measure the creep compliances first with subsequent parameter evaluation before one is able to predict the creep behavior beyond the measured time or for other filler contents.
In the models of Burgers and Findley, the parameter E1 represents the elastic initial response on the external load. Therefore, Young’s modulus E1 can be used as an input parameter that takes into account the filler content already before introducing it to the creep models. This can be achieved by the use of cube in cube models with various complexity, which were used for more than 60 years to calculate Young’s moduli of particulate composites as a function of matrix modulus EM, filler modulus EF and filler volume content vF [25].
Young’s modulus E1 is the input parameter to most creep models. Therefore, it seems reasonable to use models to calculate it before introducing it to the creep models. To do so, cube in cube models with various complexity were used for more than 60 years to calculate Young’s moduli of the particulate composites as the function of matrix modulus EM, filler modulus EF and filler volume content vF [25].

2.2. Determination of the Time Dependent Compliance Function of Glass Beads Filled Composites

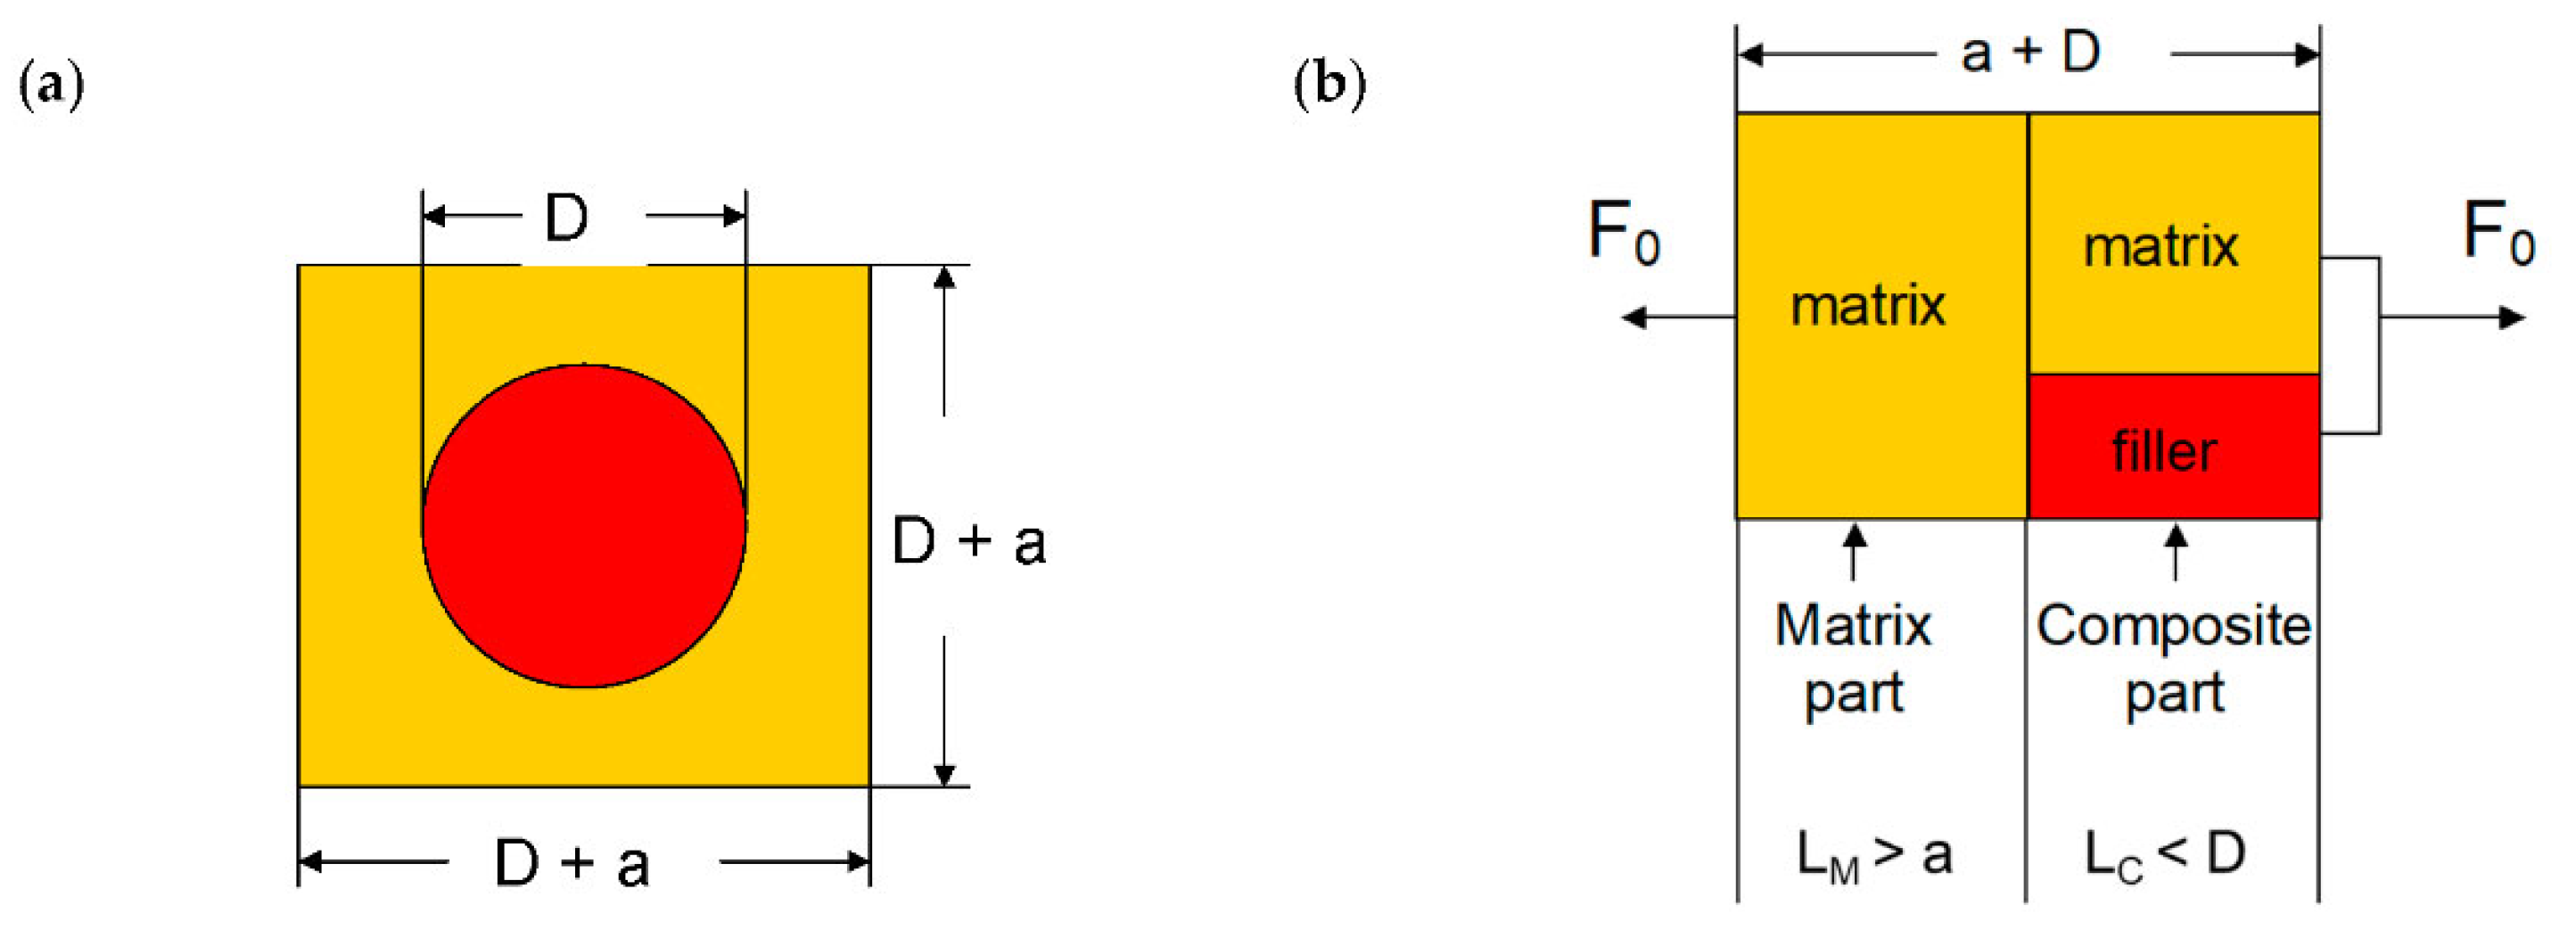
The simplest cube in cube models was proposed by Paul [26] and Ishai–Cohen [27] in order to calculate Young’s moduli of particle-filled composites. They assume a cubic elementary volume (EV) with edge length D + a containing a single inclusion of diameter D shown for glass beads in Figure 2a. For modeling purposes, the inclusion has to be transformed into a cube. Then the EV is separated into a matrix part and a composite part according to [26] as it represents the upper bound, Figure 2b. Thus, the length of the matrix part is increased to LM, and the length of the composite part is decreased to LC.
Due to the transformation, LC becomes (k D) and LM becomes (a + 1 − k) with the efficiency factor k. It considers that less than the maximum cross-section contributes to the stress transfer and thus depends on the particle shapes. For spheres, it is determined by the condition
V s p h e r e = π 6   D 3 =   k 3   D 3 = V c u b e             k = k s p h e r e = π 6 3   0.81
It is obvious that the strains of EV, matrix part, and composite part are different. The strain of EV εEV represents the macroscopic strain measured in a creep experiment, whereas the strains of matrix part εM and composite part εC represent “unknown” microscopic strains yet, which are related to each other for perfect interface adhesion according to [28]
ε E V ε M , ε C = 1 k + d 1 d ε M + k 1 d   ε C = 1 k 1 d ε M + k 1 d   ε C
with the normalized inclusion distance d to which a filler volume content vF is linked by
v F = k 1 d 3
Thus, the microscopic strains are linked to the macroscopic strain by the dimensional ratio of the EV and the inclusion or by the filler volume content. However, if the cross-sectional ratio of filler inclusion and matrix exceeds 1 (identical cross-sections of filler particle and matrix), the related filler volume content vF exceeds 26%. This yields increasing shear stresses [28]; hence, the cross-sectional ratio represents a restricting/limiting parameter in this approach. In the creep experiment, the test bars are loaded with a constant force F0. This allows the expression of the strains in terms of initial stress σ0 and moduli of EV EEV, matrix part EM, and composite part EC.
strain   of   EV       ε E V = σ 0 E E V
strain   of   matrix   part       ε M = σ 0 E M
strain   of   composite   part       ε E V = σ 0 E F   k 2 1 + d 2 + E M   1 k 2 1 + d 2
Introduction of Equations (11)–(13) to Equation (9) yields
σ 0 E E V = 1 k 1 d σ 0 E M + k 1 d   σ 0 E F   k 2 1 + d 2 + E M   1 k 2 1 + d 2
During creep experiments, there may occur delamination between the matrix and filler depending on time and initial stress. This reduces the interface adhesion and the load transfer to the filler particles. The structure of Equation (14) allows for the introduction of an adhesion factor kadh, or an adhesion function kadh(t) in case of a time dependency. The square of the adhesion function can be geometrically interpreted as the effectively available cross-section for stress transfer [28]. Thus, it is possible to adjust it between kadh = 0 (no adhesion) and kadh = 1 (perfect adhesion). After dividing Equation (14) by the initial stress σ0, one ends up with the time-dependent creep compliance of the EV
J E V t , σ 0 = 1 E E V t , σ 0 = 1 k 1 d   J M t , σ 0 + k 1 d   1 k a d h 2 t     E F   k 2 1 + d 2 + E M   1 k 2 1 + d 2 = c o n s t a n t   f o r   σ 0   σ m a x
The creep of the composites part can be considered elastic because the external load acts mainly on the filler as it is distributed between filler and matrix by the ratio EF:EM. This means that the matrix of the composites part experiences much less stress than the matrix part. Therefore, its viscoelastic behavior can be neglected here.
Equation (15) follows that the time dependency of the composite creep JEV(t,σ0) is completely determined by the matrix creep JM(t,σ0) for the same given initial stress σ0 and that for not too high initial stresses, the composite part contributes to the creep of particle-filled composite only elastically representing the time-independent constant term. Furthermore, quantitative information about the time-dependent interface adhesion is accessible via creep experiments as all parameters of Equation (15) are known except for kadh.
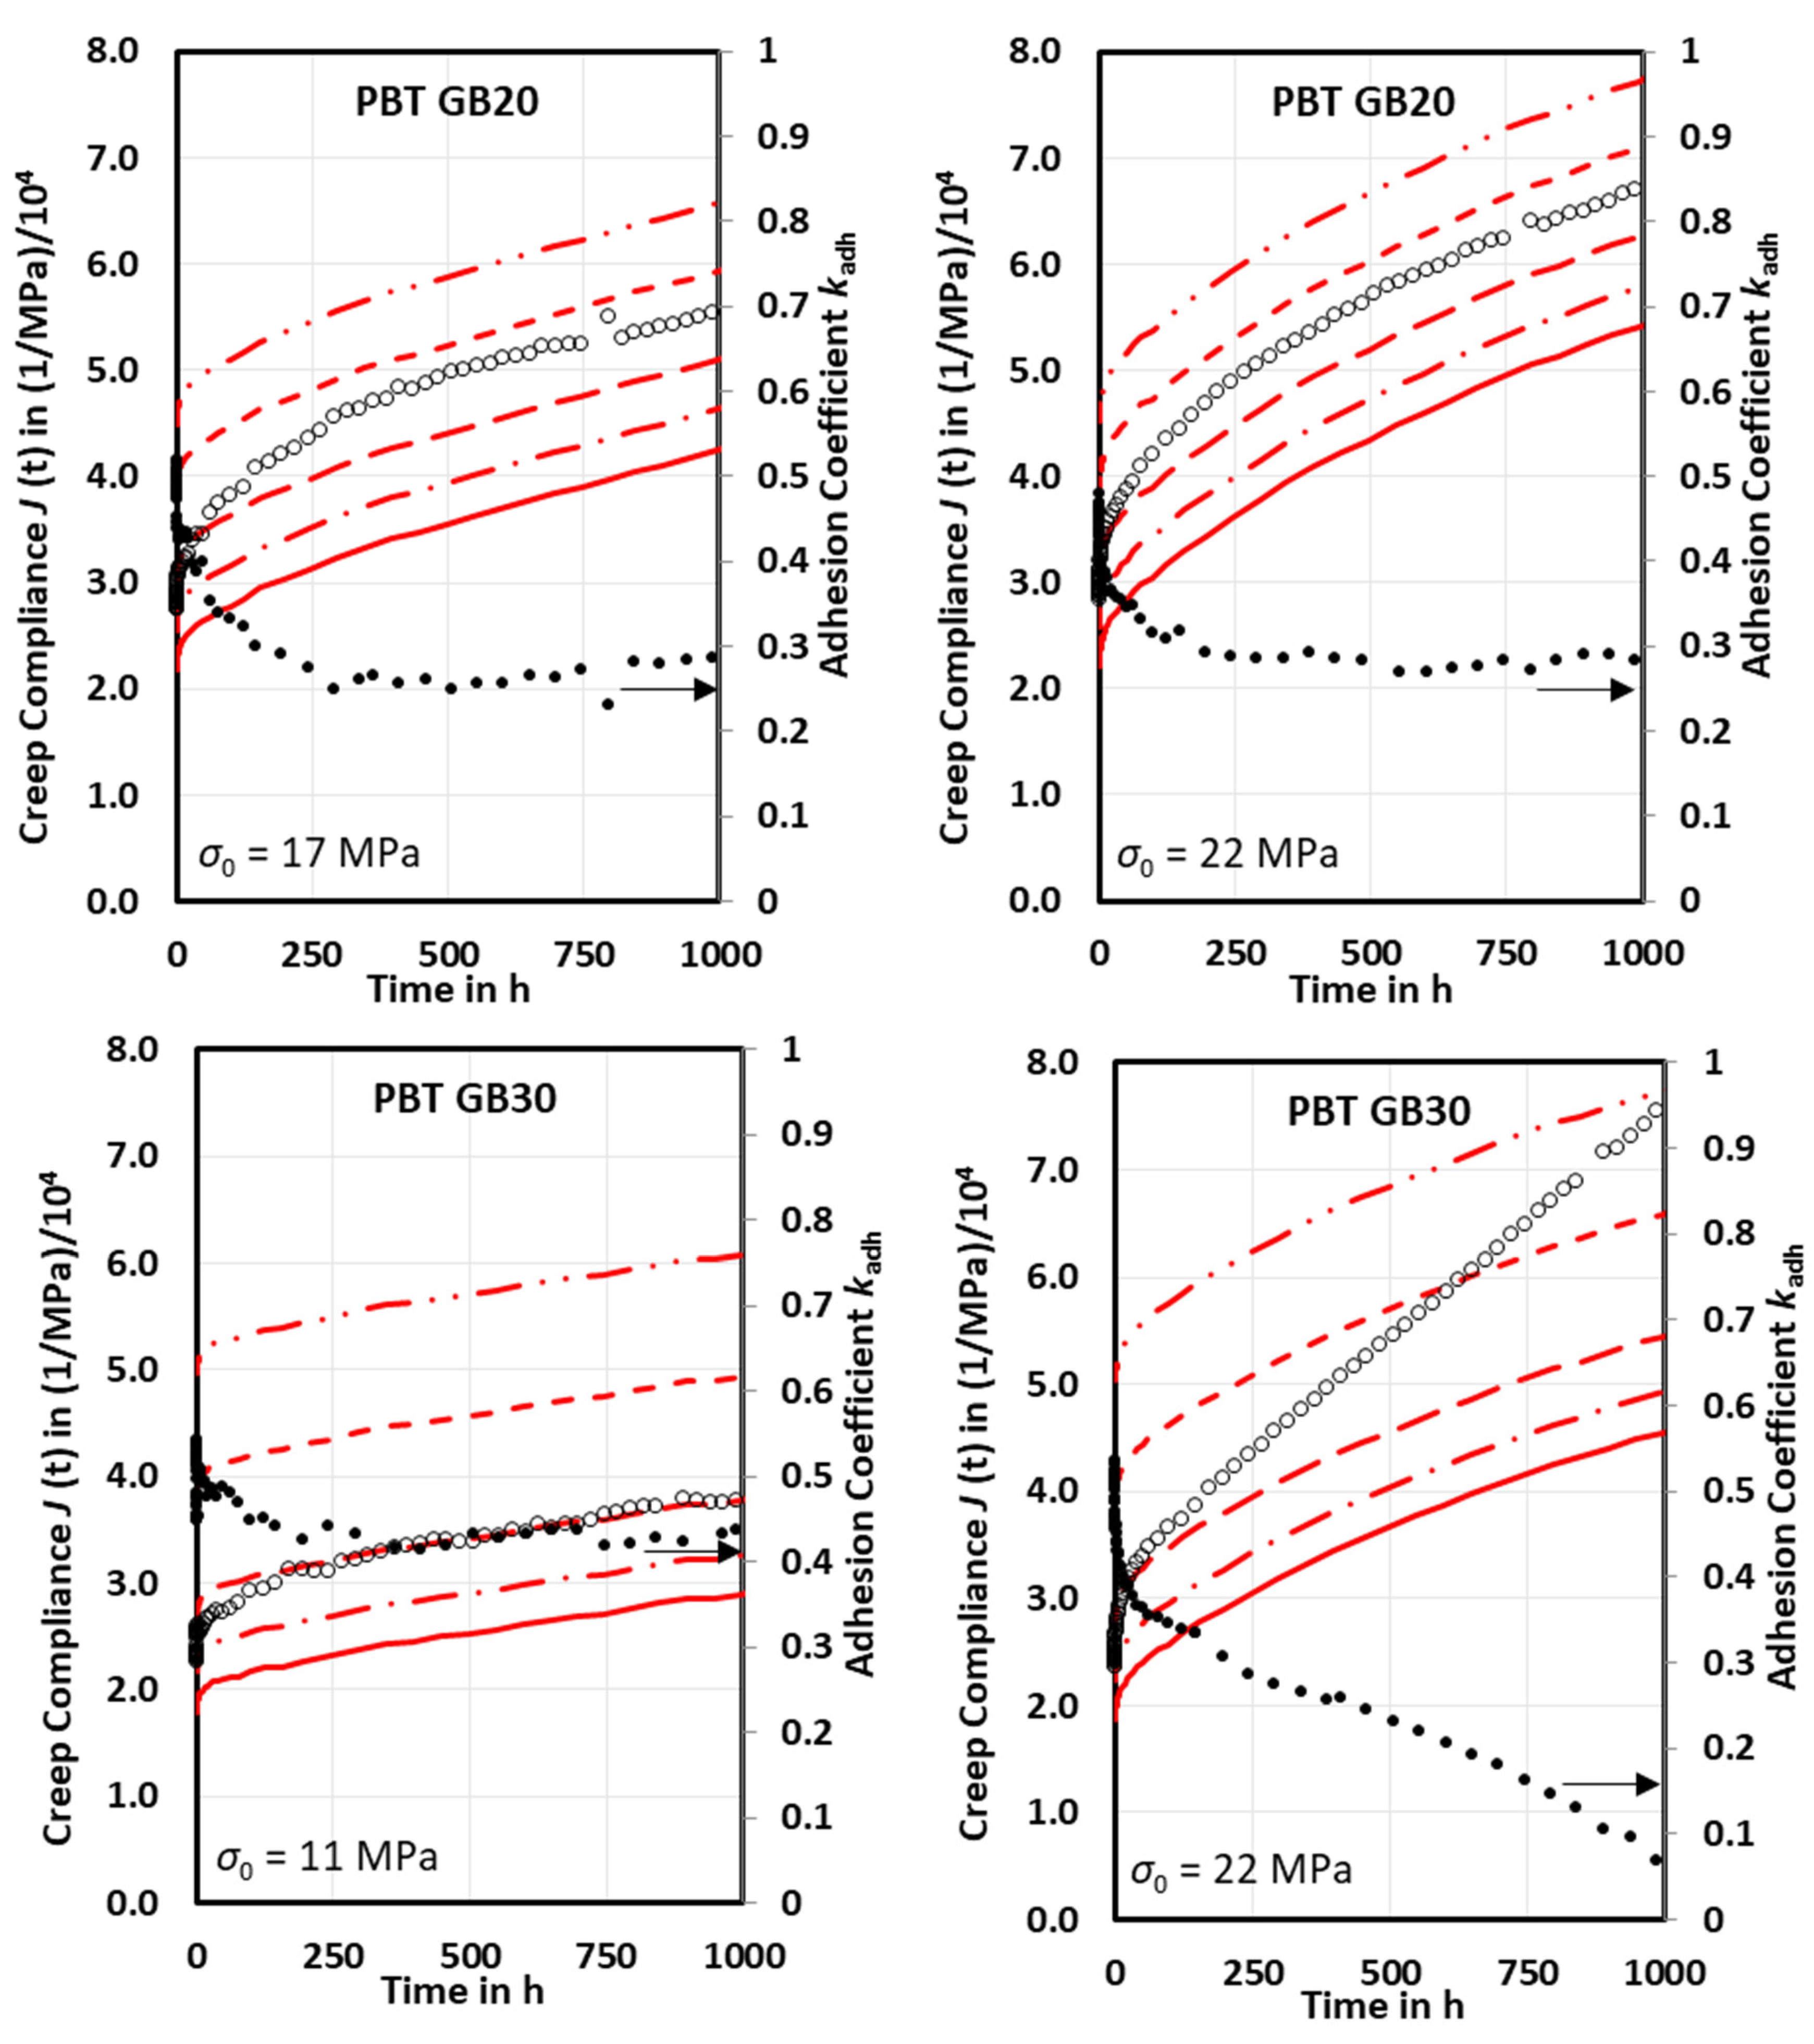
If the measured creep compliance curves of neat PBT are introduced in Equation (15), creep compliance curves of particle-filled composites can be calculated for any given adhesion factor. The calculated creep compliance curves for PBT GB20 and PBT GB30 are shown in Figure 3 as the lines for the adhesion factors 0, 0.2, 0.4, 0.6, and 1.
The adhesion factor kadh = 1 leads to the lowest creep compliance curves (solid lines), with values being smaller than measured creep compliance curves, Figure 3. With the lower adhesion factors, the calculated creep compliances achieve coincidence with the measured ones. Furthermore, the slope of the measured creep compliance curves exceeds the slope of the calculated ones. This means that the adhesion factor decreases with time. A pointwise evaluation provides the time-dependent adhesion function, Figure 3. Over 250 h, the adhesion factors kadh decrease from 0.55 to 0.36 (PBT GB20 at σ0 = 17 MPa), 0.50 to 0.32 (PBT GB20 at σ0 = 22 MPa), 0.53 to 0.45 (PBT GB30 at σ0 = 11 MPa), and 0.57 to 0.34 (PBT GB30 at σ0 = 22 MPa) and it decreases faster at the higher initial stresses. Between 250 and 1000 h, the adhesion factors tend towards an asymptotic final adhesion factor except for PBT GB30 at σ0 = 22 MPa, which decreases linearly due to the secondary creep. The adhesion factors were found to decrease logarithmically with time. Therefore, the time-dependent adhesion factors were fitted using the function
k a d h t = Δ k a d h ln t + k a d h t = 1   h
with the incremental slope Δ k a d h and initial adhesion factor k a d h t = 1   h . The fit parameters are depicted in Table 4. For the fitting time limit of 250 h, both Δ k a d h and k a d h t = 1   h increase with the initial stress. For 1000 h the k a d h t = 1   h also increases with initial stress. However, for the Δ k a d h the decrease is found for PBT GB20 and the increase for PBT GB30, which can be attributed to the effects of the asymptotic behavior for long times. For PBT GB30 at 22 MPa, the segmental fitting procedure due to the occurrence of the secondary creep provides better fitting of the measured creep compliance.
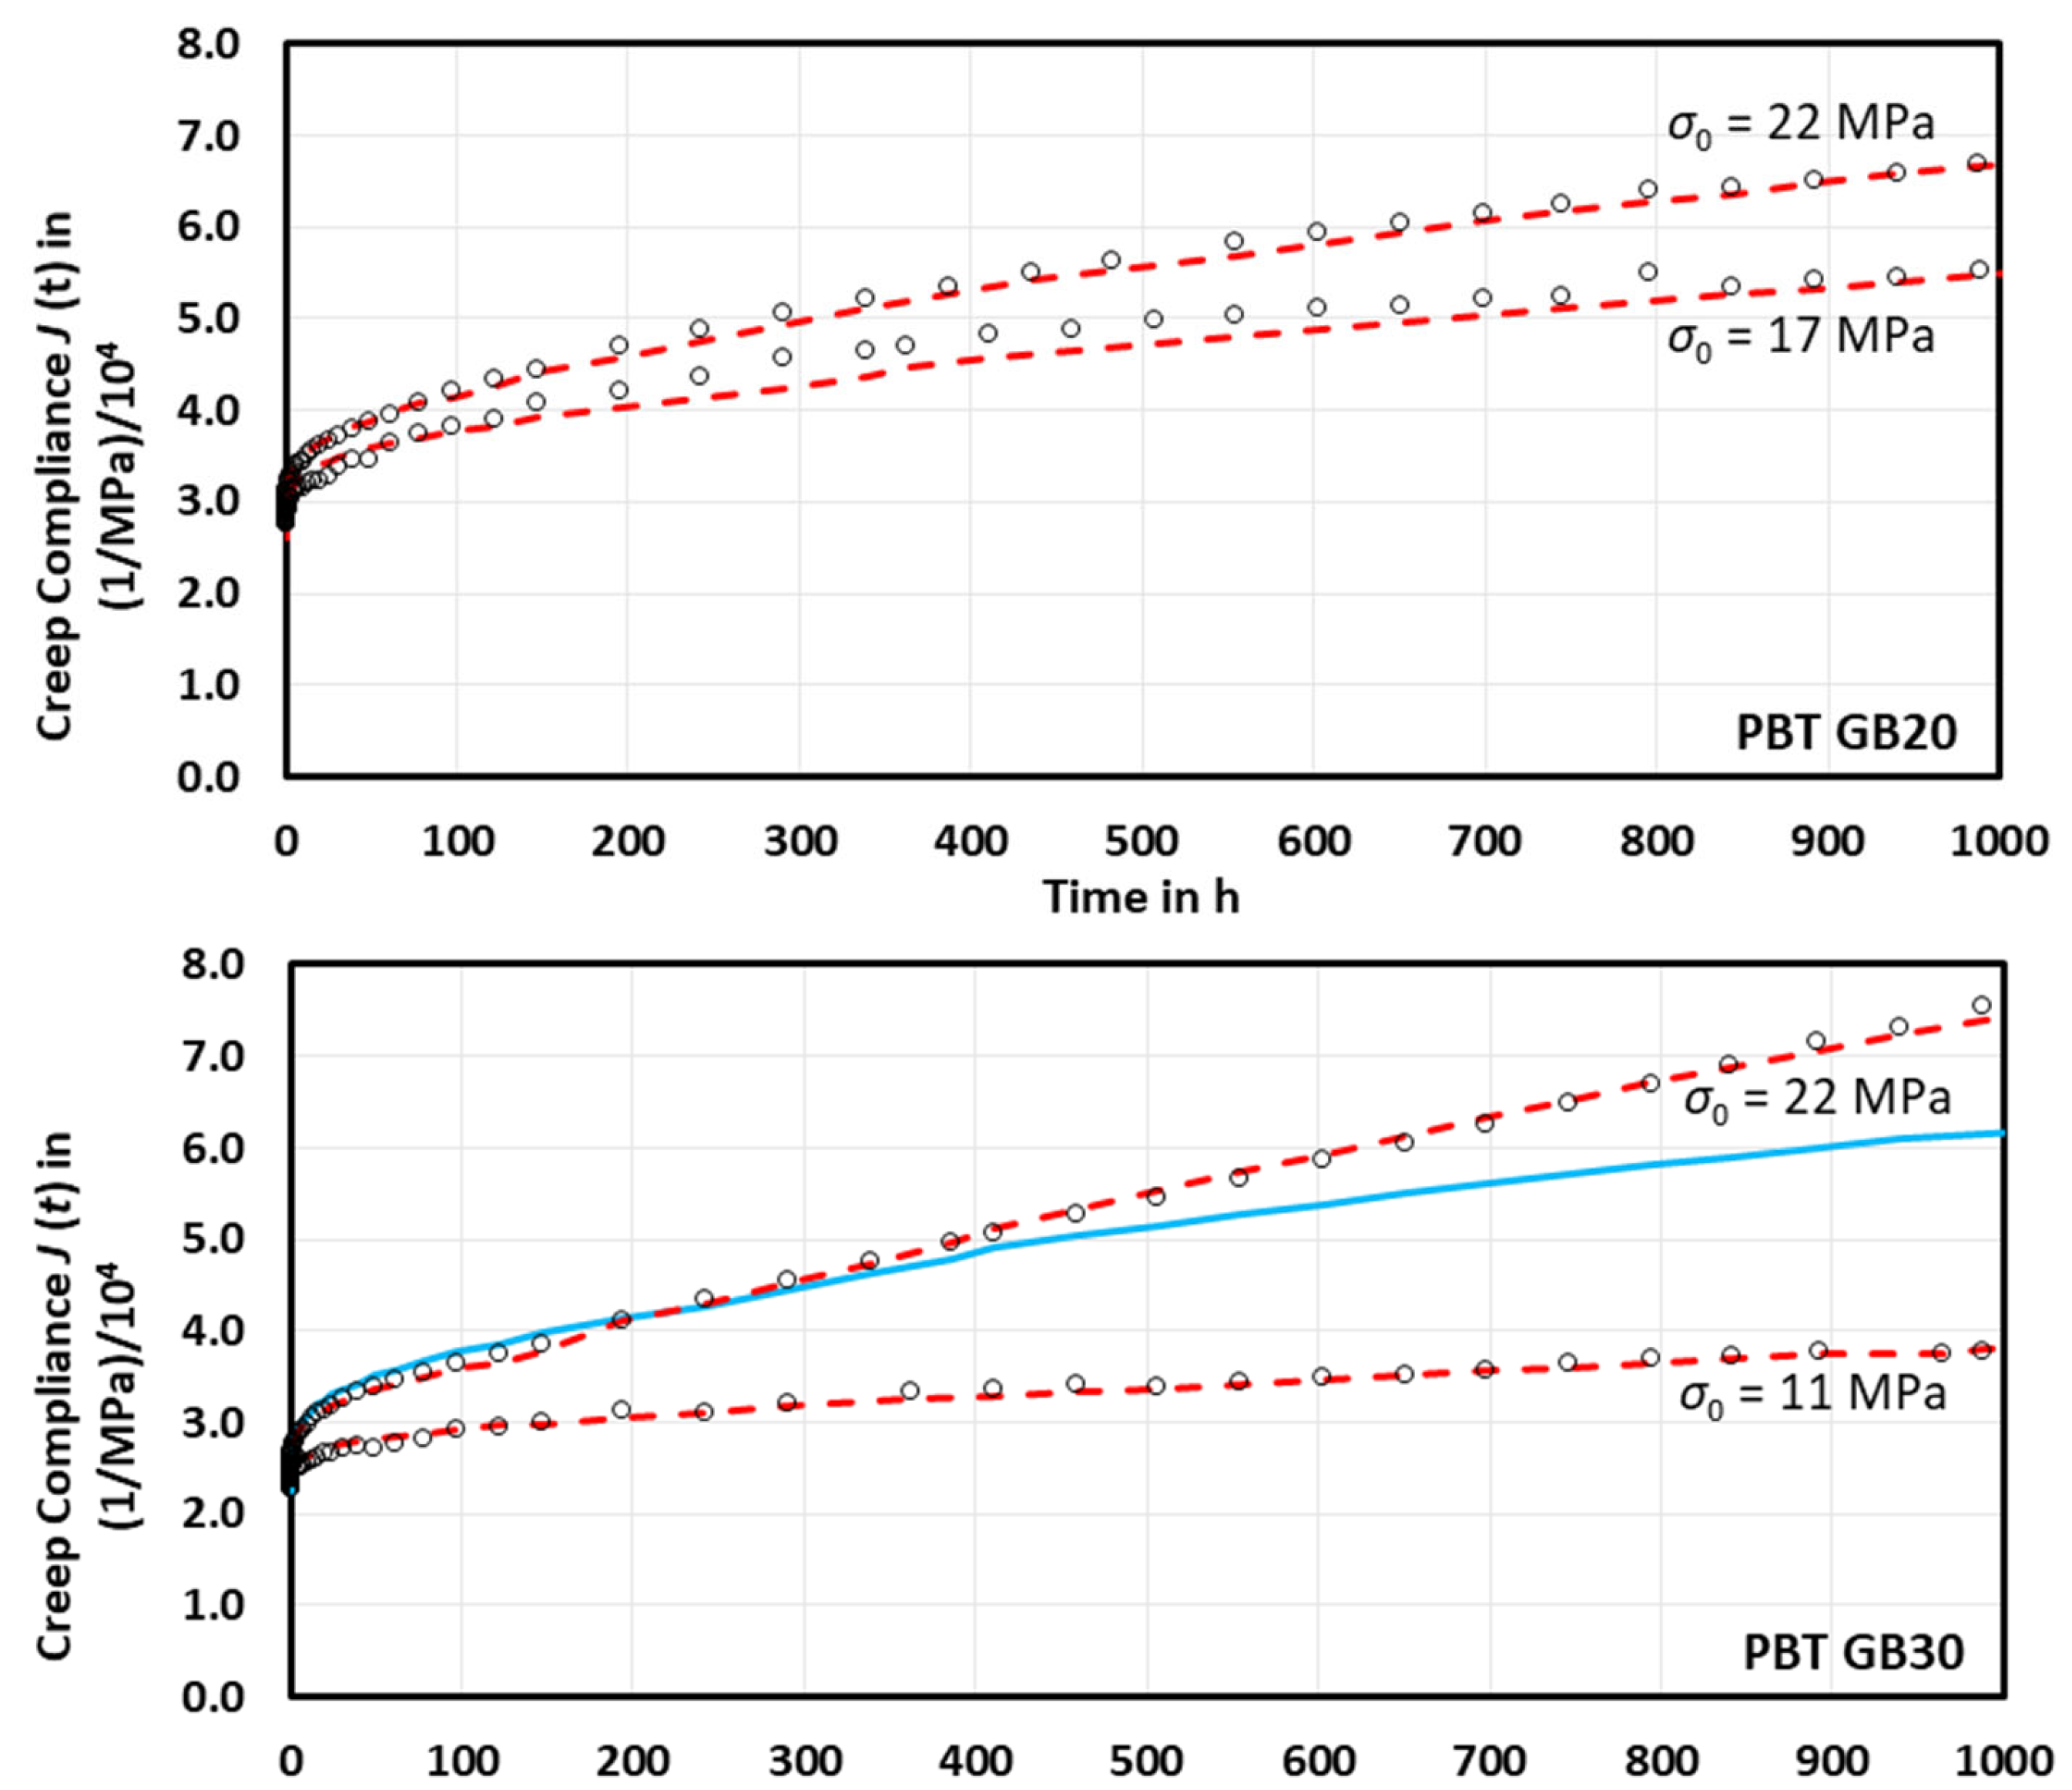
The introduction of Equation (16) to Equation (15) allows for good adjustment of the measured creep compliances, Figure 4. Only PBT GB30 at 22 MPa does not allow adequate fitting in the long-term creep range from 200 to 1000 h. Due to the linear decrease of kadh(t) at times exceeding 150 h, the fitting was performed in two steps: firstly, with Equation (16) between 0 and 150 h, and secondly, with a corresponding linear approach between 150 and 1000 h.

3. Materials and Methods

3.1. Materials

Injection molded test bars (type 1A according to ISO 527-2) were manufactured using poly(butylene terephthalate) as neat material (PBT–Ultradur B 2550) and as a matrix for glass bead-filled composites (PBT GB20, Ultradur B4300 K4, and PBT GB30, Ultradur B4300 K6) (BASF SE, Ludwigshafen, Germany). Mechanical properties in terms of Young´s modulus E, tensile strength σm, and elongation at tensile strength εm are shown in Table 5.

3.2. Methods

3.2.1. Creep Tests

Creep tests were performed according to DIN EN ISO 899-1 using a Zwick 1411 creep stand (ZwickRoell, Ulm, Germany – software testXpert) equipped with optical strain measurements at 23 °C and 50% r.h. [29]. The initial stresses σ0 were chosen to be 11, 17, and 22 MPa, respectively, for neat PBT. This corresponds roughly to yield strength ratios of 20, 30, and 40%. Initial stresses σ0 were chosen to be 17 and 22 MPa for PBT GB 20 and 11 and 22 MPa for PBT 30 GB. Creep strains were measured for maximum of 1000 h. Subsequently, the creep strain curves were corrected for errors in the measured initial length due to non-vertical mounting and sliding in clamps using a method proposed in [30].

3.2.2. Creep Modeling and Determination of Adhesion Factors

Measured creep strain curves were converted to creep compliance curves and, in the first step, fitted with Burgers model, Equation (1), and Findley power law model, Equation (3), using an Excel solver in the least square approximations for 250 and 1000 h. In the second step, the model parameters were adjusted manually using creep compliance curves in a time logarithmic scale to compensate for the domination of the short-term range. The extended cube in cube model, Equation (15), was used to calculate the creep compliances JEV(t, σ0, vF) of the glass bead-filled PBT composites in a pointwise manner to determine time-dependent interfacial adhesion factors. If the matrix creep compliance has been determined experimentally, all quantities in Equation (15) are known except for kadh(t). Thus, Equation (16) is used to determine the adhesion functions kadh(t) by fitting the time-dependent adhesion factors using Excel solver and then introduced to Equation (15).

4. Conclusions

It is known that the creep behavior of composites depends on filler/fiber volume content, initial stress as well as delamination between filler and matrix occurring at long-lasting or high loads. The creep behavior was investigated on poly(butylene terephthalate) (PBT), and its glass beads reinforced composites. First, the measured creep compliance curves were evaluated for 250 and 1000 h using the empirical models of Burgers and Findley. It turned out that the Findley model performs better as long as there is only the primary creep. If secondary creep occurs, the Burgers model is more suitable. The values of the model parameters show that increasing filler volume content leads to stiffening and increasing initial stress to softening. For predicting purposes, the problem is that one gets different parameter sets for each initial stress, and changes in interface adhesion are hidden within them. Both models contain Young’s modulus E1 as a parameter. Therefore, Paul’s cube in cube model, being an elementary volume approach (EV), was used as it offers the chance to introduce E1 as a filler volume-dependent quantity. Further, the analysis showed that the separation of the EV into the matrix and composite parts leads to time-dependent compliance, which only depends on the creep compliance of the matrix and the mean distance between filler particles or filler volume content. In the composite part, the majority of the stress is transferred to the stiff filler particles. Thus, it contributes only with the constant value to the creep compliance as long as the initial stresses remain small with respect to the tensile strengths. However, the creep compliance of the composites part has to include interface adhesion properties—namely, perfect adhesion. Due to its mathematical structure, it allows for the introduction of the adhesion factor having values between 0 and 1. This enables the elucidation of the time-dependent adhesion factors. This approach offers (design) engineers the chance to predict the realistic creep behavior of particulate composites for any filler volume content if the creep compliance of the matrix for any given initial stress and the adhesion factor is available.

Author Contributions

J.R.: conceptualization, methodology, validation, formal analysis, writing—original draft, writing—review and editing, investigation, data curation, visualization. E.R.-v.D.: conceptualization, writing—review and editing. B.M.: conceptualization, methodology, resources, writing—review and editing, supervision. B.H.: conceptualization, writing—review and editing, supervision, funding. All authors have read and agreed to the published version of the manuscript.

Funding

The author B.H. acknowledges the financial support of the Ministry of Education, Youth and Sports of the Czech Republic-DKRVO (RP/CPS/2022/003).

Institutional Review Board Statement

Not applicable.

Informed Consent Statement

Not applicable.

Data Availability Statement

The data obtained and analyzed during the research can be found in ZENODO open repository maintained by CERN https://doi.org/10.5281/zenodo.7284165 (accessed on 18 October 2022).

Conflicts of Interest

The authors declare that they have no known competing financial interests or personal relationships that could have appeared to influence the work reported in this paper.

References

  1. Thomas, S. Polymer Composites; Wiley-VCH Verlag & Co.KgaA: Weinheim, Germany, 2012. [Google Scholar]
  2. Raghavan, J.; Meshii, M. Creep of polymer composites. Compos. Sci. Technol. 1998, 57, 1673–1688. [Google Scholar] [CrossRef]
  3. Fu, S.Y.; Feng, X.Q.; Lauke, B.; Mai, Y.W. Effects of particle size, particle/matrix interface adhesion and particle loading on mechanical properties of particulate-polymer composites. Compos. Part B-Eng. 2008, 39, 933–961. [Google Scholar] [CrossRef]
  4. Bek, M.; Aulova, A.; Cresnar, K.P.; Matkovič, S.; Kalin, M.; Perše, L.S. Long-term creep compliance of wood polymer composites: Using untreated wood fibers as a filler in recycled and neat polypropylene matrix. Polymers 2022, 14, 2539. [Google Scholar] [CrossRef] [PubMed]
  5. Chandekar, H.; Waigaonkar, S.; Chaudhari, V. Effect of chemical treatment on creep-recovery behavior of jute-polypropylene composites. J. Mater. Des. Appl. 2020, 235, 329–340. [Google Scholar] [CrossRef]
  6. Marcovich, N.E.; Villar, M.A. Thermal and mechanical characterization of linear low-density polyethylene/wood flour composites. J. Appl. Polym. Sci. 2003, 90, 2775–2784. [Google Scholar] [CrossRef]
  7. Findley, W.N.; Lai, J.S.; Onaran, K. Creep and Relaxation of Nonlinear Viscoelastic Materials; Dover Publication, Inc.: New York, NY, USA, 1989. [Google Scholar]
  8. Ediger, B. Einfluss der Teilchengeometrie auf das Verhalten von Verbundwerkstoffen mit Nicht-Linear-Viskoelastischen Eigenschaften, Dargestellt am Beispiel Gefüllten und Verstärkten Polypropylens. Ph.D. Thesis, Universität Stuttgart, Stuttgart, Germany, 1986. [Google Scholar]
  9. Ferry, J.D. Viscoelastic Properties of Polymers; John Wiley & Sons: New York, NY, USA, 1980. [Google Scholar]
  10. Altenbach, H. Classical and non-classical creep models. In Creep and Damage in Materials and Structures. International Centre for Mechanical Sciences; Altenbach, H., Skrzypek, J.J., Eds.; Springer: Vienna, Austria, 1999; Volume 399. [Google Scholar] [CrossRef]
  11. Cessna, L.C., Jr. Stress-time superposition of creep data for polypropylene and coupled glass-reinforced polypropylene. Polym. Eng. Sci. 1971, 11, 211–219. [Google Scholar] [CrossRef]
  12. Georgiopoulos, P.; Kontou, E.; Christopoulos, A. Short-term creep behavior of a biodegradable polymer reinforced with wood-fibers. Compos. Part B-Eng. 2015, 80, 134–144. [Google Scholar] [CrossRef]
  13. Eftekhari, M.; Fatemi, A. Creep behavior and modeling of neat, talc-filled, and short glass fiber reinforced thermoplastics. Compos. Part B-Eng. 2016, 97, 68–93. [Google Scholar] [CrossRef]
  14. Asyraf, M.R.M.; Ishak, M.R.; Sapuan, S.M.; Yidris, N. Comparison of Static and Long-term Creep Behaviors between Balau Wood and Glass Fiber Reinforced Polymer Composite for Cross-arm Application. Fibers Polym. 2021, 22, 793–803. [Google Scholar] [CrossRef]
  15. Gonilha, J.A.; Correia, J.R.; Branco, F.A. Creep response of GFRP–concrete hybrid structures: Application to a footbridge prototype. Compos. Part B-Eng. 2013, 53, 193–206. [Google Scholar] [CrossRef]
  16. Robinson, D.N.; Binienda, W.K.; Ruggles, M.B. Creep of polymer matrix composites. I: Norton/Bailey creep law for transverse isotropy. J. Eng. Mech.-ASCE 2003, 129, 310–317. [Google Scholar] [CrossRef]
  17. Buchdahl, R.; Nielsen, L.E. The application of Nutting´s equation to the viscoelastic behavior of certain polymeric systems. J. Appl. Phys. 1951, 22, 1344. [Google Scholar] [CrossRef]
  18. Simsiriwong, J.; Sullivan, R.W.; Hilton, H.H. Viscoelastic creep compliance using prony series and spectrum function approach. In Challenges in Mechanics of Time-Dependent Materials and Processes in Conventional and Multifunctional Materials; Antoun, B., Qi, H., Hall, R., Tandon, G., Lu, H., Lu, C., Eds.; Conference Proceedings of the Society for Experimental Mechanics Series; Springer: New York, NY, USA, 2013; Volume 2. [Google Scholar] [CrossRef]
  19. Preston, F.W. The mechanical properties of glass. J. Appl. Phys. 1942, 13, 623. [Google Scholar] [CrossRef]
  20. Xu, Y.; Wu, Q.; Young, L.; Yao, F. Creep behavior of bagasse fiber reinforced polymer composites. Bioresour. Technol. 2010, 101, 3280–3286. [Google Scholar] [CrossRef]
  21. CAMPUS Data Base. Available online: https://www.campusplastics.com/campus/en/datasheet/Ultradur%C2%AE+B+2550 (accessed on 18 October 2022).
  22. Perez, C.J.; Alvarez, V.A.; Vazquez, A. Creep behavior of layered silicate/starch-polycaprolactone blends nanocomposites. Mater. Sci. Eng. A-Struct. 2008, 480, 259–265. [Google Scholar] [CrossRef]
  23. Yang, J.; Zhang, Z.; Schlarb, A.K.; Friedrich, K. On the characterization of tensile creep resistance of polyamide 66 nanocomposites. Part II: Modeling and prediction of long-term performance. Polymer 2006, 47, 6745–6758. [Google Scholar] [CrossRef]
  24. Du, Y.; Yan, N.; Kortschot, M.T. An experimental study of creep behavior of lightweight natural fiber-reinforced polymer composite/honeycomb core sandwich panels. Compos. Struct. 2013, 106, 160–166. [Google Scholar] [CrossRef]
  25. Bourkas, G.; Prassianakis, I.; Kytopoulos, V.; Sideridis, E.; Younis, C. Estimation of elastic moduli of particulate composites by new models and comparison with moduli measured by tension, dynamic and ultrasonic tests. Adv. Mat. Sci. Eng. 2010, 2010, 891824. [Google Scholar] [CrossRef] [Green Version]
  26. Paul, B. Prediction of constants of multiphase materials. Trans. Am. Inst. Min. Metall. Pet. Eng. 1960, 218, 36–41. [Google Scholar]
  27. Ishai, O.; Cohen, I.J. Elastic properties of filled and porous epoxy composites. Int. J. Mech. Sci. 1967, 9, 539–546. [Google Scholar] [CrossRef]
  28. Rech, J. Introduction of an adhesion factor to cube in cube models and its effect on calculated moduli of particulate composites. Sci. Rep. 2022, 12, 1–14. [Google Scholar] [CrossRef] [PubMed]
  29. Pöllet, P. Automatisierte Zeitstandsmessung—Verfahren mit berührungsloser Dehnungsmessung. Kunststoffe 1985, 75, 829–834. [Google Scholar]
  30. Möginger, B. Einfluss der Verarbeitung auf Morphologie und Deformationsverhalten von Polybutylen-Terephthalat (PBT)—Appendix B. Ph.D. Thesis, University of Stuttgart, Stuttgart, Germany, 1993. [Google Scholar]
Figure 1. Measured creep compliances (symbols) of neat PBT (a,d), PBT GB20 (b,e), and PBT GB30 (c,f) fitted with Burgers model (dash-point line) and Findley power law model (dashed line) with initial stresses σ0 = 11 MPa (), 17 MPa (o), and 22 () MPa; time intervals of fitting were 1000 h (ac) and 250 h (df).
Ijms 23 14120 g001
Figure 2. (a) Cubic elementary volume (EV) with edge length D + a containing spherical inclusion of diameter D; a denotes distance between neighboring inclusions. (b) Separation of EV into matrix part and composite part containing now cubic inclusion according to [26] with the external load F0.
Ijms 23 14120 g002
Figure 3. Comparison of measured creep compliances (o) of PBT GB20 and PBT GB30 to calculated creep compliances with adhesion coefficients kadh = 0, 0.2, 0.4, 0.6, and 1 (lines from top to bottom) for various initial stresses; point by point evaluated adhesion coefficients (●) exhibit clearly time dependency.
Ijms 23 14120 g003
Figure 4. Comparison of initial stress-dependent measured creep compliances (o) of PBT GB20 and PBT GB30 to calculated creep compliances (dashed lines) using Equations (15) and (16); full line represents the extrapolation of 250 h fit.
Ijms 23 14120 g004
Table 1. Some models of time- and stress-dependent creep compliances for polymers.
ModelsCreep Strain/Creep Compliance
Burgers J t , σ 0 = 1 E 1 + 1 E 2 1 e E 2 η 2   t + t η 1 (1)
with time t, initial stress σ0, stiffnesses of Burgers model E1, E2 and viscosities of Burgers model η1, η2
Modified Burgers J t , σ 0 = 1 E 1 + 1 E 2 1 e t a τ b + t η 1 (2)
with relaxation time τ and fitting parameters a and b
Findley power law J t , σ 0 = ε 0 σ 0 + ε + σ 0 t n = 1 E 1 + ε + σ 0 t t 1 n (3)
with initial strain ε0, transient strain ε+, exponent n, reference time t1
Findley modified power law J t , σ 0 = ε 0 σ 0 sinh σ 0 σ 1 + ε + σ 0 t n sinh σ 0 σ 1 (4)
with reference stress σ1
Bailey–Norton J t , σ 0 = A   σ 0 m 1   t t 1 n + (5)
with coefficient A and exponents m and n+
Power series J t ,   σ 0 = J 0 + i = 1 m J i t t i (6)
with reference time t’, relaxation strengths Ji and index i
Prony–Dirichlet series J t ,   σ 0   = J 0 + i = 1 m J i 1 e t τ i (7)
with relaxation times τi
Table 2. Initial stress-dependent parameters of Burgers model according to fitting creep compliance of neat PBT, PBT GB20, and PBT GB30 showing effect of chosen fitting time ranges.
Range of Fitting TimeGB ContentInitial Stress σ0Parameters of Burgers Model
E1E2η1η2
hw%MPaMPaGPa h
0 to 250
Ijms 23 14120 i001
011272021,9003170115
17262021,340168092
22257015,900109074
2017354028,1001750108
22338018,890153066
3011422035,9404490174
22408018,770159047
0 to 1000011271019,1604480219
17260014,1602840141
22256010,6841660128
2017350024,1003310123
22334018,500237086
3011418023,7409110384
22406015,910212064
Table 3. Initial stress-dependent parameters of Findley power law model according to fitting creep compliance of neat PBT, PBT GB20, and PBT GB30 showing effect of chosen fitting time ranges.
Range of Fitting TimeGB ContentInitial Stress σ0Parameters of Findley Power Law Model
ε0ε+nE1 = σ0/ε0
hw%MPa10−210−6-MPa
0 to 2500110.412.210.472690
170.642.540.522657
220.863.400.552545
20170.478.730.423629
220.628.360.463529
30110.277.580.354149
220.566.230.483907
0 to 10000110.412.230.472666
170.642.540.522657
220.863.410.552546
20170.479.060.423636
220.628.360.463526
30110.268.020.354165
220.566.630.483929
Table 4. Fit parameters k a d h t = 1   h  and  Δ k a d h of time-dependent adhesion factors for fitting times ranging from 0 to 250 h and 0 to 1000 h. R2 shows the correlation coefficient of measured and fitted curves.
Range of Fitting TimeGB ContentInitial StressFit Parameter of Time-Dependent Adhesion Factor
σ0k]_adh k a d h t = 1   h R2
hw%MPa--%
0 to 25020170.0170.4595.2
220.0160.4199.4
30110.0080.4992.4
220.0210.4599.0
0 to 100020170.0220.4594.6
220.0170.4199.3
30110.0090.4992.5
220.0270.4497.9
ln 0 < t < 150 h0.0200.4599.4
lin 150 h < t < 1000 h0.1230.9799.6
Table 5. Mechanical properties of PBT composites determined according to ISO 527.
Weight Content of Glass BeadVolume Content of Glass BeadYoung’s ModulusTensile StrengthElongation at Tensile Strength
vFvFEσmaxεmax
--MPaMPa%
002754 ± 2559 ± 0.110.8 ± 1.4
200.123691 ± 3357 ± 0.13.2 ± 0.2
300.194408 ± 3955 ± 0.12.0 ± 0.6
Publisher’s Note: MDPI stays neutral with regard to jurisdictional claims in published maps and institutional affiliations.