
Dysregulation of miR-1-3p: An Early Event in Colitis-Associated Dysplasia

 , ,
, , 
Abstract
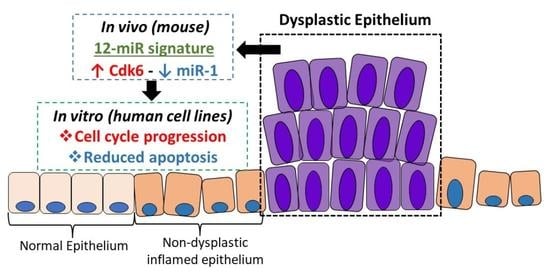
1. Introduction
2. Results
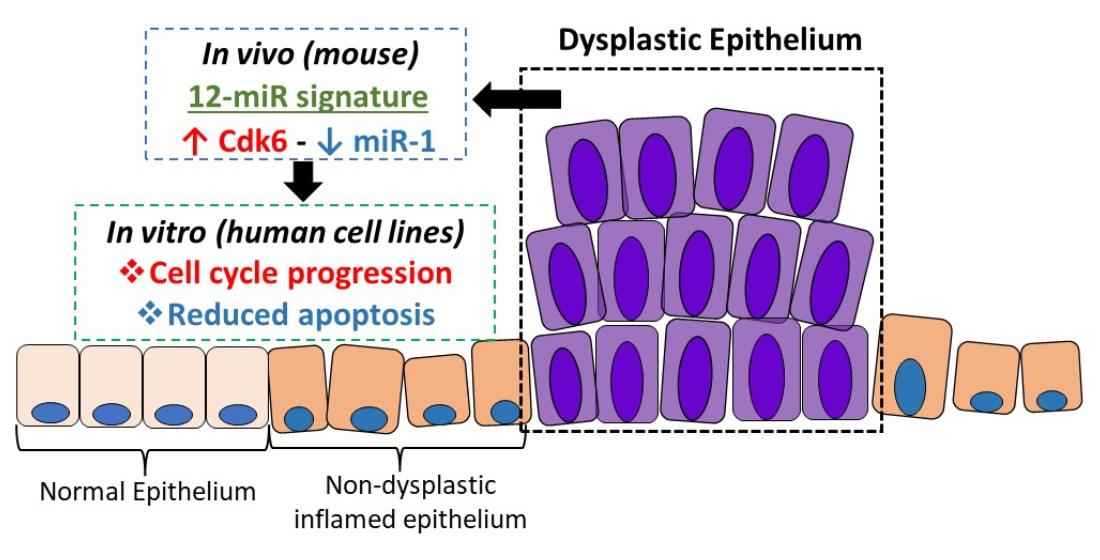
2.1. miRNA Signature Differentiates Inflamed Non-Neoplastic Mucosa from Flat and Polypoid Dysplasia
2.2. Genes Differentially Expressed in Colitis-Associated Colonic Dysplasias
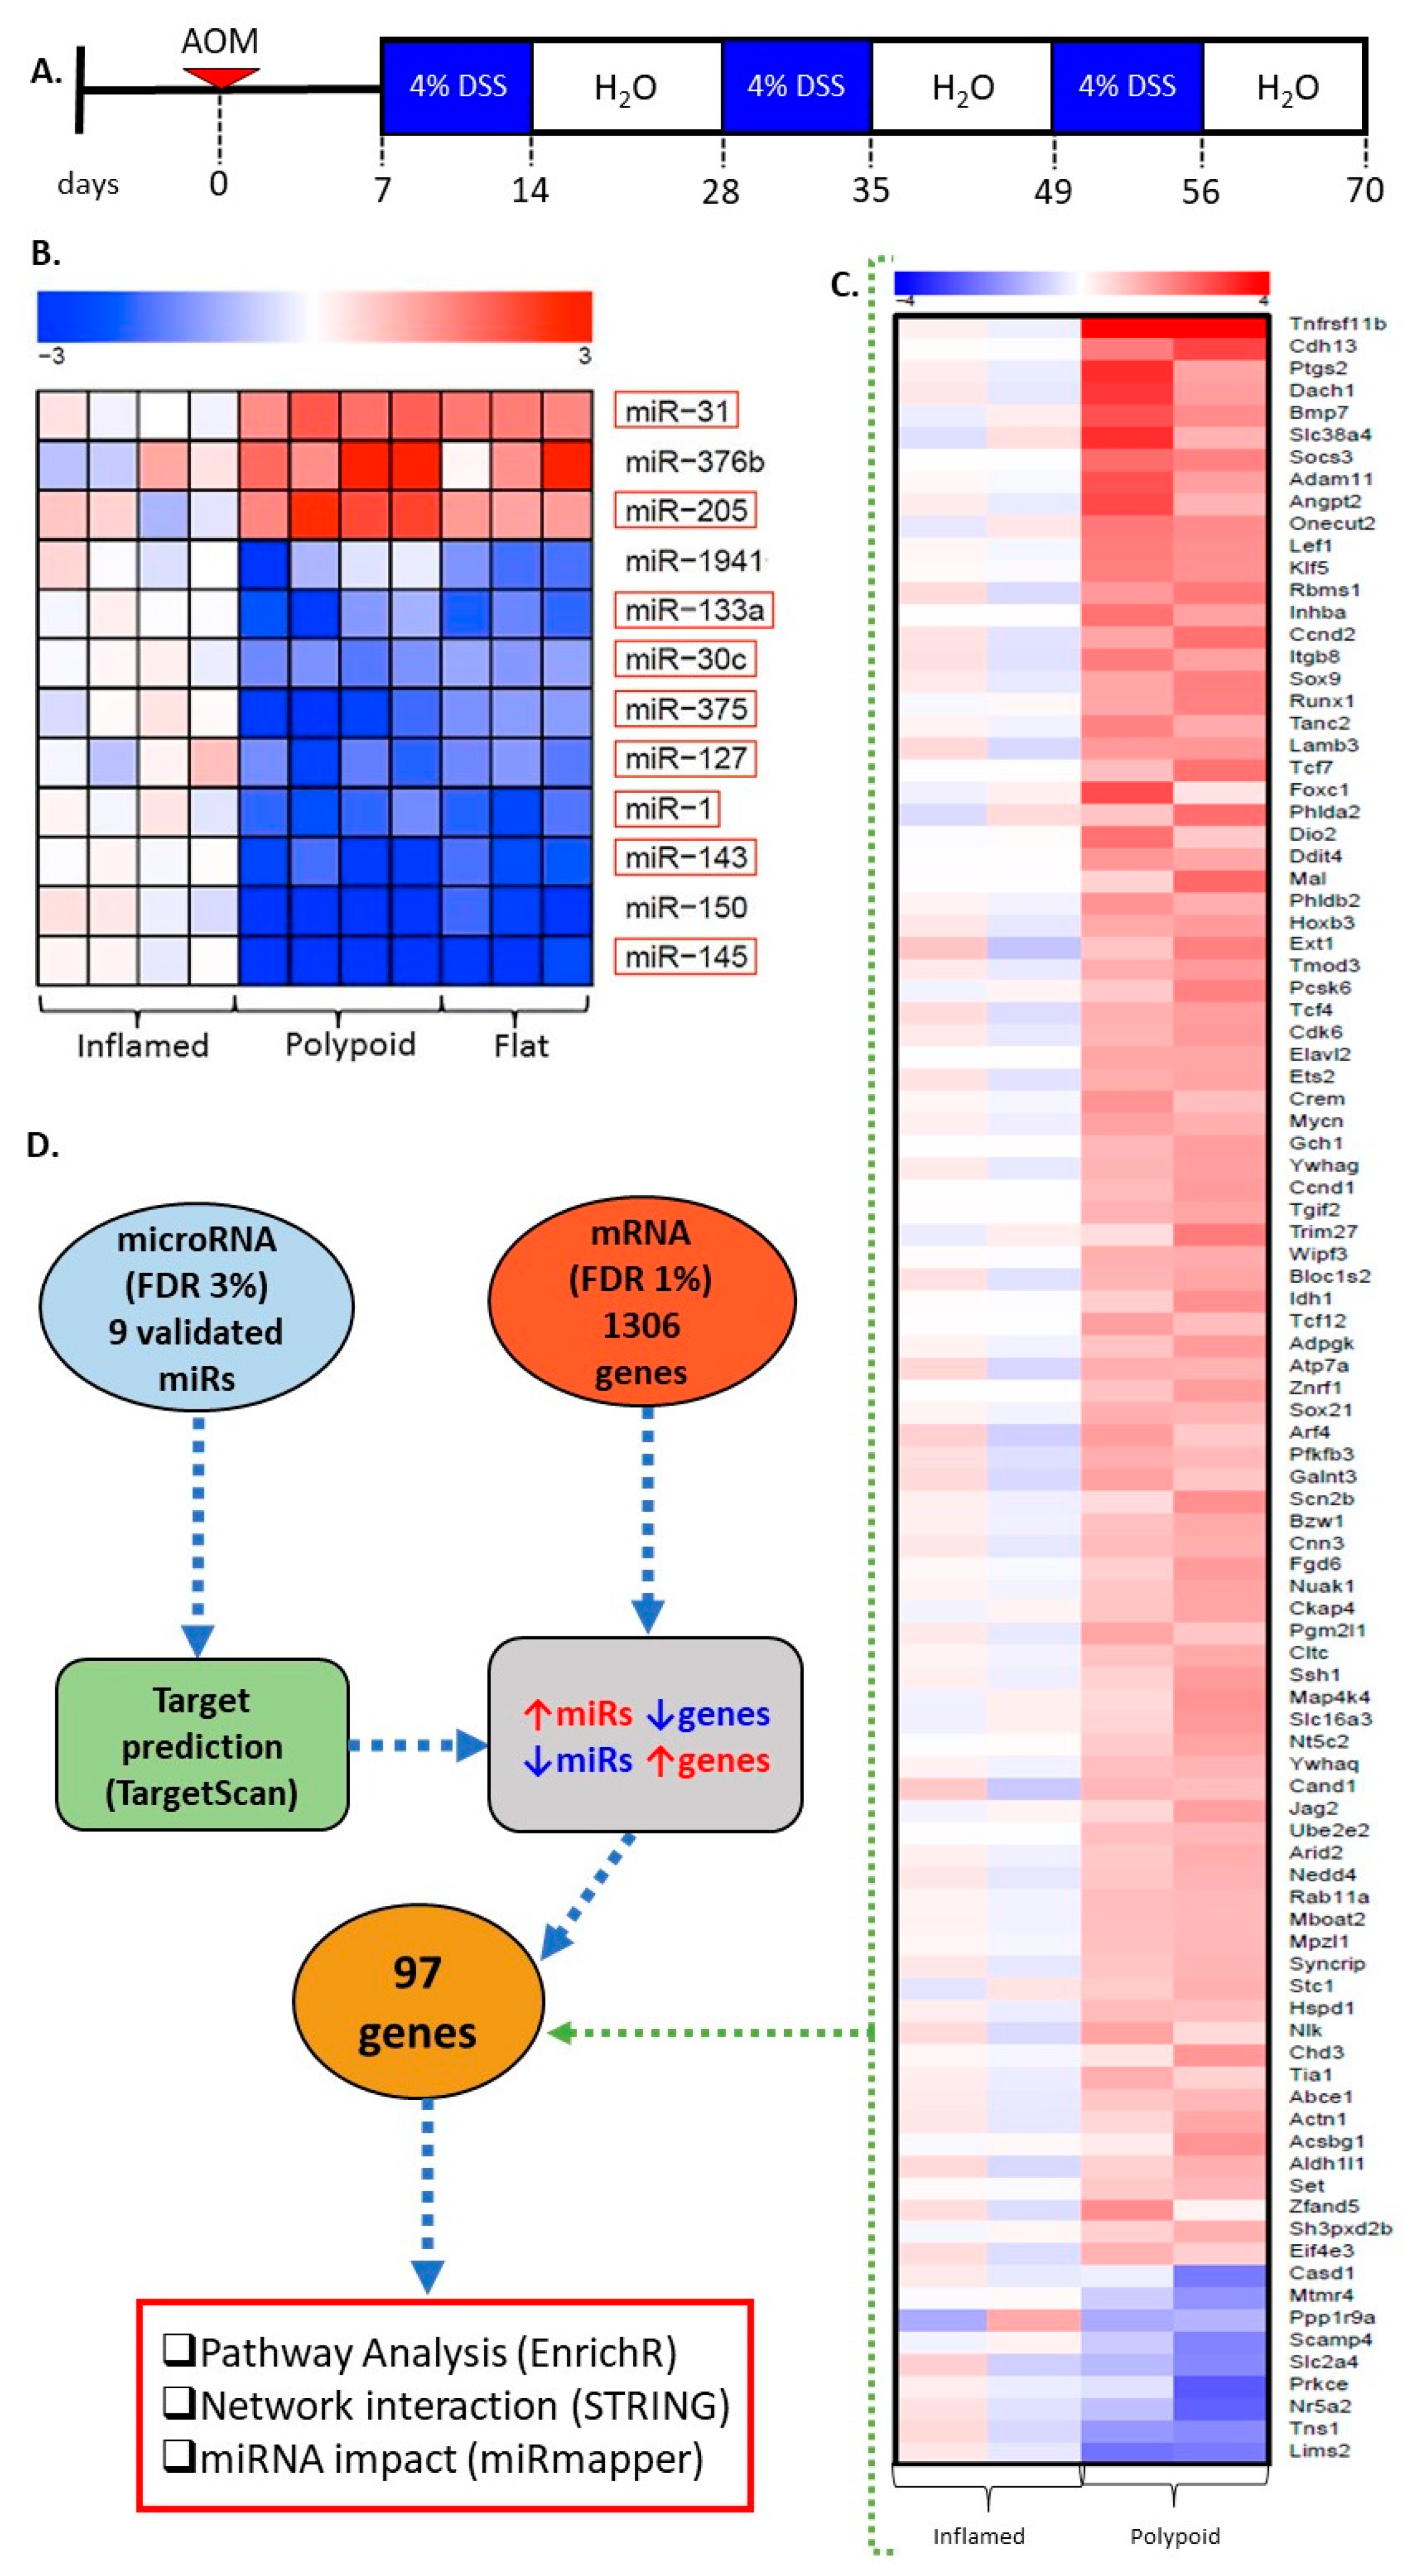
2.3. miR Targets Are Associated with the Progression of Colitis-Associated Carcinogenesis
2.4. miR-30c, miR-145a and miR-1 Are the Hub miRs of the Early Detection Signature
2.5. Protein–Protein Interactions Categorize the Selected Targets into Five Functional Clusters
2.6. Biological Function of miR-1 In Vitro
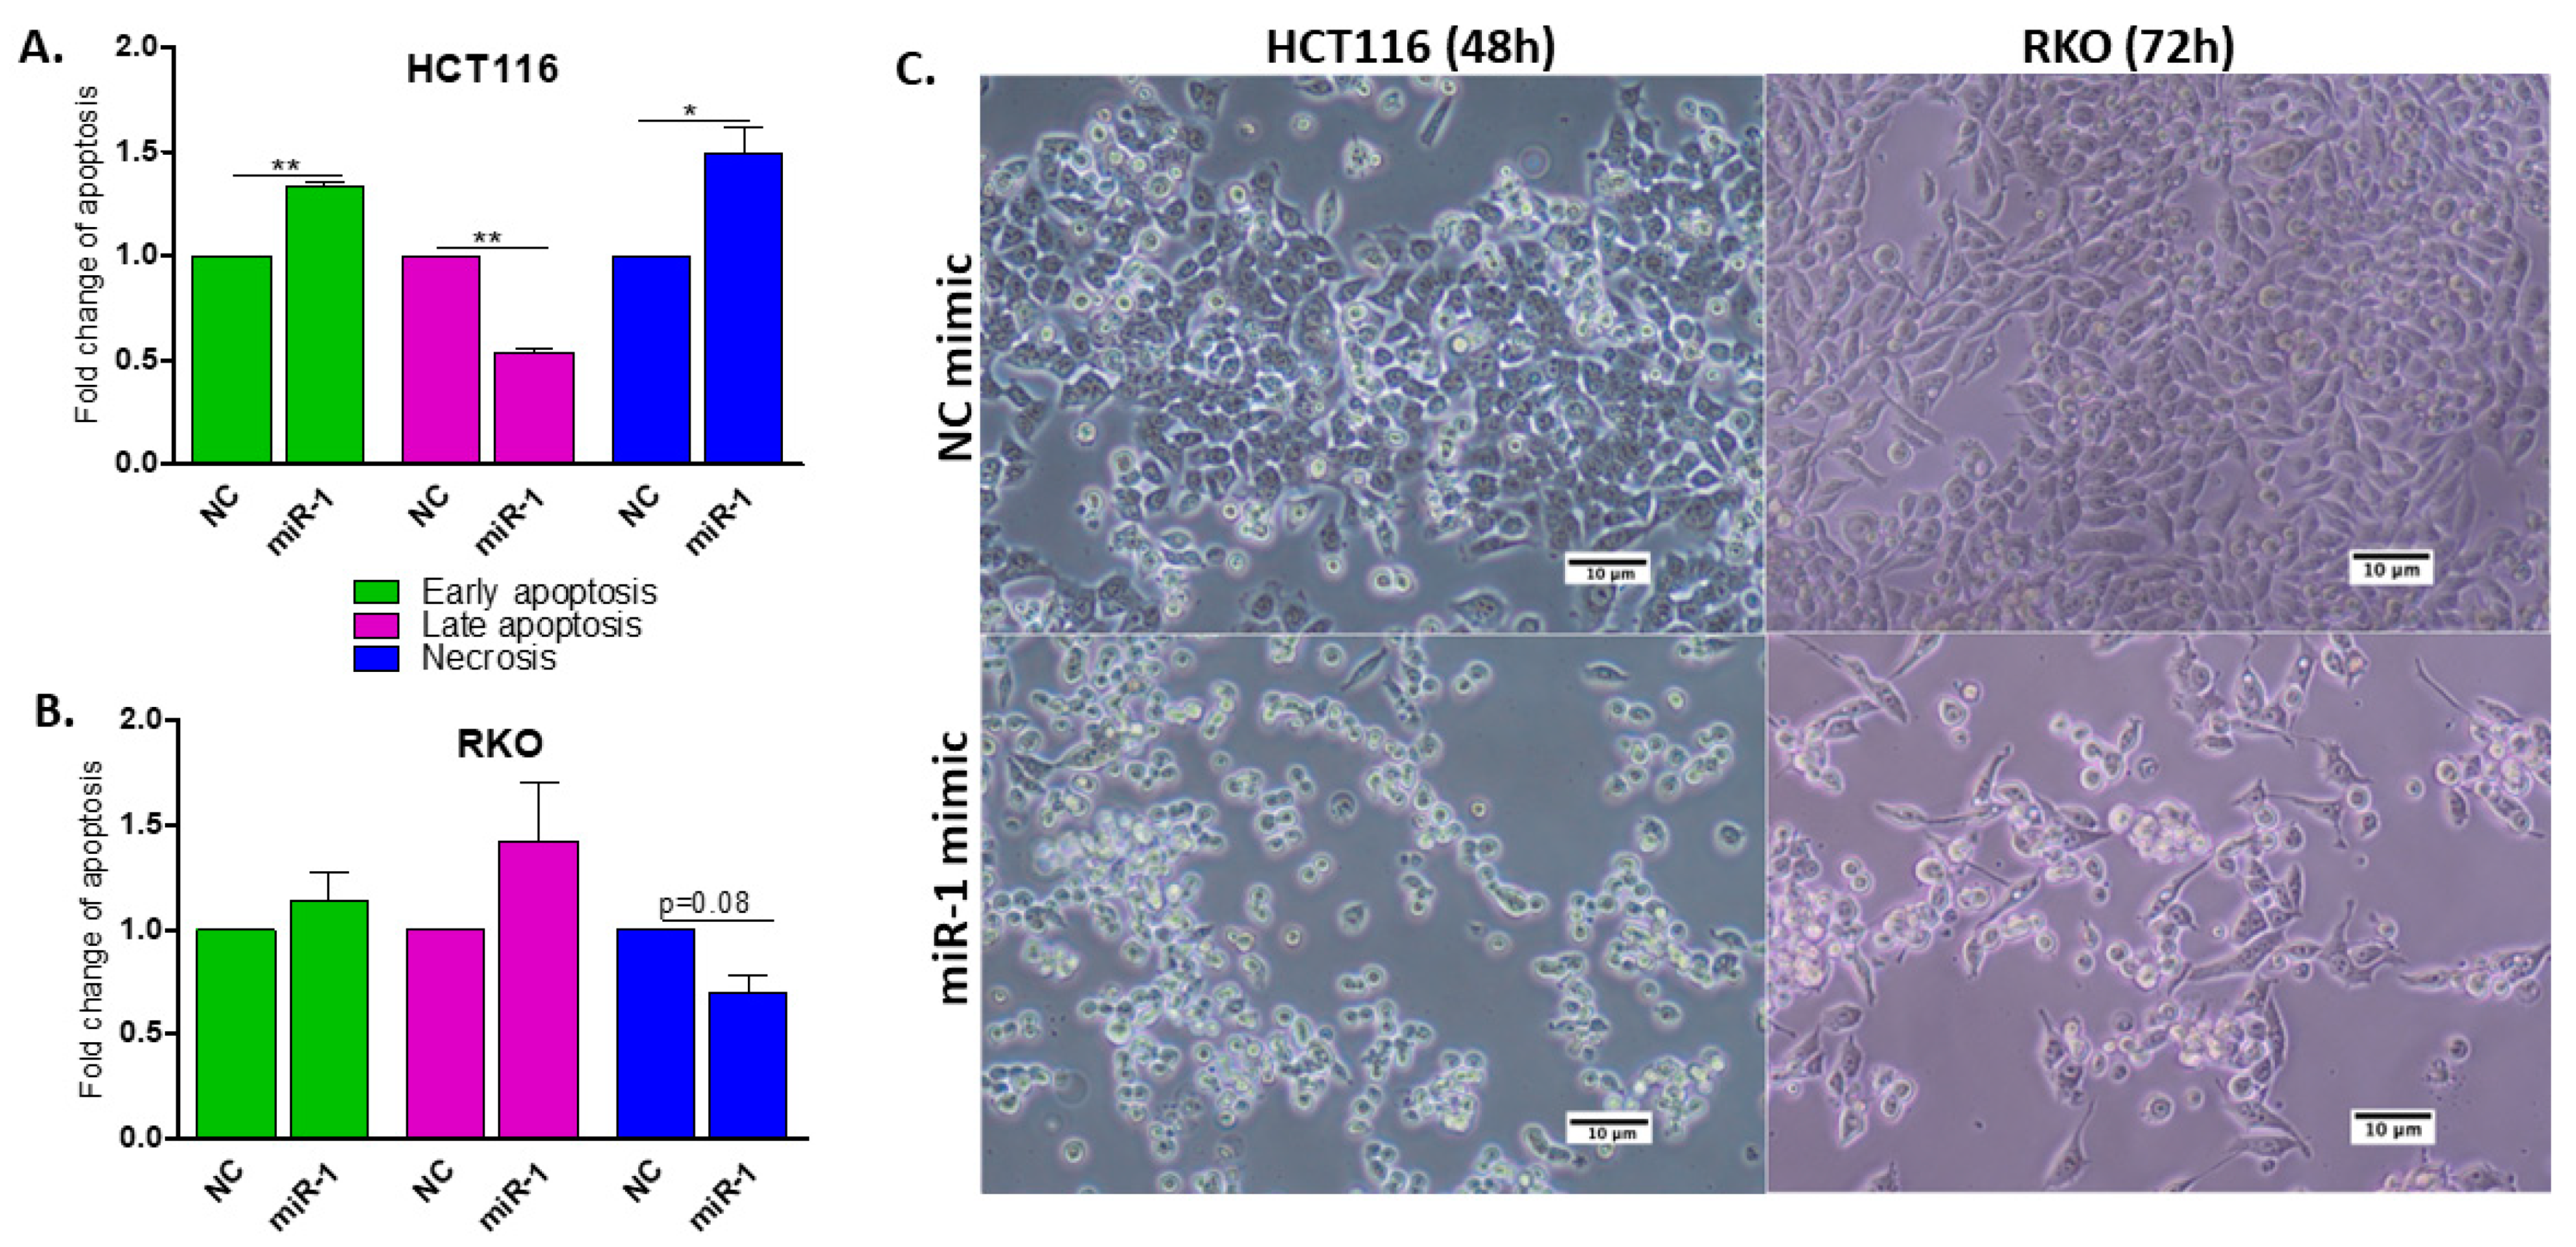
2.7. miR-1 Induces Apoptosis in HCT116 and RKO Human Colon Carcinoma Cells
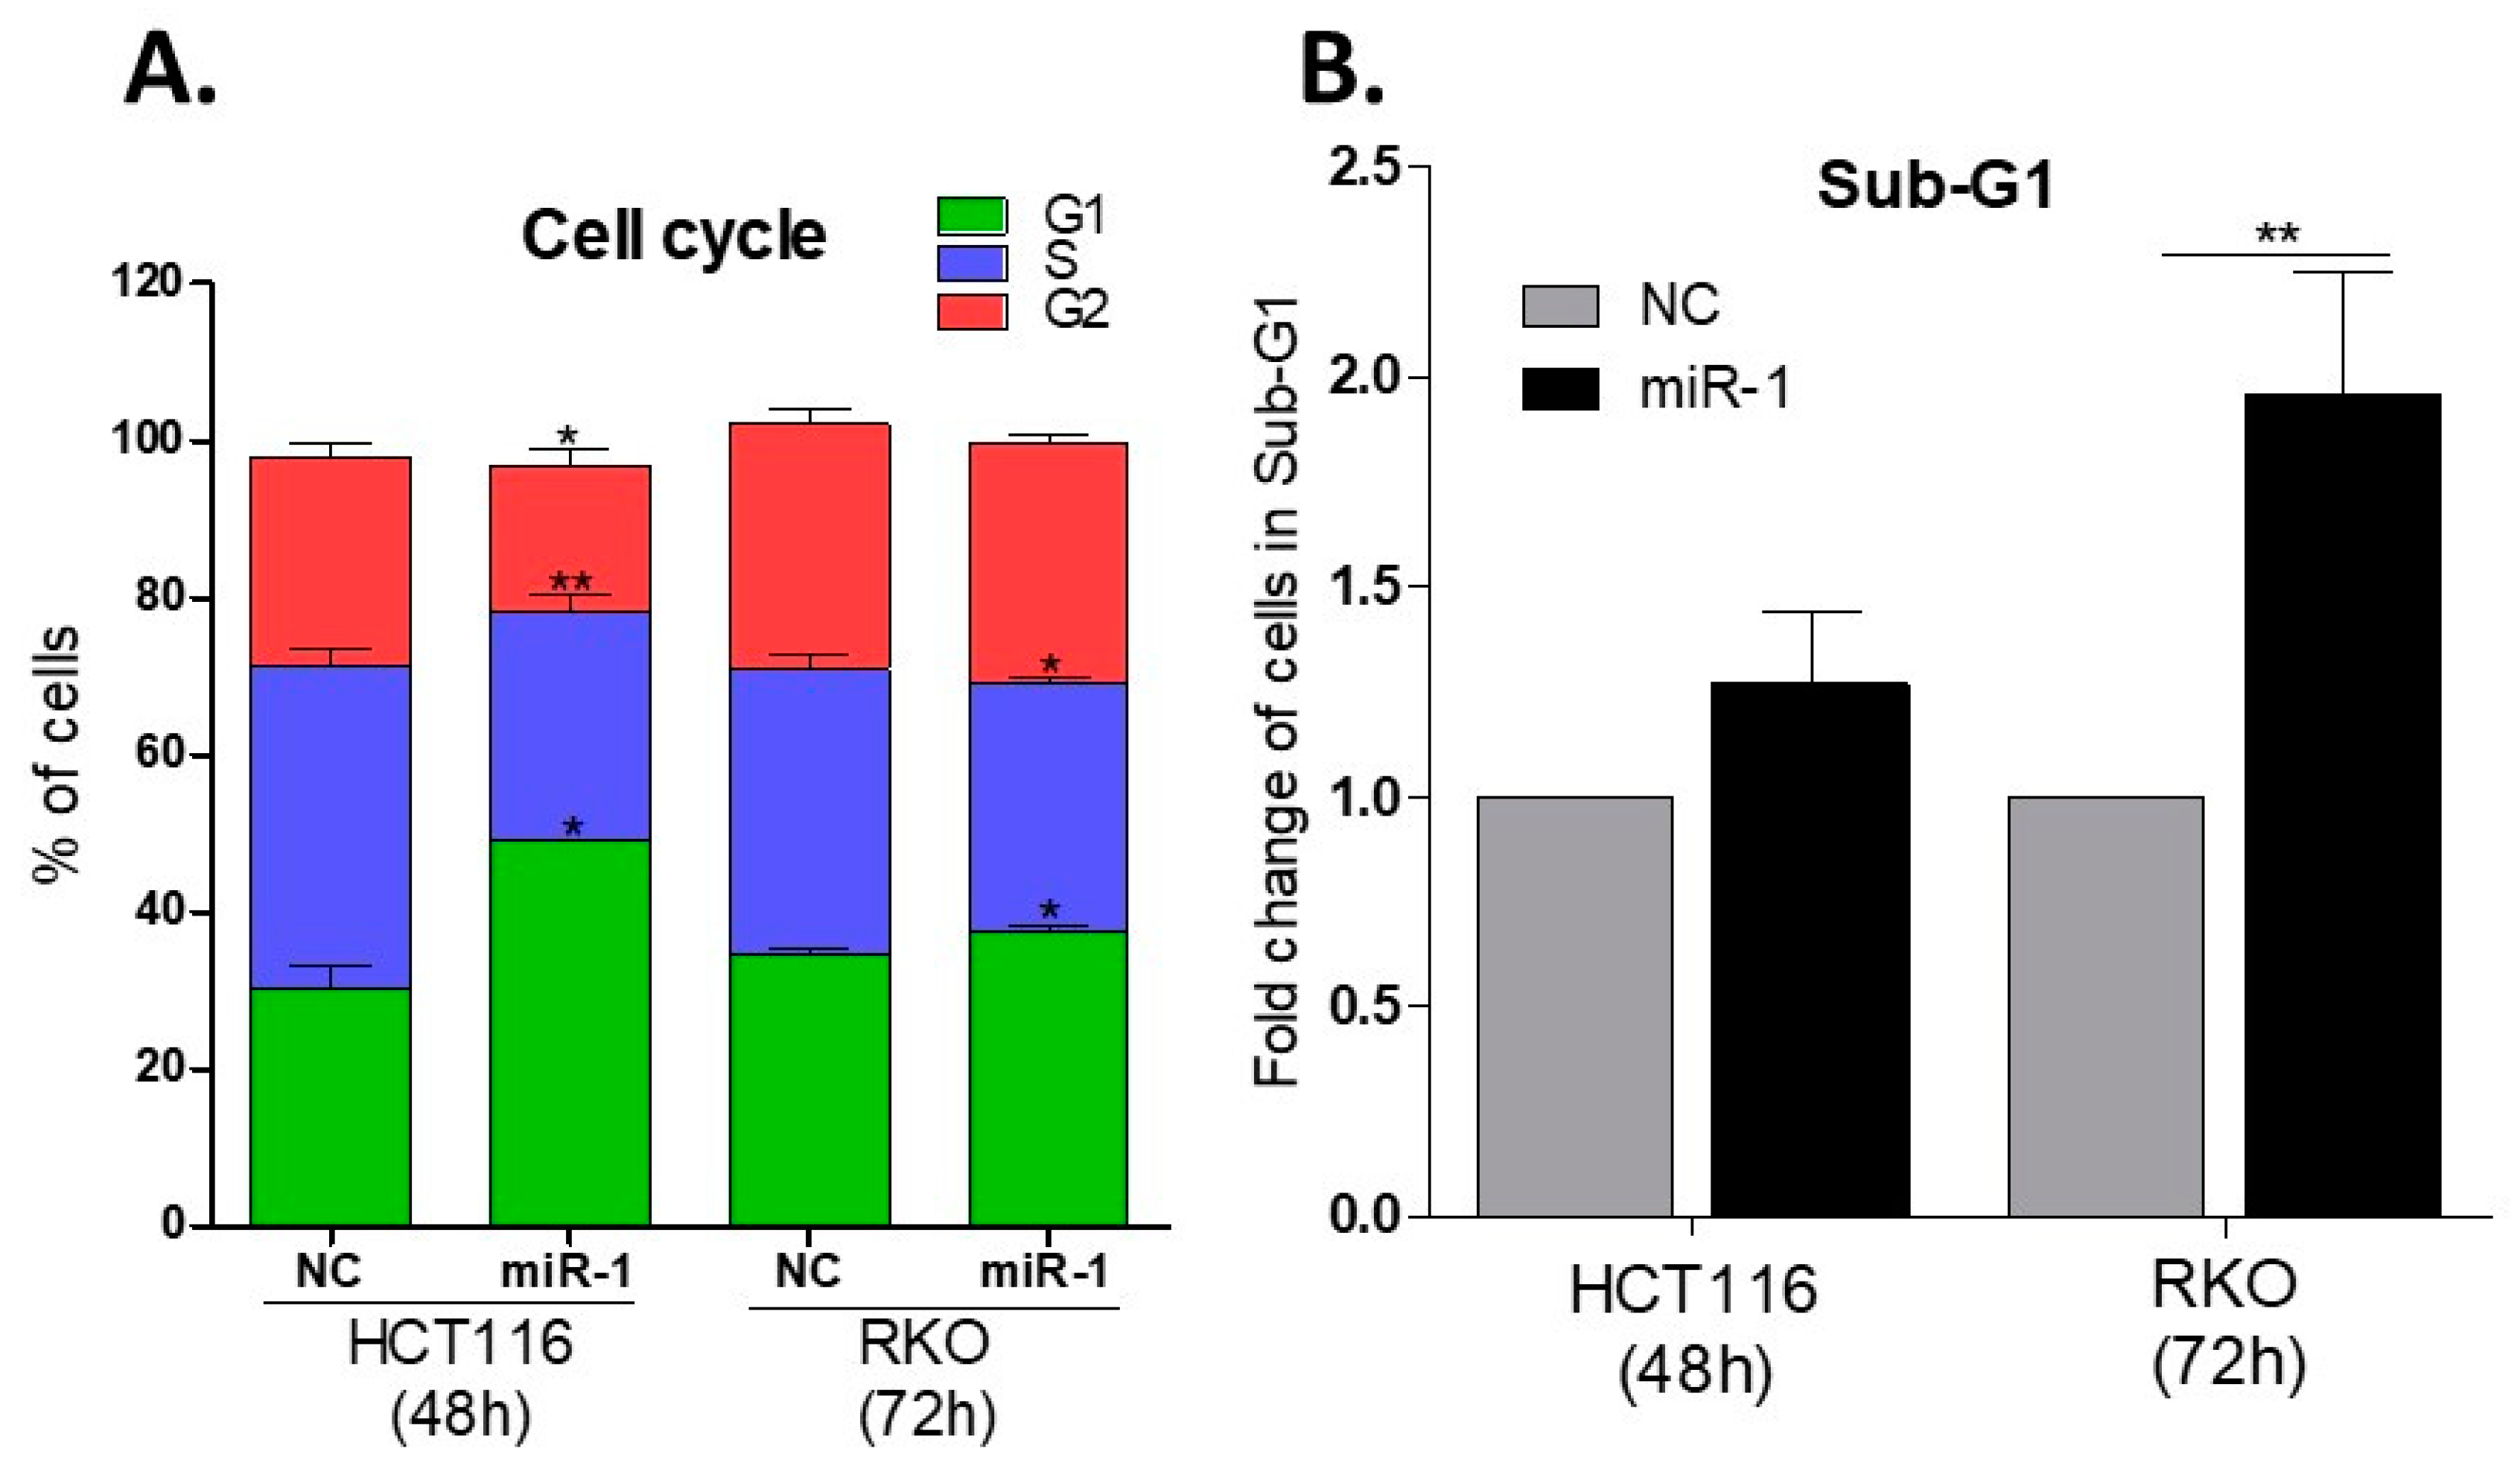
2.8. miR-1 Induces Cell Cycle Arrest in G0/G1
2.9. miR-1 Increases the Number of Cells in Sub-G1
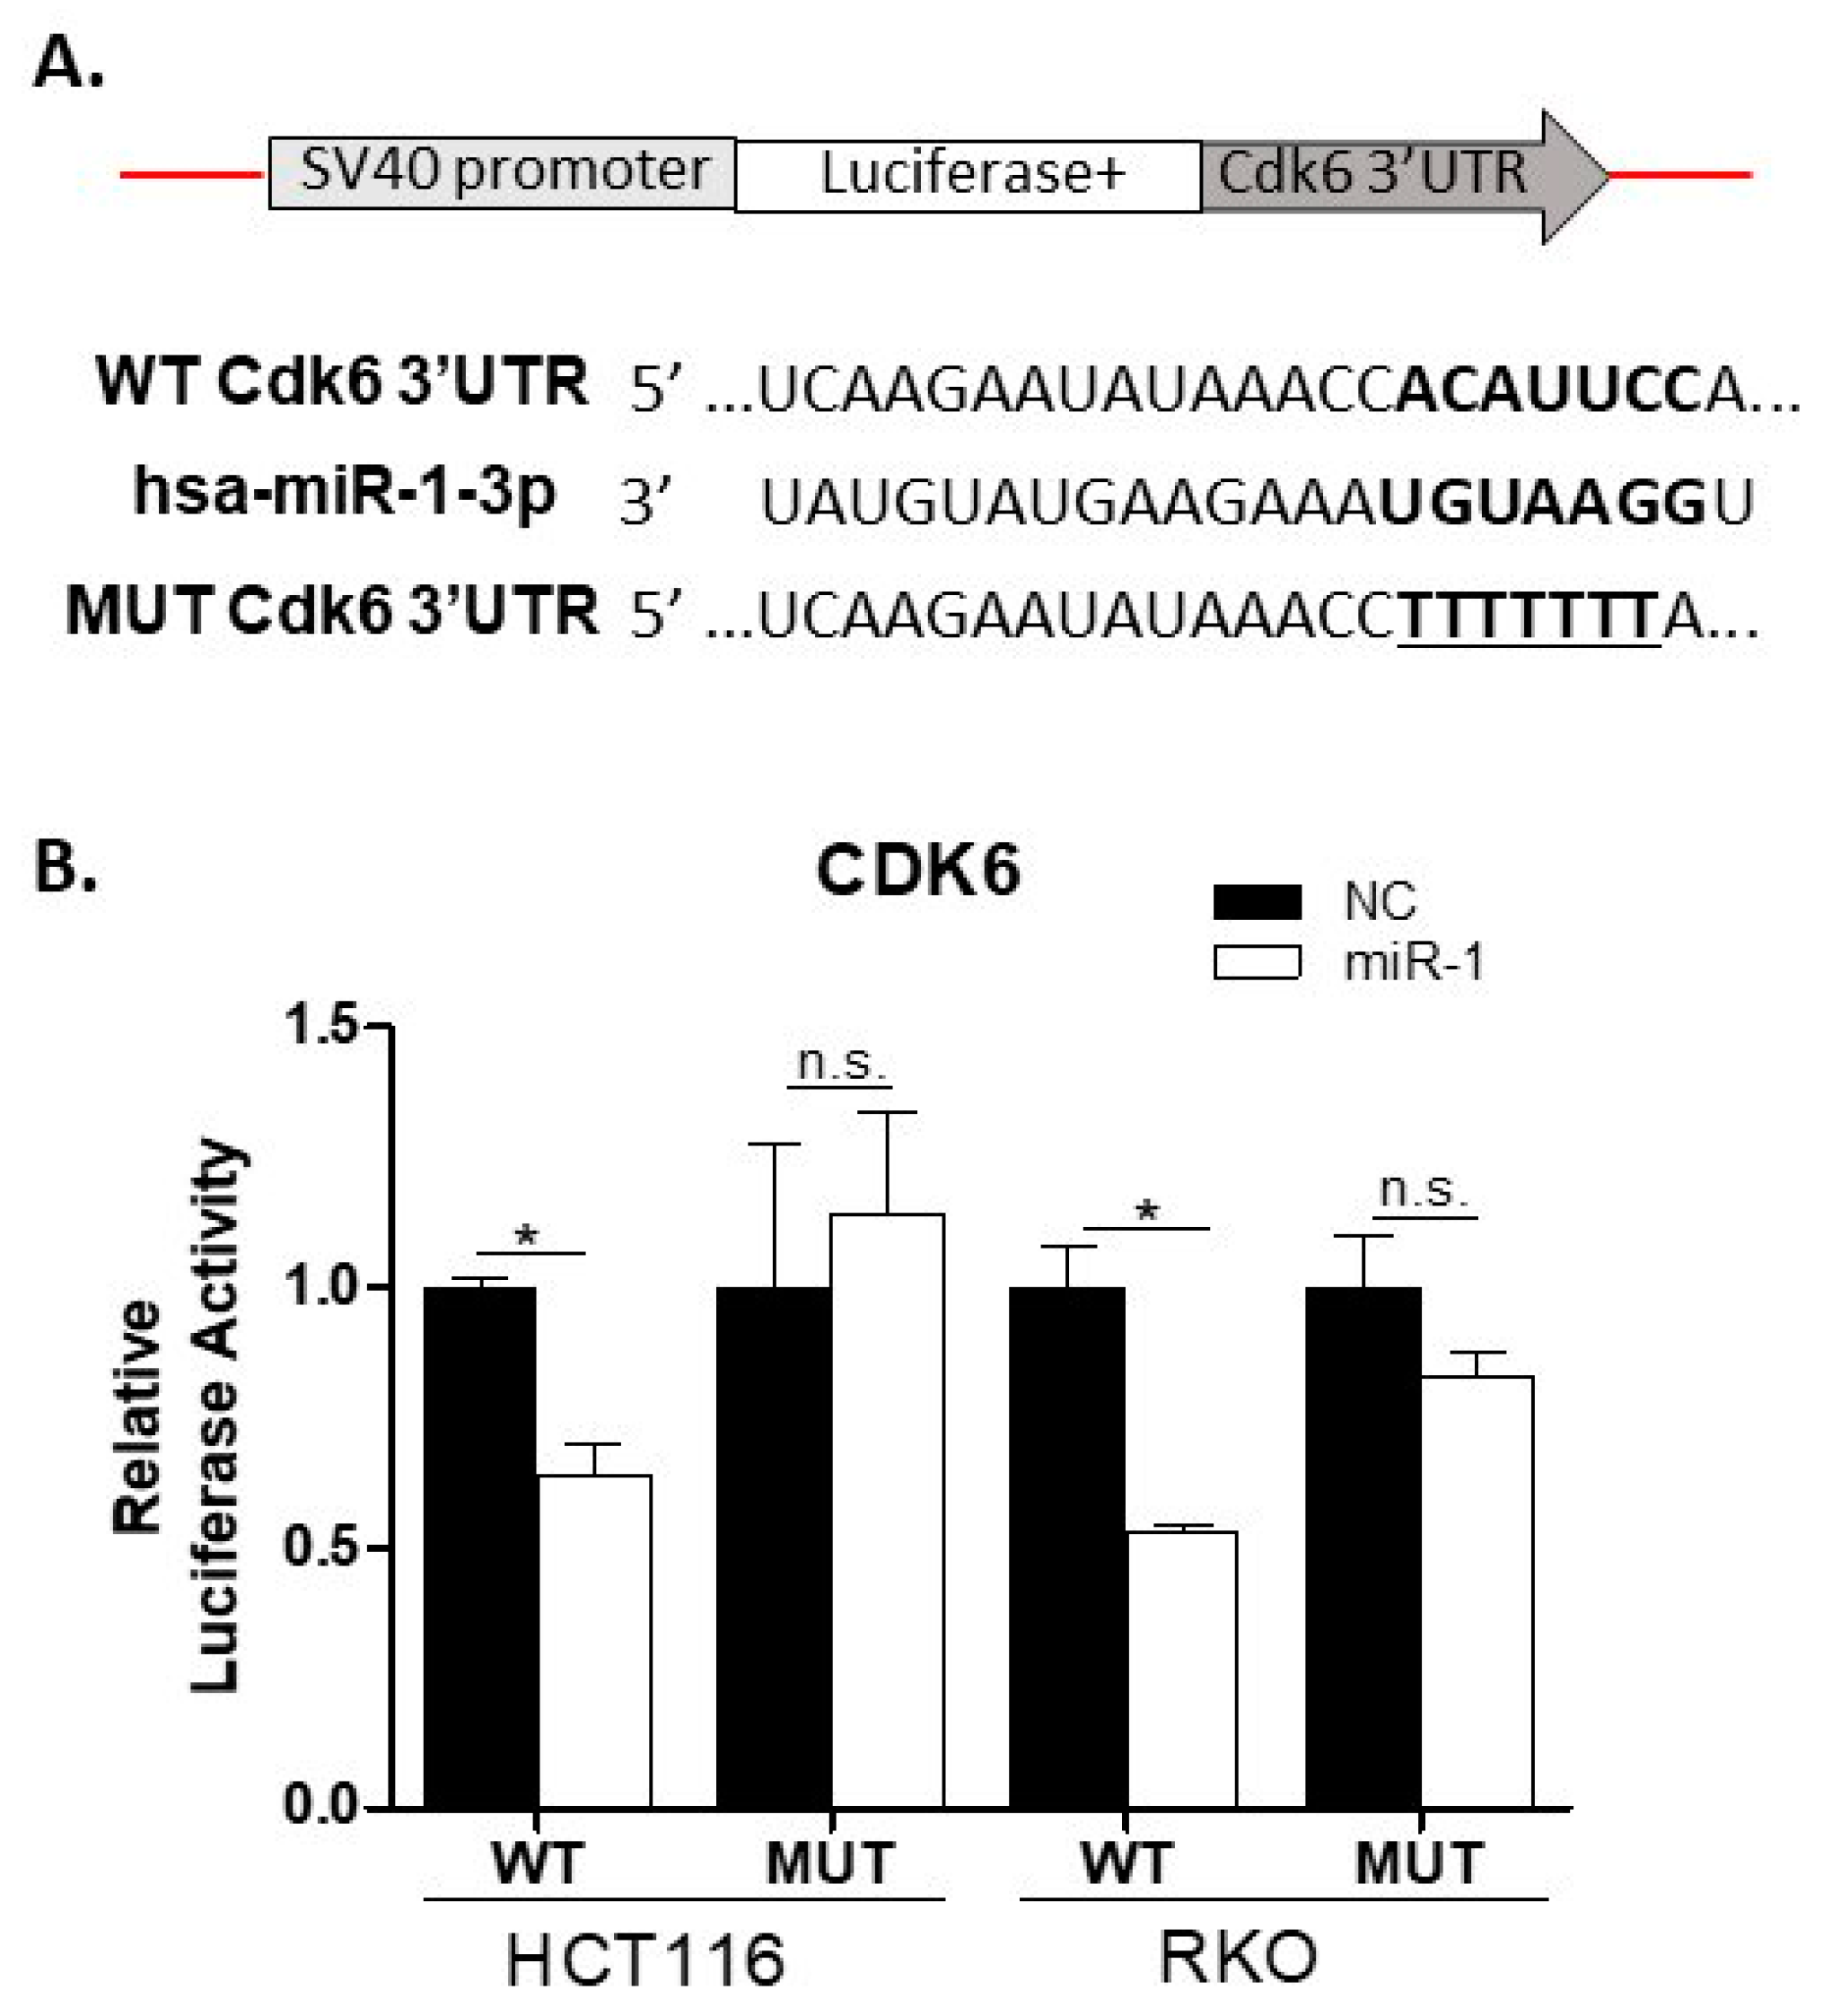
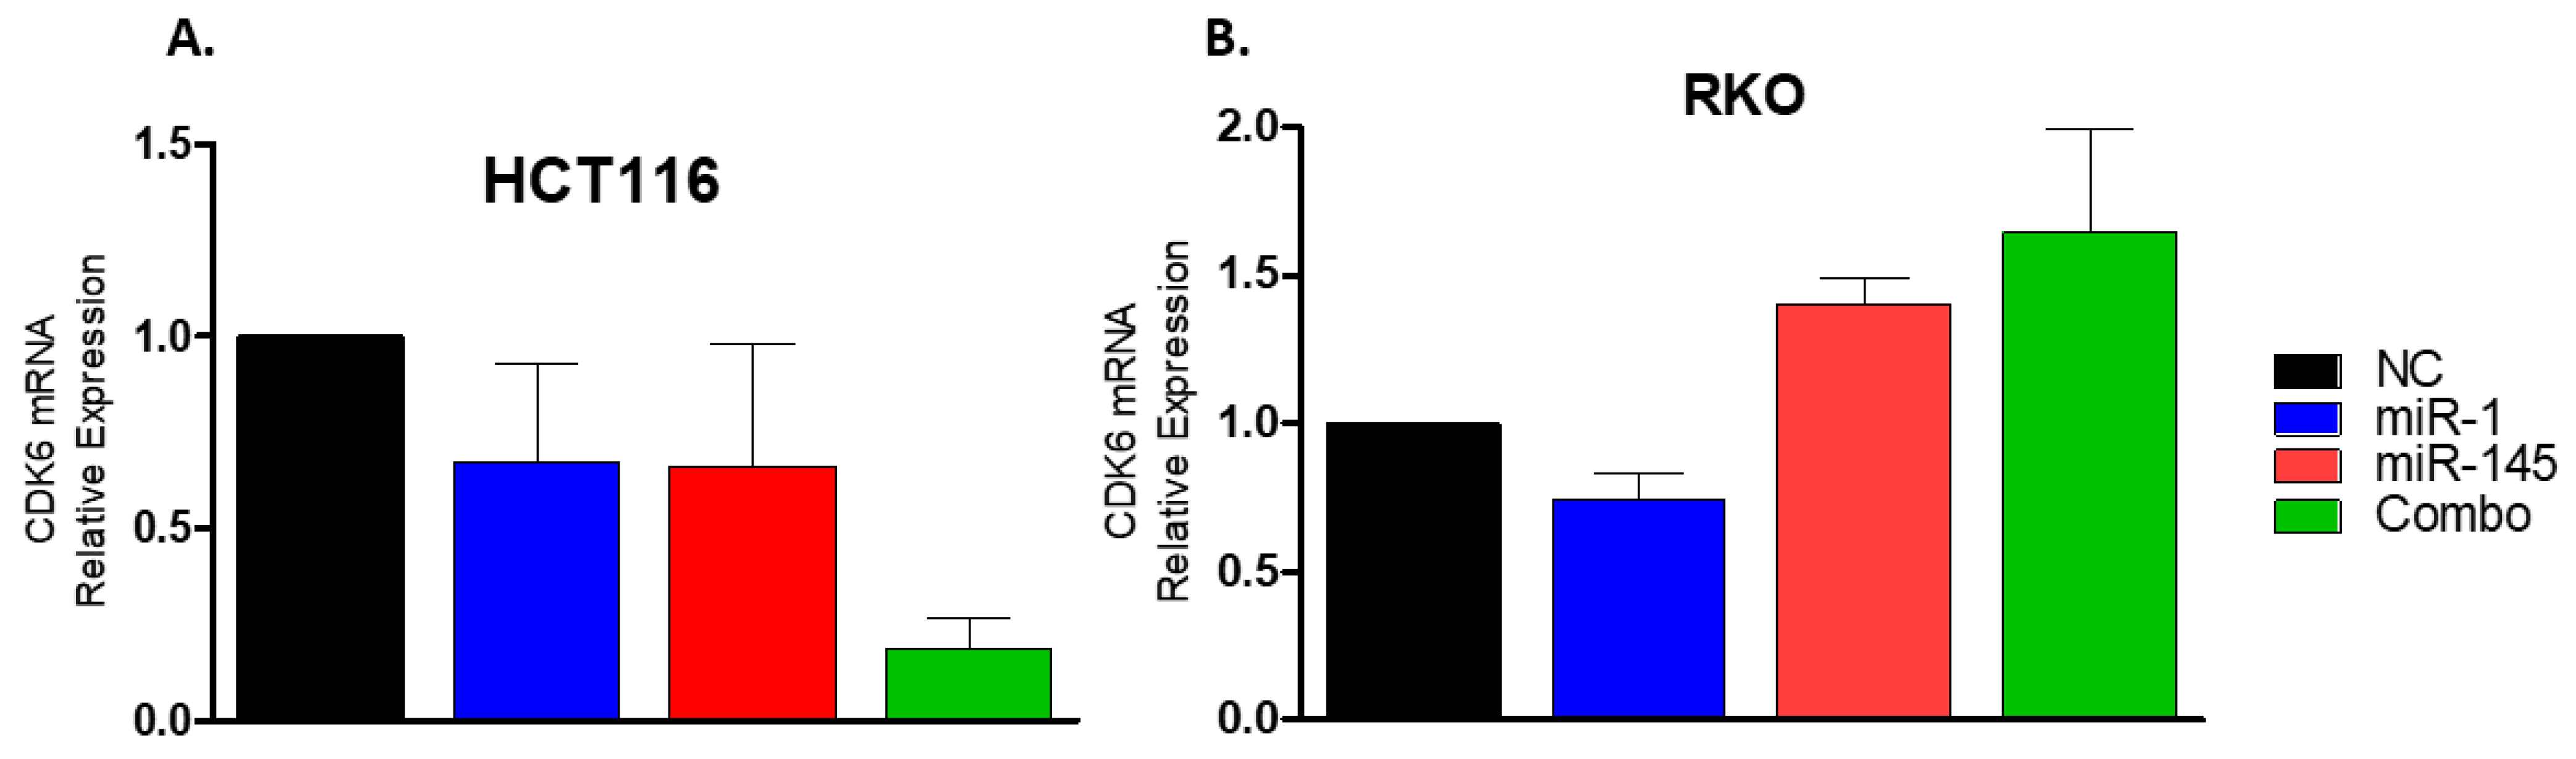
2.10. miR-1 Targets the 3′UTR of Cdk6 in Colon Carcinoma Cells
3. Discussion
4. Materials and Methods
4.1. Experimental Design
4.2. Laser Microdissection and RNA Extraction
4.3. nCounter® Mouse miRNA Expression Panel
4.4. Global Gene Expression Microarray
4.5. Validation of miRNA Signature by RT-qPCR
4.6. Target Prediction and Pathway Enrichment Analysis
4.7. Analysis of Centrality of the miR Signature and Construction of an Interaction Network
4.8. Construction of 3′-UTR Reporter Plasmids and the Cloning Method
4.9. Cotransfection of Plasmid DNA, miRNA Mimics and pRL-TK Vector
4.10. Flow Cytometry Analyses for Apoptosis and Cell Cycle
4.11. Cdk6 Expression in Human Colorectal Cancer Cells by RT-qPCR
4.12. Statistical Analyses
5. Conclusions
Supplementary Materials
Author Contributions
Funding
Institutional Review Board Statement
Informed Consent Statement
Data Availability Statement
Acknowledgments
Conflicts of Interest
References
- Ungaro, R.; Mehandru, S.; Allen, P.B.; Peyrin-Biroulet, L.; Colombel, J.F. Ulcerative colitis. Lancet 2017, 389, 1756–1770. [Google Scholar] [CrossRef]
- Shah, M.S.; Davidson, L.A.; Chapkin, R.S. Mechanistic insights into the role of microRNAs in cancer: Influence of nutrient crosstalk. Front. Genet. 2012, 3, 305. [Google Scholar] [CrossRef]
- Eaden, J.A.; Abrams, K.R.; Mayberry, J.F. The risk of colorectal cancer in ulcerative colitis: A meta-analysis. Gut 2001, 48, 526–535. [Google Scholar] [CrossRef] [PubMed]
- Rutter, M.D.; Saunders, B.P.; Wilkinson, K.H.; Rumbles, S.; Schofield, G.; Kamm, M.A.; Williams, C.B.; Price, A.B.; Talbot, I.C.; Forbes, A. Thirty-year analysis of a colonoscopic surveillance program for neoplasia in ulcerative colitis. Gastroenterology 2006, 130, 1030–1038. [Google Scholar] [CrossRef] [PubMed]
- Pritchard, C.C.; Cheng, H.H.; Tewari, M. MicroRNA profiling: Approaches and considerations. Nat. Rev. Genet. 2012, 13, 358–369. [Google Scholar] [CrossRef] [PubMed]
- Michael, M.Z.; SM, O.C.; van Holst Pellekaan, N.G.; Young, G.P.; James, R.J. Reduced accumulation of specific microRNAs in colorectal neoplasia. Mol. Cancer Res. MCR 2003, 1, 882–891. [Google Scholar] [PubMed]
- Schetter, A.J.; Okayama, H.; Harris, C.C. The role of microRNAs in colorectal cancer. Cancer J. 2012, 18, 244–252. [Google Scholar] [CrossRef] [PubMed]
- Bruewer, M.; Krieglstein, C.F.; Utech, M.; Bode, M.; Rijcken, E.; Anthoni, C.; Laukoetter, M.G.; Schuermann, G.; Senninger, N. Is colonoscopy alone sufficient to screen for ulcerative colitis-associated colorectal carcinoma? World J. Surg. 2003, 27, 611–615. [Google Scholar] [CrossRef] [PubMed]
- Farraye, F.A.; Odze, R.D.; Eaden, J.; Itzkowitz, S.H. AGA technical review on the diagnosis and management of colorectal neoplasia in inflammatory bowel disease. Gastroenterology 2010, 138, 746–774. [Google Scholar] [CrossRef] [PubMed]
- Annese, V.; Beaugerie, L.; Egan, L.; Biancone, L.; Bolling, C.; Brandts, C.; Dierickx, D.; Dummer, R.; Fiorino, G.; Gornet, J.M.; et al. European Evidence-based Consensus: Inflammatory Bowel Disease and Malignancies. J. Crohn’s Colitis 2015, 9, 945–965. [Google Scholar] [CrossRef]
- Laine, L.; Kaltenbach, T.; Barkun, A.; McQuaid, K.R.; Subramanian, V.; Soetikno, R.; Panel, S.G.D. SCENIC international consensus statement on surveillance and management of dysplasia in inflammatory bowel disease. Gastroenterology 2015, 148, 639–651.e28. [Google Scholar] [CrossRef] [PubMed]
- Shah, S.C.; Itzkowitz, S.H. Management of Inflammatory Bowel Disease-Associated Dysplasia in the Modern Era. Gastrointest. Endosc. Clin. N. Am. 2019, 29, 531–548. [Google Scholar] [CrossRef] [PubMed]
- Chang, W.-C.L.; Zenser, T.V.; Cooper, H.S.; Clapper, M.L. Differential response of flat and polypoid colitis-associated colorectal neoplasias to chemopreventive agents and heterocyclic amines. Cancer Lett. 2013, 334, 62–68. [Google Scholar] [CrossRef]
- Almeida, M.I.; Reis, R.M.; Calin, G.A. MicroRNA history: Discovery, recent applications, and next frontiers. Mutat. Res. 2011, 717, 1–8. [Google Scholar] [CrossRef] [PubMed]
- Filipowicz, W.; Bhattacharyya, S.N.; Sonenberg, N. Mechanisms of post-transcriptional regulation by microRNAs: Are the answers in sight? Nat. Rev. Genet. 2008, 9, 102–114. [Google Scholar] [CrossRef] [PubMed]
- Esteller, M. Non-coding RNAs in human disease. Nat. Rev. Genet. 2011, 12, 861–874. [Google Scholar] [CrossRef]
- Cortez, M.A.; Calin, G.A. MicroRNA identification in plasma and serum: A new tool to diagnose and monitor diseases. Expert Opin. Biol. Ther. 2009, 9, 703–711. [Google Scholar] [CrossRef]
- Wang, L.; Zhang, M.; Liu, D.X. Knock-down of ABCE1 gene induces G1/S arrest in human oral cancer cells. Int. J. Clin. Exp. Pathol. 2014, 7, 5495–5504. [Google Scholar]
- Lu, J.; Getz, G.; Miska, E.A.; Alvarez-Saavedra, E.; Lamb, J.; Peck, D.; Sweet-Cordero, A.; Ebert, B.L.; Mak, R.H.; Ferrando, A.A.; et al. MicroRNA expression profiles classify human cancers. Nature 2005, 435, 834–838. [Google Scholar] [CrossRef]
- Calin, G.A.; Croce, C.M. MicroRNA signatures in human cancers. Nat. Rev. Cancer 2006, 6, 857–866. [Google Scholar] [CrossRef]
- Cortez, M.A.; Bueso-Ramos, C.; Ferdin, J.; Lopez-Berestein, G.; Sood, A.K.; Calin, G.A. MicroRNAs in body fluids—The mix of hormones and biomarkers. Nat. Rev. Clin. Oncol. 2011, 8, 467–477. [Google Scholar] [CrossRef] [PubMed]
- Clapper, M.L.; Cooper, H.S.; Chang, W.-C.L. Dextran sulfate sodium-induced colitis-associated neoplasia—A promising model for the development of chemopreventive interventions. Acta Pharmacol. Sin. 2007, 28, 1450–1459. [Google Scholar] [CrossRef] [PubMed]
- Shenoy, A.K.; Fisher, R.C.; Butterworth, E.A.; Pi, L.; Chang, L.J.; Appelman, H.D.; Chang, M.; Scott, E.W.; Huang, E.H. Transition from colitis to cancer: High Wnt activity sustains the tumor-initiating potential of colon cancer stem cell precursors. Cancer Res. 2012, 72, 5091–5100. [Google Scholar] [CrossRef] [PubMed]
- Jung, K.H.; Kim, J.K.; Noh, J.H.; Eun, J.W.; Bae, H.J.; Xie, H.J.; Ahn, Y.M.; Park, W.S.; Lee, J.Y.; Nam, S.W. Targeted disruption of Nemo-like kinase inhibits tumor cell growth by simultaneous suppression of cyclin D1 and CDK2 in human hepatocellular carcinoma. J. Cell. Biochem. 2010, 110, 687–696. [Google Scholar] [CrossRef]
- Fijneman, R.J.; Anderson, R.A.; Richards, E.; Liu, J.; Tijssen, M.; Meijer, G.A.; Anderson, J.; Rod, A.; O’Sullivan, M.G.; Scott, P.M.; et al. Runx1 is a tumor suppressor gene in the mouse gastrointestinal tract. Cancer Sci. 2012, 103, 593–599. [Google Scholar] [CrossRef]
- Bellissimo, D.C.; Chen, C.H.; Zhu, Q.; Bagga, S.; Lee, C.T.; He, B.; Wertheim, G.B.; Jordan, M.; Tan, K.; Worthen, G.S.; et al. Runx1 negatively regulates inflammatory cytokine production by neutrophils in response to Toll-like receptor signaling. Blood Adv. 2020, 4, 1145–1158. [Google Scholar] [CrossRef]
- Huang, B.; Gong, X.; Zhou, H.; Xiong, F.; Wang, S. Depleting ABCE1 expression induces apoptosis and inhibits the ability of proliferation and migration of human esophageal carcinoma cells. Int. J. Clin. Exp. Pathol. 2014, 7, 584–592. [Google Scholar]
- Guan, Y.; Zhang, L.; Li, X.; Zhang, X.; Liu, S.; Gao, N.; Li, L.; Gao, G.; Wei, G.; Chen, Z.; et al. Repression of Mammalian Target of Rapamycin Complex 1 Inhibits Intestinal Regeneration in Acute Inflammatory Bowel Disease Models. J. Immunol. 2015, 195, 339–346. [Google Scholar] [CrossRef]
- Brandt, M.; Grazioso, T.P.; Fawal, M.A.; Tummala, K.S.; Torres-Ruiz, R.; Rodriguez-Perales, S.; Perna, C.; Djouder, N. mTORC1 Inactivation Promotes Colitis-Induced Colorectal Cancer but Protects from APC Loss-Dependent Tumorigenesis. Cell Metab. 2018, 27, 118–135.e8. [Google Scholar] [CrossRef]
- Gutierrez-Martinez, I.Z.; Rubio, J.F.; Piedra-Quintero, Z.L.; Lopez-Mendez, O.; Serrano, C.; Reyes-Maldonado, E.; Salinas-Lara, C.; Betanzos, A.; Shibayama, M.; Silva-Olivares, A.; et al. mTORC1 Prevents Epithelial Damage During Inflammation and Inhibits Colitis-Associated Colorectal Cancer Development. Transl. Oncol. 2019, 12, 24–35. [Google Scholar] [CrossRef]
- Pidikova, P.; Reis, R.; Herichova, I. miRNA Clusters with Down-Regulated Expression in Human Colorectal Cancer and Their Regulation. Int. J. Mol. Sci. 2020, 21, 4633. [Google Scholar] [CrossRef] [PubMed]
- Tigan, A.S.; Bellutti, F.; Kollmann, K.; Tebb, G.; Sexl, V. CDK6-a review of the past and a glimpse into the future: From cell-cycle control to transcriptional regulation. Oncogene 2016, 35, 3083–3091. [Google Scholar] [CrossRef]
- Yaeger, R.; Shah, M.A.; Miller, V.A.; Kelsen, J.R.; Wang, K.; Heins, Z.J.; Ross, J.S.; He, Y.; Sanford, E.; Yantiss, R.K.; et al. Genomic Alterations Observed in Colitis-Associated Cancers Are Distinct From Those Found in Sporadic Colorectal Cancers and Vary by Type of Inflammatory Bowel Disease. Gastroenterology 2016, 151, 278–287.e6. [Google Scholar] [CrossRef] [PubMed]
- Ueda, Y.; Ando, T.; Nanjo, S.; Ushijima, T.; Sugiyama, T. DNA methylation of microRNA-124a is a potential risk marker of colitis-associated cancer in patients with ulcerative colitis. Dig. Dis. Sci. 2014, 59, 2444–2451. [Google Scholar] [CrossRef]
- Chang, W.-C.L.; Coudry, R.A.; Clapper, M.L.; Zhang, X.; Williams, K.-L.; Spittle, C.S.; Li, T.; Cooper, H.S. Loss of p53 enhances the induction of colitis-associated neoplasia by dextran sulfate sodium. Carcinogenesis 2007, 28, 2375–2381. [Google Scholar] [CrossRef] [PubMed]
- Dougherty, U.; Mustafi, R.; Zhu, H.; Zhu, X.; Deb, D.; Meredith, S.C.; Ayaloglu-Butun, F.; Fletcher, M.; Sanchez, A.; Pekow, J.; et al. Upregulation of polycistronic microRNA-143 and microRNA-145 in colonocytes suppresses colitis and inflammation-associated colon cancer. Epigenetics 2021, 16, 1317–1334. [Google Scholar] [CrossRef] [PubMed]
- Song, Y.; Jiang, K.; Wang, B.M.; Liu, W.T.; Lin, R. miR31 promotes tumorigenesis in ulcerative colitisassociated neoplasia via downregulation of SATB2. Mol. Med. Rep. 2020, 22, 4801–4809. [Google Scholar] [CrossRef] [PubMed]
- Liu, Z.; Bai, J.; Zhang, L.; Lou, F.; Ke, F.; Cai, W.; Wang, H. Conditional knockout of microRNA-31 promotes the development of colitis associated cancer. Biochem. Biophys. Res. Commun. 2017, 490, 62–68. [Google Scholar] [CrossRef] [PubMed]
- Mouradov, D.; Sloggett, C.; Jorissen, R.N.; Love, C.G.; Li, S.; Burgess, A.W.; Arango, D.; Strausberg, R.L.; Buchanan, D.; Wormald, S.; et al. Colorectal cancer cell lines are representative models of the main molecular subtypes of primary cancer. Cancer Res. 2014, 74, 3238–3247. [Google Scholar] [CrossRef]
- Ahmed, D.; Eide, P.W.; Eilertsen, I.A.; Danielsen, S.A.; Eknaes, M.; Hektoen, M.; Lind, G.E.; Lothe, R.A. Epigenetic and genetic features of 24 colon cancer cell lines. Oncogenesis 2013, 2, e71. [Google Scholar] [CrossRef] [PubMed]
- Berg, K.C.G.; Eide, P.W.; Eilertsen, I.A.; Johannessen, B.; Bruun, J.; Danielsen, S.A.; Bjornslett, M.; Meza-Zepeda, L.A.; Eknaes, M.; Lind, G.E.; et al. Multi-omics of 34 colorectal cancer cell lines—A resource for biomedical studies. Mol. Cancer 2017, 16, 116. [Google Scholar] [CrossRef]
- Dumont, P.; Leu, J.I.; Della Pietra, A.C., 3rd; George, D.L.; Murphy, M. The codon 72 polymorphic variants of p53 have markedly different apoptotic potential. Nat. Genet. 2003, 33, 357–365. [Google Scholar] [CrossRef] [PubMed]
- Vietri, M.T.; Riegler, G.; Ursillo, A.; Caserta, L.; Cioffi, M.; Molinari, A.M. p53 codon 72 polymorphism in patients affected with ulcerative colitis. J. Gastroenterol. 2007, 42, 456–460. [Google Scholar] [CrossRef] [PubMed]
- Wang, J.Y.; Huang, J.C.; Chen, G.; Wei, D.M. Expression level and potential target pathways of miR-1-3p in colorectal carcinoma based on 645 cases from 9 microarray datasets. Mol. Med. Rep. 2018, 17, 5013–5020. [Google Scholar] [PubMed]
- Wu, Y.; Pu, N.; Su, W.; Yang, X.; Xing, C. Downregulation of miR-1 in colorectal cancer promotes radioresistance and aggressive phenotypes. J. Cancer 2020, 11, 4832–4840. [Google Scholar] [CrossRef]
- Zhu, D.; Sun, Y.; Zhang, D.; Dong, M.; Jiang, G.; Zhang, X.; Zhou, J. miR1 inhibits the progression of colon cancer by regulating the expression of vascular endothelial growth factor. Oncol. Rep. 2018, 40, 589–598. [Google Scholar] [PubMed]
- Xu, Y.; Zheng, M.; Merritt, R.E.; Shrager, J.B.; Wakelee, H.A.; Kratzke, R.A.; Hoang, C.D. miR-1 induces growth arrest and apoptosis in malignant mesothelioma. Chest 2013, 144, 1632–1643. [Google Scholar] [CrossRef]
- Riccardi, C.; Nicoletti, I. Analysis of apoptosis by propidium iodide staining and flow cytometry. Nat. Protoc. 2006, 1, 1458–1461. [Google Scholar] [CrossRef]
- Telford, W.G.; Komoriya, A.; Packard, B.Z. Detection of localized caspase activity in early apoptotic cells by laser scanning cytometry. Cytometry 2002, 47, 81–88. [Google Scholar] [CrossRef]
- Xiong, Y.; Wang, J.; Chu, H.; Chen, D.; Guo, H. Salvianolic Acid B Restored Impaired Barrier Function via Downregulation of MLCK by microRNA-1 in Rat Colitis Model. Front. Pharmacol. 2016, 7, 134. [Google Scholar] [CrossRef] [PubMed]
- Nebenfuehr, S.; Kollmann, K.; Sexl, V. The role of CDK6 in cancer. Int. J. Cancer 2020, 147, 2988–2995. [Google Scholar] [CrossRef]
- Schmitz, M.L.; Kracht, M. Cyclin-Dependent Kinases as Coregulators of Inflammatory Gene Expression. Trends Pharmacol. Sci. 2016, 37, 101–113. [Google Scholar] [CrossRef] [PubMed]
- Handschick, K.; Beuerlein, K.; Jurida, L.; Bartkuhn, M.; Muller, H.; Soelch, J.; Weber, A.; Dittrich-Breiholz, O.; Schneider, H.; Scharfe, M.; et al. Cyclin-dependent kinase 6 is a chromatin-bound cofactor for NF-kappaB-dependent gene expression. Mol. Cell 2014, 53, 193–208. [Google Scholar] [CrossRef] [PubMed]
- Otto, T.; Sicinski, P. Cell cycle proteins as promising targets in cancer therapy. Nat. Rev. Cancer 2017, 17, 93–115. [Google Scholar] [CrossRef] [PubMed]
- Zhu, W.; Zhao, Y.; Xu, Y.; Sun, Y.; Wang, Z.; Yuan, W.; Du, Z. Dissection of protein interactomics highlights microRNA synergy. PLoS ONE 2013, 8, e63342. [Google Scholar] [CrossRef]
- Chen, X.; Zhao, W.; Yuan, Y.; Bai, Y.; Sun, Y.; Zhu, W.; Du, Z. MicroRNAs tend to synergistically control expression of genes encoding extensively-expressed proteins in humans. PeerJ 2017, 5, e3682. [Google Scholar] [CrossRef]
- Arvey, A.; Larsson, E.; Sander, C.; Leslie, C.S.; Marks, D.S. Target mRNA abundance dilutes microRNA and siRNA activity. Mol. Syst. Biol. 2010, 6, 363. [Google Scholar] [CrossRef]
- Ritchie, M.E.; Phipson, B.; Wu, D.; Hu, Y.; Law, C.W.; Shi, W.; Smyth, G.K. limma powers differential expression analyses for RNA-sequencing and microarray studies. Nucleic Acids Res. 2015, 43, e47. [Google Scholar] [CrossRef]
- Benjamini, Y.; Hochberg, Y. Controlling the false discovery rate: A practical and powerful approach to multiple testing. J. R. Stat. Soc. 1995, 57, 289–300. [Google Scholar] [CrossRef]
- Kuleshov, M.V.; Jones, M.R.; Rouillard, A.D.; Fernandez, N.F.; Duan, Q.; Wang, Z.; Koplev, S.; Jenkins, S.L.; Jagodnik, K.M.; Lachmann, A.; et al. Enrichr: A comprehensive gene set enrichment analysis web server 2016 update. Nucleic Acids Res. 2016, 44, W90–W97. [Google Scholar] [CrossRef]
- da Silveira, W.A.; Renaud, L.; Simpson, J.; Glen, W.B., Jr.; Hazard, E.S.; Chung, D.; Hardiman, G. miRmapper: A Tool for Interpretation of miRNA(-)mRNA Interaction Networks. Genes 2018, 9, 458. [Google Scholar] [CrossRef] [PubMed]
- Franceschini, A.; Szklarczyk, D.; Frankild, S.; Kuhn, M.; Simonovic, M.; Roth, A.; Lin, J.; Minguez, P.; Bork, P.; von Mering, C.; et al. STRING v9.1: Protein-protein interaction networks, with increased coverage and integration. Nucleic Acids Res. 2013, 41, D808–D815. [Google Scholar] [CrossRef]
- Jin, Y.; Chen, Z.; Liu, X.; Zhou, X. Evaluating the microRNA targeting sites by luciferase reporter gene assay. Methods Mol. Biol. 2013, 936, 117–127. [Google Scholar] [PubMed]
- Bazzocco, S.; Dopeso, H.; Carton-Garcia, F.; Macaya, I.; Andretta, E.; Chionh, F.; Rodrigues, P.; Garrido, M.; Alazzouzi, H.; Nieto, R.; et al. Highly Expressed Genes in Rapidly Proliferating Tumor Cells as New Targets for Colorectal Cancer Treatment. Clin. Cancer Res. 2015, 21, 3695–3704. [Google Scholar] [CrossRef] [PubMed]
- Schmittgen, T.D.; Livak, K.J. Analyzing real-time PCR data by the comparative C(T) method. Nat. Protoc. 2008, 3, 1101–1108. [Google Scholar] [CrossRef]


Publisher’s Note: MDPI stays neutral with regard to jurisdictional claims in published maps and institutional affiliations. |
© 2022 by the authors. Licensee MDPI, Basel, Switzerland. This article is an open access article distributed under the terms and conditions of the Creative Commons Attribution (CC BY) license (https://creativecommons.org/licenses/by/4.0/).
Share and Cite
Fragoso, M.F.; Fernandez, G.J.; Vanderveer, L.; Cooper, H.S.; Slifker, M.; Clapper, M.L. Dysregulation of miR-1-3p: An Early Event in Colitis-Associated Dysplasia. Int. J. Mol. Sci. 2022, 23, 13024. https://doi.org/10.3390/ijms232113024
Fragoso MF, Fernandez GJ, Vanderveer L, Cooper HS, Slifker M, Clapper ML. Dysregulation of miR-1-3p: An Early Event in Colitis-Associated Dysplasia. International Journal of Molecular Sciences. 2022; 23(21):13024. https://doi.org/10.3390/ijms232113024
Chicago/Turabian StyleFragoso, Mariana F., Geysson J. Fernandez, Lisa Vanderveer, Harry S. Cooper, Michael Slifker, and Margie L. Clapper. 2022. "Dysregulation of miR-1-3p: An Early Event in Colitis-Associated Dysplasia" International Journal of Molecular Sciences 23, no. 21: 13024. https://doi.org/10.3390/ijms232113024
APA StyleFragoso, M. F., Fernandez, G. J., Vanderveer, L., Cooper, H. S., Slifker, M., & Clapper, M. L. (2022). Dysregulation of miR-1-3p: An Early Event in Colitis-Associated Dysplasia. International Journal of Molecular Sciences, 23(21), 13024. https://doi.org/10.3390/ijms232113024