

Changes in Polychlorinated Biphenyl Residues in Milk during Lactation: Levels of Contamination, Influencing Factors, and Infant Risk Assessment

 , and
, and
Abstract
1. Introduction
2. Results
2.1. Characteristics of Study Participants and Their Diets during Pregnancy
2.2. Composition of Human Milk during Lactation
2.3. Changes in PCB Contents in Human Milk throughout the Duration of Lactation
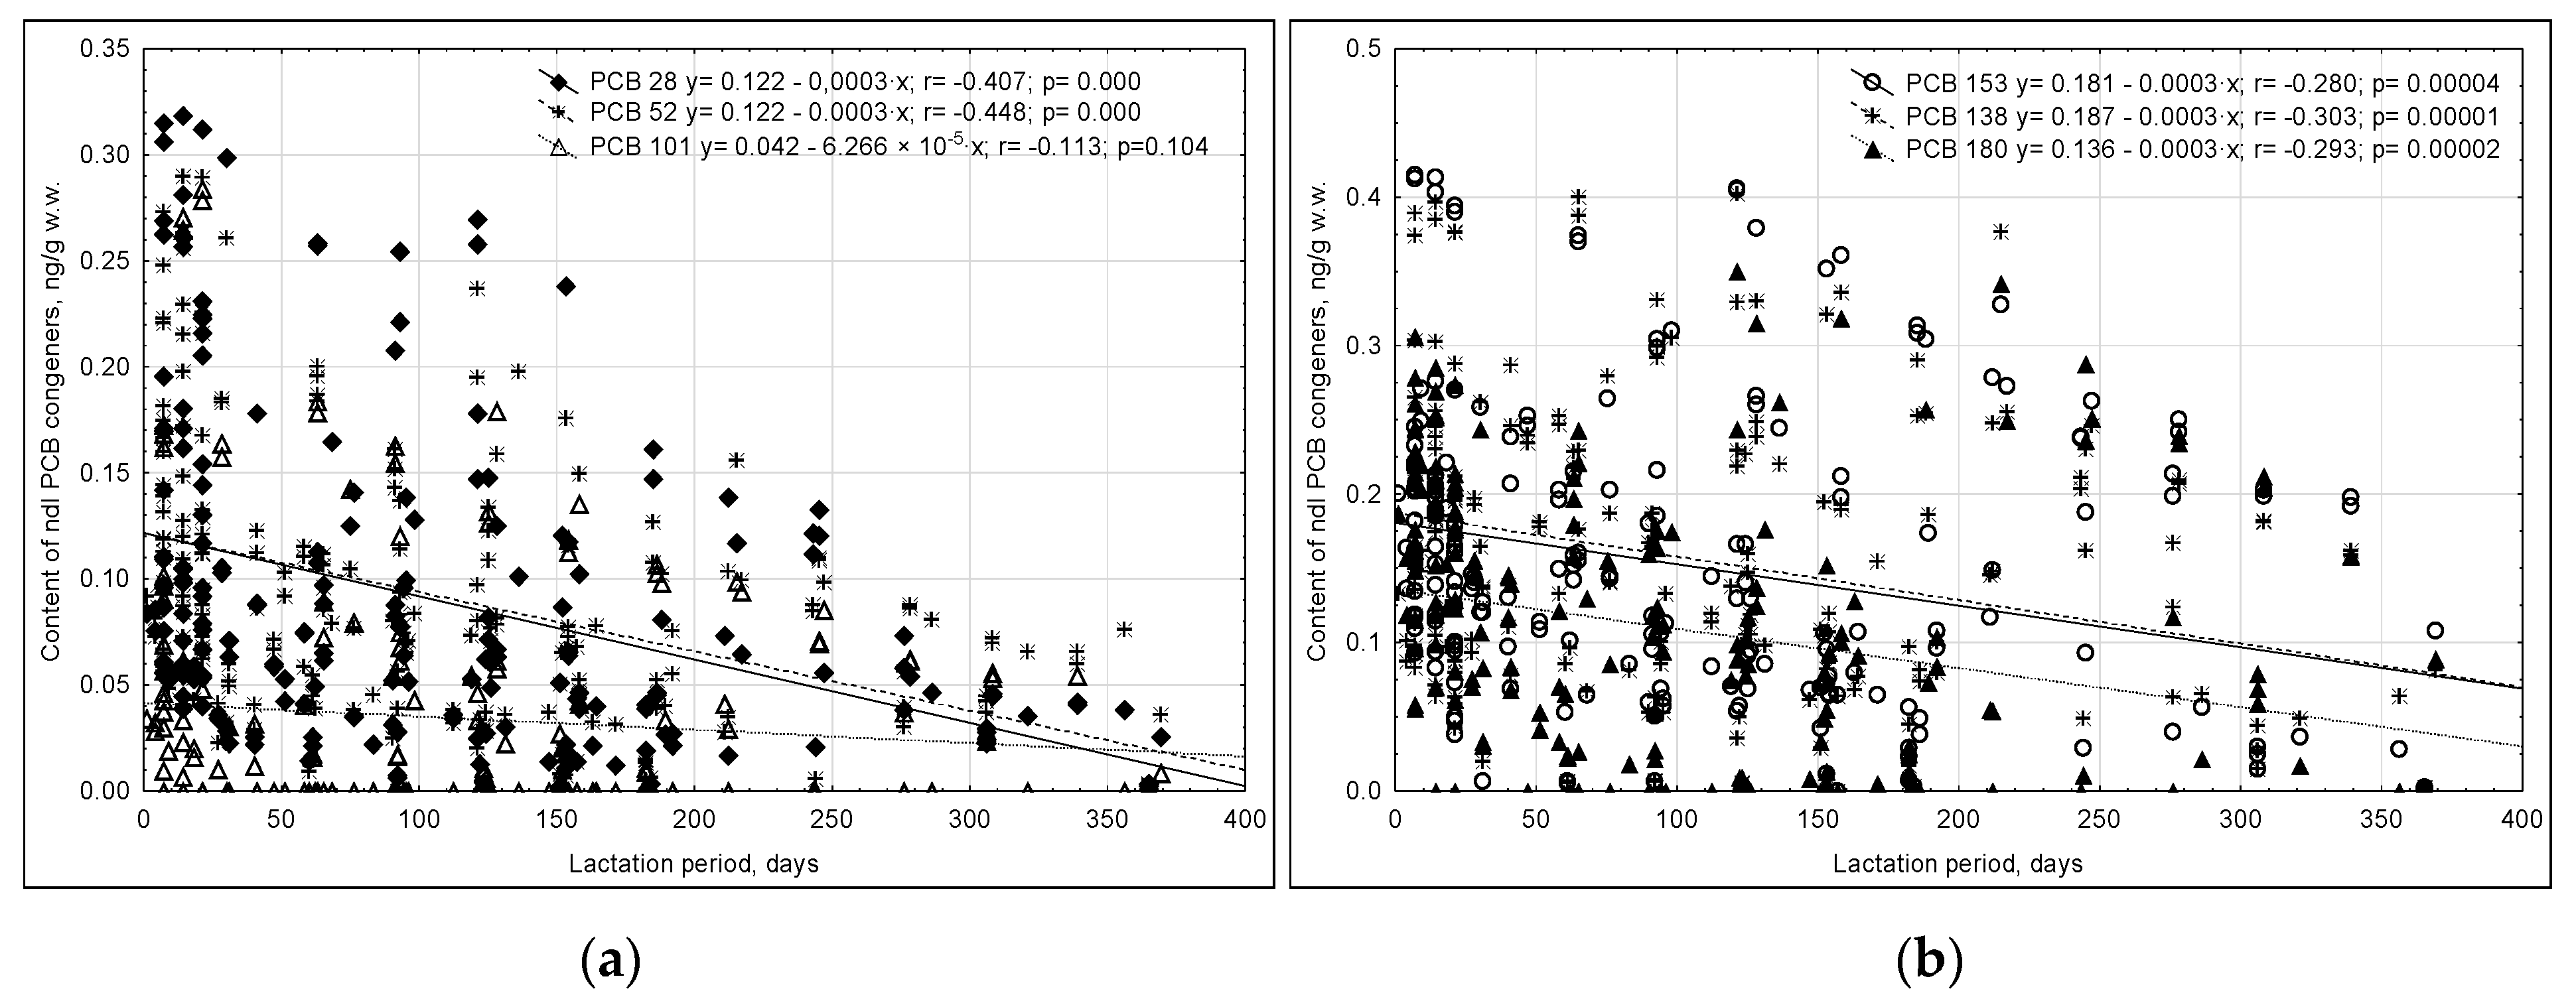
2.3.1. ndl-PCBs
2.3.2. dl-PCBs
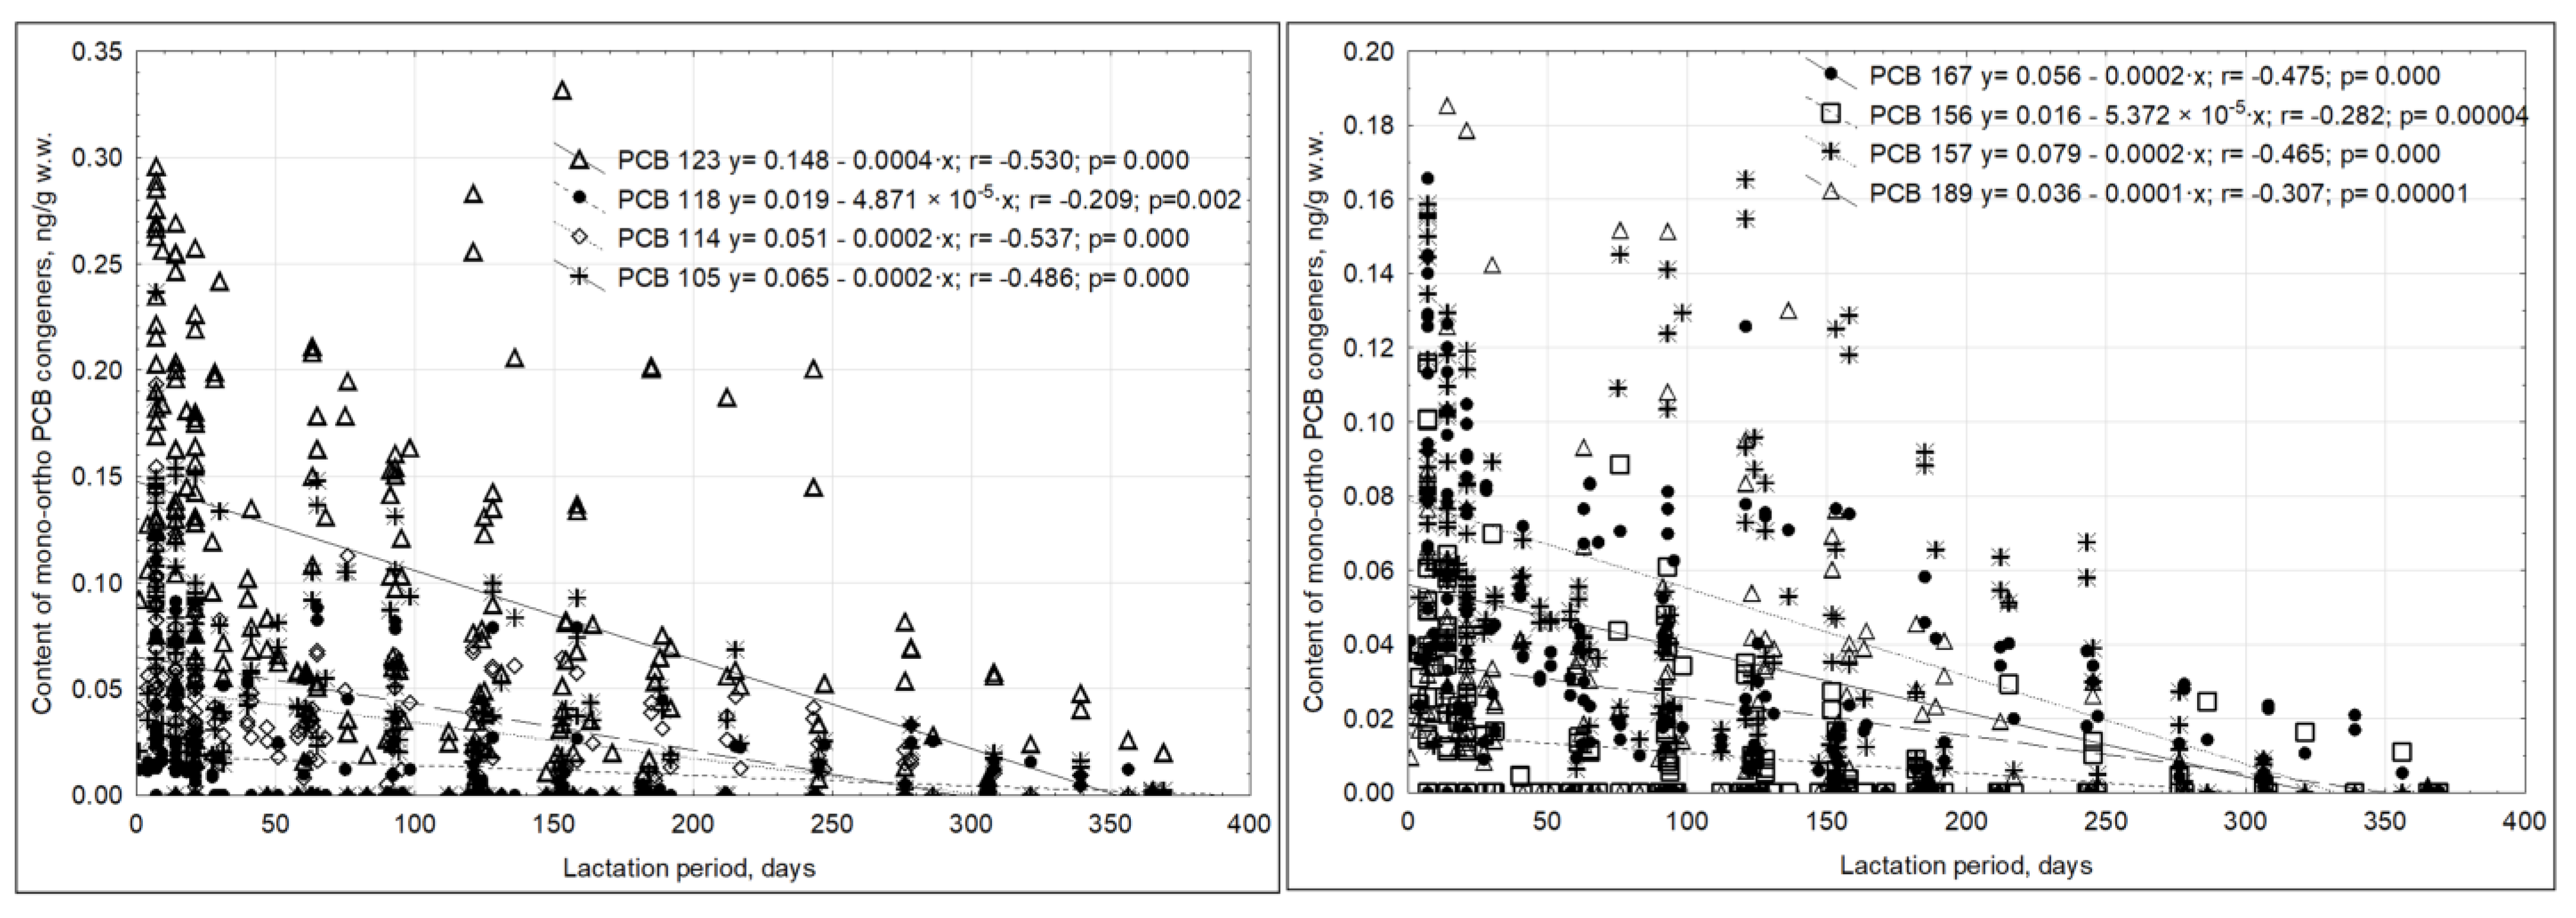
- non-ortho PCBs
- mono-ortho PCBs
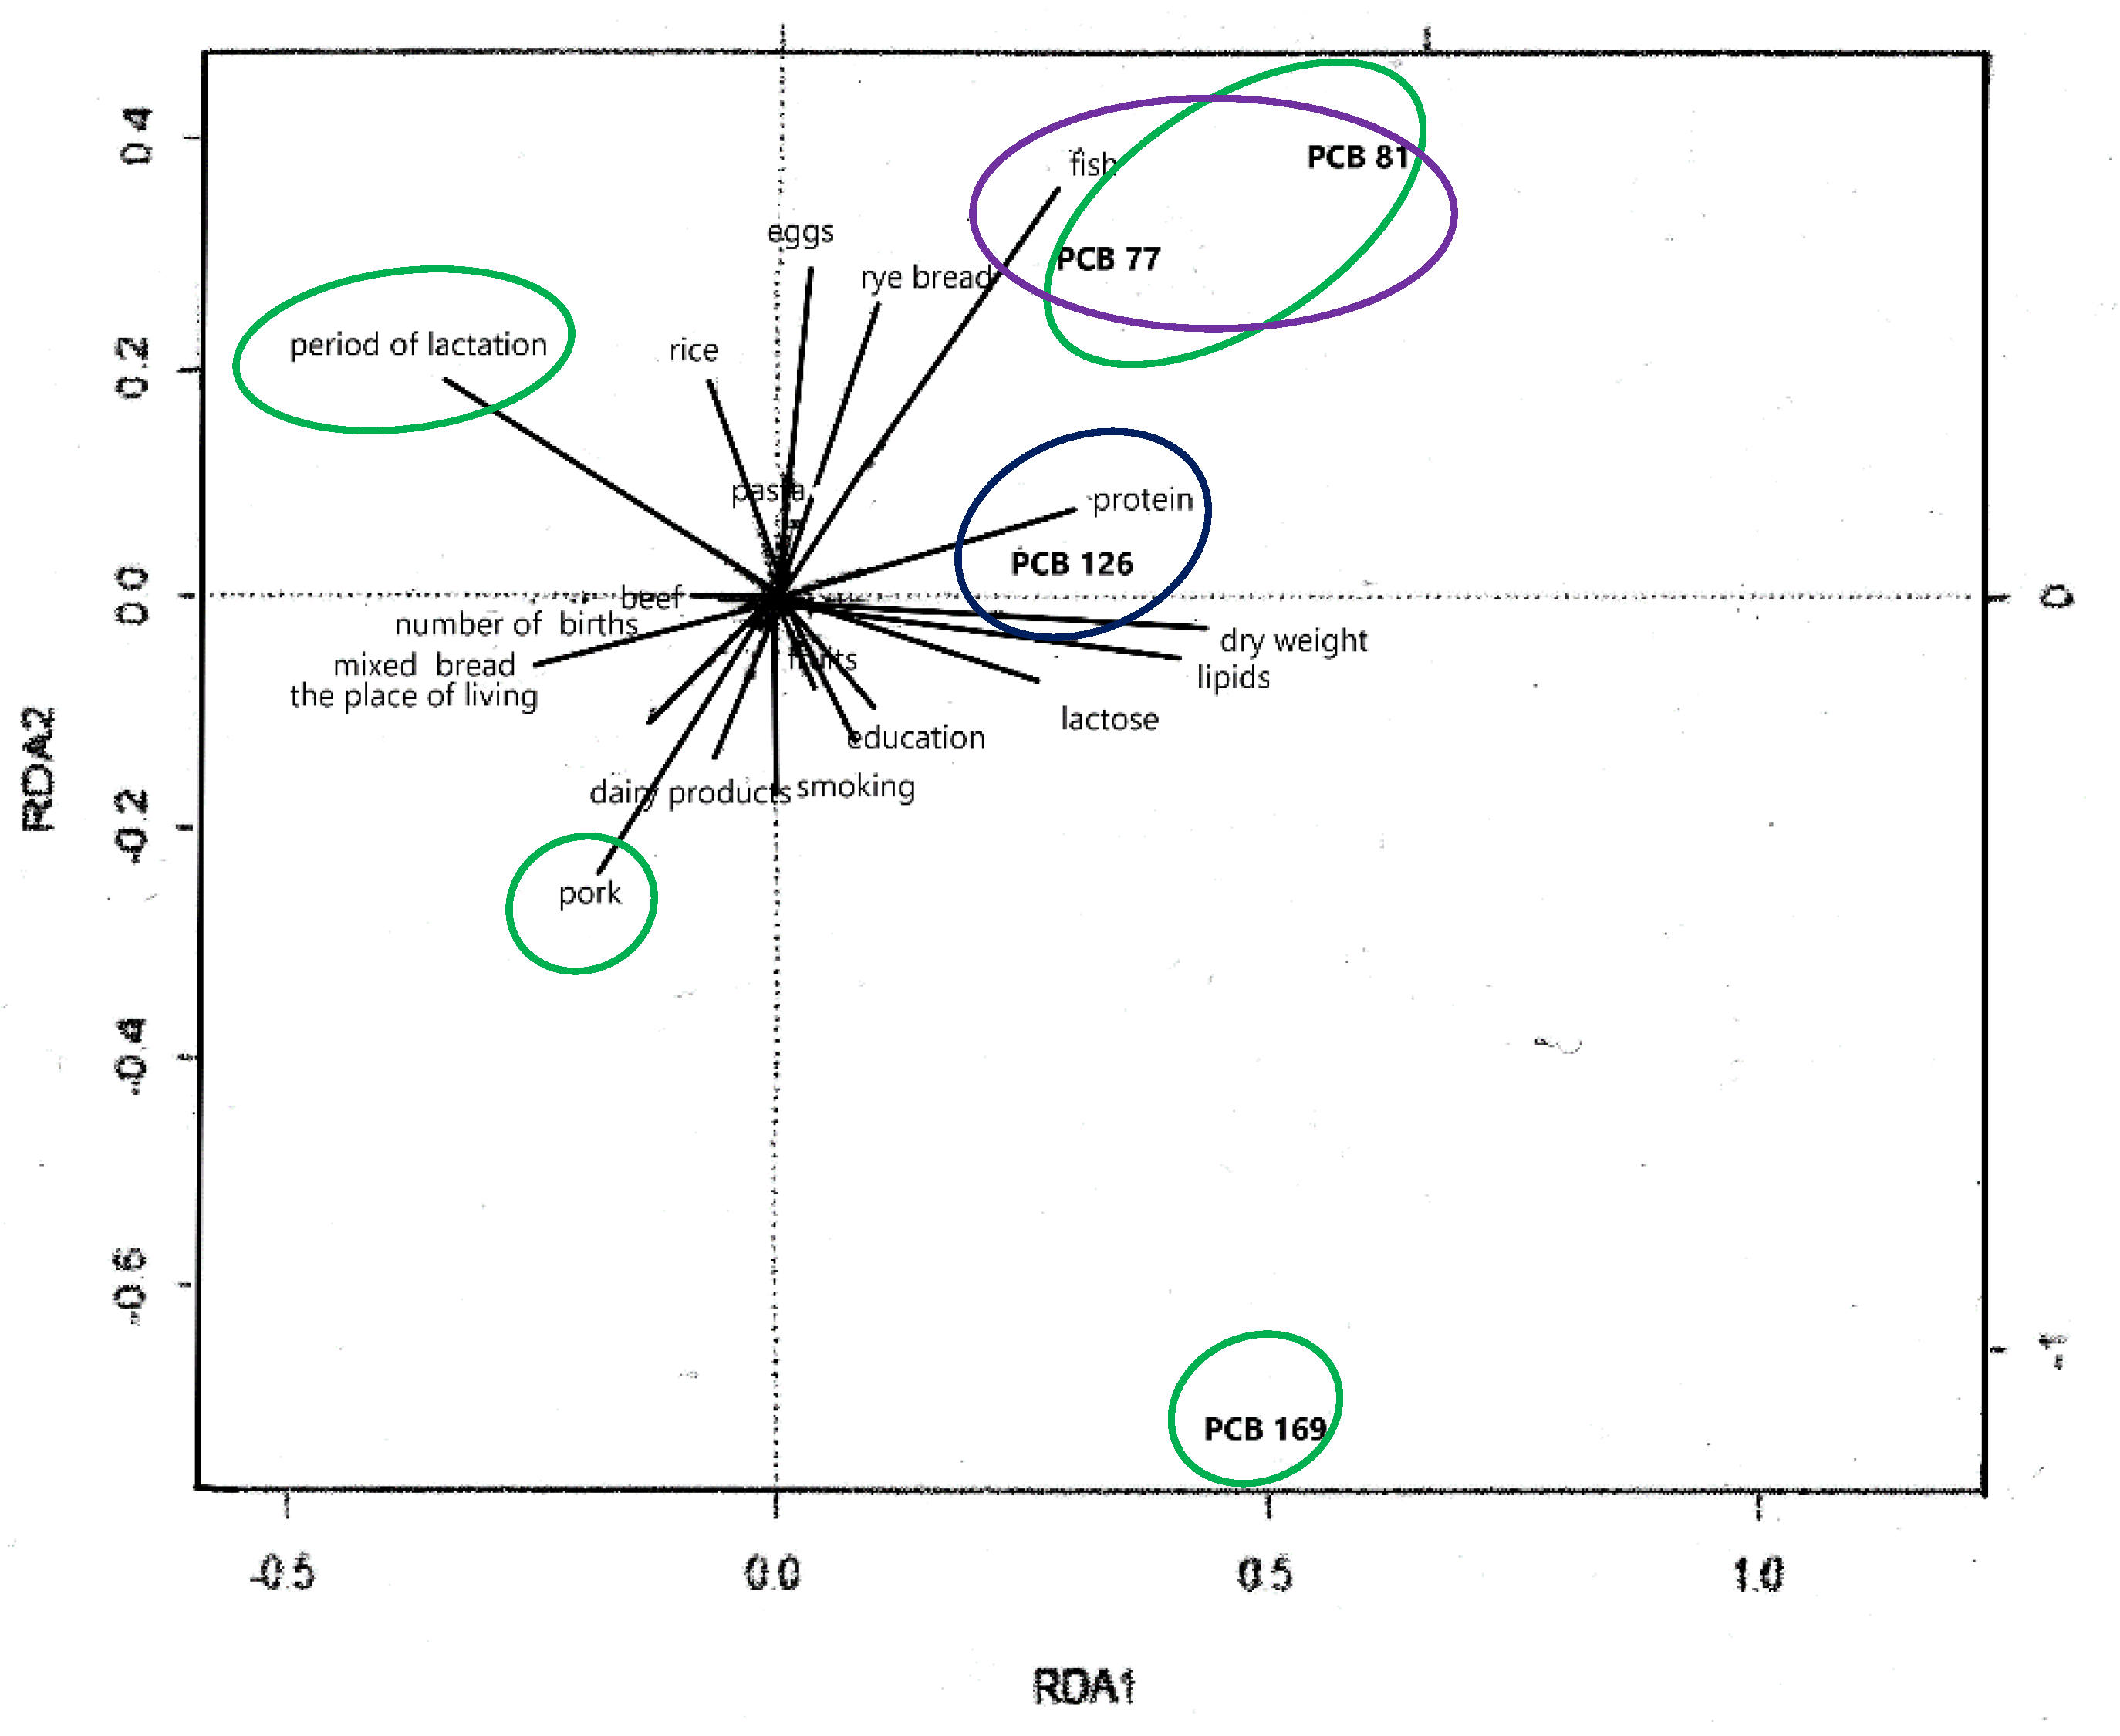
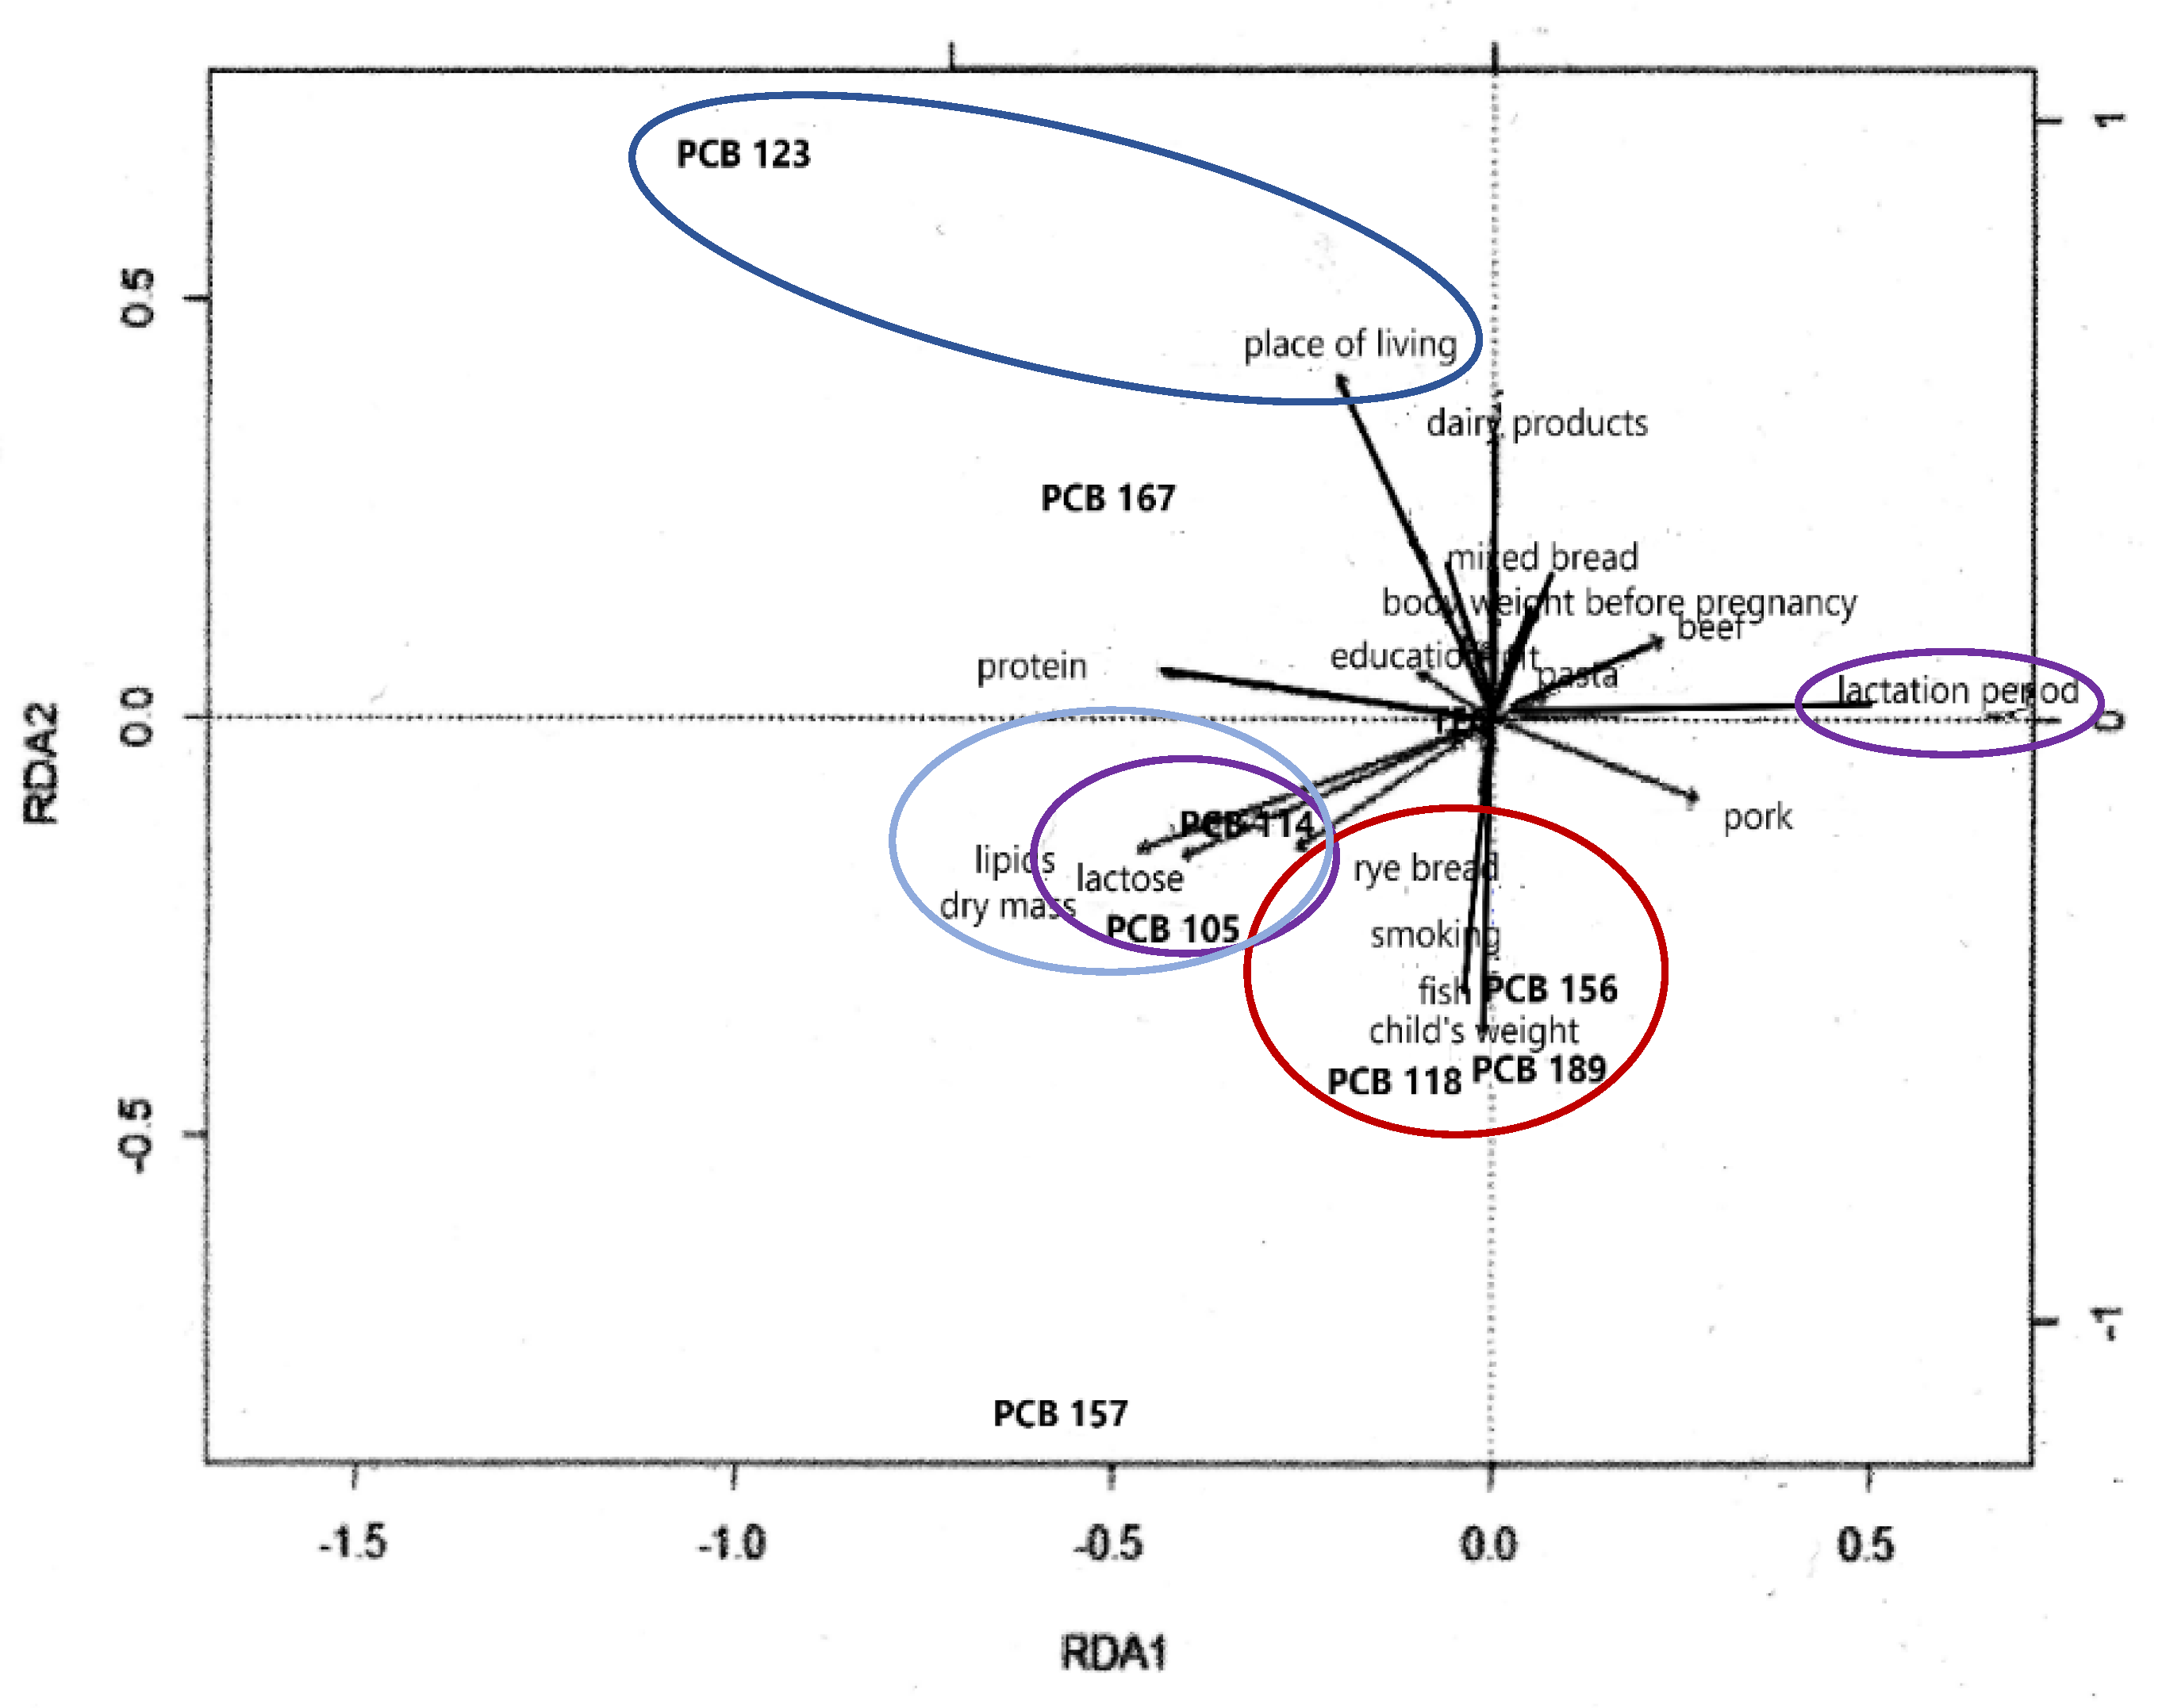
2.4. Redundancy Analysis (RDA)—Influence of the Frequency of Pregnant Women’s Consumption of Foodstuffs and Changes in PCB Contents in Human Milk
2.5. Infant Risk Assessment Linked with the Content of PCBs in Human Milk
3. Discussion
4. Materials and Methods
4.1. Participants and Biological Study Material
4.2. Chemical Materials—Reagents
- 6 PCB-Seven Key Isomers NE 5575 (IUPAC No. PCBs 28, 52, 101, 118, 138, 153): LGC Ltd., Wesel, Germany.
- 12 non-ortho and mono-ortho PCB-CERTAN© NE 5570 LGC Ltd. (IUPAC No. PCBs 77, 81, 123, 105, 114, 126, 156, 157, 180, 169, 167, 189): LGC Standards, Wesel, Germany.
- Reference material BCR 450-PCBs in natural milk powder: Community Bureau of Reference, Belgium.
- Pesticides Surrogate Spike Mix 4–8460, Supelco (Bellefonte, PA, USA).
- 13C12-labeled PCB Mixture-A, CIL (Cambridge Isotope Laboratories, Inc.) EC-4938, containing: 3,3′,4,4′-TetraCB; 3,4,4′,5′-TetraCB; 2′,3,4,4′,5-PentaCB; 3,3′,4,4′,5-PentaCB; 3,3′,4,4′,5,5′-HexaCB; and 2,2′,3,4,4′,5,5′-HeptaCB.
4.3. Methodology
- Estimating the contamination of milk with the following compounds: non-ortho PCBs (IUPAC No. 77, 81, 126, 169), mono-ortho PCBs (105, 114, 118, 156, 157), and PCB indicator congeners (28, 52, 101, 138, 153, 180).
- Assessing infant health risk with the parameters of TEQPCB and tolerable weekly intake (TWI).
- Analyzing the residues detected with regard to current regulations on maximum levels allowed in foods for infants and young children.
4.4. Analytical Methodology
4.5. Quality Control
4.6. Estimated Health Risk
4.7. Statistical Analysis
5. Conclusions
Author Contributions
Funding
Institutional Review Board Statement
Informed Consent Statement
Data Availability Statement
Conflicts of Interest
References
- United Nations Environment Programme. Annual Report. USEP. 2012. Available online: www.unep.org/annualreport (accessed on 20 February 2013).
- Witczak, A.; Abdel-Gawad, H. Comparison of organochlorine pesticides and polychlorinated biphenyls residues in vegetables, grain and soil from organic and conventional farming in Poland. J. Environ. Sci. Health B 2012, 47, 343–354. [Google Scholar] [CrossRef] [PubMed]
- Vukasinovic, M.; Zdravkovic, V.; Lutovac, M.; Zdravkovic, N. The effects of polychlorinated biphenyls on human health and the environment. Glob. J. Pathol. Microbiol. 2017, 5, 8–14. [Google Scholar]
- Den Hond, E.; Tournaye, H.; De Sutter, P.; Ombelet, W.; Baeyens, W.; Covaci, A.; Cox, B.; Nawrot, T.S.; Van Larebeke, N.; D’Hooghe, T. Human exposure to endocrine disrupting chemicals and fertility: A case-control study in male subfertility patients. Environ. Int. 2015, 84, 154–160. [Google Scholar] [CrossRef] [PubMed]
- Milon, A.; Opydo-Chanek, M.; Tworzydlo, W.; Galas, J.; Pardyak, L.; Kaminska, A.; Ptak, A.; Kotula-Balak, M. Chlorinated biphenyls effect on estrogen-related receptor expression, steroid secretion, mitochondria ultrastructure but not on mitochondrial membrane potential in Leydig cells. Cell Tissue Res. 2017, 369, 429–444. [Google Scholar] [CrossRef]
- Peng, F.J.; Hardy, E.M.; Béranger, R.; Mezzache, S.; Bourokba, N.; Bastien, P.; Li, J.; Zaros, C.; Chevrier, C.; Palazzi, P.; et al. Human exposure to PCBs, PBDEs and bisphenols revealed by hair analysis: A comparison between two adult female populations in China and France. Environ. Pollut 2020, 267, 115425. [Google Scholar] [CrossRef] [PubMed]
- Ermler, S.; Kortenkamp, A. Protocol for a systematic review of associations of polychlorinated biphenyl (PCB) exposure with declining semen quality in men to support derivation of a reference dose for mixture risk assessments for male reproductive health. Zenodo 2021, 1, 1–27. [Google Scholar] [CrossRef]
- Tan, J.; Loganath, A.; Chong, Y.S.; Obbard, J.P. Exposure to persistent organic pollutants in utero and related maternal characteristics on birth outcomes: A multivariate data analysis approach. Chemosphere 2009, 74, 428–433. [Google Scholar] [CrossRef]
- Neblett, M.F.; Curtis, S.W.; Gerkowicz, S.A.; Spencer, J.B.; Terrell, M.L.; Jiang, V.S.; Marder, E.; Barr, D.B.; Marcuss, M.; Smith, A.K. Examining Reproductive Health Outcomes in Females Exposed to Polychlorinated Biphenyl and Polybrominated Biphenyl. Sci. Rep. 2020, 10, 3314. [Google Scholar] [CrossRef]
- Mallozzi, M.; Bordi, G.; Garo, C.; Caserta, D. The effect of maternal exposure to endocrine disrupting chemicals on fetal and neonatal development: A review on the major concerns. Birth Defects Res. C Embryo Today 2016, 108, 224–242. [Google Scholar] [CrossRef]
- Yang, C.; Song, G.; Lim, W. A mechanism for the effect of endocrine disrupting chemicals on placentation. Chemosphere 2019, 231, 326–336. [Google Scholar] [CrossRef]
- Brajenović, N.; Karačonji, I.B.; Jurič, A. Levels of polychlorinated biphenyls in human milk samples in European countries. Arhiv Hig. Rada Toksikol. 2018, 69, 135–153. [Google Scholar] [CrossRef] [PubMed]
- Ellsworth, L.; McCaffery, H.; Chernyak, S.; Lam, S.; Sargis, R.M.; Padmanabhan, V.; Gregg, B. Lactational exposure to polychlorinated biphenyls is higher in overweight/obese women and associated with altered infant growth trajectory: A pilot study. Curr. Res. Toxicol. 2020, 1, 133–140. [Google Scholar] [CrossRef] [PubMed]
- Bates, M.N.; Thomson, B.; Garret, N. Reduction in organochlorine levels in the milk of New Zealand Woman. Arch. Environ. Health 2002, 57, 591–597. [Google Scholar] [CrossRef]
- Iszatt, N.; Janssen, S.; Lenters, V.; Dahl, C.; Stigum, H.; Knight, R.; Mandal, S.; Peddada, S.; González, A.; Midtvedt, T.; et al. Environmental toxicants in breast milk of Norwegian mothers and gut bacteria composition and metabolites in their infants at 1 month. Microbiome 2019, 7, 34. [Google Scholar] [CrossRef] [PubMed]
- Busico, F.; Salvatori, G.; Pannone, V.; Berretta, S.; Mattei, G.; Triolone, D.; Amadio, P.; Foligno, S.; Clemente, M.; Renzetti, E.; et al. Monitoring of Persistent Organic Pollutants in Human Milk of Lazio Region. J. Toxicol. Curr. Res. 2019, 3, 9. [Google Scholar] [CrossRef]
- Heilmann, C.; Grandjean, P.; Weihe, P.; Nielsen, F.; Budtz-Jørgensen, E. Reduced antibody responses to vaccinations in children exposed to polychlorinated biphenyls. PLoS Med. 2006, 3, e311. [Google Scholar] [CrossRef] [PubMed]
- Van den Berg, M.; Kypke, K.; Kotz, A.; Tritscher, A.; Lee, S.Y.; Magulova, K.; Fiedler, H.; Malisch, R. WHO/UNEP global surveys of PCDDs, PCDFs, PCBs and DDTs in human milk and benefit-risk evaluation of breastfeeding. Arch. Toxicol. 2017, 91, 83–96. [Google Scholar] [CrossRef] [PubMed]
- Liem, A.K.; Fürst, P.; Rappe, C. Exposure of populations to dioxins and related compounds. Food Addit. Contam. 2000, 17, 241–259. [Google Scholar] [CrossRef]
- Harris, C.A.; Woolridge, M.W.; Hay, A.W. Factors affecting the transfer of organochlorine pesticide residues to breastmilk. Chemosphere 2001, 43, 243–256. [Google Scholar] [CrossRef]
- Szostak-Węgierek, D.; Cichocka, A. Żywienie Kobiet w Ciąży [Nutrition of Pregnant Women]; PZWL: Warszawa, Poland, 2012; pp. 9–67. (In Polish) [Google Scholar]
- Fattore, E.; Fanelli, R.; Dellatte, E.; Turrini, A.; Di Domenico, A. Assessment of the dietary exposure to non-dioxin-like PCBs of the Italian general population. Chemosphere 2008, 73 (Suppl. S1), S278–S283. [Google Scholar] [CrossRef]
- Witczak, A.; Pohoryło, A.; Abdel-Gawad, H. Endocrine-Disrupting Organochlorine Pesticides in Human Breast Milk: Changes during Lactation. Nutrients 2021, 13, 229. [Google Scholar] [CrossRef] [PubMed]
- The European Commission. Commission Regulation (EU) No 1259/2011. Amending Regulation (EC) no. 1881/2006 as regards maximum levels for dioxins, dioxin-like PCBs and nondioxin-like PCBs in foodstuffs. Off. J. Eur. Union 2011, 320, 18. [Google Scholar]
- Kent, J.C.; Mitoulas, L.R.; Cregan, M.D.; Ramsay, D.T.; Doherty, D.A.; Hartmann, P.E. Volume and frequency of breastfeeds and fat content of breast milk throughout the day. Pediatrics 2006, 117, 387–395. [Google Scholar] [CrossRef] [PubMed]
- Kent, J.C.; Hepworth, A.R.; Sherriff, J.L.; Cox, D.B.; Mitoulas, L.R.; Hartmann, P.E. Longitudinal changes in breastfeeding patterns from 1 to 6 months of lactation. Breastfeed. Med. 2013, 8, 401–407. [Google Scholar] [CrossRef]
- World Health Organization. The WHO Child. Growth Standards 2016 [cited 2016 August 30]. Available online: http://www.who.int/childgrowth/standards/en/ (accessed on 1 March 2016).
- IARC, International Agency for Research on Cancer. IARC Monographs on Polychlorinated Biphenyls and Polybrominated Biphenyls; IARC: Lyon, France, 2016; Volume 107.
- IARC, International Agency for Research on Cancer. List of Classifications by Cancer Sites with Sufficient or Limited Evidence in Humans; IARC: Lyon, France, 2018; pp. 1–122.
- Lee, S.; Kelleher, S.L. Biological underpinnings of breastfeeding challenges: The role of genetics, diet, and environment on lactation physiology. Am. J. Physiol. Endocrinol. Metab. 2016, 311, E405–E422. [Google Scholar] [CrossRef]
- Pajewska-Szmyt, M.; Sinkiewicz-Darol, E.; Gadzała-Kopciuch, R. The impact of environmental pollution on the quality of mother’s milk. Environ. Sci. Pollut. Res. Int. 2019, 26, 7405–7427. [Google Scholar] [CrossRef]
- Klinčić, D.; Herceg Romanić, S.; Brčić Karačonji, I.; Matek Sarić, M.; Grzunov Letinić, J.; Brajenović, N. Organochlorine pesticides and PCBs (including dl-PCBs) in human milk samples collected from multiparae from Croatia and comparison with primiparae. Environ. Toxicol. Pharmacol. 2016, 45, 74–79. [Google Scholar] [CrossRef]
- Dimitriadou, L.; Malarvannan, G.; Covaci, A.; Iossifidou, E.; Tzafettas, J.; Zournatzi-Koiou, V.; Kalantzi, O.I. Levels and profiles of brominated and chlorinated contaminants in human breast milk from Thessaloniki, Greece. Sci. Total Environ. 2016, 539, 350–358. [Google Scholar] [CrossRef]
- Müller, M.H.B.; Polder, A.M.; Brynildsrud, O.B.; Karimi, M.; Lie, E.; Manyilizu, W.B.; Mdegela, R.H.; Mokiti, F.; Murtadha, M.; Nonga, H.E.; et al. Organochlorine pesticides (OCPs) and polychlorinated biphenyls (PCBs) in human breast milk and associated health risks to nursing infants in Northern Tanzania. Environ. Res. 2017, 154, 425–434. [Google Scholar] [CrossRef]
- Klinčić, D.; Herceg Romanić, S.; Matek Sarić, M.; Grzunov, J.; Dukić, B. Polychlorinated biphenyls and organochlorine pesticides in human milk samples from two regions in Croatia. Environ. Toxicol. Pharmacol. 2014, 37, 543–552. [Google Scholar] [CrossRef]
- Hassine, S.B.; Ameur, W.B.; Gandoura, N.; Driss, M.R. Determination of chlorinated pesticides, polychlorinated biphenyls, and polybrominated diphenyl ethers in human milk from Bizerte (Tunisia) in 2010. Chemosphere 2012, 89, 369–377. [Google Scholar] [CrossRef] [PubMed]
- Lignell, S.; Aune, M.; Darnerud, P.O.; Cnattingius, S.; Glynn, A. Persistent organochlorine and organobromine compounds in mother’s milk from Sweden 1996-2006: Compound-specific temporal trends. Environ. Res. 2009, 109, 760–767. [Google Scholar] [CrossRef] [PubMed]
- Polder, A.; Skaare, J.U.; Skjerve, E.; Loken, K.B.; Eggesbo, M. Levels of chlorinated pesticides and polychlorinated biphenyls in Norwegian breast milk (2002–2006), and factors that may predict the level of contamination. Sci. Total Environ. 2009, 407, 4584–4590. [Google Scholar] [CrossRef] [PubMed]
- Mannetje, A.; Coakley, J.; Bridgen, P.; Brooks, C.; Harrad, S.; Smith, A.H.; Pearce, N.; Douwes, J. Current concentrations, temporal trends and determinants of persistent organic pollutants in breast milk of New Zealand women. Sci. Total Environ. 2013, 458–460, 399–407. [Google Scholar] [CrossRef] [PubMed]
- Mamontova, E.A.; Tarasova, E.N.; Mamontov, A.A. PCBs and OCPs in human milk in Eastern Siberia, Russia: Levels, temporal trends and infant exposure assessment. Chemosphere 2017, 148, 239–248. [Google Scholar] [CrossRef]
- National Emission Balance of SO2, NOX, CO, NH3, NMVOC, Dust, Heavy Metals and POPs for the Years 1990–2020. Synthetic Report. National Center for Emission Management and Balancing, Institute of Environmental Protection—National Research Institute. Ministry of Climate and Environment, Warsaw 2022. Available online: https://www.kobize.pl/uploads/materialy/materialy_do_pobrania/krajowa_inwentaryzacja_emisji/Bilans_emisji_za_2020.pdf (accessed on 19 June 2022). (In Polish).
- Li, J.; Zhang, L.; Wu, Y.; Liu, Y.; Zhou, P.; Wen, S.; Liu, J.; Zhao, Y.; Li, X. A national survey of polychlorinated dioxins, furans (PCDD/Fs) and dioxin-like polychlorinated biphenyls (dl-PCBs) in human milk in China. Chemosphere 2009, 75, 1236–1242. [Google Scholar] [CrossRef]
- Zhang, L.; Yin, S.; Li, J.; Zhao, Y.; Wu, Y. Increase of polychlorinated dibenzo-p-dioxins and dibenzofurans and dioxin-like polychlorinated biphenyls in human milk from China in 2007–2011. Int. J. Hyg. Environ. Health 2016, 219, 843–849. [Google Scholar] [CrossRef]
- Long, M.; Wielsøe, M.; Bonefeld-Jørgensen, E.C. Time Trend of Persistent Organic Pollutants and Metals in Greenlandic Inuit during 1994–2015. Int. J. Environ. Res. Public Health 2021, 18, 2774. [Google Scholar] [CrossRef]
- Bjerregaard, P.; Pedersen, H.S.; Nielsen, N.O. Dewailly E. Population surveys in Greenland 1993–2009: Temporal trend of PCBs and pesticides in the general Inuit population by age and urbanisation. Sci. Total Environ. 2013, 454–455, 283–288. [Google Scholar] [CrossRef]
- Mannetje, A.; Coakley, J.; Mueller, J.F.; Harden, F.; Toms, L.M.; Douwes, J. Partitioning of persistent organic pollutants (POPs) between human serum and breast milk: A literature review. Chemosphere 2012, 89, 911–918. [Google Scholar] [CrossRef]
- Zhou, P.; Wu, Y.; Yin, S.; Li, J.; Zhao, Y.; Zhang, L.; Chen, H.; Liu, Y.; Yang, X.; Li, X. National survey of the levels of persistent organochlorine pesticides in the breast milk of mothers in China. Environ. Pollut. 2011, 159, 524–531. [Google Scholar] [CrossRef] [PubMed]
- Čajka, T.; Hajšlova, J. Polychlorinated biphenyls and organochlorinepesticides in human milk from the Locality Prague, Czech Republic: Acomparative study. Bull. Environ. Contam. Toxicol. 2003, 70, 913–919. [Google Scholar] [CrossRef] [PubMed]
- Jarczewska, K.; Lulek, J.; Covaci, A.; Voorsoels, S.; Kaluba-Skotarczak, A.; Drews, K.; Schepens, P. Distribution of polychlorinated biphenyls, organochlorine pesticides and polybrominated diphenyl ethers in human umbilical cord serum, maternal serum and milk from Wielkopolska region, Poland. Sci. Total Environ. 2006, 372, 20–31. [Google Scholar] [CrossRef] [PubMed]
- Szyrwińska, K.; Lulek, L. Exposure to specific polychlorinated biphenyls and some chlorinated pesticides via breast milk in Poland. Chemosphere 2007, 66, 1895–1903. [Google Scholar] [CrossRef]
- Černá, M.; Bencko, V.; Brabec, M.; Šmíd, J.; Krsková, A.; Jech, L. Exposure assessment of breast-fed infants in the Czech Republic to indicator PCBs and selected chlorinated pesticides: Area-related differences. Chemosphere 2010, 78, 160–168. [Google Scholar] [CrossRef]
- Pietrzak-Fiećko, R.; Smoczyński, S.S.; Borejszo, Z. Poziom polichlorowanych bifenyli w mleku kobiecym w zależności od wybranych czynników [Levels of polychlorinated biphenyls in human milk in dependent on selected factors]. Rocz. Panstw. Zakl. Hig. 2004, 55, 297–305. (In Polish) [Google Scholar]
- Malarvannan, G.; Kunisue, T.; Isobe, T.; Sudaryanto, A.; Takahashi, S.; Prudente, M.; Subramanian, A.; Tanabe, S. Organohalogen compounds in human breast milk from mothers living in Payatas and Malate, the Philippines: Levels, accumulation kinetics and infant health risk. Environ. Pollut. 2009, 157, 1924–1932. [Google Scholar] [CrossRef]
- Fång, J.; Nyberg, E.; Bignert, A.; Bergman, Å. Temporal trends of polychlorinated dibenzo-p-dioxins and dibenzofurans and dioxin-like polychlorinated biphenyls in mothers’ milk from Sweden, 1972–2011. Environ. Int. 2013, 60, 224–231. [Google Scholar] [CrossRef]
- Ulaszewska, M.M.; Zuccato, E.; Davoli, E. PCDD/Fs and dioxin-like PCBs in human milk and estimation of infants’ daily intake: A review. Chemosphere 2011, 83, 774–782. [Google Scholar] [CrossRef]
- Croes, K.; Colles, A.; Koppen, G.; De Galan, S.; Vandermarken, T.; Govarts, E.; Bruckers, L.; Nelen, V.; Schoeters, G.; Van Larebeke, N.; et al. Determination of PCDD/Fs, PBDD/Fs and dioxin-like PCBs in human milk from mothers residing in the rural areas in Flanders, using the CALUX bioassay and GC-HRMS. Talanta 2013, 113, 99–105. [Google Scholar] [CrossRef]
- Pratt, I.S.; Anderson, W.A.; Crowley, D.; Daly, S.F.; Evans, R.I.; Fernandes, A.R.; Fitzgerald, M.; Geary, M.P.; Keane, D.P.; Malisch, R.; et al. Polychlorinated dibenzo-p-dioxins (PCDDs), polychlorinated dibenzofurans (PCDFs) and polychlorinated biphenyls (PCBs) in breast milk of first-time Irish mothers: Impact of the 2008 dioxin incident in Ireland. Chemosphere 2012, 88, 865–872. [Google Scholar] [CrossRef] [PubMed]
- Wong, T.W.; Wong, A.H.S.; Nelson, E.A.S.; Qiu, H.; Ku, S.Y.K. Levels of PCDDs, PCDFs, and dioxin-like PCBs in human milk among Hong Kong mothers. Sci. Total Environ. 2013, 463–464, 1230–1238. [Google Scholar] [CrossRef] [PubMed]
- Chen, B.H.; Chen, Y.C. Formation of polycyclic aromatic hydrocarbons in the smoke from heated model lipids and food lipids. J. Agric. Food Chem. 2001, 49, 5238–5243. [Google Scholar] [CrossRef] [PubMed]
- Armbruster, D.A.; Pry, T. Limit of blank, limit of detection and limit of quantitation. Clin. Biochem. Rev. 2008, 29 (Suppl. S1), S49–S52. [Google Scholar]
- Van den Berg, M.; Birnbaum, L.S.; Denison, M.; De Vito, M.; Farland, W.; Feeley, M.; Fiedler, H.; Hakansson, H.; Hanberg, A.; Haws, L.; et al. The 2005 World Health Organization reevaluation of human and Mammalian toxic equivalency factors for dioxins and dioxin-like compounds. Toxicol. Sci. 2006, 93, 223–241. [Google Scholar] [CrossRef] [PubMed]
- Guilford, J.P. Psychometric Methods, 2nd ed.; McGraw-Hill: New York, NY, USA, 1954; p. 597. [Google Scholar]


| No. | Basic Information on Mother and Child | Response Provided in Questionaire | Percentage of Provided Responses (%) |
|---|---|---|---|
| 1. | mother’s age (years) | <18 | 4.2 (%) |
| 18–22 | - | ||
| 23–27 | 25 (%) | ||
| 28–32 | 37.5 (%) | ||
| 33–36 | 33.3 (%) | ||
| 2. | body weight prior to pregnancy (kg) | <55 | 25 (%) |
| 56–60 | 12.5 (%) | ||
| 61–65 | 20.8 (%) | ||
| >65 | 41.7 (%) | ||
| 3. | body weight in the first week after childbirth (kg) | 55–60 | 20.8 (%) |
| 61–65 | 20.8 (%) | ||
| 66–70 | 25 (%) | ||
| >70 | 33.4 (%) | ||
| 4. | place of residence | city > 5000 inhabitants | 83.3 (%) |
| town < 5000 inhabitants | 4.2 (%) | ||
| country | 12.5 (%) | ||
| 5. | education | primary | 4.2 (%) |
| secondary | - | ||
| higher | 95.8 (%) | ||
| 6. | number of childbirths performed | 1 | 62.5 (%) |
| 2–3 | 37.5 (%) | ||
| ≥4 | - | ||
| 7. | type of birth | natural forces | 50 (%) |
| c-section | 50 (%) | ||
| 8. | infant’s sex | boy | 62.5 (%) |
| girl | 37.5 (%) | ||
| 9. | infant’s body weight in the first week (kg) | 2.4–2.8 | 4.2 (%) |
| 2.9–3.2 | 45.8 (%) | ||
| 3.3–3.6 | 45.8 (%) | ||
| 3.7–4.0 | - | ||
| >4.0 | 4.2 (%) | ||
| 10. | smoking | never smoked | 75 (%) |
| quitted before pregnancy | 16.7 (%) | ||
| used to smoke (number of packs of 20 cigarettes): | |||
| 4.2 (%) 4.2 (%) |
| Sample Collection Period | Number of Samples | Σndl-PCB ng/g Lipids | CV b | Σnon-ortho PCB ng/g Lipids | CV | Σmono-ortho PCB ng/g Lipids | CV |
|---|---|---|---|---|---|---|---|
| <7 days | 17 a | 16.63 ± 1.37 | 8.24 | 1.71 ± 0.23 | 13.31 | 7.84 ± 0.75 | 9.52 |
| 7 days | 26 | 19.83 ± 1.26 | 6.35 | 3.81 ± 0.50 | 13.15 | 14.85 ± 1.19 | 8.01 |
| 14 days | 59 | 20.31 ± 1.36 | 6.70 | 3.04 ± 0.44 | 14.52 | 12.19 ± 1.04 | 8.53 |
| 21 days | 98 | 17.94 ± 1.10 | 6.13 | 2.45 ± 0.32 | 13.00 | 9.85 ± 0.83 | 8.43 |
| 28 days | 39 | 14.49 ± 0.74 | 5.11 | 2.37 ± 0.22 | 9.12 | 8.56 ± 0.94 | 10.98 |
| 2 months | 75 | 15.90 ± 1.25 | 7.86 | 2.06 ± 0.20 | 9.81 | 8.99 ± 0.74 | 8.26 |
| 3 months | 75 | 15.24 ± 1.14 | 7.48 | 1.65 ± 0.15 | 9.02 | 7.02 ± 0.61 | 8.65 |
| 4 months | 92 | 15.22 ± 1.14 | 7.49 | 1.47 ± 0.18 | 12.22 | 6.21 ± 0.65 | 10.44 |
| 5 months | 88 | 12.83 ± 0.97 | 7.56 | 1.39 ± 0.19 | 13.54 | 5.23 ± 0.55 | 10.43 |
| 6 months | 88 | 10.82 ± 0.89 | 8.23 | 1.36 ± 0.09 | 6.72 | 3.37 ± 0.42 | 12.42 |
| 7 months | 69 | 15.39 ± 1.46 | 9.49 | 1.25 ± 0.07 | 5.77 | 4.23 ± 0.38 | 8.95 |
| 8 months | 39 | 15.71 ± 1.32 | 8.40 | 1.16 ± 0.10 | 8.89 | 3.55 ± 0.43 | 12.04 |
| 9 months | 29 | 13.81 ± 1.28 | 9.27 | 1.15 ± 0.12 | 10.49 | 2.85 ± 0.37 | 12.84 |
| 10 months | 29 | 11.63 ± 0.88 | 7.57 | 0.74 ± 0.12 | 16.02 | 2.35 ± 0.27 | 11.54 |
| 11 months | 29 | 10.48 ± 0.72 | 6.87 | 0.42 ± 0.06 | 14.89 | 1.76 ± 0.22 | 12.75 |
| 12 months | 29 | 7.75 ± 0.54 | 7.00 | 0.15 ± 0.03 | 18.82 | 1.02 ± 0.17 | 17.12 |
| >1 year of feeding | 39 | 0.343 ± 0.035 | 10.20 | 0.14 ± 0.05 | 32.16 | 0.21 ± 0.04 | 17.45 |
| average content | 13.78 ± 4.76 | 1.55 ± 0.98 | 5.89 ± 4.09 |
| Chromatograph Operating Parameters HP 8890/5977 | |
|---|---|
| column furnace program | 130 °C (0.5 min) → increase 7 °C/min → 200 °C (5 min) → 4 °C/min → 280 °C (10 min) → 290 °C (5 min) |
| injection in the column | 2 µL |
| carrier gas | helium |
| flow through the column | 1.1 mL/min |
| duration of the analysis | 50 min |
Publisher’s Note: MDPI stays neutral with regard to jurisdictional claims in published maps and institutional affiliations. |
© 2022 by the authors. Licensee MDPI, Basel, Switzerland. This article is an open access article distributed under the terms and conditions of the Creative Commons Attribution (CC BY) license (https://creativecommons.org/licenses/by/4.0/).
Share and Cite
Witczak, A.; Pohoryło, A.; Aftyka, A.; Pokorska-Niewiada, K.; Witczak, G. Changes in Polychlorinated Biphenyl Residues in Milk during Lactation: Levels of Contamination, Influencing Factors, and Infant Risk Assessment. Int. J. Mol. Sci. 2022, 23, 12717. https://doi.org/10.3390/ijms232112717
Witczak A, Pohoryło A, Aftyka A, Pokorska-Niewiada K, Witczak G. Changes in Polychlorinated Biphenyl Residues in Milk during Lactation: Levels of Contamination, Influencing Factors, and Infant Risk Assessment. International Journal of Molecular Sciences. 2022; 23(21):12717. https://doi.org/10.3390/ijms232112717
Chicago/Turabian StyleWitczak, Agata, Anna Pohoryło, Aleksandra Aftyka, Kamila Pokorska-Niewiada, and Grzegorz Witczak. 2022. "Changes in Polychlorinated Biphenyl Residues in Milk during Lactation: Levels of Contamination, Influencing Factors, and Infant Risk Assessment" International Journal of Molecular Sciences 23, no. 21: 12717. https://doi.org/10.3390/ijms232112717
APA StyleWitczak, A., Pohoryło, A., Aftyka, A., Pokorska-Niewiada, K., & Witczak, G. (2022). Changes in Polychlorinated Biphenyl Residues in Milk during Lactation: Levels of Contamination, Influencing Factors, and Infant Risk Assessment. International Journal of Molecular Sciences, 23(21), 12717. https://doi.org/10.3390/ijms232112717