Article

Metabolomics Profiling of Nephrotic Syndrome towards Biomarker Discovery

by
Minnie Jacob
1,†,
Refat M. Nimer
2,†,
Mohamad S. Alabdaljabar
1,3,
Essa M. Sabi
4,5,
Mysoon M. Al-Ansari
6,
Maged Housien
7,
Khalid M. Sumaily
4,5,
Lina A. Dahabiyeh
8 and
Anas M. Abdel Rahman
1,9,*
1
Metabolomics Section, Department of Clinical Genomics, Center for Genome Medicine, King Faisal Specialist Hospital and Research Centre (KFSHRC), Riyadh 11121, Saudi Arabia
2
Department of Medical Laboratory Sciences, Jordan University of Science and Technology, Irbid 22110, Jordan
3
Department of Internal Medicine, Mayo Clinic, Rochester, MN 55902, USA
4
Clinical Biochemistry Unit, Pathology Department, College of Medicine, King Saud University, Riyadh 11461, Saudi Arabia
5
Clinical Biochemistry Unit, Laboratory Medicine, King Saud University Medical City, King Saud University, Riyadh 11461, Saudi Arabia
6
Department of Botany and Microbiology, College of Science, King Saud University, Riyadh 11451, Saudi Arabia
7
Department of Medicine, King Faisal Specialist Hospital and Research Centre (KFSHRC), Riyadh 11211, Saudi Arabia
8
Department of Pharmaceutical Sciences, School of Pharmacy, The University of Jordan, Amman 11972, Jordan
9
Department of Biochemistry and Molecular Medicine, College of Medicine, Alfaisal University, Riyadh 11533, Saudi Arabia
*
Author to whom correspondence should be addressed.
These authors contributed equally to this work.
Int. J. Mol. Sci. 2022, 23(20), 12614; https://doi.org/10.3390/ijms232012614
Submission received: 11 September 2022 / Revised: 5 October 2022 / Accepted: 13 October 2022 / Published: 20 October 2022
(This article belongs to the Special Issue Molecular Research in Renal Tumors)

Abstract

:
Nephrotic syndrome (NS) is a kidney illness characterized by excessive proteinuria, hypoalbuminemia, edema, and hyperlipidemia, which may lead to kidney failure and necessitate renal transplantation. End-stage renal disease, cardiovascular issues, and mortality are much more common in those with NS. Therefore, the present study aimed to identify potential new biomarkers associated with the pathogenesis and diagnosis of NS. The liquid chromatography–mass spectrometry (LC–MS) metabolomics approach was applied to profile the metabolome of human serum of patients with NS. A total of 176 metabolites were significantly altered in NS compared to the control. Arginine, proline, and tryptophan metabolism; arginine, phenylalanine, tyrosine, and tryptophan biosynthesis were the most common metabolic pathways dysregulated in NS. Furthermore, alanyl-lysine and isoleucyl-threonine had the highest discrimination between NS and healthy groups. The candidate biomarkers may lead to understanding the possible metabolic alterations associated with NS and serve as potential diagnostic biomarkers.

1. Introduction

Nephrotic syndrome (NS) is a common urinary system disease caused by increased permeability of glomerular filtration membranes to plasma proteins resulting in a considerable loss of albumin in the urine. NS may be caused by primary (idiopathic) renal disease or other secondary causes [1]. Diabetes mellitus is the most common secondary cause, whereas focal segmental glomerulosclerosis and membranous neuropathy are the most common primary causes. NS is characterized by edema, proteinuria, hypoalbuminemia, and hyperlipidemia, which may lead to kidney failure and necessitate renal transplantation [2]. These patients are likely to have hypertension, and due to the loss of immunoglobulins in the urine, they are highly susceptible to infections such as cellulitis, peritonitis, and sepsis. NS is a kidney disease that affects children and adults; the prevalence is 16 cases per 100,000 children [3].
The mainstay treatment of NS is steroid treatment, but in the case of steroid-resistant NS patients, anticancer drugs such as vincristine have become potential alternatives. In addition, rituximab, a chimeric B-cell depleting anti–CD 20 antibody, has become a choice for patients with primary glomerular disease [4]. If children with NS are not diagnosed and treated promptly, there is a 40% chance that they may develop the condition again once they reach adulthood and ultimately progress into end-stage renal disease [5,6]. The diagnosis of NS is based on characteristic clinical symptoms, in addition to the confirmation of significant proteinuria and hypoalbuminemia [7].
Since no validated biomarkers are available for the diagnosis of NS, as well as the lack of definite and reliable treatment plans, extensive research has been performed on NS. The main challenge is enabling patients’ early diagnosis using serum samples [8,9]. Decades of research have shown that along with the development of genomics and other omics technology. Metabolomics is a promising way to identify the metabolome (global collection of small molecules typically <1500 Daltons) [10]. Additionally, metabolomics has become a promising diagnostic and prognostic tool [10]. The kidneys are notable for the degree and complexity of their intrinsic metabolic activity, performing the energy-intensive task of solute and water reabsorption from >100 L of filtrate per day [11]. Generally, metabolism in kidney diseases is particularly complex; decreased kidney function causes peripheral insulin resistance and protein energy wasting due to diabetes in most of these patients [12]. The kidneys directly impact the metabolome, including the update of many metabolites through mechanisms such as glomerular filtration, tubular secretion, catabolism, and the net release (anabolism) of several amino acids other and metabolites [13]. Changes in the metabolome, both qualitative and quantitative, have a role in the development and progression of renal disease [14]. Therefore, studying the metabolome in NS will play an important role in finding biomarkers, illuminating the path for the disease’s development mechanism, and hence contributing to early diagnosis. Currently, limited studies have been conducted to study the mechanism of NS or glomerular diseases, focusing on urinary or blood metabolomics profiling [15,16,17,18]. The growing burden of NS and its incomplete understanding of metabolic pathways is a strong challenge for blood and urine metabolomics studies on these patients. Therefore, it is urgent to find metabolomics biomarkers for NS suitable for diagnosis, follow-up, and treatment.
Recent years have seen the development of a new analytical method for biomarker identification known as chemical isotope labeling liquid chromatography–mass spectrometry (CIL LC–MS), which uses various labeling reagents to target specific functional groups based on sub-metabolomes [19,20,21]. This study aimed to explore metabolic alterations and to find new and differentially expressed biomarkers in NS patients by using CIL LC–MS targeting the amine/phenol sub-metabolomes.

2. Results

2.1. Demographics, Clinical and Molecular Features in NS Patients

The clinical and laboratory characteristics of the study cohorts are presented in Table 1. The study included serum samples collected from NS patients (n = 6) and a group of healthy controls (n = 33). NS patients’ ages ranged from 14 to 36 years, with a mean of 19.3 ± 3.44 years (SEM). The mean age of healthy control is 23 ± 1.03 years. The healthy controls were selected based on our clinical metabolomics program’s biobank, which has a broad range of samples collected from family medicine and blood bank [21]. Based on our IRB protocol, we only apply certain criteria to this sample collection, and then the algorithm provides us with the samples that match our study. The details of these clinical samples are kept hidden.
All the study participants were males and had different NS phenotypes. The mean body mass index (BMI) was 28.8 ± 4.31, and 2.5 ± 5.3 kg/m2, for the NS and healthy control, respectively. All NS patients had >50% secondary to minimal change disease (MCD). Mean serum creatinine and urea for the studied population were 126.8 ± 57.63 µmol/L (SEM) and 7.4 + 1.95 mmol/L (SEM), respectively. Patients had various degrees of proteinuria: dipstick proteinuria ranging from 0–3, protein random in urine 0.09–4.26 g/L, and protein/creatinine ratio ranging between 5.65–323.4 mg/mmol. Noteworthy, these laboratory tests were performed in the KFSHRC chemistry laboratory and provided by MG, where the values correspond to the time of sample acquisition for the metabolomics studies. These patients were likely in remission during sample acquisition; thus, their proteinuria is not very high or even negative [22].

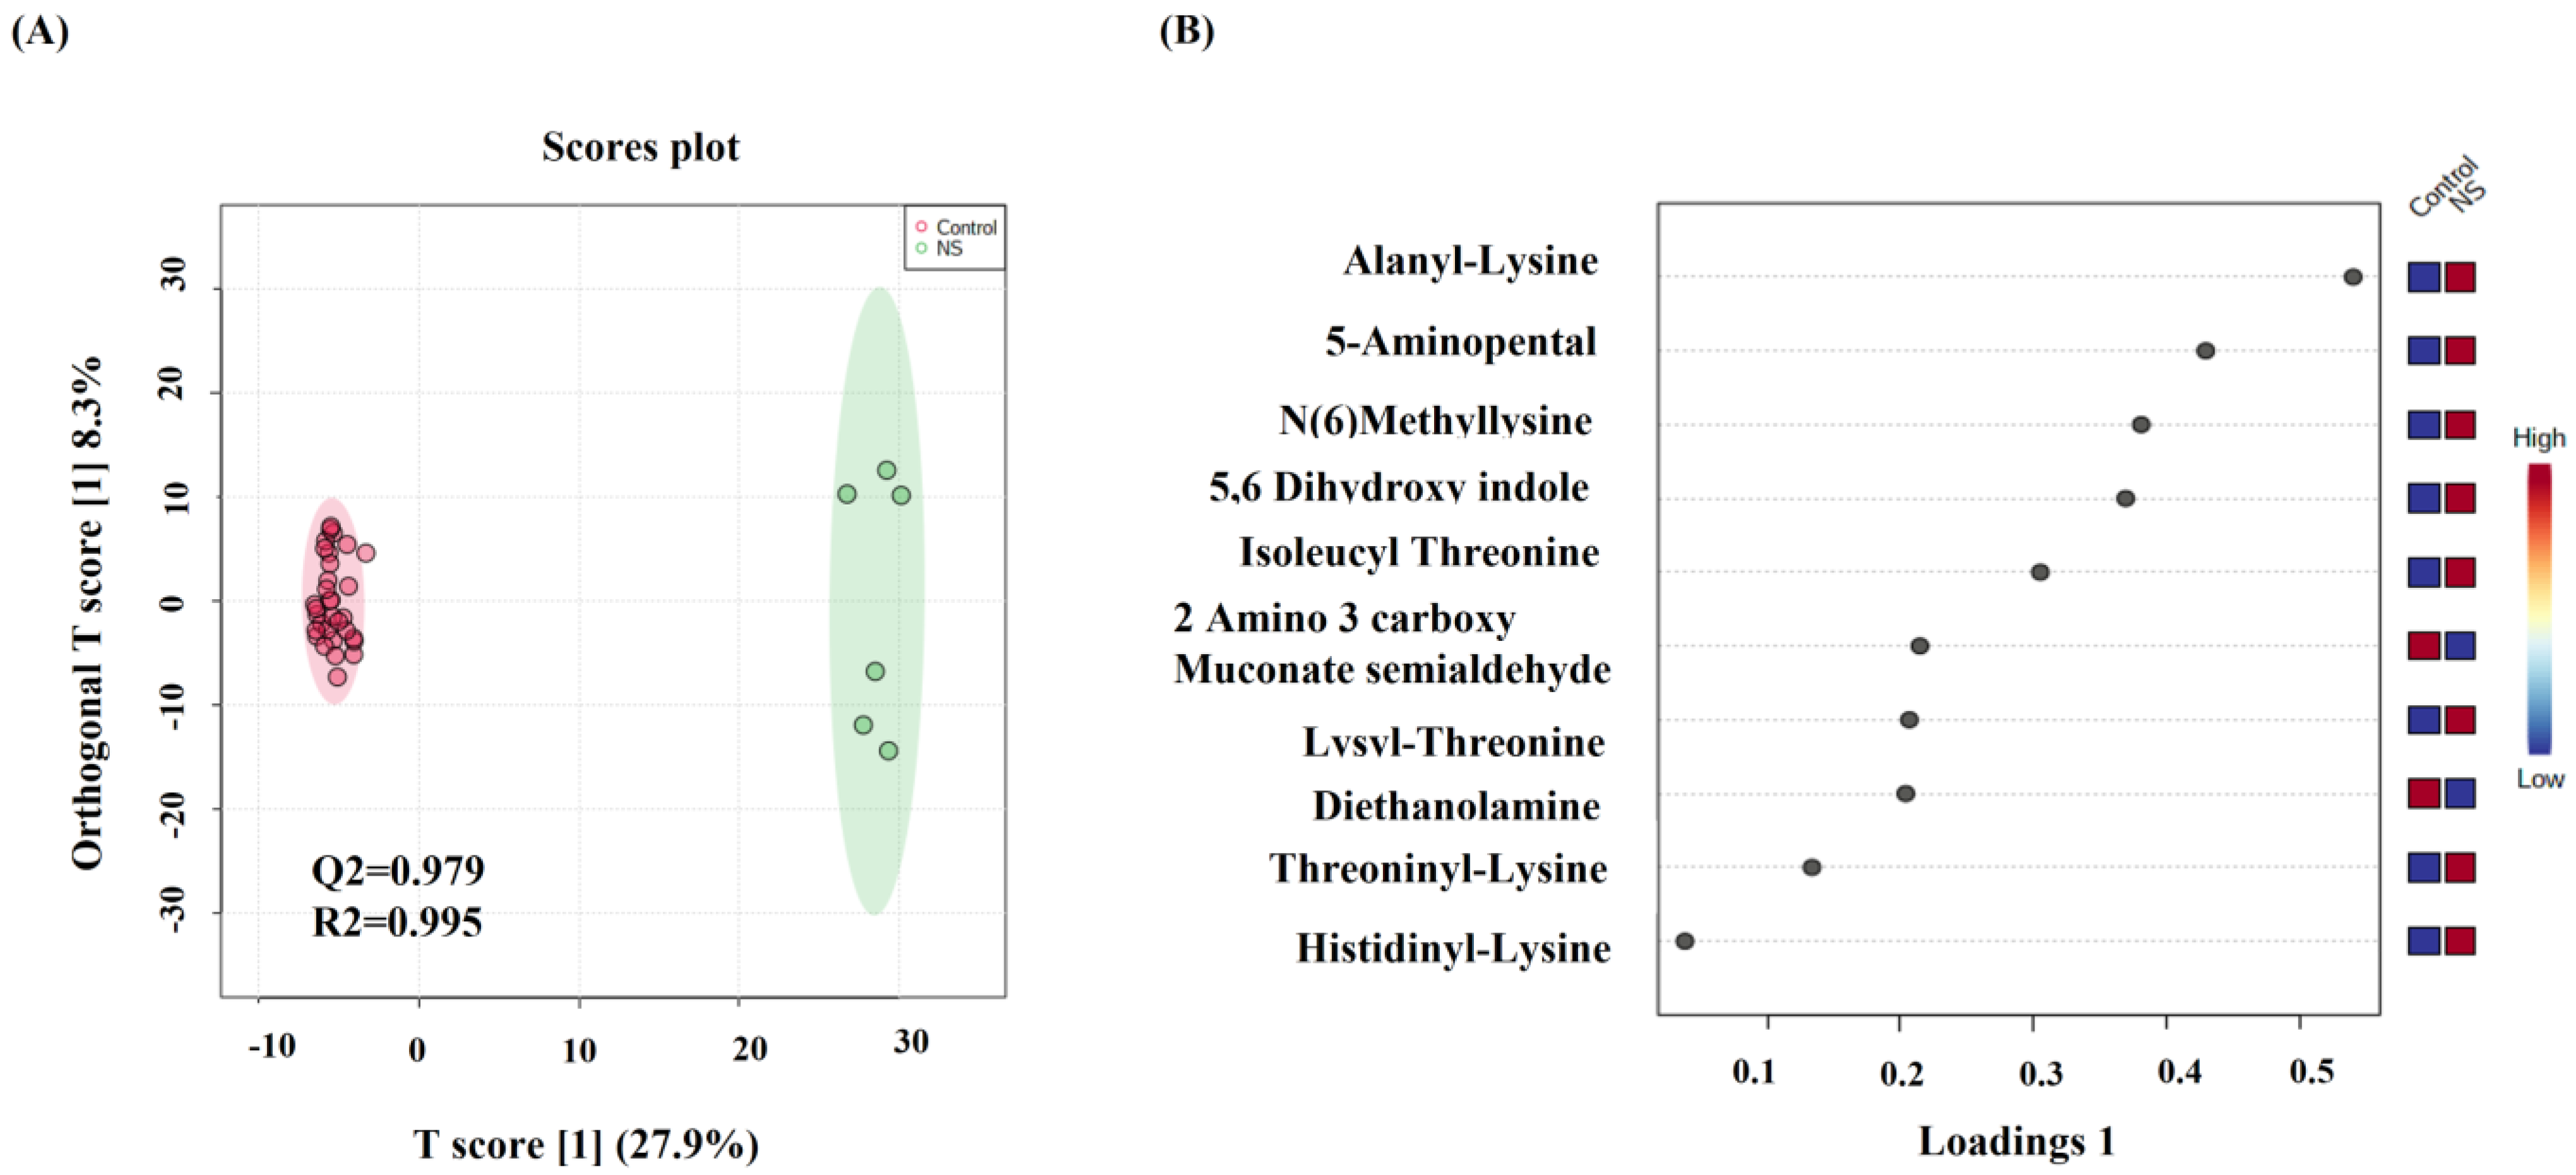
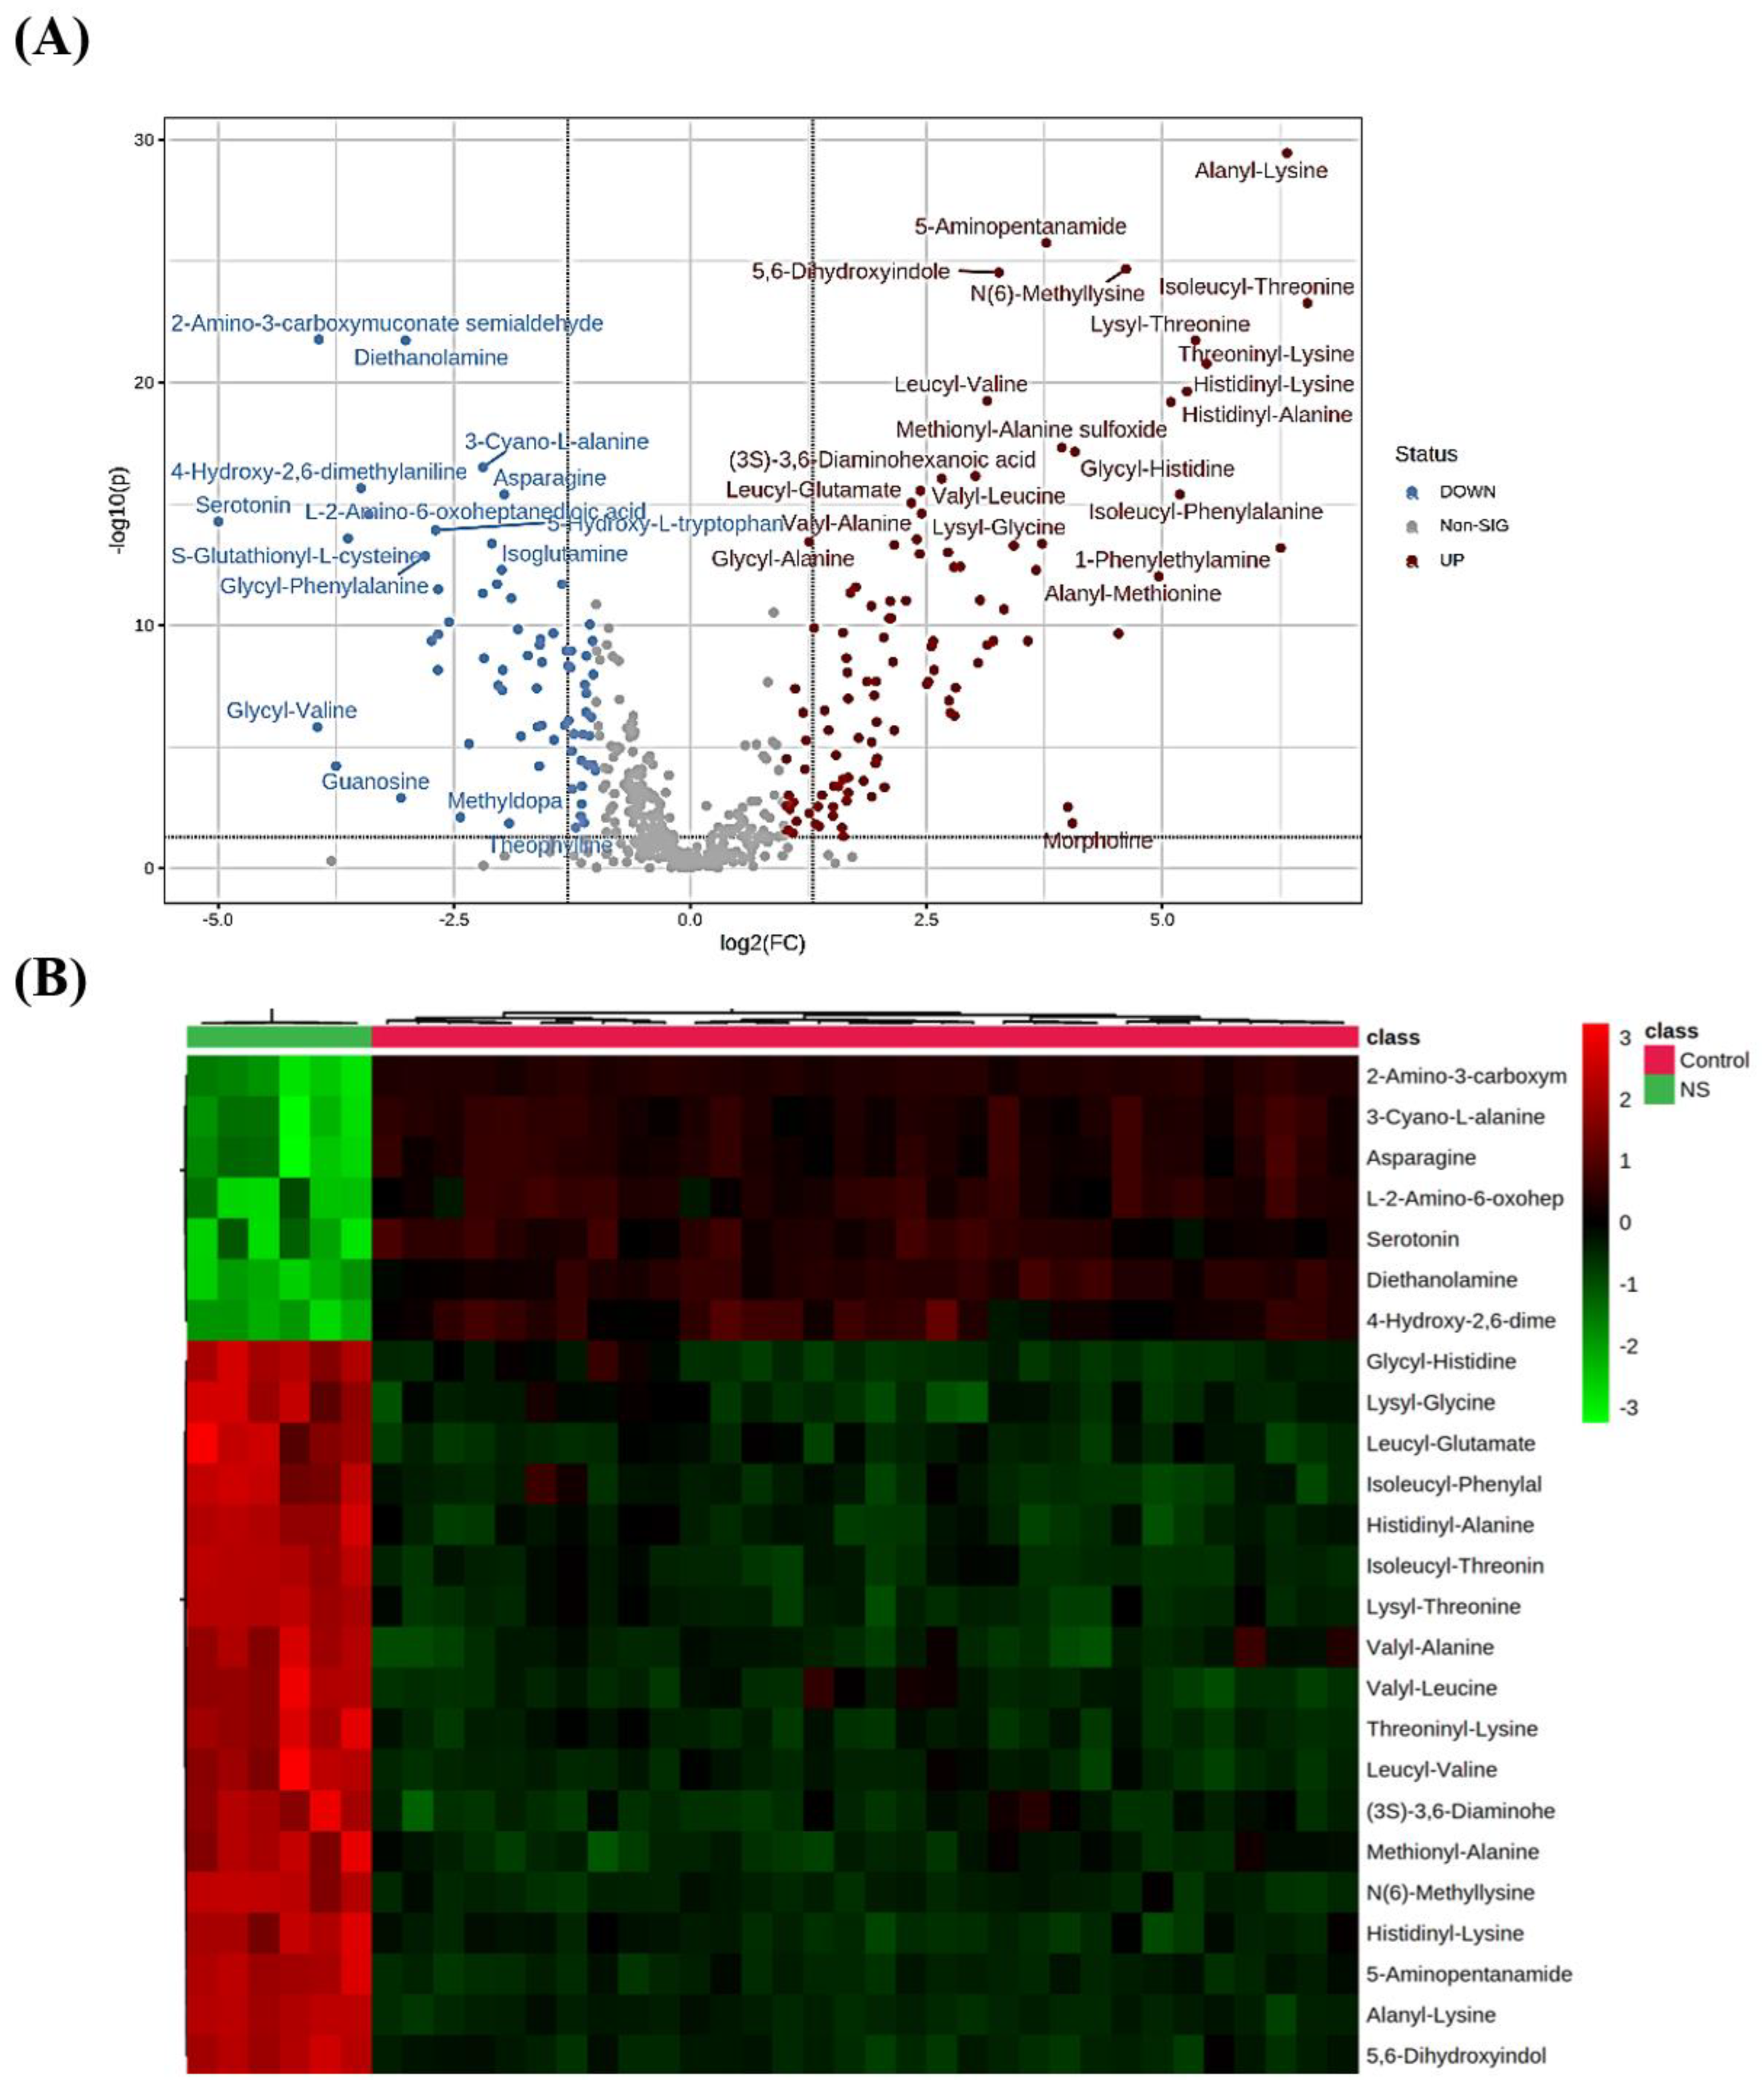
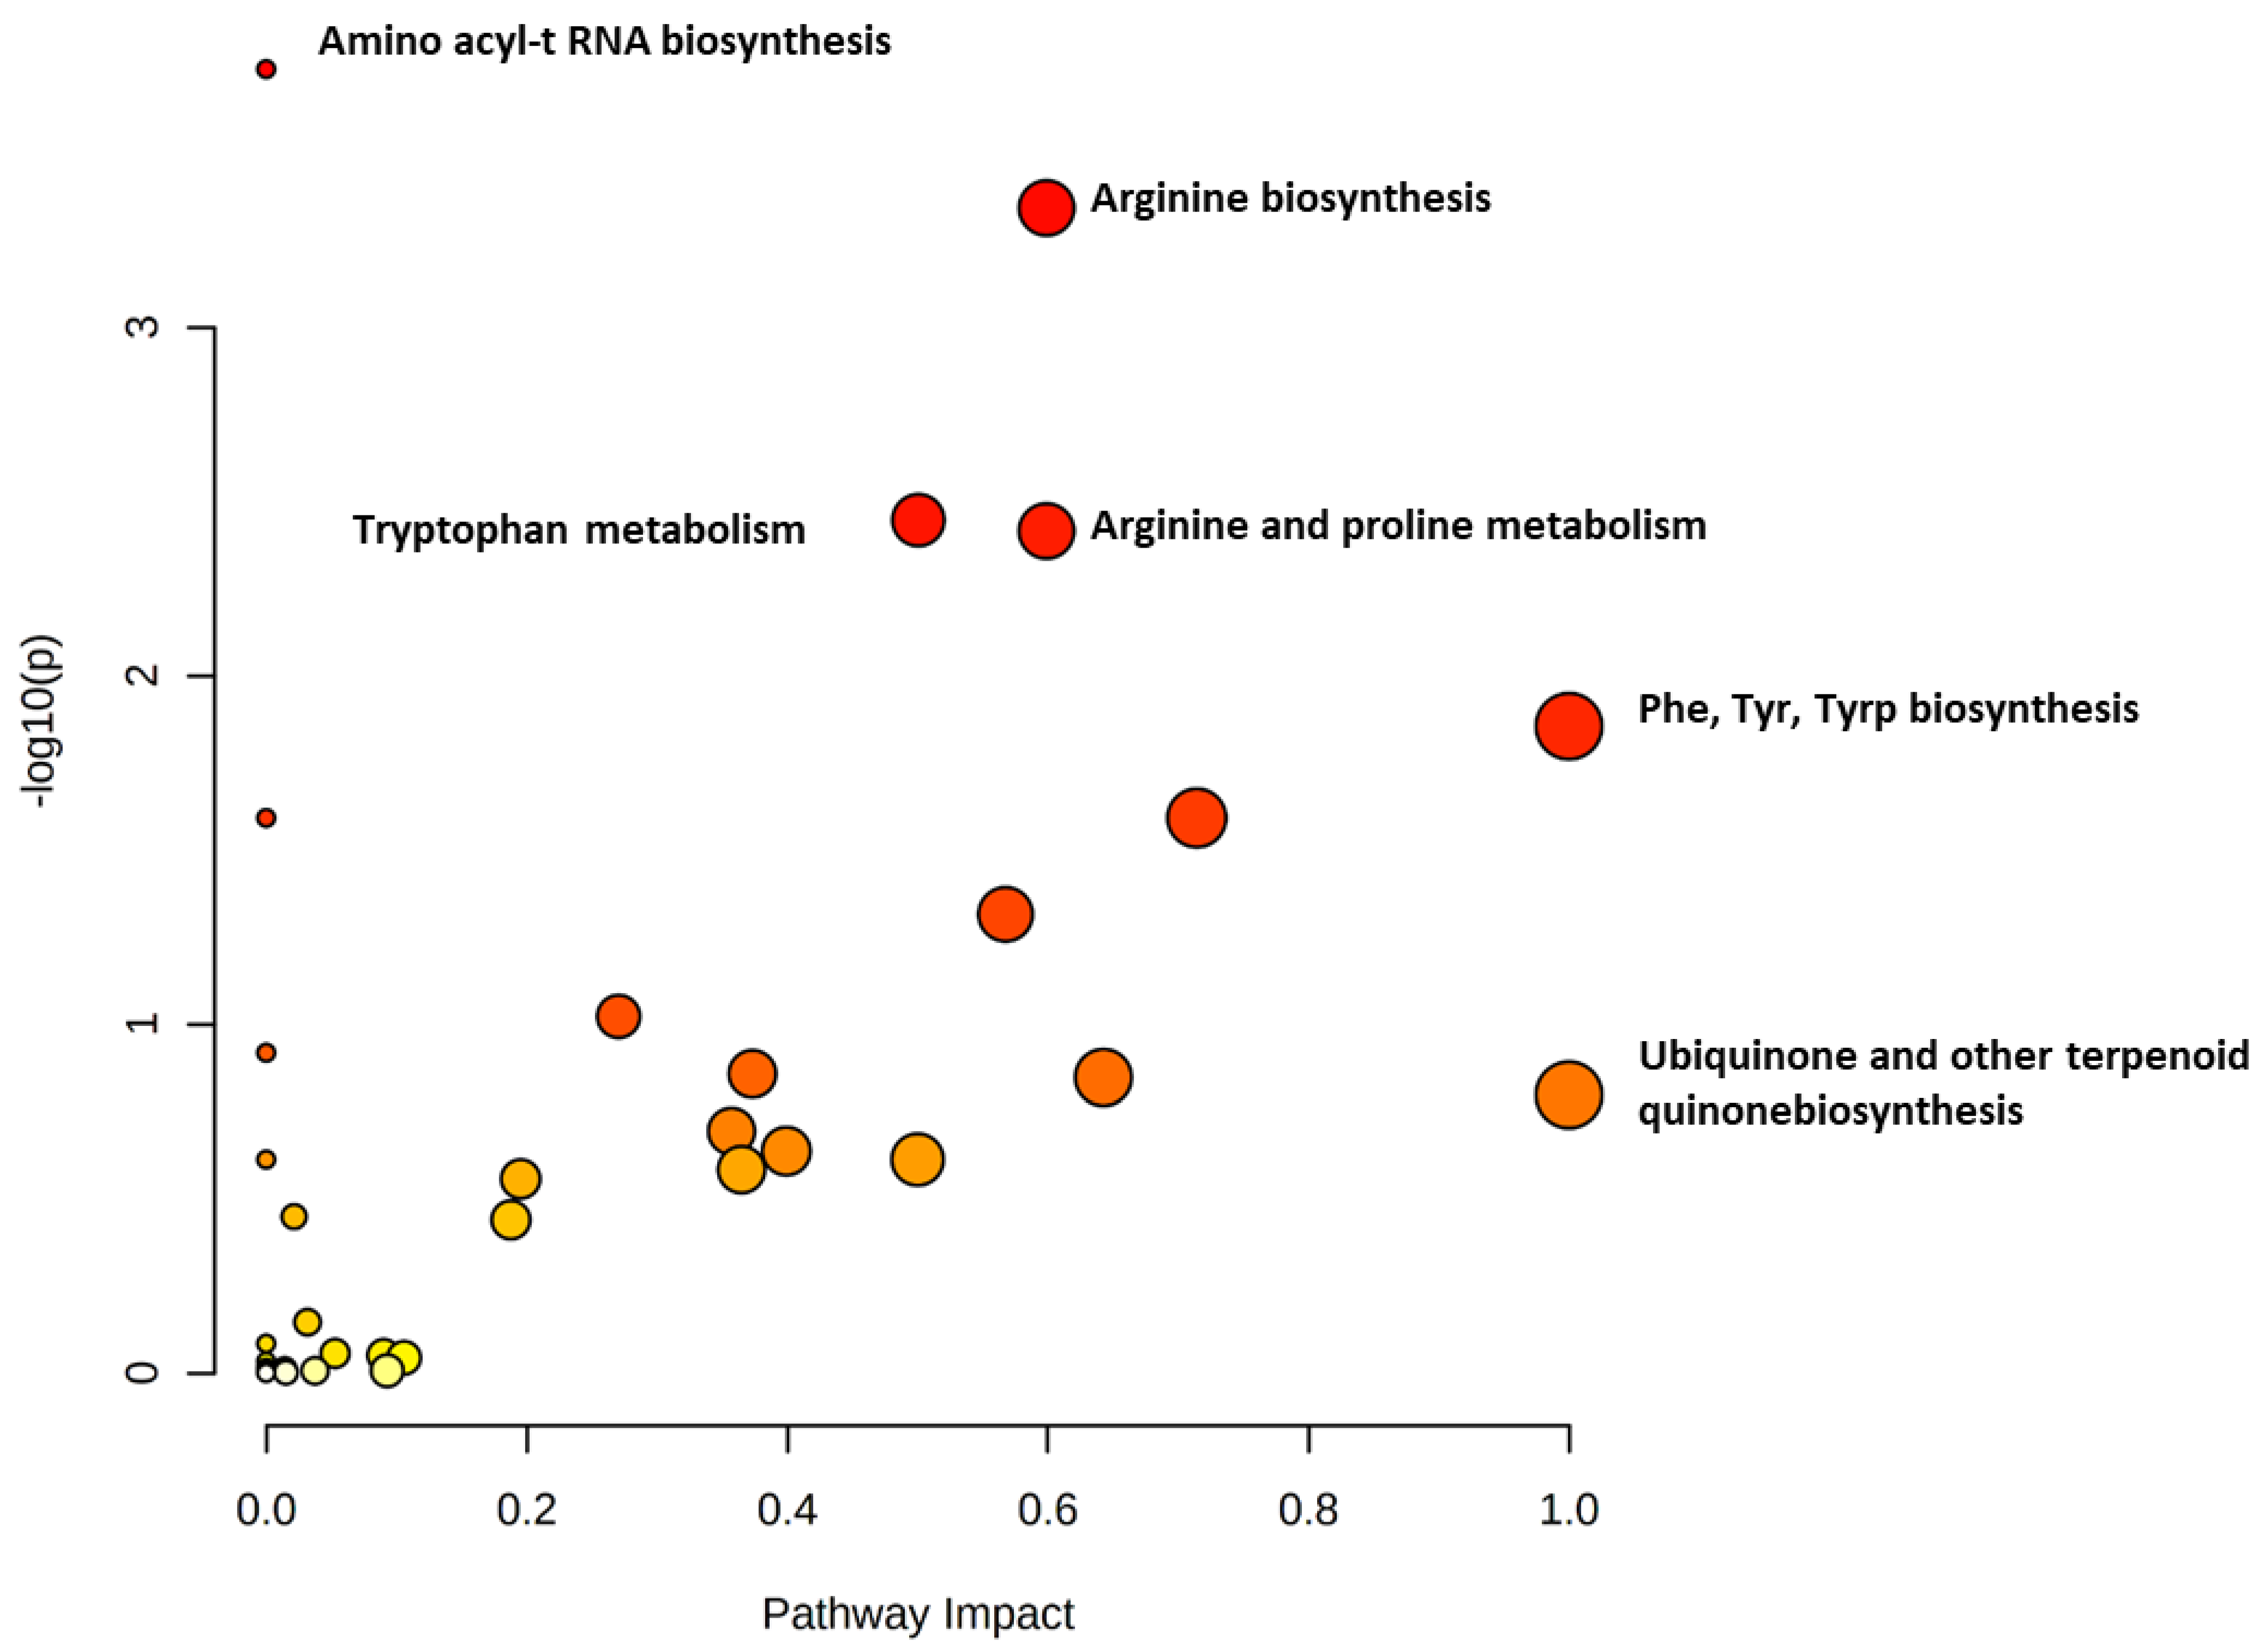
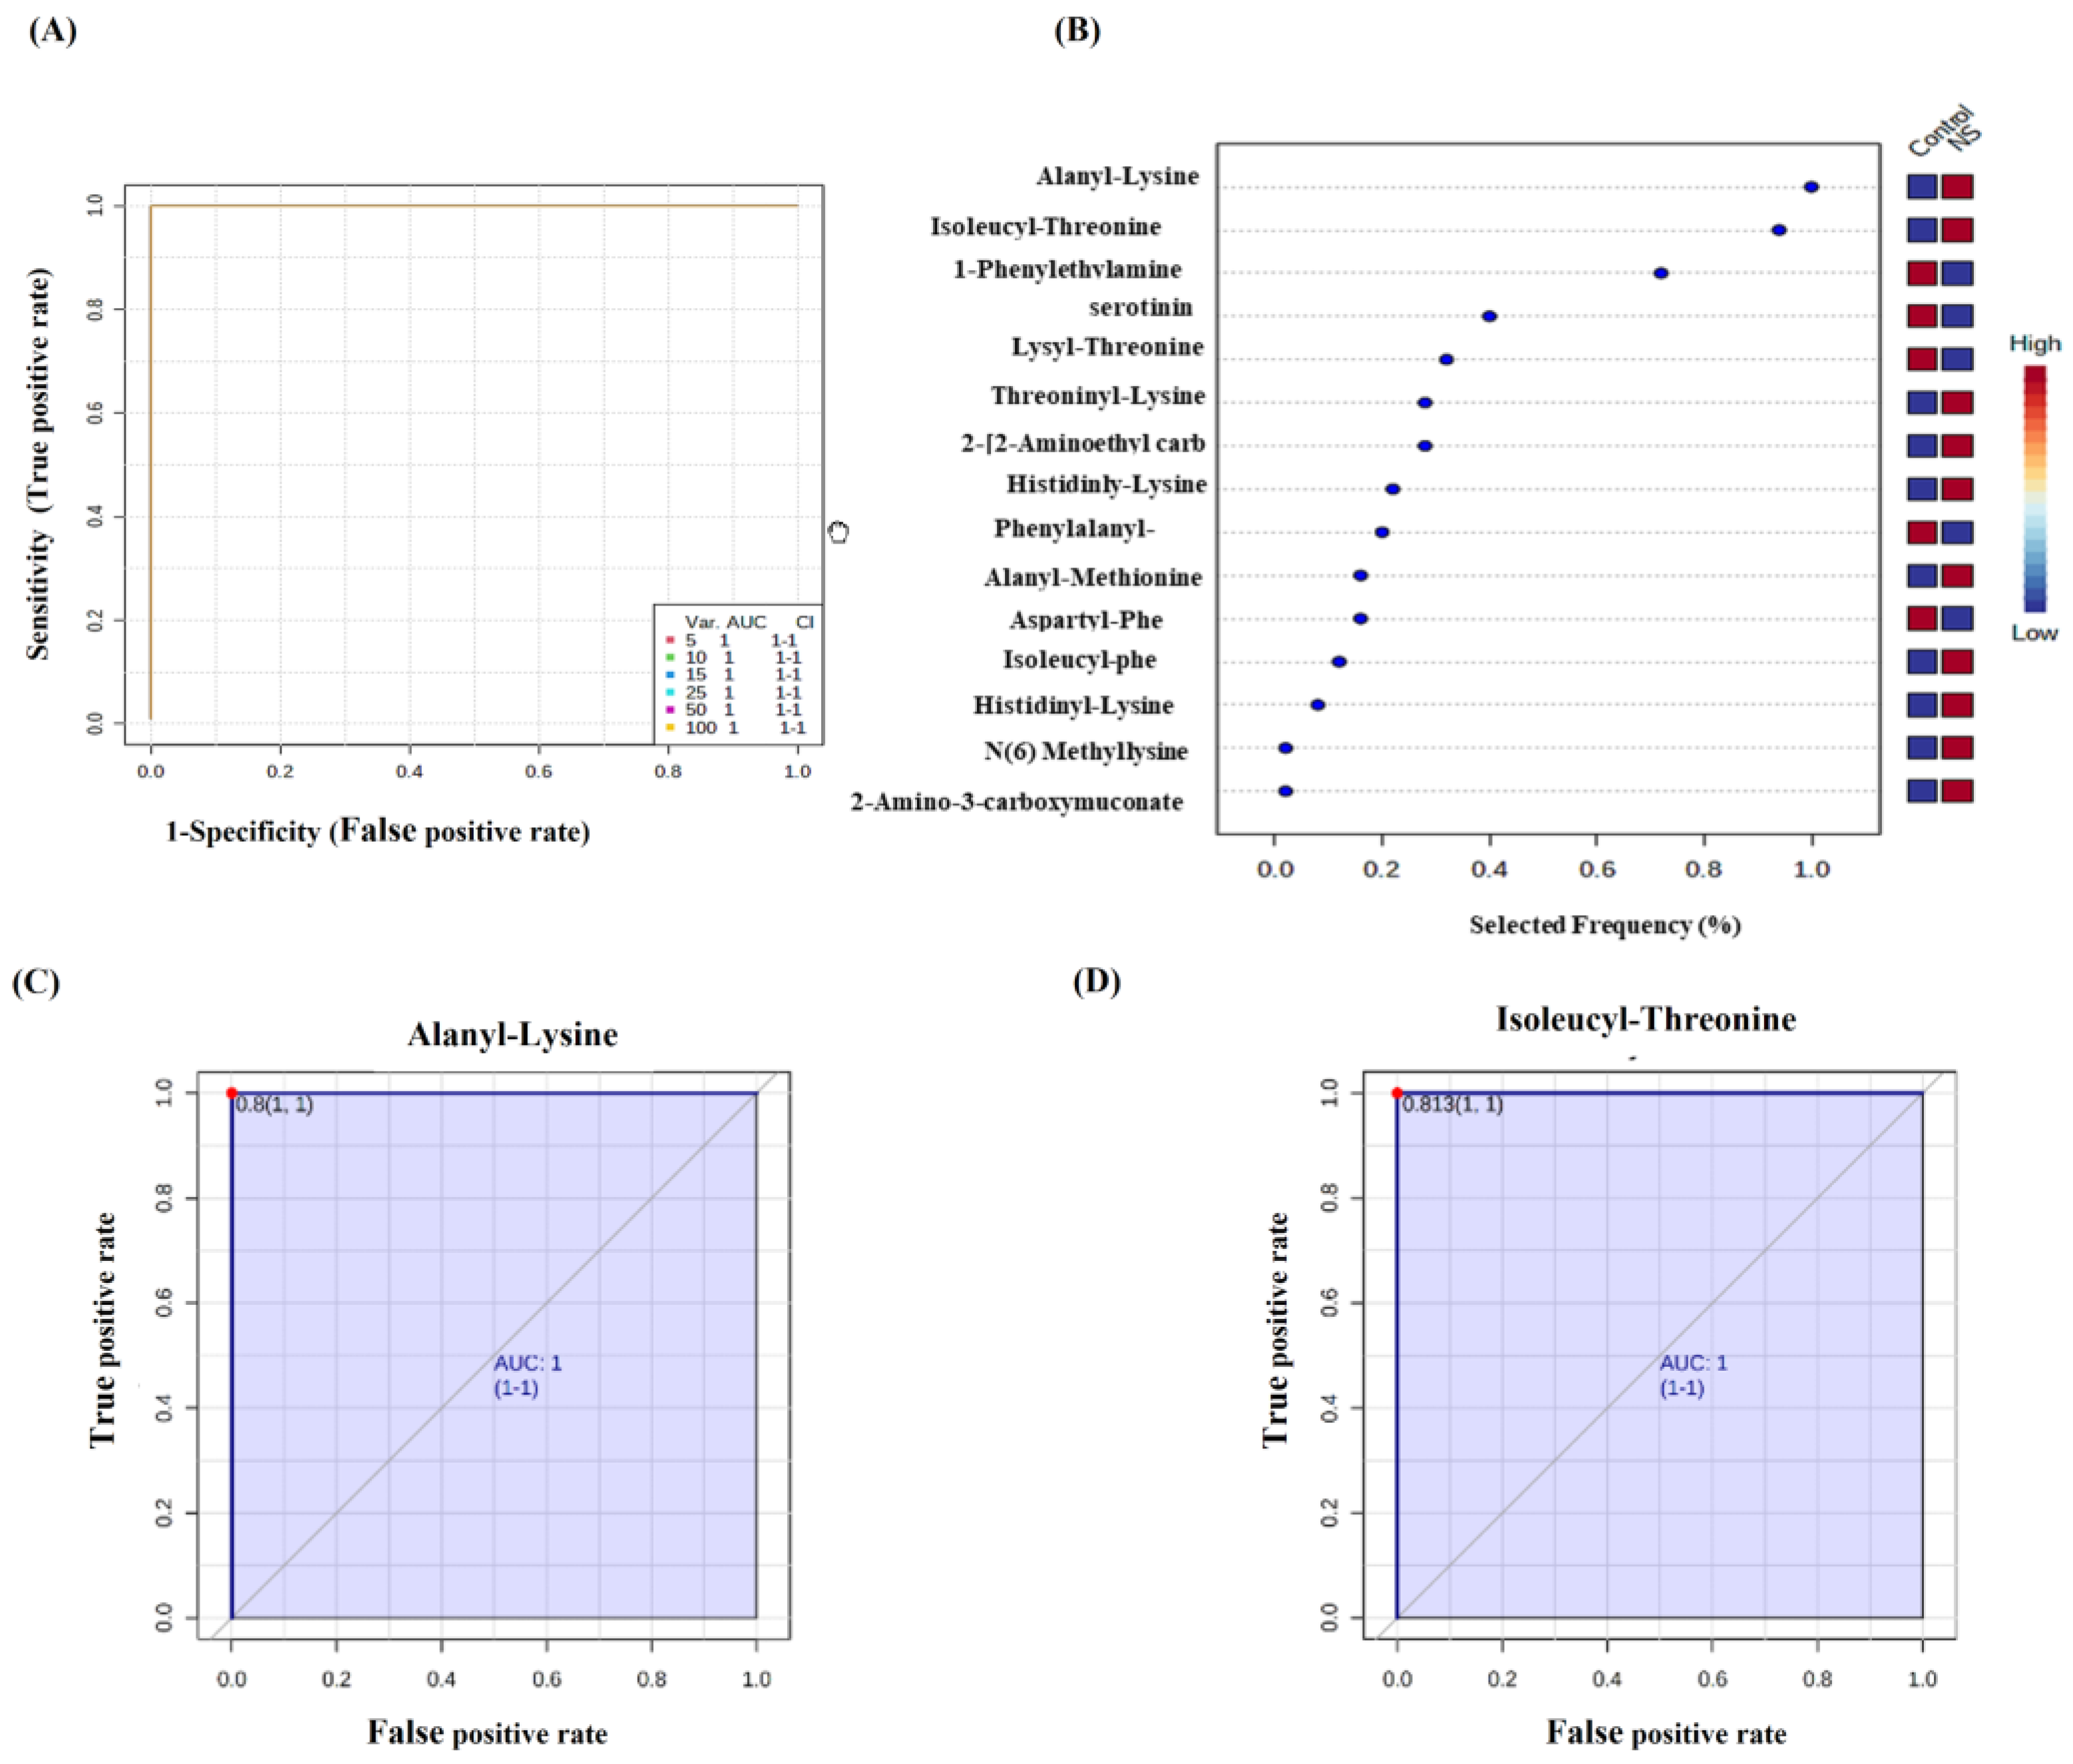
2.2. Metabolomics Profiling for NS Compared to Control

Univariate and multivariate analyses were used to explore significantly altered metabolites in serum between NS and control. An overview of the datasets using OPLS-DA multivariate analysis revealed a clear clustering and separation between NS and control groups, reflecting significant metabolic changes in NS patients compared to healthy controls (Figure 1A). Moreover, the OPLS-DA model yielded satisfactory R2 = 0.995 and Q2 = 0.979 values (Figure 1A). To identify the most important metabolites responsible for the class separation evident in the OPLS-DA scores plot, a loading plot was generated (Figure 1B). In comparison to the control group, the NS patients exhibited higher levels of alanyl-lysine, 5-aminopentanal, and N (6)-methyl-lysine as shown by the loading plot in Figure 1B. Whereas 2-amino-3-carboxymuconate semialdehyde and diethanolamine were decreased in NS compared with the control group.
Univariate analysis using a volcano plot was performed by applying a false discovery rate (FDR) and fold change (FC) thresholds of 0.05 and 2, respectively, to facilitate the screening of differential metabolites. As shown in Figure 2A, 105 and 71 metabolites were significantly up- and down-regulated, respectively. Similar to multivariate results, alanyl-lysine had the most significant increase in its level in NF compared to controls. Among the significantly increased metabolites in NS were 5-aminopentanal, 5,6-dihydroxyindole, and N6-methyl-lysine, while 2-aminopyridine-3-carbaldehyde and diethanolamine were among the significantly decreased metabolites in NS compared to control (Figure 2A).
A heat map visualization of the top 25 metabolites altered between NS and control groups is shown in Figure 2B. As noted, serotonin, asparagine, and diethanolamine were significantly decreased in NS compared to healthy controls. On the other hand, the level of lysyl-glycine, alanyl-lysine, and glycyl-alanine were significantly higher in NS.
Significantly altered metabolites were subjected to pathway analysis to identify significantly dysregulated pathways in NS. The pathway analysis identified amino acyl-t RNA and arginine biosynthesis pathways to be the most perturbed in NF compared to control cohorts, followed by different amino acid metabolism pathways, including arginine, tryptophan, and proline (Figure 3). These changes are represented by the circles (reflecting pathway impact) and size (statistical significance, p-value) in Figure 3.
Receiver operating characteristic (ROC) analysis was performed to identify metabolites that have the potential to act as potential biomarkers and to evaluate the diagnostic accuracy of these metabolites. PLS-DA was used as a classification and feature ranking approach to creating a multivariate exploratory ROC analysis. The top metabolites that displayed high classification ability were alanyl-lysine, isoleucyl-threonine, 1-phenylethylamine, serotonin, lysyl-threonine, and threonine-lysine (Figure 4B). Figure 4A shows that the top five metabolites in the exploratory ROC curve had an area under the curve (AUC) of 1. Two metabolites, alanyl-lysine, and isoleucyl-threonine, were up-regulated in NS compared to control with an AUC of 1 (Figure 4C) and (Figure 4D), respectively, showing the highest discriminatory power.
Data were normalized, transformed, and scaled by median log and Pareto scaling to make sure all the data were under Gaussian distribution.

3. Discussion

NS has emerged as one of the most prevalent primary kidney disorders, and its progressive forms are associated with an increased risk of developing chronic renal disease (CKD) [23]. Additionally, NS is a diverse condition that may have a variety of underlying causes; making a definitive diagnosis is often inaccurate, particularly in primary care settings [8,24]. Therefore, it is necessary to identify novel biomarkers to aid in early diagnosis and facilitate treatment and disease follow-up.
Despite the growing field of metabolomics as a promising technique to study disease for diagnostic and therapeutic purposes by measuring the overall expression of small molecules (<1500 Da) [25], few studies have focused on NS in humans [1,9]. We collected random samples, although there could be a very marginal effect of fasting on the metabolomics profile, this effect is not major and was normalized with the fold change filter [26]. Therefore, CIL LC–MS robust method for metabolomics biomarker discovery was applied, to identify the predictive biomarkers for NS based on the serum metabolite changes allowing the detection of very low abundant (pmol to fmol) metabolites and 13C-labeled pool served as an internal standard and compensated for the fluctuations in MS response.
3C-labeled metabolite and its corresponding 12C-labeled metabolite in a 12C-/13C-mixture were detected as peak pairs and their concentration was found based on the peak area ratio and these values were used to quantify the individual metabolite in the samples. Mass and retention time was matched with the labeled standard library for positive metabolite identification. Putative identification was achieved by matching the mass to the metabolites in HMDB, the mass accuracy tolerance window was set at 10 ppm [27].
In the present work, metabolomics analysis of NS has detected an alteration in the amino acids’ metabolic pathways including arginine, proline, and tryptophan metabolism; arginine, phenylalanine, tyrosine, and tryptophan biosynthesis. These results are consistent with the well-known dysregulation of protein anabolism and catabolism in NS patients [28,29]. Moreover, inadequate protein intake and amino acid depletion are associated with NS [28]. The metabolites of amino acids are linked with the pathogenesis of NS [30,31]. Metabolites of tryptophan, such as 3-indoxyl sulfate, are associated with a substantial decrease in eGFR [31]. Tryptophan is converted to niacin and quinolone through the kynurenine pathway, and this pathway is activated in renal insufficiency and CKD [32]. Furthermore, 2-amino-3-carboxymuconate semialdehyde is an intermediate in the metabolism of tryptophan in the tryptophan-niacin catabolic pathway is decreased in renal diseases as reported in our study [21]. Consistent with our findings, Zhang et al. reported that arginine and proline metabolism were among the metabolic pathways perturbed in primary nephrotic syndrome (PNS) patients [33]. In addition, PNS had decreased tryptophan and increased arginine level [33]. Shouman et al. reported that nitric oxide (NO) synthesized in the body from arginine by the enzyme nitric oxide synthase (NOS) might be involved in the pathogenesis of NS and its complications [30].
One of the metabolic processes that is dramatically altered between NS and healthy control is the aminoacyl-tRNA biosynthesis pathway. During translation, which is the most important step of protein formation, aminoacyl-tRNA plays an essential role as substrates bind that bind to an amino acid by an aminoacyl-tRNA synthetase. The alteration in aminoacyl-tRNA in our study is consistent with previous findings related to kidney diseases [21,34].
The N6-methyllysine level was significantly higher in NS than in control herein. The L-lysine derivative known as N6-methyl-L-lysine has a methyl group replacing one of the hydrogens on the N6 carbon atom that occur in certain muscle proteins [35,36]. The elevation of L-lysine derivative in the blood of patients with NS is associated with a hypercatabolic state expressed as an exacerbated degradation of muscle mass [37]. Moreover, our result showed an elevated level of 5-aminopentanamide in patients with NS, a product of the decarboxylation of lysine [38]. Our research is the first to report the increase in 5-aminopentanamide level in NS which may be linked to changes in kidney function and the hypercatabolic state in NS [39,40].
The metabolite 5,6-dihydroxyindole significantly increased in the NS group, is the first product of dopamine oxidation. Dopamine oxidation has been reported to play a role in the decline of proximal tubular mitochondrial and lysosomal function as well as in renal inflammation [41]. The previous might explain the higher level of 5,6-dihydroxyindole in NS.
In our study, alanyl-lysine, and isoleucyl-threonine had the highest discrimination ability between NS and the control group. These metabolites are dipeptides composed of two amino acids joined by peptide bonds resulted from an incomplete breakdown product of protein digestion or protein catabolism [42]. These dipeptides are considered secondary metabolites which are not directly involved in primary metabolic processes but arise from the incomplete metabolism of the secondary metabolites [43]. Patients with NS often have a predominant state in their bodies that is characterized by faster catabolism, increased protein intake, and loss, as well as malnutrition [44]. As the illness advances, these symptoms are accompanied by inflammatory hypoproteinemia and hyperlipidemia [45]. In addition, patients with kidney diseases have higher plasma levels of numerous products derived from amino acids and proteins, which are principally caused by reduced urine clearance by the kidney [46]. To the best of our knowledge, the dipeptide isoleucyl-threonine has been identified in human biofluids for the first time, which can serve as a potential diagnostic biomarker for NS.
This study has some limitations, for instance, the small sample size and the absence of a separate external validation cohort. However, our study is one of the few papers identifying several specific metabolite differences between NS and healthy control. Certainly, our results represent the starting point for more in-depth studies.

4. Materials and Methods

4.1. Chemicals

The LC–MS grade reagents, including water, acetonitrile (ACN), methanol, and formic acid, were purchased from Fisher Scientific (Ottawa, ON, Canada), and 13C-dansyl chloride was available from the University of Alberta (http://mcid.chem.ualberta.ca (accessed on 19 January 2020)) as described earlier [47].

4.2. Characteristics of the Study Population

Blood samples were collected in plain tubes (Vacutainer, BD Biosciences, San Jose, CA, USA) from 6 patients with clinically confirmed NS from the Renal clinics at King Faisal Specialist Hospital and Research center (KFSHRC) from 2018–2020. The blood samples were centrifuged to obtain serum and stored at −80 °C for metabolomics analysis. Our Inclusion criteria included healthy controls (n = 33) who visited the clinic for routine clinical care and were free of any kidney diseases were recruited to participate in this study, along with the above mentioned 6 confirmed NS patients. A baseline questionnaire was also collected, including the clinical symptoms, laboratory findings, (creatinine, urea, and proteinuria levels), allergies, and family history. Patients who were enrolled in other clinical studies, those who were unwilling to provide informed consent, and whose sample amount was insufficient were excluded from the arm of this study. The protocol was revised and approved by the Research Ethics committee at KFSHRC (project #2160027).

4.3. CIL LC–MS Metabolomics Profiling

Serum samples were labeled by 12C dansyl-chloride (DnsCl), while a pooled sample was generated by mixing all individual samples and then labeled by 13C-DnsCl to serve as a reference for all the 12C-labeled individual samples, as described earlier [19].
Each sample was normalized before LC–MS analysis. LC–UV quantitation was performed to determine the total concentration of dansyl-labeled metabolites. Before injection onto LC–MS, each 12C-labeled sample was mixed with the same molar amount of the 13C-labeled pooled sample. All labeled metabolites were identified as peak pairs on mass spectra, and the peak area ratios were used for quantitative metabolomics analysis. Thermo Fisher Scientific Dionex Ultimate 3000 UHPLC System (Sunnyvale, CA, USA) linked to a Bruker Maxis II quadrupole, time-of-flight (Q-TOF) mass spectrometer (Bruker, Billerica, MA, USA) was used to analyze the serum samples. The LC column was an Agilent reversed-phase Eclipse Plus C18 column (2.1 mm × 10 cm, 1.8 μm particle size, 95 Å pore size), while the mobile phase A was 0.1% (v/v) formic acid in 5% (v/v) ACN, and solvent B was 0.1% (v/v) formic acid in acetonitrile. The LC gradient was as follows: t = 0 min, 20% B; t = 3.5 min, 35% B; t = 18 min, 65% B; t = 21 min, 99% B; t = 34 min, 99% B, with a flow rate of 0.18 mL/min. The MS conditions were as follows: polarity, positive; dry temperature, 230 °C; dry gas, 8 L/min; capillary voltage, 4500 V; nebulizer, 1.0 bar; endplate offset, 500 V; spectra rate, 1.0 Hz.

4.4. Data Processing and Statistical Analysis

Bruker Daltonics Data Analysis 4.3 software was used for metabolomics profiling. IsoMs extracted the peak pairs after filtering out the redundant peak pairs, and data were aligned based on accurate mass and retention times [48]. A univariate analysis was performed to identify the significantly differentially expressed metabolites (fold-change of greater than 1.5 or less than 0.67 with q-value (false discovery rate) less than 0.05). The principal component analysis (PCA) and partial least squares discriminant analysis (PLS-DA) plots were performed using Iso MS Pro. (NovaMT Inc.). The metabolites were positively identified by searching against DnsID Library (www.mycompoundid.org) using retention time and accurate mass [49]. MyCompoundID library, which contains 8021 known human metabolites and 375,809 predicted metabolites (www.mycompoundid.org (19 January 2020)) was used for putative identification [50].
The raw data from the metabolomics experiments were statistically analyzed using MetaboAnalyst software version 5.0 (McGill University, Montreal, QC, Canada). Data were normalized, and the total sample median was used for normal distribution evaluation. Log transformation was used to adjust the sample differences, and Pareto scaling was performed for a comparative review of individual features. An FDR-corrected p-value < 0.05 was used and the values were reported as mean ± SEM. Supervised multiple regression analysis was performed to discriminate between two different datasets, and orthogonal partial least squares projection to latent structure discriminant analysis (OPLS-DA) was generated as part of the chemometric analysis [51]. The receiver operating characteristic (ROC) curves were constructed using the PLS-DA method for global analysis.

5. Conclusions

We created an untargeted metabolomics profile for patients with NS by using a chemical isotope-labeled mass spectrometry-based metabolomics technique. Metabolomic analysis between NS and control groups identified several dysregulated metabolites (105 and 71 were significantly up- and down-regulated, respectively, in NS compared to control). The altered metabolites related to arginine, proline, and tryptophan metabolism, arginine, phenylalanine, tyrosine, and tryptophan biosynthesis. Two metabolites, alanyl-lysine, and isoleucyl-threonine had the highest discrimination between NS and the healthy group. Moreover, our results showed novel potential biomarkers for NS, such as 5-aminopentanamide and isoleucyl-threonine. However, these biomarker panels have to be validated in a larger, multicenter trial before they can be used in clinical practice.

Author Contributions

Data curation, M.J., M.S.A., M.H. and K.M.S.; Formal analysis, M.J., R.M.N., M.S.A., E.M.S., L.A.D. and A.M.A.R.; Investigation, E.M.S., M.H. and A.M.A.R.; Methodology, A.M.A.R.; Project administration, A.M.A.R.; Resources, K.M.S.; Supervision, A.M.A.R.; Validation, M.M.A.-A.; Visualization, M.M.A.-A.; Writing—original draft, M.J. and R.M.N.; Writing—review & editing, M.J., R.M.N., M.S.A., E.M.S., M.H., K.M.S., L.A.D. and A.M.A.R. All authors have read and agreed to the published version of the manuscript.

Funding

Not applicable.

Institutional Review Board Statement

The study was conducted in accordance with the Declaration of Helsinki, and approved by the Research Ethics committee at KFSHRC (project #2160027).

Informed Consent Statement

Informed consent was obtained from all subjects involved in the study.

Data Availability Statement

Metabolomics data were deposited to the EMBL-EBI MetaboLights database with the identifier MTBLS6183. The complete dataset can be accessed at https://www.ebi.ac.uk/metabolights/ MTBLS6183 (accessed on 5 October 2022).

Acknowledgments

The authors extend their appreciation to the Researchers Supporting Project Number (RSP-2021/228), King Saud University, Riyadh Saudi Arabia.

Conflicts of Interest

The authors declare no conflict of interest.

References

  1. Gooding, J.R.; Agrawal, S.; McRitchie, S.; Acuff, Z.; Merchant, M.L.; Klein, J.B.; Smoyer, W.E.; Sumner, S.J.; Mahan, J.; Patel, H. Predicting and defining steroid resistance in pediatric nephrotic syndrome using plasma metabolomics. Kidney Int. Rep. 2020, 5, 81–93. [Google Scholar] [CrossRef] [PubMed] [Green Version]
  2. Wang, C.S.; Greenbaum, L.A. Nephrotic Syndrome. Pediatr. Clin. N. Am. 2019, 66, 73–85. [Google Scholar] [CrossRef] [PubMed]
  3. Larkins, N.G.; Liu, I.D.; Willis, N.S.; Craig, J.C.; Hodson, E.M. Non-corticosteroid immunosuppressive medications for steroid-sensitive nephrotic syndrome in children. Cochrane Database Syst. Rev. 2020, 4, CD002290. [Google Scholar] [CrossRef] [PubMed]
  4. Thalgahagoda, S.; Webb, N.J.; Roberts, D.; Birch, A.; Milford, D.V.; Tavakoli, A.; Shenoy, M. Successful ABO incompatible renal transplantation following rituximab and DFPP after failed immunoadsorption. Pediatr. Transplant. 2014, 18, E74–E76. [Google Scholar] [CrossRef] [PubMed]
  5. Feltran, L.S.; Watanabe, A.; Guaragna, M.S.; Machado, I.C.; Casimiro, F.M.; Neves, P.D.; Palma, L.M.; Varela, P.; Vaisbich, M.H.; Marie, S.K. Brazilian network of pediatric nephrotic syndrome (REBRASNI). Kidney Int. Rep. 2020, 5, 358–362. [Google Scholar] [CrossRef] [PubMed] [Green Version]
  6. Adams, D.; Tollinche, L.; Yeoh, C.; Artman, J.; Mehta, M.; Phillips, D.; Fischer, G.; Quinlan, J.; Sakai, T. Short-term safety and effectiveness of sugammadex for surgical patients with end-stage renal disease: A two-centre retrospective study. Anaesthesia 2020, 75, 348–352. [Google Scholar] [CrossRef]
  7. Kodner, C. Diagnosis and management of nephrotic syndrome in adults. Am. Fam. Phys. 2016, 93, 479–485. [Google Scholar]
  8. Stone, H.; Magella, B.; Bennett, M.R. The search for biomarkers to aid in diagnosis, differentiation, and prognosis of childhood idiopathic nephrotic syndrome. Front. Pediatr. 2019, 7, 404. [Google Scholar] [CrossRef]
  9. Guo, J.; Zhao, J.; Liu, R.; Yu, J.; Zhang, M.; Wang, H.; Liu, L. Metabolomics analysis of serum in pediatric nephrotic syndrome based on targeted and non-targeted platforms. Metabolomics 2021, 17, 38. [Google Scholar] [CrossRef]
  10. Gagnebin, Y.; Julien, B.; Belén, P.; Serge, R. Metabolomics in chronic kidney disease: Strategies for extended metabolome coverage. J. Pharm. Biomed. Anal. 2018, 161, 313–325. [Google Scholar] [CrossRef]
  11. Kalim, S.; Rhee, E.P. An overview of renal metabolomics. Kidney Int. 2017, 91, 61–69. [Google Scholar] [CrossRef] [PubMed]
  12. Xu, H.; Huang, X.; Ärnlöv, J.; Cederholm, T.; Stenvinkel, P.; Lindholm, B.; Risérus, U.; Carrero, J.J. Clinical correlates of insulin sensitivity and its association with mortality among men with CKD stages 3 and 4. Clin. J. Am. Soc. Nephrol. 2014, 9, 690–697. [Google Scholar] [CrossRef] [PubMed] [Green Version]
  13. Rhee, E.P. A Systems-Level View of Renal Metabolomics. Semin. Nephrol. 2018, 38, 142–150. [Google Scholar] [CrossRef] [PubMed]
  14. Abbiss, H.; Maker, G.L.; Trengove, R.D. Metabolomics approaches for the diagnosis and understanding of kidney diseases. Metabolites 2019, 9, 34. [Google Scholar] [CrossRef] [Green Version]
  15. Hao, X.; Liu, X.; Wang, W.; Ren, H.; Xie, J.; Shen, P.; Lin, D.; Chen, N. Distinct metabolic profile of primary focal segmental glomerulosclerosis revealed by NMR-based metabolomics. PLoS ONE 2013, 8, e78531. [Google Scholar] [CrossRef] [Green Version]
  16. Gao, X.; Chen, W.; Li, R.; Wang, M.; Chen, C.; Zeng, R.; Deng, Y. Systematic variations associated with renal disease uncovered by parallel metabolomics of urine and serum. BMC Syst. Biol. 2012, 6 (Suppl. 1), S14. [Google Scholar] [CrossRef] [Green Version]
  17. Jia, L.; Wang, C.; Zhao, S.; Lu, X.; Xu, G. Metabolomic identification of potential phospholipid biomarkers for chronic glomerulonephritis by using high performance liquid chromatography–mass spectrometry. J. Chromatogr. B 2007, 860, 134–140. [Google Scholar] [CrossRef]
  18. Lee, J.E.; Lee, Y.H.; Kim, S.Y.; Kim, Y.G.; Moon, J.Y.; Jeong, K.H.; Lee, T.W.; Ihm, C.G.; Kim, S.; Kim, K.H.; et al. Systematic biomarker discovery and coordinative validation for different primary nephrotic syndromes using gas chromatography-mass spectrometry. J. Chromatogr. A 2016, 1453, 105–115. [Google Scholar] [CrossRef]
  19. Guo, K.; Li, L. Differential 12C-/13C-isotope dansylation labeling and fast liquid chromatography/mass spectrometry for absolute and relative quantification of the metabolome. Anal. Chem. 2009, 81, 3919–3932. [Google Scholar] [CrossRef]
  20. Han, W.; Li, L. Chemical Isotope Labeling LC-MS for Human Blood Metabolome Analysis. Methods Mol. Biol. 2018, 1730, 213–225. [Google Scholar] [CrossRef]
  21. Sriwi, D.; Alabdaljabar, M.S.; Jacob, M.; Mujamammi, A.H.; Gu, X.; Sabi, E.M.; Li, L.; Hussein, M.H.; Dasouki, M.; Abdel Rahman, A.M. Metabolomics Profiling of Cystic Renal Disease towards Biomarker Discovery. Biology 2021, 10, 770. [Google Scholar] [CrossRef] [PubMed]
  22. Polanco, N.; Gutiérrez, E.; Covarsí, A.; Ariza, F.; Carreño, A.; Vigil, A.; Baltar, J.; Fernández-Fresnedo, G.; Martín, C.; Pons, S.; et al. Spontaneous remission of nephrotic syndrome in idiopathic membranous nephropathy. J. Am. Soc. Nephrol. JASN 2010, 21, 697–704. [Google Scholar] [CrossRef] [PubMed] [Green Version]
  23. Hilmanto, D.; Mawardi, F.; Lestari, A.S.; Widiasta, A. Disease-Associated Systemic Complications in Childhood Nephrotic Syndrome: A Systematic Review. Int. J. Nephrol. Renov. Dis. 2022, 15, 53–62. [Google Scholar] [CrossRef] [PubMed]
  24. Hollis, A.; Dart, A.; Morgan, C.; Mammen, C.; Zappitelli, M.; Chanchlani, R.; Samuel, S. Delays in diagnosis of nephrotic syndrome in children: A survey study. Paediatr. Child Health 2019, 24, 258–262. [Google Scholar] [CrossRef] [PubMed] [Green Version]
  25. Jacob, M.; Lopata, A.L.; Dasouki, M.; Abdel Rahman, A.M. Metabolomics toward personalized medicine. Mass Spectrom. Rev. 2019, 38, 221–238. [Google Scholar] [CrossRef]
  26. Frank, J.; Gupta, A.; Osadchiy, V.; Mayer, E.A. Brain-Gut-Microbiome Interactions and Intermittent Fasting in Obesity. Nutrients 2021, 13, 584. [Google Scholar] [CrossRef]
  27. Zhou, R.; Tseng, C.L.; Huan, T.; Li, L. IsoMS: Automated processing of LC-MS data generated by a chemical isotope labeling metabolomics platform. Anal. Chem. 2014, 86, 4675–4679. [Google Scholar] [CrossRef]
  28. Matyjek, A.; Literacki, S.; Niemczyk, S.; Rymarz, A. Protein energy-wasting associated with nephrotic syndrome—The comparison of metabolic pattern in severe nephrosis to different stages of chronic kidney disease. BMC Nephrol. 2020, 21, 346. [Google Scholar] [CrossRef]
  29. Zanetti, M.; Barazzoni, R.; Garibotto, G.; Davanzo, G.; Gabelli, C.; Kiwanuka, E.; Piccoli, A.; Tosolini, M.; Tessari, P. Plasma protein synthesis in patients with low-grade nephrotic proteinuria. Am. J. Physiol. Endocrinol. Metab. 2001, 280, E591–E597. [Google Scholar] [CrossRef] [Green Version]
  30. Shouman, M.; Abdallah, N.; El Tablawy, N.; Rashed, L. Biochemical markers of endothelial dysfunction in pediatric nephrotic syndrome. Arch. Med. Sci. 2009, 5, 415–421. [Google Scholar]
  31. Hocher, B.; Adamski, J. Metabolomics for clinical use and research in chronic kidney disease. Nat. Rev. Nephrol. 2017, 13, 269–284. [Google Scholar] [CrossRef] [PubMed]
  32. Schefold, J.C.; Zeden, J.-P.; Fotopoulou, C.; von Haehling, S.; Pschowski, R.; Hasper, D.; Volk, H.-D.; Schuett, C.; Reinke, P. Increased indoleamine 2, 3-dioxygenase (IDO) activity and elevated serum levels of tryptophan catabolites in patients with chronic kidney disease: A possible link between chronic inflammation and uraemic symptoms. Nephrol. Dial. Transplant. 2009, 24, 1901–1908. [Google Scholar] [CrossRef] [PubMed]
  33. Zhang, X.; LI, J.; Qiao, S.; Xia, Y.; Tang, F. Application of metabolomics in establishing primary nephrotic syndrome diagnosis model. Chin. J. Nephrol. 2016, 32, 334–338. [Google Scholar]
  34. Hu, X.; Ouyang, S.; Xie, Y.; Gong, Z.; Du, J. Characterizing the gut microbiota in patients with chronic kidney disease. Postgrad. Med. 2020, 132, 495–505. [Google Scholar] [CrossRef]
  35. National Center for Biotechnology Information. N(6)-Methyllysine. Available online: https://pubchem.ncbi.nlm.nih.gov/compound/N_6_-Methyllysine (accessed on 12 August 2022.).
  36. Di Blasi, R.; Blyuss, O.; Timms, J.F.; Conole, D.; Ceroni, F.; Whitwell, H.J. Non-histone protein methylation: Biological significance and bioengineering potential. ACS Chem. Biol. 2021, 16, 238–250. [Google Scholar] [CrossRef]
  37. Kaysen, G.; Carstensen, A.; Martin, V. Muscle protein synthesis is impaired in nephrotic rats. Miner. Electrolyte Metab. 1992, 18, 228–232. [Google Scholar]
  38. Trisrivirat, D.; Lawan, N.; Chenprakhon, P.; Matsui, D.; Asano, Y.; Chaiyen, P. Mechanistic insights into the dual activities of the single active site of l-lysine oxidase/monooxygenase from Pseudomonas sp. AIU 813. J. Biol. Chem. 2020, 295, 11246–11261. [Google Scholar] [CrossRef]
  39. Demir, S.; Kaplan, O.; Celebier, M.; Sag, E.; Bilginer, Y.; Lay, I.; Ozen, S. Predictive biomarkers of IgA vasculitis with nephritis by metabolomic analysis. Semin. Arthritis Rheum. 2020, 50, 1238–1244. [Google Scholar] [CrossRef]
  40. Lee, H.; Jang, H.B.; Yoo, M.G.; Park, S.I.; Lee, H.J. Amino Acid Metabolites Associated with Chronic Kidney Disease: An Eight-Year Follow-Up Korean Epidemiology Study. Biomedicines 2020, 8, 222. [Google Scholar] [CrossRef]
  41. Banday, A.A.; Lokhandwala, M.F. Renal dopamine oxidation and inflammation in high salt fed rats. J. Am. Heart Assoc. 2020, 9, e014977. [Google Scholar] [CrossRef]
  42. Stolzenberg-Solomon, R.; Derkach, A.; Moore, S.; Weinstein, S.J.; Albanes, D.; Sampson, J. Associations between metabolites and pancreatic cancer risk in a large prospective epidemiological study. Gut 2020, 69, 2008–2015. [Google Scholar] [CrossRef] [PubMed]
  43. Wishart, D.S.; Guo, A.; Oler, E.; Wang, F.; Anjum, A.; Peters, H.; Dizon, R.; Sayeeda, Z.; Tian, S.; Lee, B.L.; et al. HMDB 5.0: The Human Metabolome Database for 2022. Nucleic Acids Res. 2021, 50, D622–D631. [Google Scholar] [CrossRef] [PubMed]
  44. Fragiadaki, M.; Lannoy, M.; Themanns, M.; Maurer, B.; Leonhard, W.N.; Peters, D.J.; Moriggl, R.; Ong, A.C. STAT5 drives abnormal proliferation in autosomal dominant polycystic kidney disease. Kidney Int. 2017, 91, 575–586. [Google Scholar] [CrossRef] [PubMed] [Green Version]
  45. Greenbaum, L.A.; Benndorf, R.; Smoyer, W.E. Childhood nephrotic syndrome—Current and future therapies. Nat. Rev. Nephrol. 2012, 8, 445–458. [Google Scholar] [CrossRef]
  46. Lim, V.S.; Kopple, J.D. Protein metabolism in patients with chronic renal failure: Role of uremia and dialysis. Kidney Int. 2000, 58, 1–10. [Google Scholar] [CrossRef] [Green Version]
  47. Jacob, M.; Gu, X.; Luo, X.; Al-Mousa, H.; Arnaout, R.; Al-Saud, B.; Lopata, A.L.; Li, L.; Dasouki, M.; Rahman, A.M.A. Metabolomics distinguishes DOCK8 deficiency from atopic dermatitis: A Biomarker discovery. Front. Immunol. 2019, 9, 274. [Google Scholar] [CrossRef] [Green Version]
  48. Goedert, J.J.; Sampson, J.N.; Moore, S.C.; Xiao, Q.; Xiong, X.; Hayes, R.B.; Ahn, J.; Shi, J.; Sinha, R. Fecal metabolomics: Assay performance and association with colorectal cancer. Carcinogenesis 2014, 35, 2089–2096. [Google Scholar] [CrossRef] [Green Version]
  49. Brown, D.G.; Rao, S.; Weir, T.L.; O’Malia, J.; Bazan, M.; Brown, R.J.; Ryan, E.P. Metabolomics and metabolic pathway networks from human colorectal cancers, adjacent mucosa, and stool. Cancer Metab. 2016, 4, 11. [Google Scholar] [CrossRef] [Green Version]
  50. Platten, M.; Nollen, E.A.A.; Röhrig, U.F.; Fallarino, F.; Opitz, C.A. Tryptophan metabolism as a common therapeutic target in cancer, neurodegeneration and beyond. Nat. Rev. Drug Discov. 2019, 18, 379–401. [Google Scholar] [CrossRef]
  51. Xia, J.; Psychogios, N.; Young, N.; Wishart, D.S. MetaboAnalyst: A web server for metabolomic data analysis and interpretation. Nucleic Acids Res. 2009, 37, W652–W660. [Google Scholar] [CrossRef]
Figure 1. (A) Orthogonal partial least square discriminant analysis (OPLS-DA) score plot shows clear clustering and separation between patients with NS (n = 6) and healthy control (n = 33) representing the level of global metabolic differential expressions in NS compared to control. (B) The loading plot shows the regulation of metabolic expression of metabolites between NS and control.
Ijms 23 12614 g001
Figure 2. Binary comparison for serum samples of patients with NS and healthy controls. (A) Dysregulated metabolites between NS vs. control with fold change cut-off of 2 and false discovery rate (FDR) threshold of 0.05; up-regulated = 105 (red), down-regulated = 71 (blue). (B) Hierarchal clustering (HAC) and heat map analysis of the top 25 significantly altered metabolites between the two study groups; controls (red), and NS (green).
Ijms 23 12614 g002
Figure 3. Pathway analysis shows the altered pathways in NS including amino acid metabolism and ubiquinone biosynthesis. The node color and size of the circle reflect the p-value and the pathway impact value, respectively.
Ijms 23 12614 g003
Figure 4. Receiver operating characteristics (ROC) curve and loading Plots for significant metabolites in serum of patients with NS. (A) ROC was generated using the PLS-DA model showing area under the curve (AUC) for the top five variants = 1. (B) Frequency percentage plot of the altered metabolites in NS patients when compared with controls. (C) Alanyl-Lysine (AUC = 1) and (D) Isoleucyl-Threonine (AUC = 1) were up-regulated in NS patients when compared with control.
Ijms 23 12614 g004
Table 1. Clinical characteristics of NS patients.
PatientNS Phenotype/
Renal Disease
Age (Yrs)BMIBody Weight (Kg)SBP (mmHg)DBP (mmHg)eGFR
(>60 mL/min/
1.73 m2)
Serum Creatinine (64–115 μmol/L)Urea
(2.3–6.7 mmol/L)
Protein DipstickProtein Random Urine (g/L)Pr/Cr Random Urine Ratio (mg/mmol)
NS-1Congenital1514.629.513887N/A41212.83+1.52323.4
NS-2MCD, Relapsing3629.17211375>60654.4trace05.65
NS-3FSGS, Steroid-dependent1917.64513191>60574.62+0.4932.77
NS-4Steroid-dependent, FSGS + MCD1840.410612875>608714.23+4.26132.3
NS-5Steriod-dependent, MCD143783.313274N/A423.3Negative0.1710.69
NS-6Steriod-dependent, MCD143472.510862N/A985.22+0.69127.78
Average ± SEM 19.3 ± 3.4428.8 ± 4.3168.1 ± 11.14125 ± 4.8277.3 ± 4.23 126.8 ± 57.637.4 ± 1.95 1.2 ± 0.65105.4 ± 49.31
Abbreviations—MCD: minimal change disease, FSGS: focal segmental glomerulosclerosis, BMI: body mass index, SBP: systolic blood pressure, DBP: diastolic blood pressure, eGFR: estimated glomerular filtration rate. Data are presented as mean ± SEM.
Publisher’s Note: MDPI stays neutral with regard to jurisdictional claims in published maps and institutional affiliations.

